Sample: Public safety, Chicago: report
Project: Sample: Public safety, Chicago
Goal: Describe the project Sample: Public safety, Chicago: run the analyses that tell the most about its data, draw every result, and write a cited report.
Run: 2e6054ca-62f3-479f-b398-915fe26200ce (running, 19 agent run(s))
Generated: 2026-10-19T04:36:58Z, version 1
Model cost: USD 0.0000 over 0 model call(s)
Data used
| Data | Kind | Rows | Time span | Summary | Source |
|---|---|---|---|---|---|
| Incidents | vector, Point | 1,680 | 2025-10-01 to 2026-09-30 | 1,680 point features; dated by 'reported_at' from 2025-10-01 to 2026-09-30; 'category' has 7 values (top: theft 539, battery 286, criminal damage 207); 'location_type' has 6 values (top: street 626, residence 351, business 274); 'severity' 1 to 5 (mean 2.587); extent -87.6800,41.8566 to -87.6078,41.9016. Dated point events by category: where and when Incidents happen. | 2 |
| Street light outages | vector, Point | 420 | 2025-10-01 to 2026-09-30 | 420 point features; dated by 'reported_at' from 2025-10-01 to 2026-09-30; 'cause' has 4 values (top: lamp failure 209, cable fault 100, vandalism 64); 'days_out' 1 to 60 (mean 6.95); extent -87.6803,41.8565 to -87.6125,41.9013. Dated point events by cause: where and when Street light outages happen. | 3 |
| Patrol beats | vector, Polygon | 16 | 16 polygon (area) features; 'district' has 1 values (top: District 12 16); 'population' 11,440 to 33,436 (mean 2.514e+04); 'officers_assigned' 6 to 12 (mean 9.75); named by 'name' (e.g. North River Beat, Market West Beat, Station Quarter Beat); total area 30.02 km2; extent -87.6804,41.8563 to -87.6076,41.9017. Areas (Patrol beats) with population to compare and map. | 145 | |
| Police stations | vector, Point | 3 | 3 point features; 'open_24h' has 2 values (top: False 2, True 1); 'officers' 97 to 139 (mean 124.7); named by 'name' (e.g. Central District Station, Westside Station, Riverside Station); extent -87.6671,41.8744 to -87.6210,41.8881. Point locations of Police stations by open_24h. | 146 | |
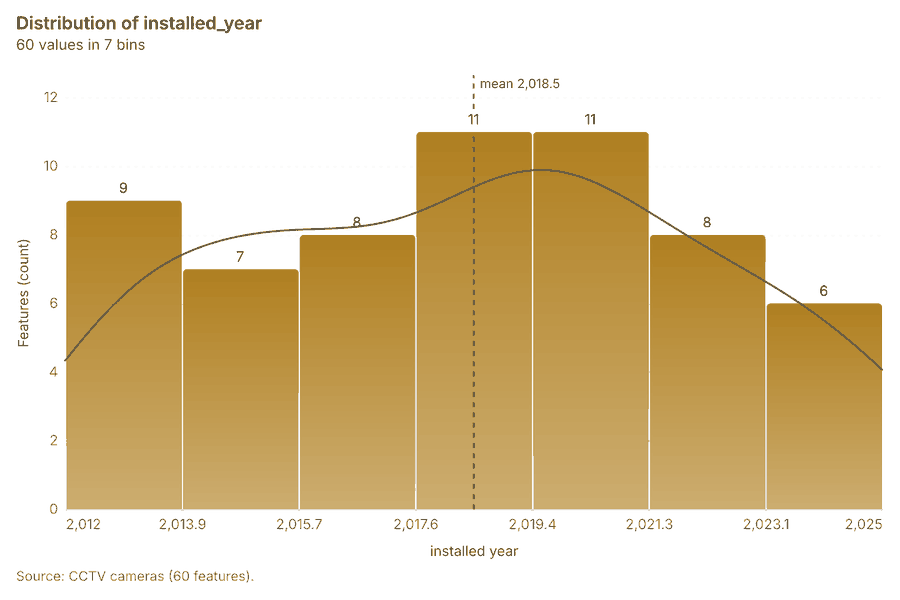
| CCTV cameras | vector, Point | 60 | 60 point features; 'ptz' has 2 values (top: False 41, True 19); 'status' has 2 values (top: live 45, fault 15); 'installed_year' 2,012 to 2,025 (mean 2018); extent -87.6796,41.8566 to -87.6139,41.9010. Point locations of CCTV cameras by ptz. | 147 | |
| Transit stops | vector, Point | 80 | 80 point features; 'mode' has 2 values (top: bus 74, rail 6); 'daily_boardings' 48 to 4,542 (mean 311.9); named by 'name' (e.g. Central Transit Center, Stop 002, Stop 003); extent -87.6794,41.8569 to -87.6138,41.9013. Point locations of Transit stops by mode. | 148 | |
| Licensed premises | vector, Point | 120 | 120 point features; 'type' has 4 values (top: restaurant 57, bar 38, liquor store 13); 'closing_hour' 0 to 23 (mean 5.775); 'capacity' 32 to 350 (mean 124.8); extent -87.6794,41.8569 to -87.6140,41.9008. Point locations of Licensed premises by type. | 149 | |
| Roads | vector, LineString | 1,033 | 1,033 line features; 'class' has 4 values (top: local 814, other 181, motorway 25); 'speed_limit_mph' 25 to 35 (mean 25.37); 'lanes' 2 to 4 (mean 2.074); named by 'name' (e.g. Randolph St, W Arcade Pl, Harrison St); total length 509.7 km; extent -87.6804,41.8563 to -87.6077,41.9016. Lines (Roads) such as routes or networks. | 150 | |
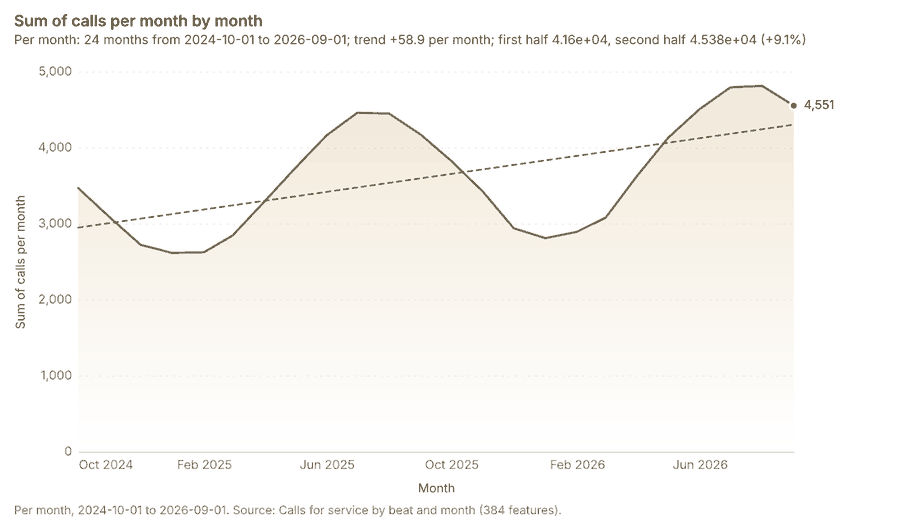
| Calls for service by beat and month | table | 384 | 2024-10-01 to 2026-09-01 | Table of 384 rows and 6 columns without geometry; dated by 'month' from 2024-10-01 to 2026-09-01; 'calls' 61 to 814 (mean 226.5); 'priority_1_calls' 9 to 139 (mean 35.84); 'median_response_min' 5.7 to 13.9 (mean 9.779). A table of Calls for service by beat and month without locations. | 4 |
| Beat staffing by shift | table | 48 | Table of 48 rows and 5 columns without geometry; 'shift' has 3 values (top: day 16, evening 16, night 16); 'officers' 2 to 6 (mean 3.75); 'vehicles' 1 to 3 (mean 1.979); 'overtime_hours' 0 to 59 (mean 28.85). A table of Beat staffing by shift without locations. | 151 | |
| Quarterly crime and safety briefing | document | 1-page md document 'Quarterly crime and safety briefing, third quarter 2026'; language en; mentions 7 place(s): Central Transit Center (2), Market West Beat (2), N Elizabeth St (2), Kingsway Beat (2), 41.87815, -87.63532 (1). A document about Central Transit Center, Market West Beat, N Elizabeth St; it names event terms Thefts, Transit, street. | 152 | ||
| Hot spot patrol plan | document | 1-page pdf document 'Hot spot patrol plan'; language en; mentions 6 place(s): Central District Station (1), Westside Station (1), Riverside Station (1), Central Transit Center (1), Market West Beat (1). A document about Central District Station, Westside Station, Riverside Station; it names organizations Focus; event terms theft, Patrols, Transit. | 153 | ||
| Sample: Public safety, Chicago | record | 154 | |||
| Hot spot analysis: CCTV cameras | layer, Polygon | 36 | 98 | ||
| Hot spot analysis: Licensed premises | layer, Polygon | 112 | 155 | ||
| Emerging hot spots: Incidents | layer, Polygon | 270 | 156 | ||
| Emerging hot spots: Street light outages | layer, Polygon | 47 | 157 | ||
| Find point clusters: Licensed premises | layer, Point | 120 | 158 | ||
| Find point clusters: cluster hulls | layer, Polygon | 3 | 81 | ||
| Find point clusters: Incidents | layer, Point | 1,680 | 159 | ||
| Find point clusters: cluster hulls | layer, Polygon | 3 | 160 | ||
| Find point clusters: Street light outages | layer, Point | 420 | 161 | ||
| Find point clusters: cluster hulls | layer, Polygon | 1 | 162 | ||
| Summarize within: Patrol beats | layer, Polygon | 16 | 163 | ||
| Summarize within: Patrol beats | layer, Polygon | 16 | 164 | ||
| Summarize within: Patrol beats | layer, Polygon | 16 | 88 | ||
| Period change: Incidents (week of 2026-06-22 to week of 2026-06-29) | layer, Polygon | 16 | 8 | ||
| Period change: Street light outages (week of 2026-02-02 to week of 2026-02-09) | layer, Polygon | 7 | 10 | ||
| Calculate density: Licensed premises | layer, Polygon | 164 | 165 | ||
| Calculate density: Incidents | layer, Polygon | 2,874 | 166 | ||
| Calculate density: Street light outages | layer, Polygon | 848 | 93 | ||
| Hot spot analysis: Incidents | layer, Polygon | 2,912 | 80 | ||
| Repeat and near repeat classification: Incidents | layer, Point | 1,680 | 167 | ||
| Dense areas of street light outages | layer, MultiPolygon | 5 | 110 | ||
| Hot cells inside each cluster of licensed premises | layer, Polygon | 3 | 82 | ||
| Change beside the counts per patrol beat | layer, Polygon | 16 | 89 | ||
| Change of incidents where density is high | layer, Polygon | 16 | 94 | ||
| Hot cells of CCTV cameras per patrol beat | layer, Polygon | 16 | 99 | ||
| Nearest police station to each cluster of licensed premises | layer, Polygon | 3 | 104 | ||
| Change of street light outages per patrol beat | layer, Polygon | 16 | 113 |
Timeline
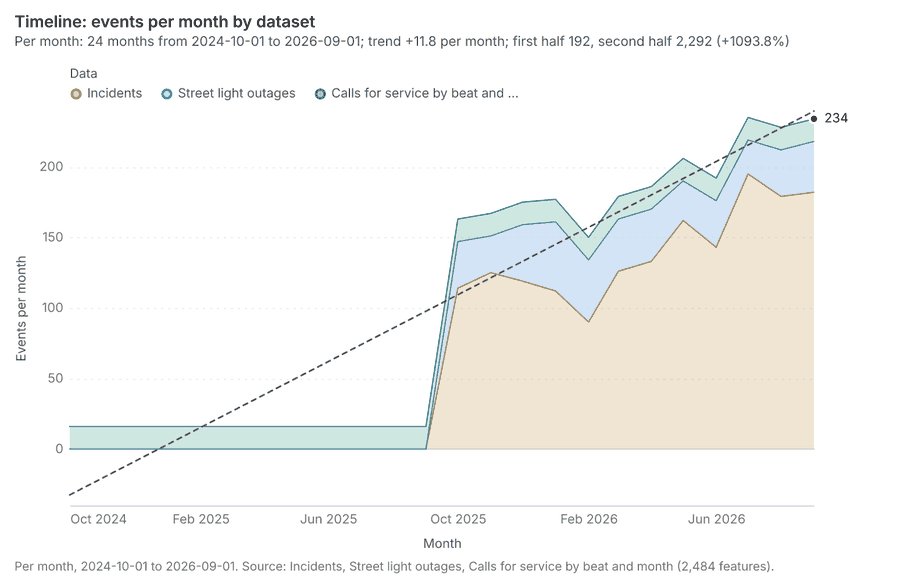
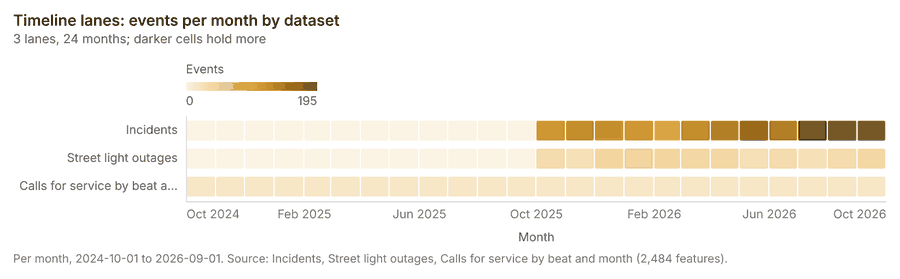
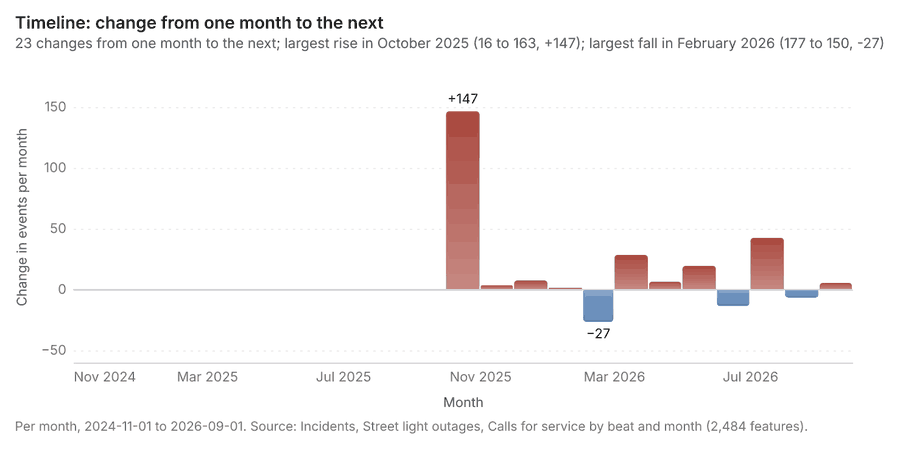
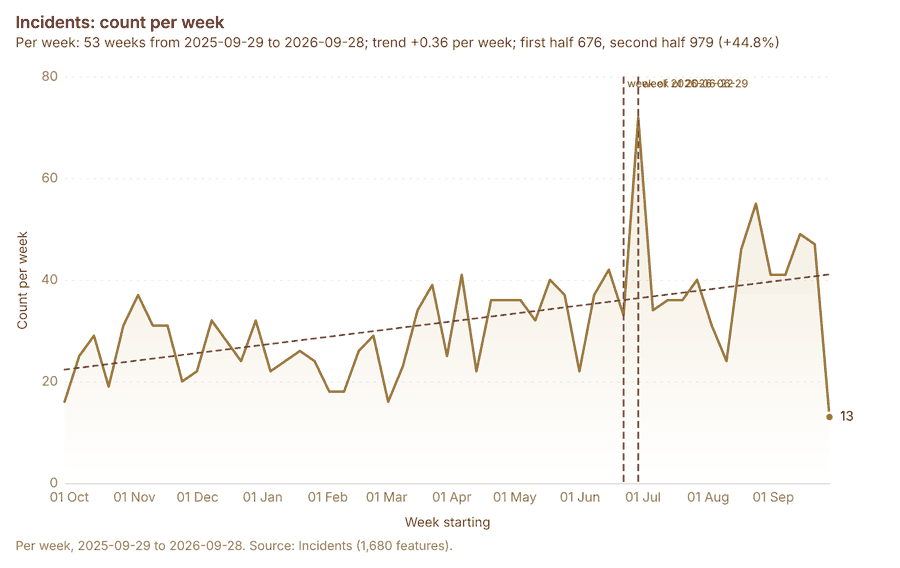
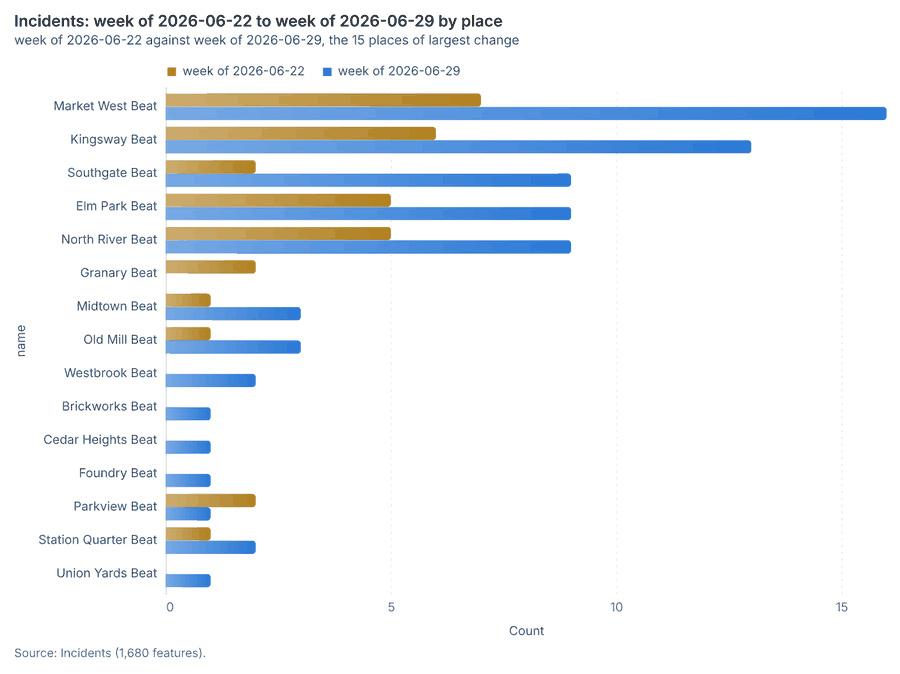
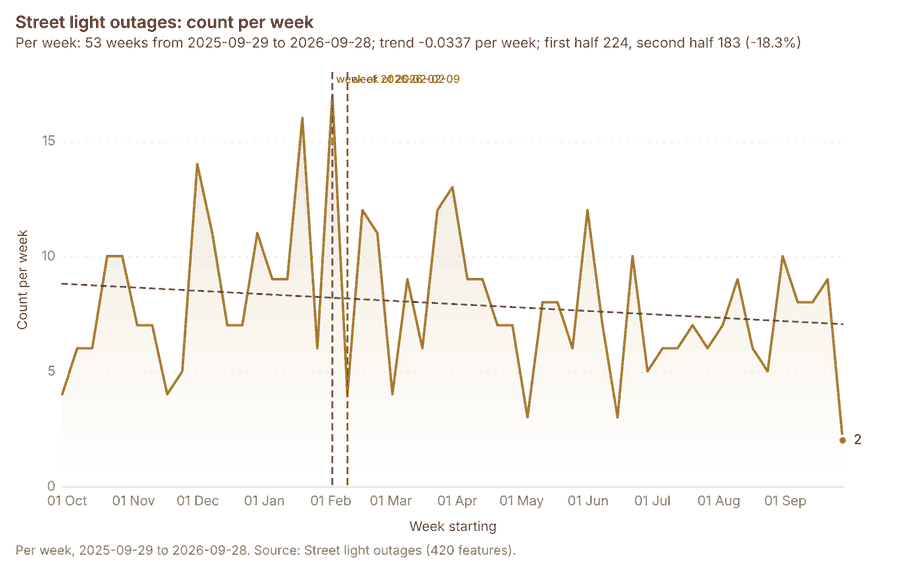
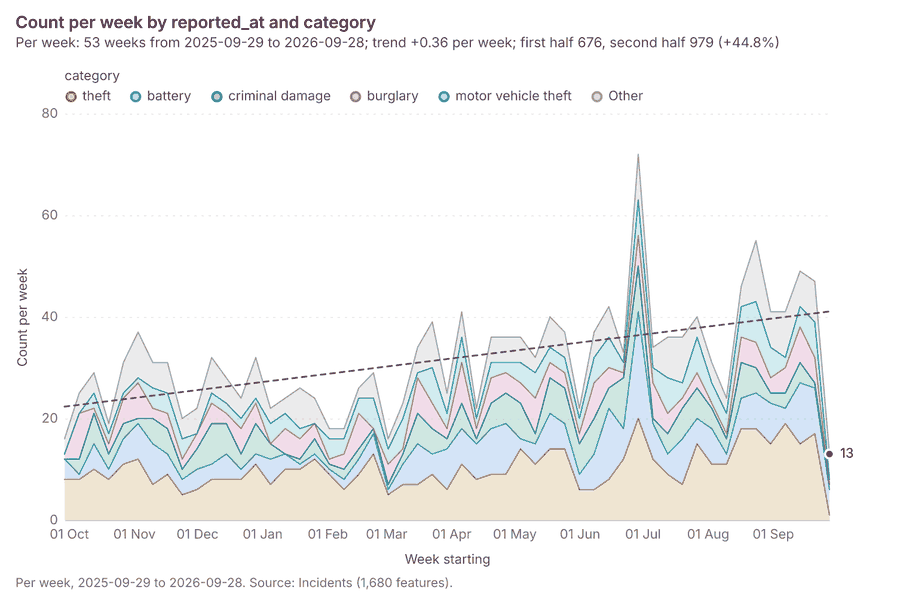
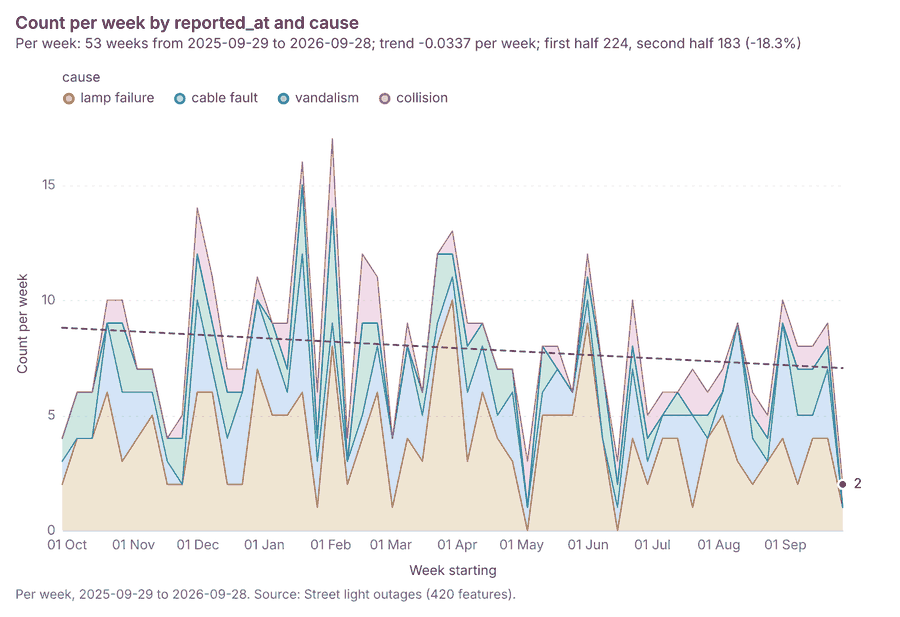
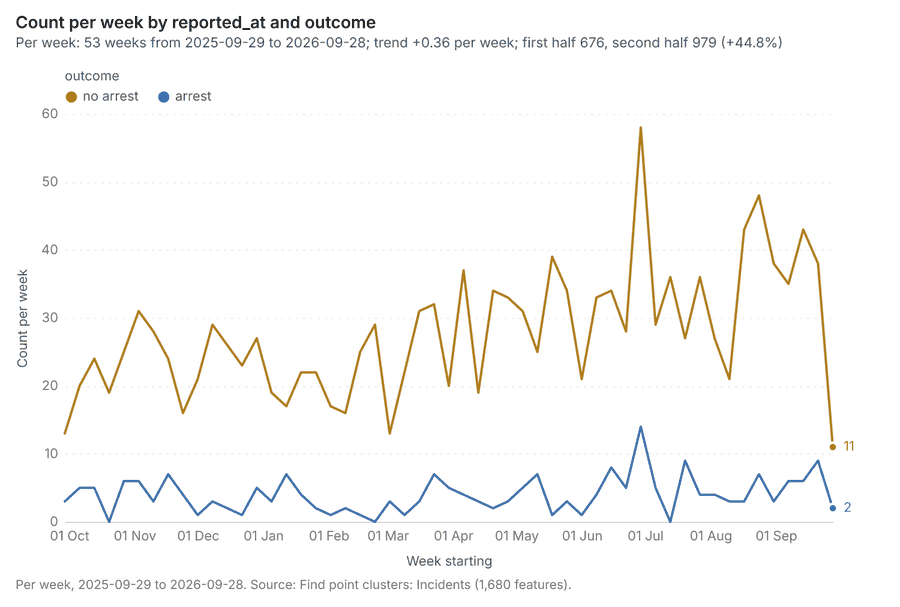
The timeline counts 2,484 dated events in Incidents, Street light outages, Calls for service by beat and month per month, from October 2024 to September 2026 1234. By dataset: Incidents 1,680; Street light outages 420; Calls for service by beat and month 384 15. The trend is +11.8 events per month; the second half of the months has 2,292 against 192 in the first (+1093.8%) 1. Month over month, the largest rise was from September 2025 to October 2025 (16 to 163, +147) and the largest fall was from January 2026 to February 2026 (177 to 150, -27) 16. The count rose from 33 in week of 2026-06-22 to 72 in week of 2026-06-29 (+118.2%), beyond what chance would give (p = 0.000178) 78. Between the two, the largest rise was in Market West Beat (7 to 16, +9) and the largest fall in Granary Beat (2 to 0, -2) 78. The count fell from 17 in week of 2026-02-02 to 4 in week of 2026-02-09 (-76.5%), beyond what chance would give (p = 0.0072) 910. Between the two, the largest rise was in Parkview Beat (0 to 2, +2) and the largest fall in Market West Beat (9 to 2, -7) 910.
Busiest months
Quietest months
Overview
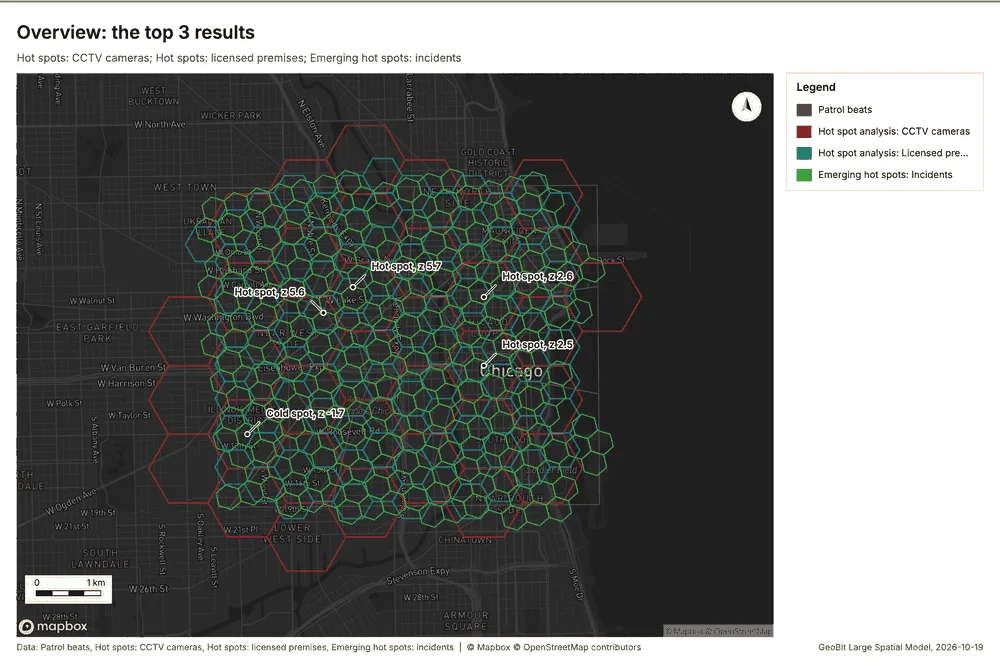
Overview: the top 3 results in the report's order, each in one distinct color, over Patrol beats as context 11.
Spatial structure
Incidents are clustered (nearest-neighbor ratio 0.73, z = -21.0; features lie 48.8 m apart on average against 66.5 m if random) 12. Incidents are dated by 'reported_at' from 2025-10-01 to 2026-09-30 at a week grain 12. Over time the pattern changes: the earlier half is clustered (ratio 0.7893) and the later half clustered (ratio 0.7746); the center moved 132 m 12. Street light outages are clustered (nearest-neighbor ratio 0.88, z = -4.9; features lie 113 m apart on average against 129 m if random) 13. Street light outages are dated by 'reported_at' from 2025-10-01 to 2026-09-30 at a week grain 13. Over time the pattern changes: the earlier half is clustered (ratio 0.8542) and the later half clustered (ratio 0.8877); the center moved 263 m 13. Patrol beats are 16 areas of 1.876 km2 on average, covering 99 percent of their extent, with no overlap 14. CCTV cameras are spread at random (nearest-neighbor ratio 0.93, z = -1.0; features lie 311 m apart on average against 334 m if random) 15. Transit stops are spread at random (nearest-neighbor ratio 0.93, z = -1.2; features lie 268 m apart on average against 289 m if random) 16. Licensed premises are clustered (nearest-neighbor ratio 0.85, z = -3.2; features lie 199 m apart on average against 234 m if random) 17. Roads form a connected network: 1033 lines with 120 junctions and 2864 crossings in 98 connected parts, 509.7 km in all 18. 100 percent of CCTV cameras lie inside Patrol beats (60 of 60) 1415. 100 percent of Incidents lie inside Patrol beats (1680 of 1680) 1214. 100 percent of Licensed premises lie inside Patrol beats (120 of 120) 1417. 100 percent of Police stations lie inside Patrol beats (3 of 3) 1419. 100 percent of Street light outages lie inside Patrol beats (420 of 420) 1314. 100 percent of Transit stops lie inside Patrol beats (80 of 80) 1416. 99 percent of Roads lie inside Patrol beats (1019 of 1033) 1418. CCTV cameras lie 2.33 m from the nearest of Roads (median); 100 percent lie within 100 m 1518. Street light outages lie 3.89 m from the nearest of Roads (median); 96 percent lie within 100 m 1318. Transit stops lie 4.41 m from the nearest of Roads (median); 100 percent lie within 100 m 1618.
| Result | Value |
|---|---|
| layers profiled | 8 |
| clustered point layers | 3 |
| random point layers | 2 |
Findings
- Evidenced: Incidents are clustered (nearest-neighbor ratio 0.73, z = -21.0; features lie 48.8 m apart on average against 66.5 m if random) 12.
- Evidenced: Incidents are dated by 'reported_at' from 2025-10-01 to 2026-09-30 at a week grain 12.
- Evidenced: Over time the pattern changes: the earlier half is clustered (ratio 0.7893) and the later half clustered (ratio 0.7746); the center moved 132 m 12.
- Evidenced: Street light outages are clustered (nearest-neighbor ratio 0.88, z = -4.9; features lie 113 m apart on average against 129 m if random) 13.
- Evidenced: Street light outages are dated by 'reported_at' from 2025-10-01 to 2026-09-30 at a week grain 13.
- Evidenced: Over time the pattern changes: the earlier half is clustered (ratio 0.8542) and the later half clustered (ratio 0.8877); the center moved 263 m 13.
- Evidenced: Patrol beats are 16 areas of 1.876 km2 on average, covering 99 percent of their extent, with no overlap 14.
- Evidenced: CCTV cameras are spread at random (nearest-neighbor ratio 0.93, z = -1.0; features lie 311 m apart on average against 334 m if random) 15.
- Evidenced: Transit stops are spread at random (nearest-neighbor ratio 0.93, z = -1.2; features lie 268 m apart on average against 289 m if random) 16.
- Evidenced: Licensed premises are clustered (nearest-neighbor ratio 0.85, z = -3.2; features lie 199 m apart on average against 234 m if random) 17.
- Evidenced: Roads form a connected network: 1033 lines with 120 junctions and 2864 crossings in 98 connected parts, 509.7 km in all 18.
- Evidenced: 100 percent of CCTV cameras lie inside Patrol beats (60 of 60) 1415.
- Evidenced: 100 percent of Incidents lie inside Patrol beats (1680 of 1680) 1214.
- Evidenced: 100 percent of Licensed premises lie inside Patrol beats (120 of 120) 1417.
- Evidenced: 100 percent of Police stations lie inside Patrol beats (3 of 3) 1419.
- Evidenced: 100 percent of Street light outages lie inside Patrol beats (420 of 420) 1314.
- Evidenced: 100 percent of Transit stops lie inside Patrol beats (80 of 80) 1416.
- Evidenced: 99 percent of Roads lie inside Patrol beats (1019 of 1033) 1418.
- Evidenced: CCTV cameras lie 2.33 m from the nearest of Roads (median); 100 percent lie within 100 m 1518.
- Evidenced: Street light outages lie 3.89 m from the nearest of Roads (median); 96 percent lie within 100 m 1318.
- Evidenced: Transit stops lie 4.41 m from the nearest of Roads (median); 100 percent lie within 100 m 1618.
Hot spots
What this analysis is. Hot spot analysis: Getis-Ord Gi* hot and cold spots with z-scores, p-values and confidence bins 20. In ArcGIS it is Find Hot Spots or Hot Spot Analysis (Getis-Ord Gi*); in QGIS, qgis:hotspot (plugin) 20.
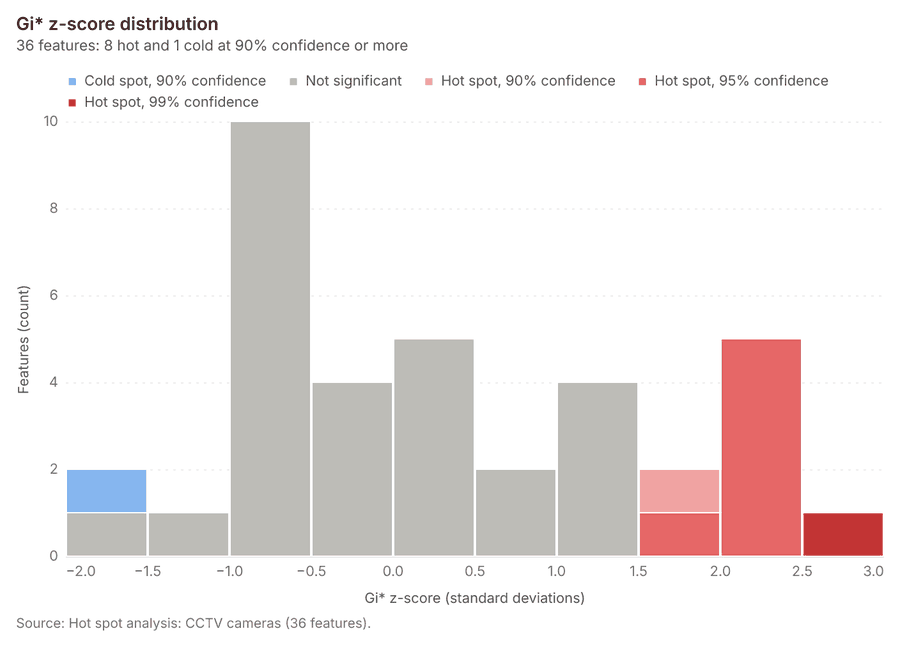
Why it was run on this data. 60 points: Getis-Ord Gi* tests whether the concentrations in CCTV cameras are statistically significant 21.
What it found. The hot spot analysis tool, gp_hot_spots, utilized the CCTV cameras layer 15 and returned a result containing 36 features 22.
| Result | Value |
|---|---|
| result, bins | 36 |
| result, count | 36 |
| result, elapsed ms | 3 |
| result, cell size m | 1,000 |
| result, incidents used | 60 |
| result, distance band m | 2,000 |
| billing, cost | 0.0512 |
| billing, list price | 0.0512 |
| billing, upstream cost | 0 |
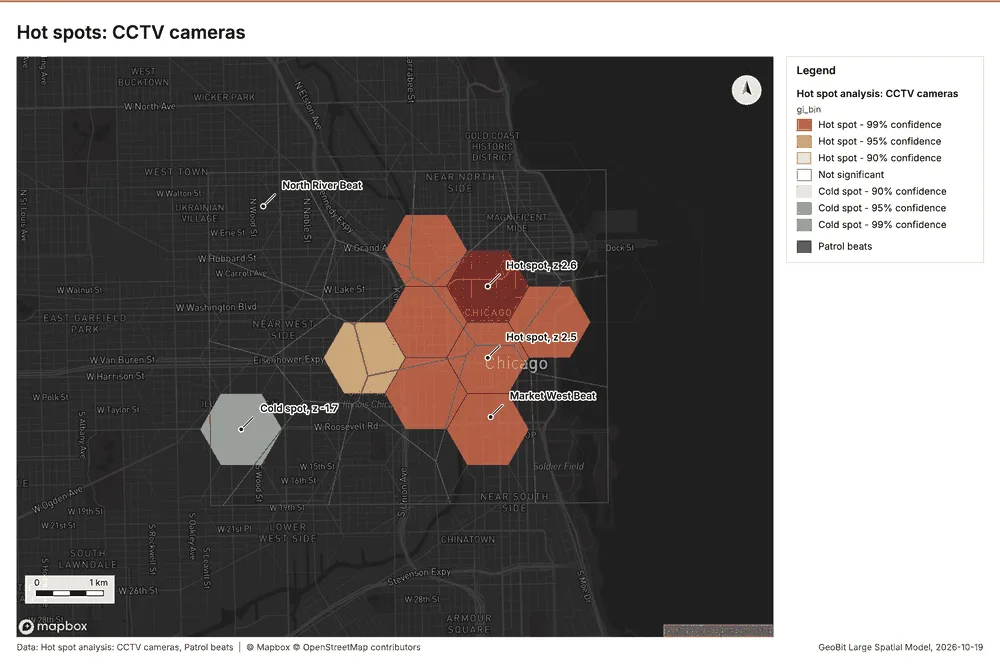
What the map shows. The map draws Hot spot analysis: CCTV cameras by gi_bin in 7 classes: Hot spot - 99% confidence, Hot spot - 95% confidence, Hot spot - 90% confidence, Not significant, Cold spot - 90% confidence, Cold spot - 95% confidence and 1 more 23. The map draws Patrol beats with one symbol 23. It draws 52 features 23. It covers longitude -87.715 to -87.578 and latitude 41.838 to 41.917, at about 1:47,468 23.
Findings
- Evidenced: Hot spots on CCTV cameras: Hot spot analysis: 1 layer saved: Hot spot analysis: CCTV cameras (36 features) 1522.
- Evidenced: It reported result, bins 36; result, count 36; result, elapsed ms 3; result, cell size m 1,000; result, incidents used 60; result, distance band m 2,000 22.
Tool gp_hot_spots; parameters {"project": "fe9df6b9-8a15-4264-946b-4b37b8dbb89d", "features": {"layer": "CCTV cameras (ad88aaeb)"}, "aggregation": "hexagon", "cell_size_m": 1000.0, "distance_band_m": 2000.0}
Hot spots
What this analysis is. Hot spot analysis: Getis-Ord Gi* hot and cold spots with z-scores, p-values and confidence bins 20. In ArcGIS it is Find Hot Spots or Hot Spot Analysis (Getis-Ord Gi*); in QGIS, qgis:hotspot (plugin) 20.
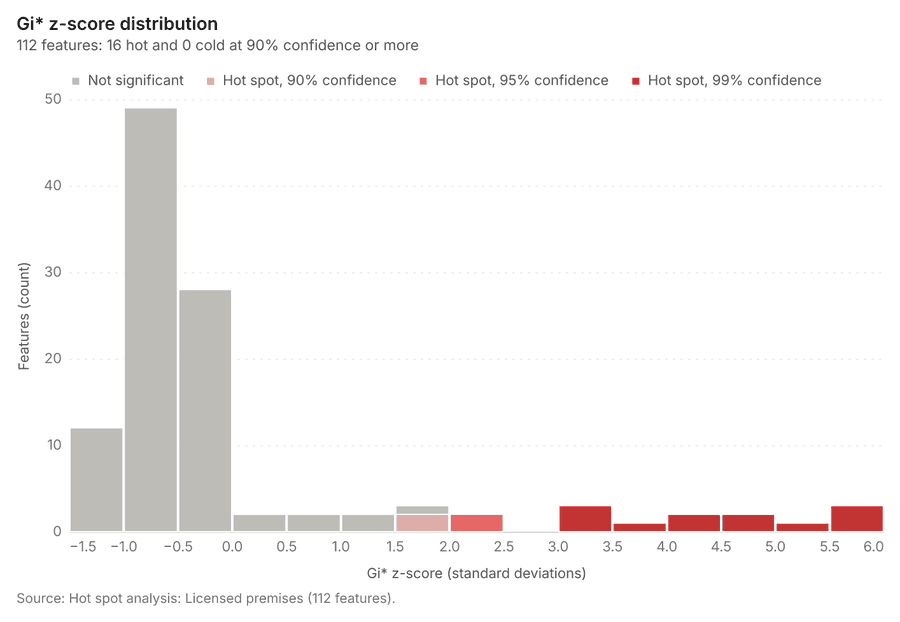
Why it was run on this data. 120 points: Getis-Ord Gi* tests whether the concentrations in Licensed premises are statistically significant 24. Measured: Licensed premises are clustered (nearest-neighbor ratio 0.85, z = -3.2), median spacing 121 m 24. Cells of 500 m and a band of 1000 m from the measured spacing 24.
What it found. Hot spots on Licensed premises: Hot spot analysis: 1 layer saved: Hot spot analysis: Licensed premises (112 features) 1725. It reported result, bins 112; result, count 112; result, elapsed ms 5; result, cell size m 500; result, incidents used 120; result, distance band m 1,000 25.
| Result | Value |
|---|---|
| result, bins | 112 |
| result, count | 112 |
| result, elapsed ms | 5 |
| result, cell size m | 500 |
| result, incidents used | 120 |
| result, distance band m | 1,000 |
| billing, cost | 0.0524 |
| billing, list price | 0.0524 |
| billing, upstream cost | 0 |
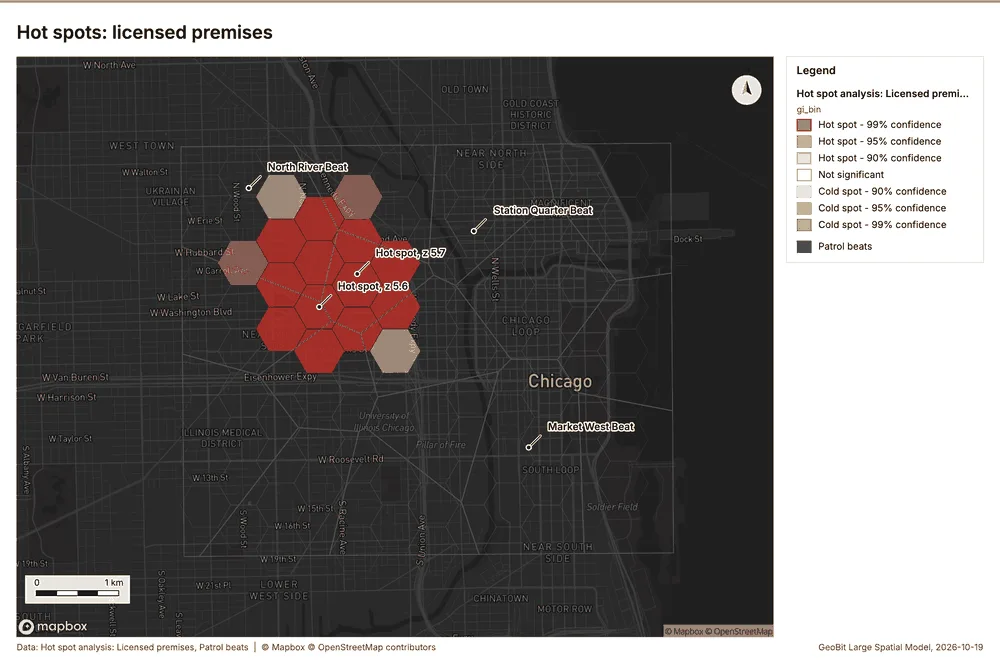
What the map shows. The map draws Hot spot analysis: Licensed premises by gi_bin in 7 classes: Hot spot - 99% confidence, Hot spot - 95% confidence, Hot spot - 90% confidence, Not significant, Cold spot - 90% confidence, Cold spot - 95% confidence and 1 more 26. The map draws Patrol beats with one symbol 26. It draws 128 features 26. It covers longitude -87.705 to -87.593 and latitude 41.847 to 41.911, at about 1:38,555 26.
Findings
- Evidenced: Hot spots on Licensed premises: Hot spot analysis: 1 layer saved: Hot spot analysis: Licensed premises (112 features) 1725.
- Evidenced: It reported result, bins 112; result, count 112; result, elapsed ms 5; result, cell size m 500; result, incidents used 120; result, distance band m 1,000 25.
A model draft was discarded because a sentence did not cite a source of this section.
Tool gp_hot_spots; parameters {"project": "fe9df6b9-8a15-4264-946b-4b37b8dbb89d", "features": {"layer": "Licensed premises (055b5c2c)"}, "aggregation": "hexagon", "cell_size_m": 500.0, "distance_band_m": 1000.0}
Space time hot spots
What this analysis is. Emerging hot spots: Where hot spots are new, consecutive, intensifying, persistent, diminishing, sporadic, oscillating or historical over time 27. In ArcGIS it is Emerging Hot Spot Analysis or Create Space Time Cube 27.
Why it was run on this data. Incidents carry dates in 'reported_at': emerging hot spot analysis finds new, intensifying and fading hot spots per week 28. Measured: the pattern of Incidents changes over time (earlier half clustered, later half clustered; the center moved 132 m) 28.
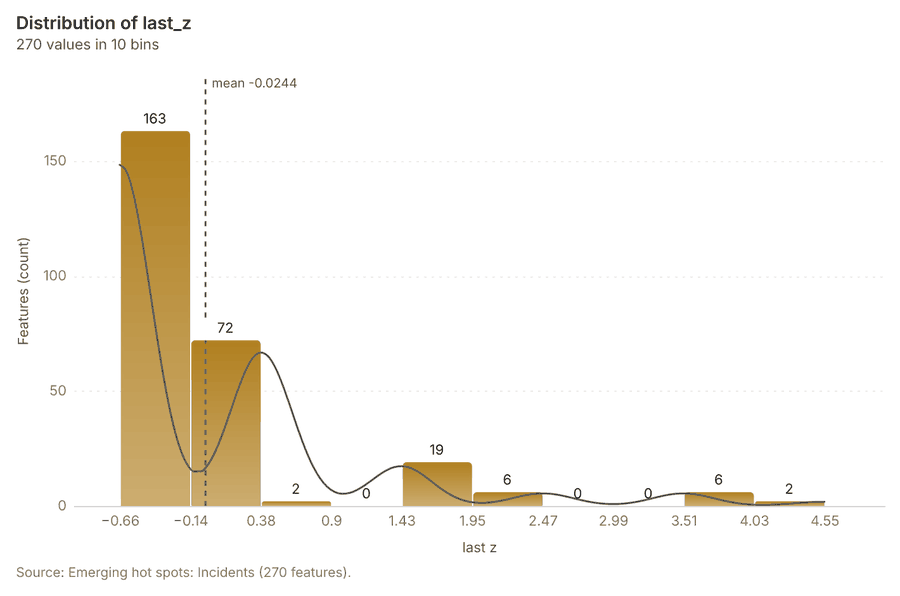
What it found. The space time hot spots analysis was executed using the Incidents layer 12 and resulted in 270 features saved as "Emerging hot spots: Incidents" 29. The process was efficient, concluding in an elapsed time of 46 milliseconds 29. Furthermore, the analysis utilized 1,680 features and incurred a total cost of 0.184 29.
| Result | Value |
|---|---|
| result, count | 270 |
| result, elapsed ms | 46 |
| result, resolution | 9 |
| result, features used | 1,680 |
| result, time neighbors | 0 |
| billing, cost | 0.184 |
| billing, list price | 0.184 |
| billing, upstream cost | 0 |
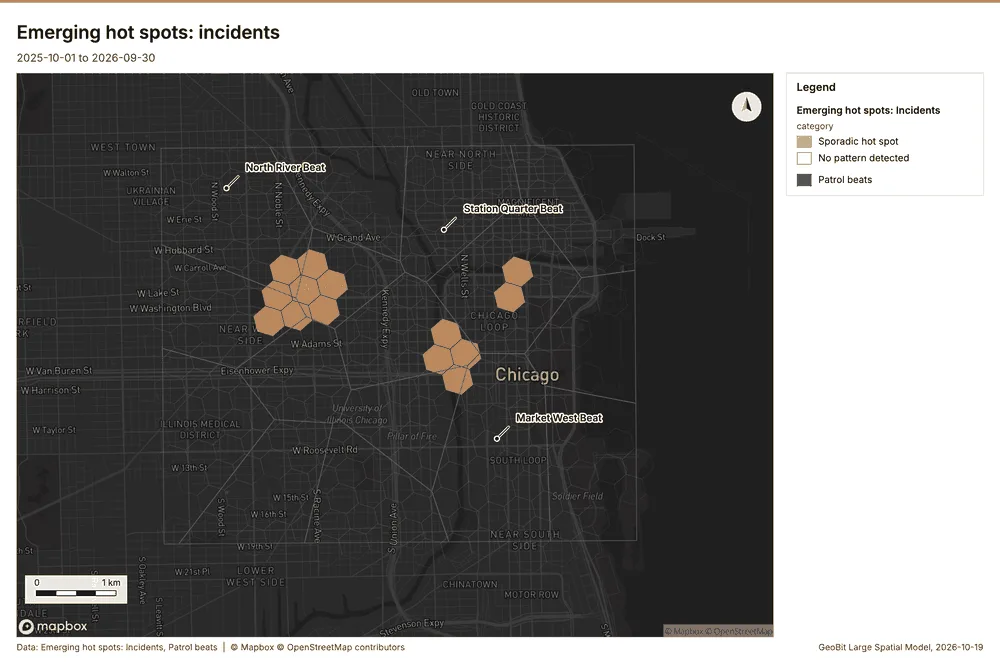
What the map shows. The map draws Emerging hot spots: Incidents by category in 2 classes: Sporadic hot spot, No pattern detected 30. The map draws Patrol beats with one symbol 30. It draws 286 features 30. It covers longitude -87.702 to -87.587 and latitude 41.846 to 41.91, at about 1:39,916 30.
Findings
- Evidenced: Space time hot spots on Incidents: Emerging hot spots: 1 layer saved: Emerging hot spots: Incidents (270 features) 1229.
- Evidenced: It reported result, count 270; result, elapsed ms 46; result, resolution 9; result, features used 1,680; result, time neighbors 0; billing, cost 0.184 29.
Tool gp_space_time_hot_spots; parameters {"project": "fe9df6b9-8a15-4264-946b-4b37b8dbb89d", "features": {"layer": "Incidents (36ad5f7c)"}, "interval": "week", "bin_shape": "h3", "resolution": 9, "time_field": "reported_at"}
Space time hot spots
What this analysis is. Emerging hot spots: Where hot spots are new, consecutive, intensifying, persistent, diminishing, sporadic, oscillating or historical over time 27. In ArcGIS it is Emerging Hot Spot Analysis or Create Space Time Cube 27.
Why it was run on this data. Street light outages carry dates in 'reported_at': emerging hot spot analysis finds new, intensifying and fading hot spots per week 31. Measured: the pattern of Street light outages changes over time (earlier half clustered, later half clustered; the center moved 263 m) 31.
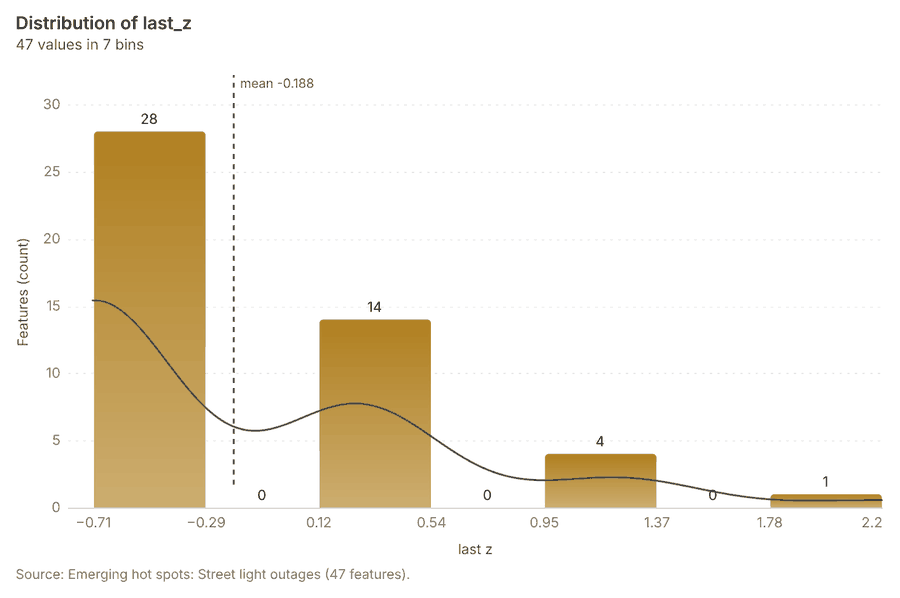
What it found. Space time hot spots on Street light outages: Emerging hot spots: 1 layer saved: Emerging hot spots: Street light outages (47 features) 1332. It reported result, count 47; result, elapsed ms 10; result, resolution 8; result, features used 420; result, time neighbors 0; billing, cost 0.121 32.
| Result | Value |
|---|---|
| result, count | 47 |
| result, elapsed ms | 10 |
| result, resolution | 8 |
| result, features used | 420 |
| result, time neighbors | 0 |
| billing, cost | 0.121 |
| billing, list price | 0.121 |
| billing, upstream cost | 0 |
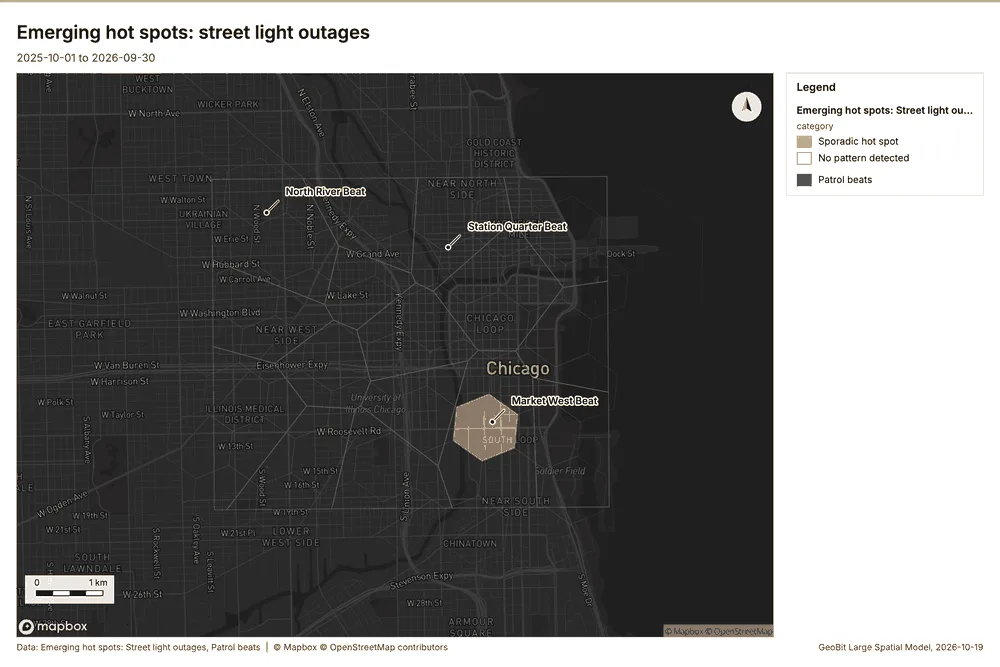
What the map shows. The map draws Emerging hot spots: Street light outages by category in 2 classes: Sporadic hot spot, No pattern detected 33. The map draws Patrol beats with one symbol 33. It draws 63 features 33. It covers longitude -87.716 to -87.578 and latitude 41.839 to 41.916, at about 1:47,799 33.
Findings
- Evidenced: Space time hot spots on Street light outages: Emerging hot spots: 1 layer saved: Emerging hot spots: Street light outages (47 features) 1332.
- Evidenced: It reported result, count 47; result, elapsed ms 10; result, resolution 8; result, features used 420; result, time neighbors 0; billing, cost 0.121 32.
Tool gp_space_time_hot_spots; parameters {"project": "fe9df6b9-8a15-4264-946b-4b37b8dbb89d", "features": {"layer": "Street light outages (a7218535)"}, "interval": "week", "bin_shape": "h3", "resolution": 8, "time_field": "reported_at"}
Find point clusters
What this analysis is. Find point clusters: Density-based clusters (DBSCAN, HDBSCAN or OPTICS, optionally space-time) with hulls and noise 34. In ArcGIS it is Find Point Clusters or Density-based Clustering; in QGIS, native:dbscanclustering or native:stdbscanclustering 34.
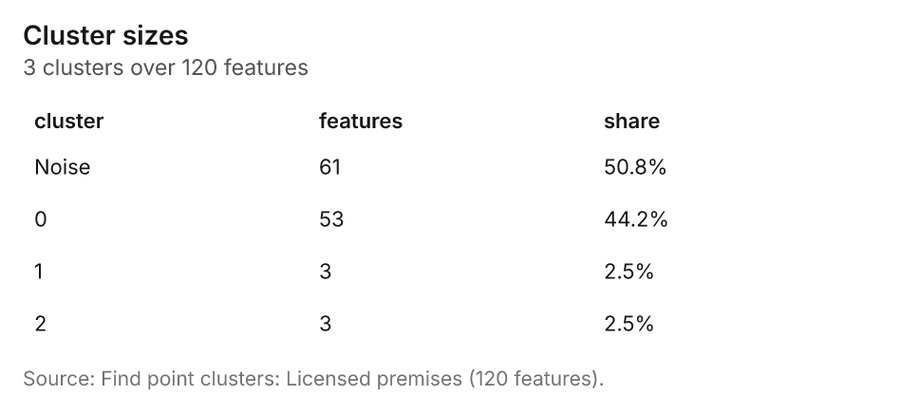
Why it was run on this data. DBSCAN finds dense groups of Licensed premises and separates noise 35. Measured: Licensed premises are clustered (nearest-neighbor ratio 0.85, z = -3.2), median spacing 121 m 35. DBSCAN at 200 m (twice the measured spacing) 35.
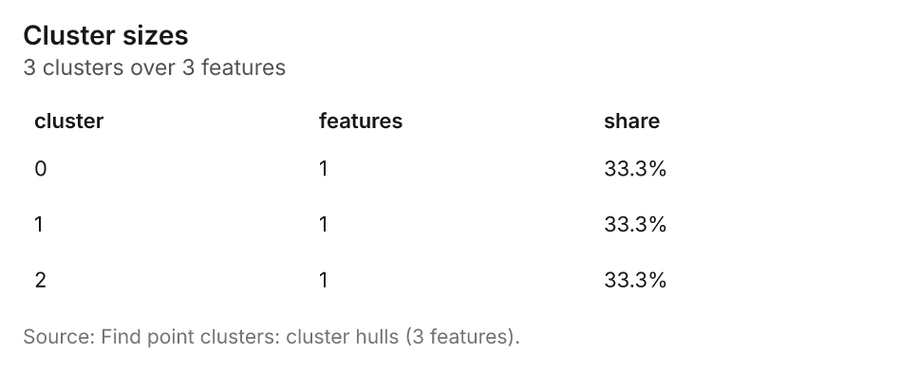
What it found. Find point clusters on Licensed premises: Find point clusters: 2 layers saved: Find point clusters: Licensed premises (120 features); Find point clusters: cluster hulls (3 features) 1736. It reported result, count 120; result, noise 61; result, distance m 200; result, elapsed ms 499; result, min points 3; billing, cost 0.0524 36.
| Result | Value |
|---|---|
| result, count | 120 |
| result, noise | 61 |
| result, distance m | 200 |
| result, elapsed ms | 499 |
| result, min points | 3 |
| billing, cost | 0.0524 |
| billing, list price | 0.0524 |
| billing, upstream cost | 0 |
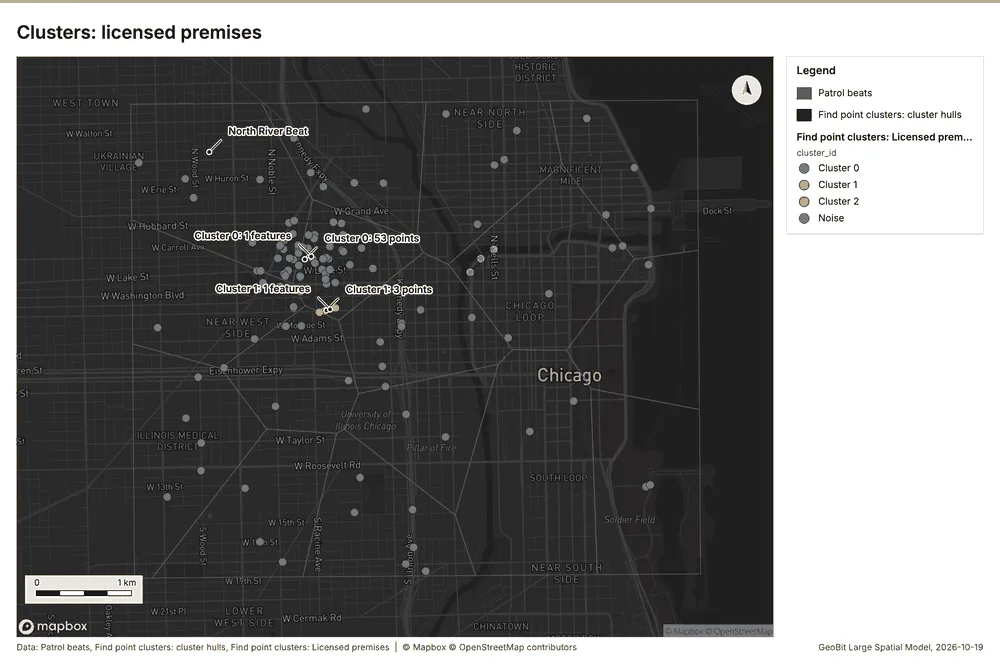
What the map shows. The map draws Patrol beats with one symbol 37. The map draws Find point clusters: cluster hulls with one symbol 37. The map draws Find point clusters: Licensed premises by cluster_id in 4 classes: Cluster 0, Cluster 1, Cluster 2, Noise 37. It draws 139 features 37. It covers longitude -87.695 to -87.598 and latitude 41.851 to 41.906, at about 1:33,333 37.
Findings
- Evidenced: Find point clusters on Licensed premises: Find point clusters: 2 layers saved: Find point clusters: Licensed premises (120 features); Find point clusters: cluster hulls (3 features) 1736.
- Evidenced: It reported result, count 120; result, noise 61; result, distance m 200; result, elapsed ms 499; result, min points 3; billing, cost 0.0524 36.
Tool gp_find_point_clusters; parameters {"method": "dbscan", "project": "fe9df6b9-8a15-4264-946b-4b37b8dbb89d", "features": {"layer": "Licensed premises (055b5c2c)"}, "distance_m": 200.0, "min_points": 3}
Find point clusters
What this analysis is. Find point clusters: Density-based clusters (DBSCAN, HDBSCAN or OPTICS, optionally space-time) with hulls and noise 34. In ArcGIS it is Find Point Clusters or Density-based Clustering; in QGIS, native:dbscanclustering or native:stdbscanclustering 34.
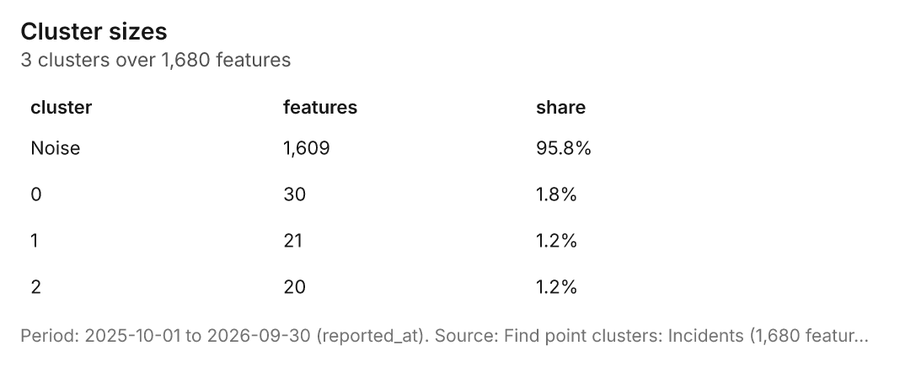
Why it was run on this data. DBSCAN finds dense groups of Incidents and separates noise 38. Measured: Incidents are clustered (nearest-neighbor ratio 0.73, z = -21.0), median spacing 34.3 m 38. DBSCAN at 50 m (twice the measured spacing) 38.
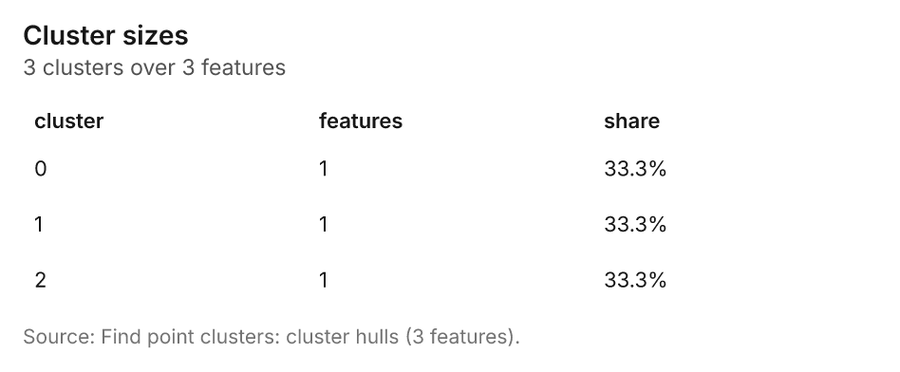
What it found. Find point clusters on Incidents: Find point clusters: 2 layers saved: Find point clusters: Incidents (1680 features); Find point clusters: cluster hulls (3 features) 1239. It reported result, count 1,680; result, noise 1,609; result, distance m 50; result, elapsed ms 19; result, min points 20; billing, cost 0.0836 39.
| Result | Value |
|---|---|
| result, count | 1,680 |
| result, noise | 1,609 |
| result, distance m | 50 |
| result, elapsed ms | 19 |
| result, min points | 20 |
| billing, cost | 0.0836 |
| billing, list price | 0.0836 |
| billing, upstream cost | 0 |
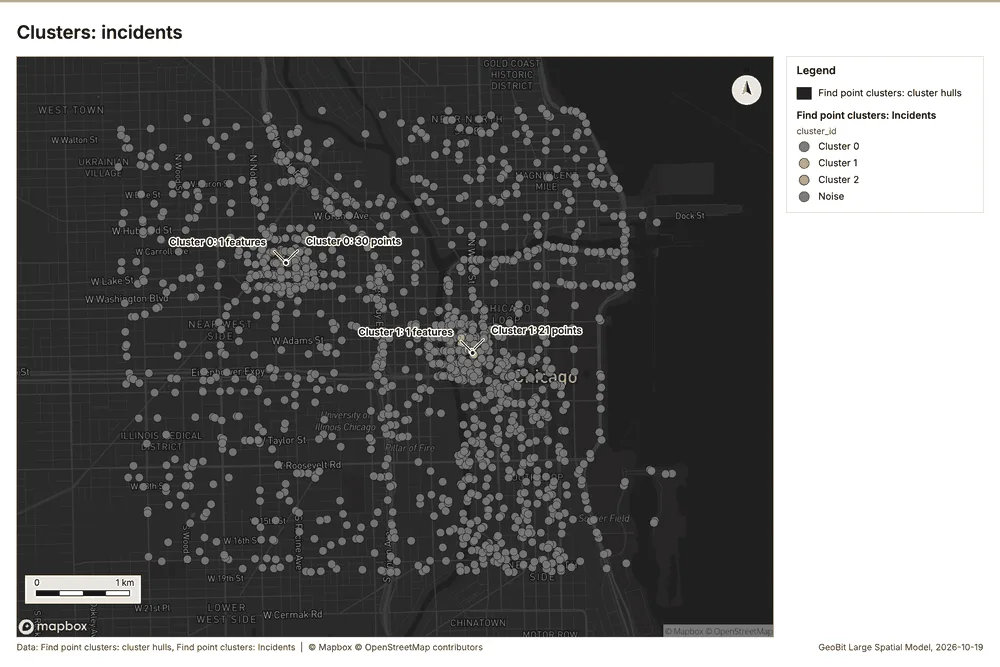
What the map shows. The map draws Find point clusters: cluster hulls with one symbol 40. The map draws Find point clusters: Incidents by cluster_id in 4 classes: Cluster 0, Cluster 1, Cluster 2, Noise 40. It draws 1,683 features 40. It covers longitude -87.693 to -87.595 and latitude 41.85 to 41.907, at about 1:34,033 40.
Findings
- Evidenced: Find point clusters on Incidents: Find point clusters: 2 layers saved: Find point clusters: Incidents (1680 features); Find point clusters: cluster hulls (3 features) 1239.
- Evidenced: It reported result, count 1,680; result, noise 1,609; result, distance m 50; result, elapsed ms 19; result, min points 20; billing, cost 0.0836 39.
Tool gp_find_point_clusters; parameters {"method": "dbscan", "project": "fe9df6b9-8a15-4264-946b-4b37b8dbb89d", "features": {"layer": "Incidents (36ad5f7c)"}, "distance_m": 50.0, "min_points": 20}
Find point clusters
What this analysis is. Find point clusters: Density-based clusters (DBSCAN, HDBSCAN or OPTICS, optionally space-time) with hulls and noise 34. In ArcGIS it is Find Point Clusters or Density-based Clustering; in QGIS, native:dbscanclustering or native:stdbscanclustering 34.
Why it was run on this data. DBSCAN finds dense groups of Street light outages and separates noise 41. Measured: Street light outages are clustered (nearest-neighbor ratio 0.88, z = -4.9), median spacing 74.9 m 41. DBSCAN at 100 m (twice the measured spacing) 41.
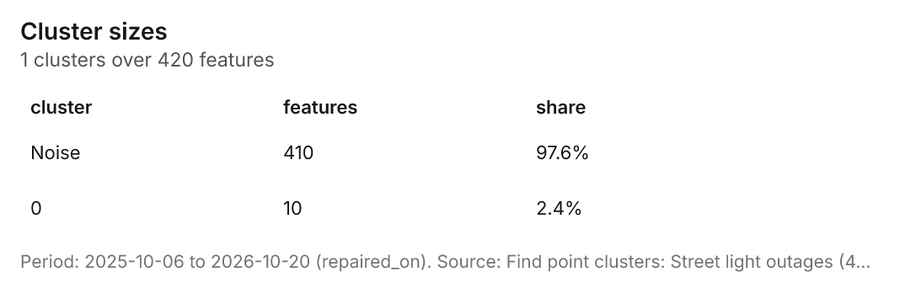
What it found. The gp_find_point_clusters tool was utilized against the Street light outages layer 13. This analysis successfully identified 420 features 42, classifying 410 of the input data as noise 42. The cluster process was configured with a distance threshold of 100 meters and required a minimum of 10 points 42.
| Result | Value |
|---|---|
| result, count | 420 |
| result, noise | 410 |
| result, distance m | 100 |
| result, elapsed ms | 5 |
| result, min points | 10 |
| billing, cost | 0.0584 |
| billing, list price | 0.0584 |
| billing, upstream cost | 0 |
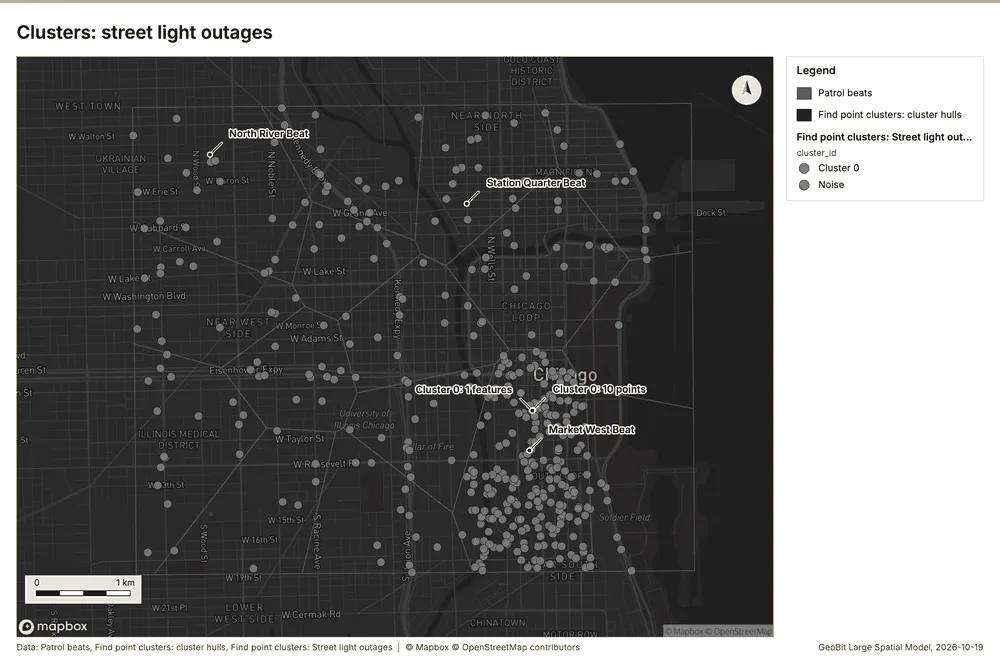
What the map shows. The map draws Patrol beats with one symbol 43. The map draws Find point clusters: cluster hulls with one symbol 43. The map draws Find point clusters: Street light outages by cluster_id in 2 classes: Cluster 0, Noise 43. It draws 437 features 43. It covers longitude -87.695 to -87.597 and latitude 41.85 to 41.906, at about 1:33,798 43.
Findings
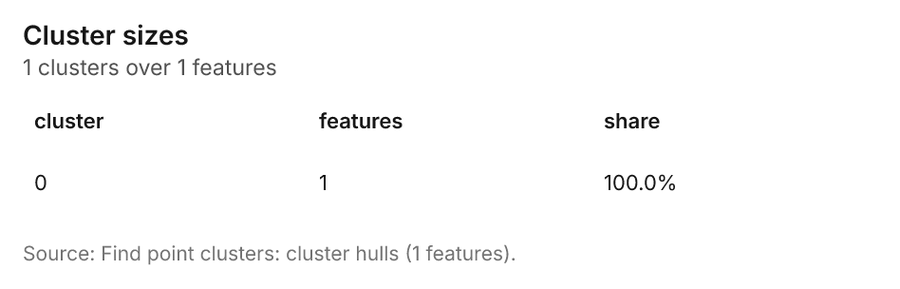
- Evidenced: Find point clusters on Street light outages: Find point clusters: 2 layers saved: Find point clusters: Street light outages (420 features); Find point clusters: cluster hulls (1 feature) 1342.
- Evidenced: It reported result, count 420; result, noise 410; result, distance m 100; result, elapsed ms 5; result, min points 10; billing, cost 0.0584 42.
Tool gp_find_point_clusters; parameters {"method": "dbscan", "project": "fe9df6b9-8a15-4264-946b-4b37b8dbb89d", "features": {"layer": "Street light outages (a7218535)"}, "distance_m": 100.0, "min_points": 10}
Summarize within
What this analysis is. Summarize within: Count and aggregate the features inside each polygon (or bin), proportionally for lines and polygons 44. In ArcGIS it is Summarize Within or Aggregate Points; in QGIS, native:countpointsinpolygon or native:sumlinelengths 44.
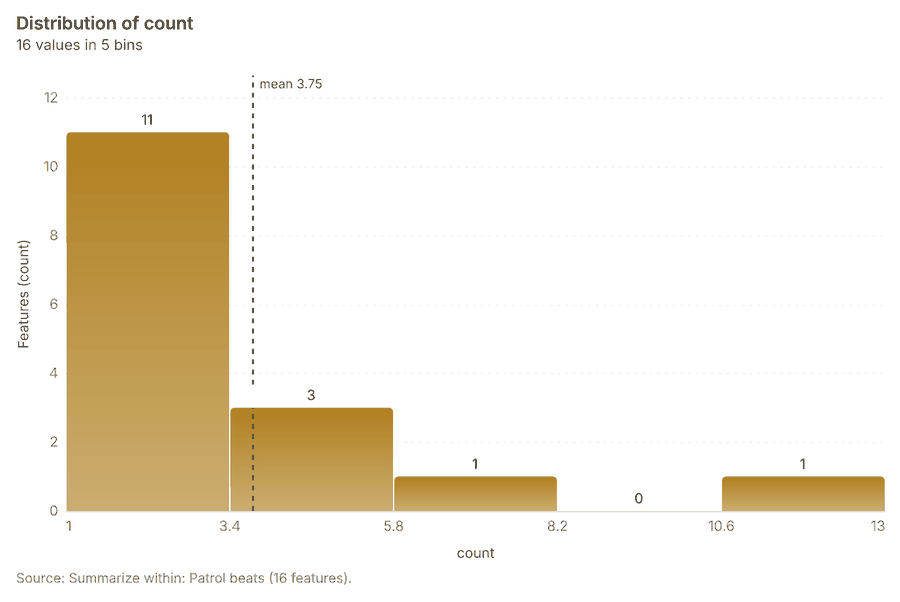
Why it was run on this data. Count CCTV cameras inside each feature of Patrol beats by ptz; the counts map as a choropleth (natural breaks, sequential colors) 45.
What it found. Summarize within on CCTV cameras, Patrol beats: Summarize within: 1 layer saved: Summarize within: Patrol beats (16 features) 141546. It reported result, count 16; result, elapsed ms 0; billing, cost 0.01154; billing, list price 0.01154; billing, upstream cost 0 46.
| Result | Value |
|---|---|
| result, count | 16 |
| result, elapsed ms | 0 |
| billing, cost | 0.01154 |
| billing, list price | 0.01154 |
| billing, upstream cost | 0 |
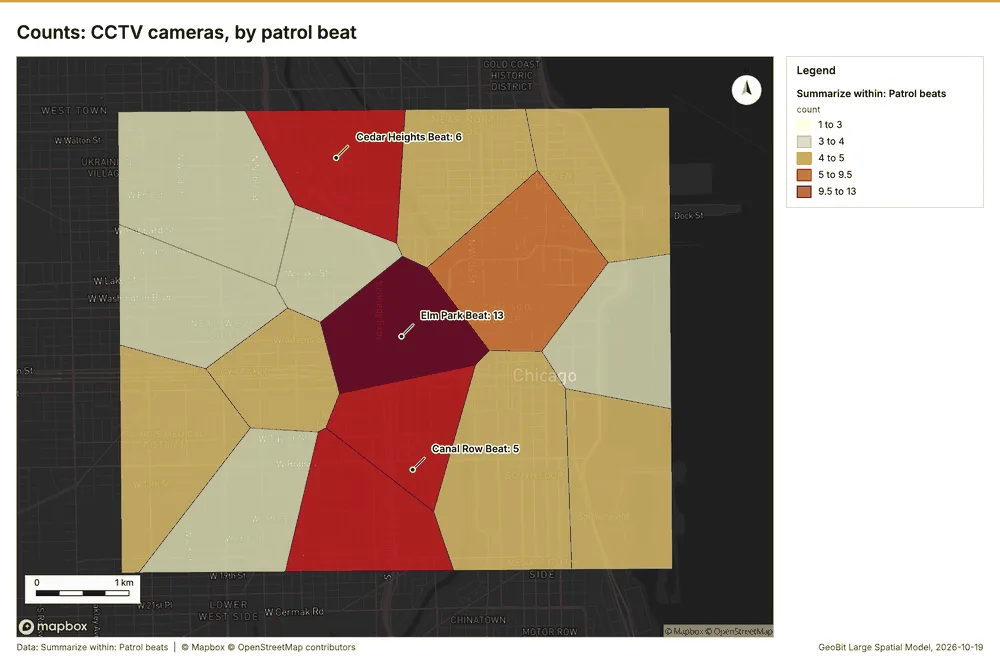
What the map shows. The map draws Summarize within: Patrol beats by count in 5 classes: 1 to 3, 3 to 4, 4 to 5, 5 to 9.5, 9.5 to 13 47. It draws 16 features 47. It covers longitude -87.694 to -87.594 and latitude 41.85 to 41.907, at about 1:34,270 47.
Findings
- Evidenced: Summarize within on CCTV cameras, Patrol beats: Summarize within: 1 layer saved: Summarize within: Patrol beats (16 features) 141546.
- Evidenced: It reported result, count 16; result, elapsed ms 0; billing, cost 0.01154; billing, list price 0.01154; billing, upstream cost 0 46.
Tool gp_summarize_within; parameters {"stats": [{"stat": "sum", "field": "installed_year"}], "project": "fe9df6b9-8a15-4264-946b-4b37b8dbb89d", "features": {"layer": "CCTV cameras (ad88aaeb)"}, "group_by": "ptz", "polygons": {"layer": "Patrol beats (8c67e28f)"}}
Summarize within
What this analysis is. Summarize within: Count and aggregate the features inside each polygon (or bin), proportionally for lines and polygons 44. In ArcGIS it is Summarize Within or Aggregate Points; in QGIS, native:countpointsinpolygon or native:sumlinelengths 44.
Why it was run on this data. Count CCTV cameras inside each feature of Patrol beats by ptz; the counts map as a choropleth (natural breaks, sequential colors) 45.
What it found. The analysis used the "Summarize within: Patrol beats" function, which processed 16 features 48.
| Result | Value |
|---|---|
| result, count | 16 |
| result, elapsed ms | 0 |
| billing, cost | 0.01274 |
| billing, list price | 0.01274 |
| billing, upstream cost | 0 |
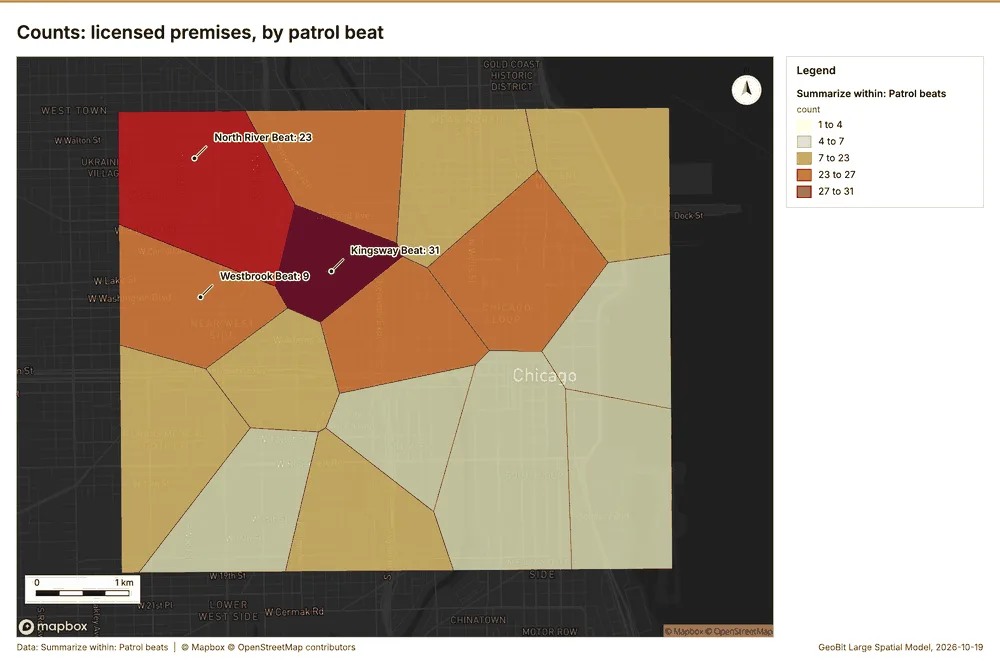
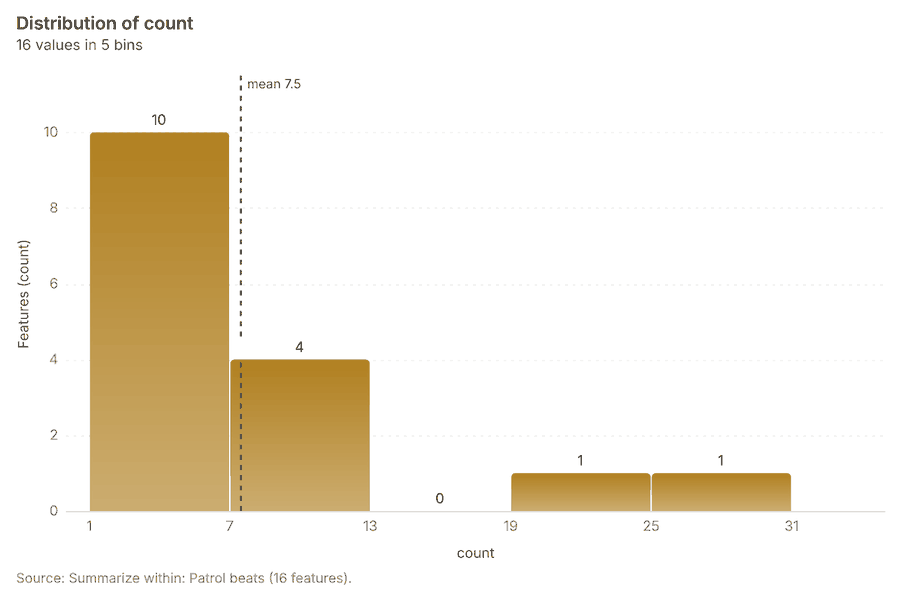
What the map shows. The map draws Summarize within: Patrol beats by count in 5 classes: 1 to 4, 4 to 7, 7 to 23, 23 to 27, 27 to 31 49. It draws 16 features 49. It covers longitude -87.694 to -87.594 and latitude 41.85 to 41.907, at about 1:34,270 49.
Findings
- Evidenced: Summarize within on Licensed premises, Patrol beats: Summarize within: 1 layer saved: Summarize within: Patrol beats (16 features) 141748.
- Evidenced: It reported result, count 16; result, elapsed ms 0; billing, cost 0.01274; billing, list price 0.01274; billing, upstream cost 0 48.
Tool gp_summarize_within; parameters {"stats": [{"stat": "sum", "field": "closing_hour"}], "project": "fe9df6b9-8a15-4264-946b-4b37b8dbb89d", "features": {"layer": "Licensed premises (055b5c2c)"}, "group_by": "type", "polygons": {"layer": "Patrol beats (8c67e28f)"}}
Summarize within
What this analysis is. Summarize within: Count and aggregate the features inside each polygon (or bin), proportionally for lines and polygons 44. In ArcGIS it is Summarize Within or Aggregate Points; in QGIS, native:countpointsinpolygon or native:sumlinelengths 44.
Why it was run on this data. Count CCTV cameras inside each feature of Patrol beats by ptz; the counts map as a choropleth (natural breaks, sequential colors) 45.
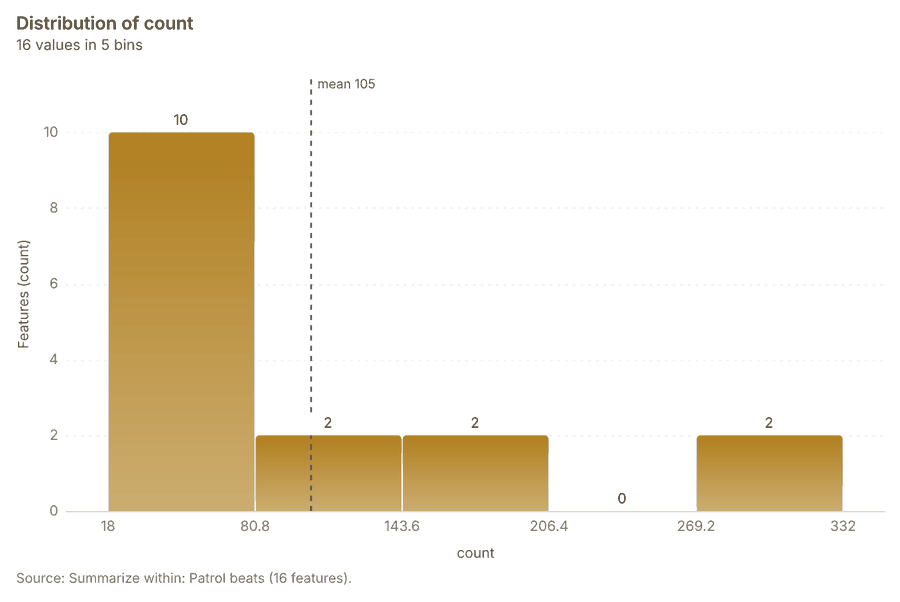
What it found. Summarize within on Incidents, Patrol beats: Summarize within: 1 layer saved: Summarize within: Patrol beats (16 features) 121450. It reported result, count 16; result, elapsed ms 2; billing, cost 0.04394; billing, list price 0.04394; billing, upstream cost 0 50.
| Result | Value |
|---|---|
| result, count | 16 |
| result, elapsed ms | 2 |
| billing, cost | 0.04394 |
| billing, list price | 0.04394 |
| billing, upstream cost | 0 |
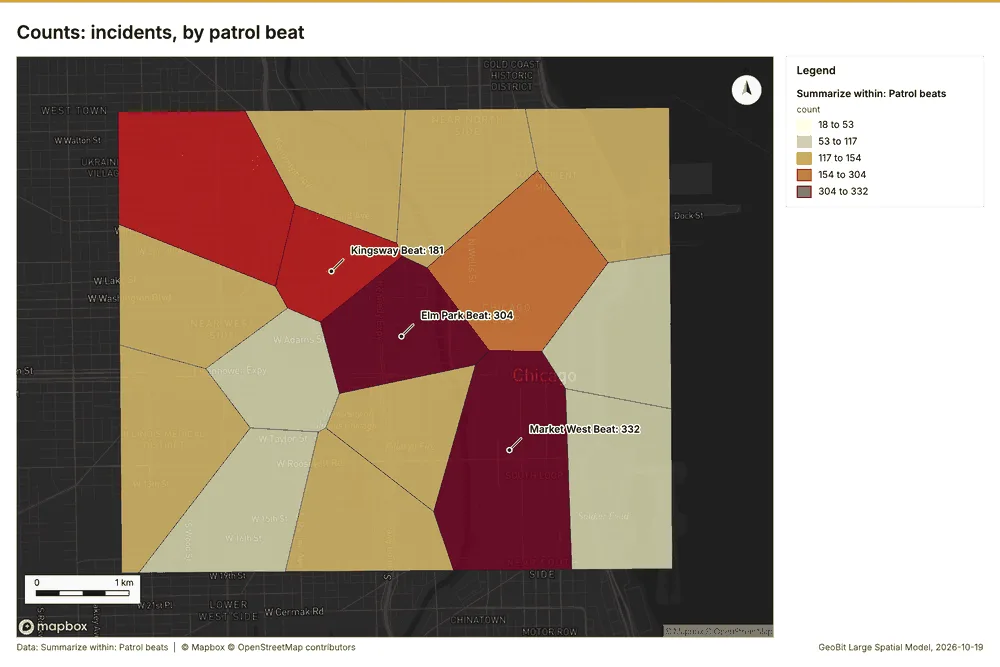
What the map shows. The map draws Summarize within: Patrol beats by count in 5 classes: 18 to 53, 53 to 117, 117 to 154, 154 to 304, 304 to 332 51. It draws 16 features 51. It covers longitude -87.694 to -87.594 and latitude 41.85 to 41.907, at about 1:34,270 51.
Findings
- Evidenced: Summarize within on Incidents, Patrol beats: Summarize within: 1 layer saved: Summarize within: Patrol beats (16 features) 121450.
- Evidenced: It reported result, count 16; result, elapsed ms 2; billing, cost 0.04394; billing, list price 0.04394; billing, upstream cost 0 50.
Tool gp_summarize_within; parameters {"stats": [{"stat": "sum", "field": "severity"}], "project": "fe9df6b9-8a15-4264-946b-4b37b8dbb89d", "features": {"layer": "Incidents (36ad5f7c)"}, "group_by": "category", "polygons": {"layer": "Patrol beats (8c67e28f)"}}
Period change
What this analysis is. Period change: Counts or sums per period (week over week, month over month, any two periods, or before and after a date), per area, per H3 cell or in total, with the places of largest rise and fall and a significance note 52. In ArcGIS it is Summarize Percent Change (Crime Analysis) or Change Point Detection 52.
Why it was run on this data. Incidents carry dates in 'reported_at' over 52 weeks: the count per week, week over week, with the places of largest rise and fall per feature of Patrol beats and whether the change is beyond chance 53.
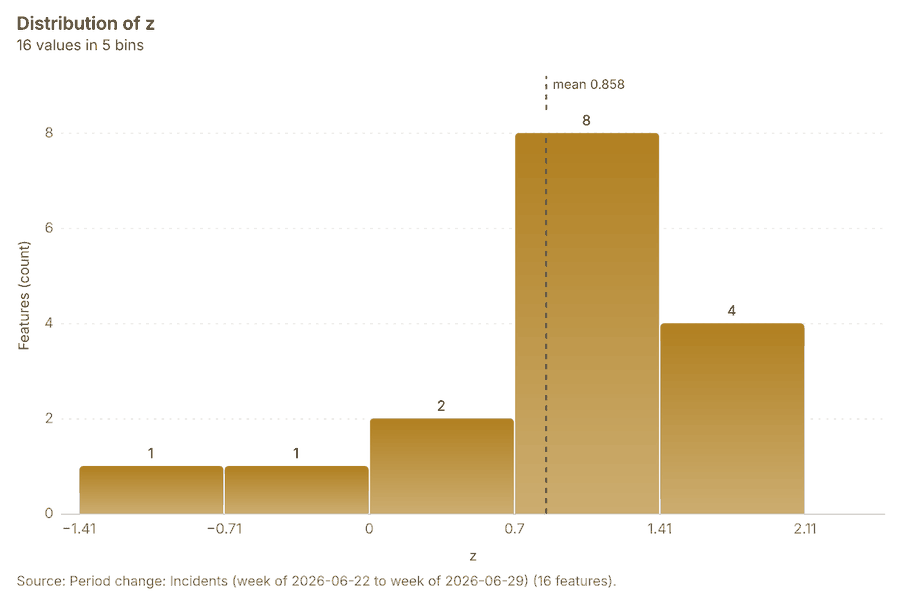
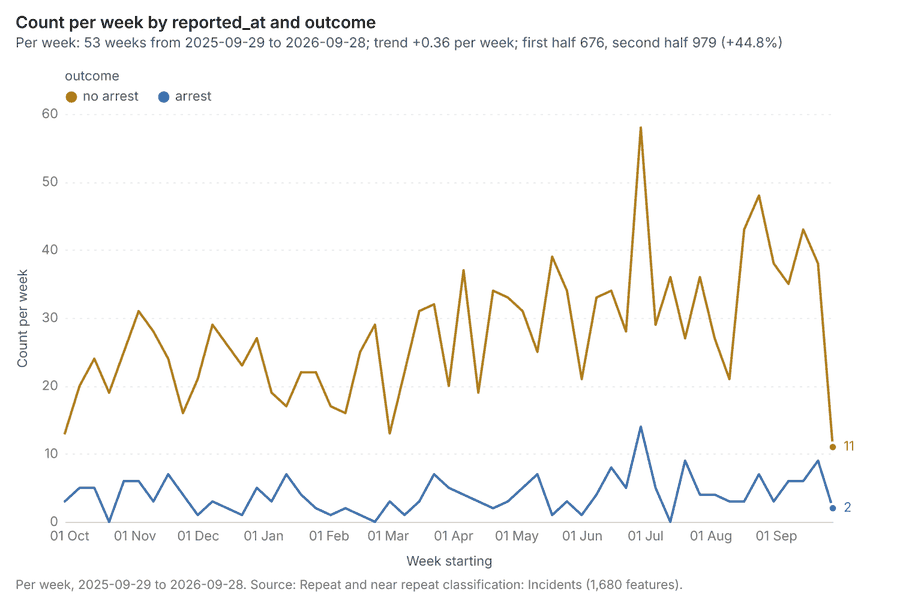
What it found. Period change on Patrol beats, Incidents produced Period change: Incidents (week of 2026-06-22 to week of 2026-06-29) (16 features) 781214. Incidents: count per week shows a trend of +0.36 per week; the second half of its weeks has 979 against 676 in the first (+44.8%) 55. The chart Incidents: week of 2026-06-22 to week of 2026-06-29 by place is drawn from 30 rows 56. The chart Period change: Incidents (week of 2026-06-22 to week of 2026-06-29) is drawn from 5 rows 57.
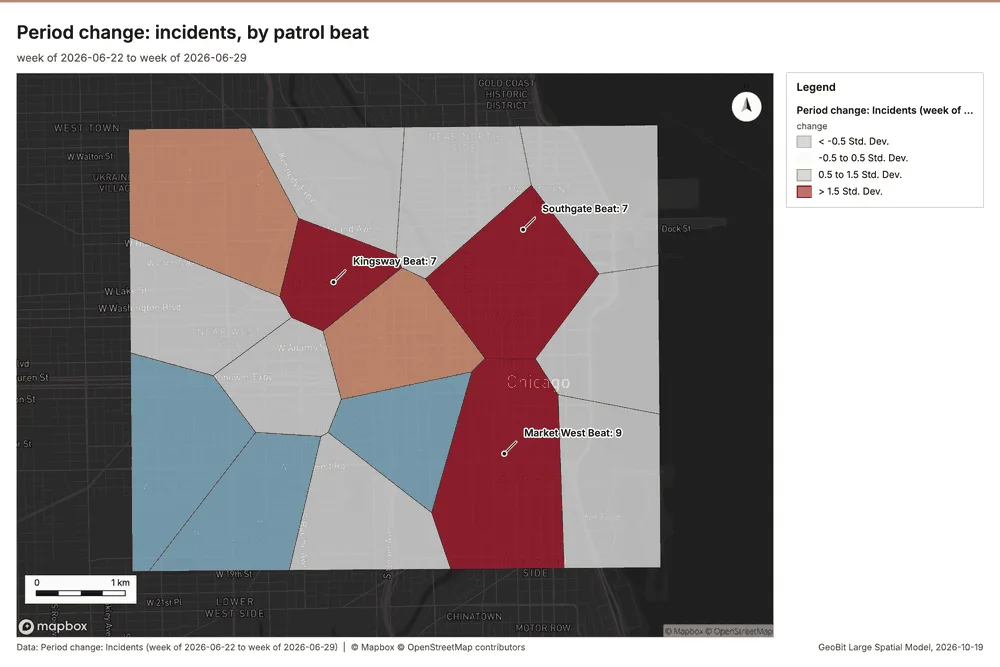
What the map shows. The map draws Period change: Incidents (week of 2026-06-22 to week of 2026-06-29) by change in 4 classes: < -0.5 Std; Dev, -0.5 to 0.5 Std; Dev, 0.5 to 1.5 Std; Dev, > 1.5 Std; Dev 54. It draws 16 features 54. It covers longitude -87.696 to -87.592 and latitude 41.85 to 41.907, at about 1:35,725 54.
Findings
- Evidenced: Period change on Patrol beats, Incidents produced Period change: Incidents (week of 2026-06-22 to week of 2026-06-29) (16 features) 781214.
- Evidenced: Incidents: count per week shows a trend of +0.36 per week; the second half of its weeks has 979 against 676 in the first (+44.8%) 55.
- Evidenced: The chart Incidents: week of 2026-06-22 to week of 2026-06-29 by place is drawn from 30 rows 56.
- Evidenced: The chart Period change: Incidents (week of 2026-06-22 to week of 2026-06-29) is drawn from 5 rows 57.
Tool gp_period_change; parameters {"by": "area", "areas": {"layer": "Patrol beats (8c67e28f)"}, "period": "week", "project": "fe9df6b9-8a15-4264-946b-4b37b8dbb89d", "features": {"layer": "Incidents (36ad5f7c)"}, "area_field": "name", "time_field": "reported_at"}
Period change
What this analysis is. Period change: Counts or sums per period (week over week, month over month, any two periods, or before and after a date), per area, per H3 cell or in total, with the places of largest rise and fall and a significance note 52. In ArcGIS it is Summarize Percent Change (Crime Analysis) or Change Point Detection 52.
Why it was run on this data. Incidents carry dates in 'reported_at' over 52 weeks: the count per week, week over week, with the places of largest rise and fall per feature of Patrol beats and whether the change is beyond chance 53.
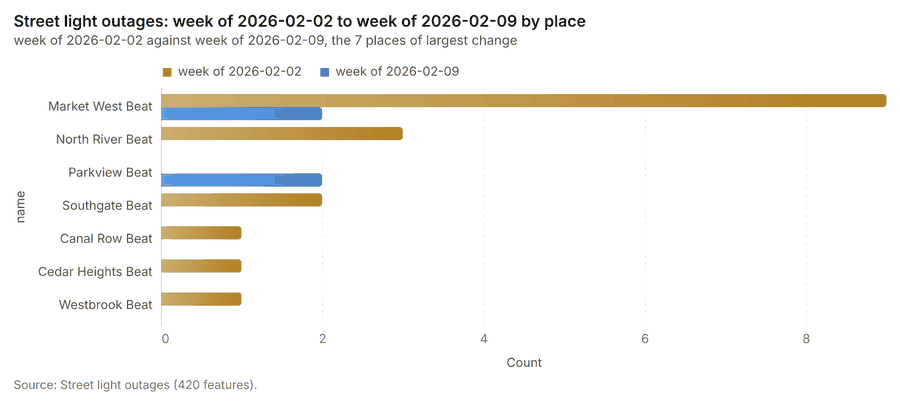
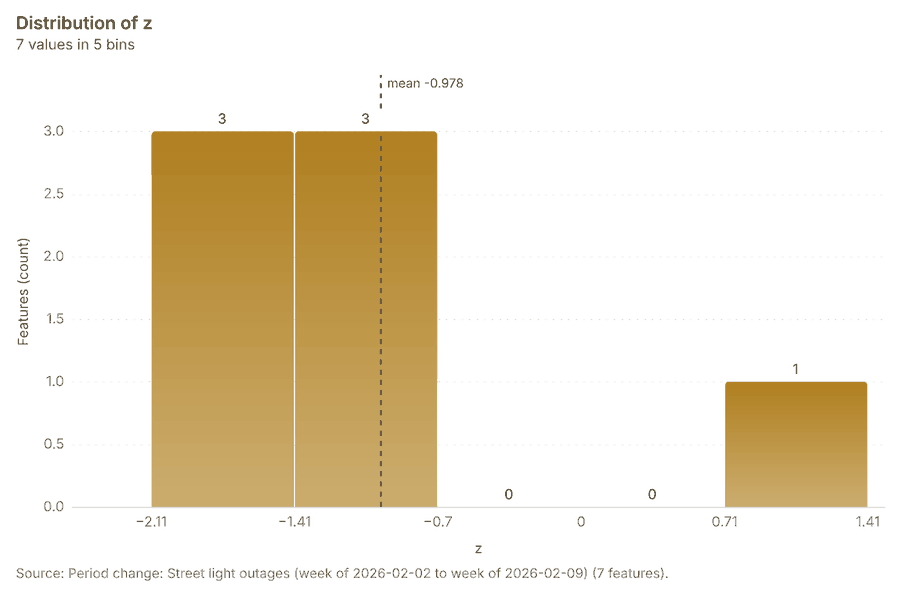
What it found. Period change on Patrol beats, Street light outages produced Period change: Street light outages (week of 2026-02-02 to week of 2026-02-09) (7 features) 9101314. Street light outages: count per week shows a trend of -0.0337 per week; the second half of its weeks has 183 against 224 in the first (-18.3%) 59. The chart Street light outages: week of 2026-02-02 to week of 2026-02-09 by place is drawn from 14 rows 60. The chart Period change: Street light outages (week of 2026-02-02 to week of 2026-02-09) is drawn from 5 rows 61.
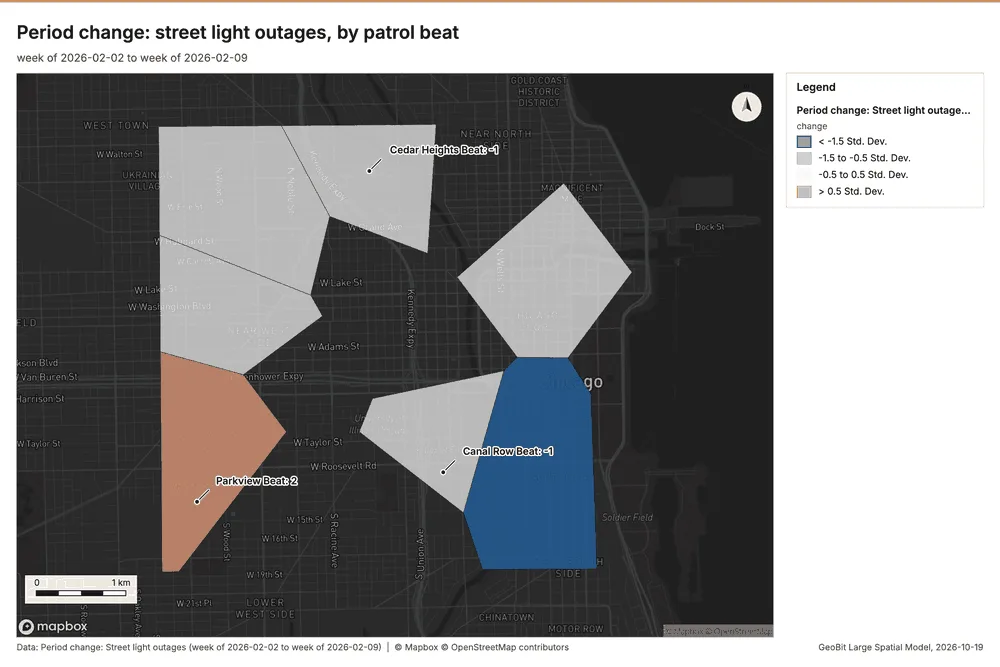
What the map shows. The map draws Period change: Street light outages (week of 2026-02-02 to week of 2026-02-09) by change in 4 classes: < -1.5 Std; Dev, -1.5 to -0.5 Std; Dev, -0.5 to 0.5 Std; Dev, > 0.5 Std; Dev 58. It draws 7 features 58. It covers longitude -87.7 to -87.597 and latitude 41.85 to 41.907, at about 1:35,479 58.
Findings
- Evidenced: Period change on Patrol beats, Street light outages produced Period change: Street light outages (week of 2026-02-02 to week of 2026-02-09) (7 features) 9101314.
- Evidenced: Street light outages: count per week shows a trend of -0.0337 per week; the second half of its weeks has 183 against 224 in the first (-18.3%) 59.
- Evidenced: The chart Street light outages: week of 2026-02-02 to week of 2026-02-09 by place is drawn from 14 rows 60.
- Evidenced: The chart Period change: Street light outages (week of 2026-02-02 to week of 2026-02-09) is drawn from 5 rows 61.
Tool gp_period_change; parameters {"by": "area", "areas": {"layer": "Patrol beats (8c67e28f)"}, "period": "week", "project": "fe9df6b9-8a15-4264-946b-4b37b8dbb89d", "features": {"layer": "Street light outages (a7218535)"}, "area_field": "name", "time_field": "reported_at"}
Calculate density
What this analysis is. Calculate density: Kernel density per square kilometer on a grid 62. In ArcGIS it is Calculate Density or Kernel Density; in QGIS, native:heatmapkerneldensityestimation 62.
Why it was run on this data. 120 points in Licensed premises: a density surface shows where they concentrate 63. Measured: Licensed premises are clustered (nearest-neighbor ratio 0.85, z = -3.2), median spacing 121 m 63.
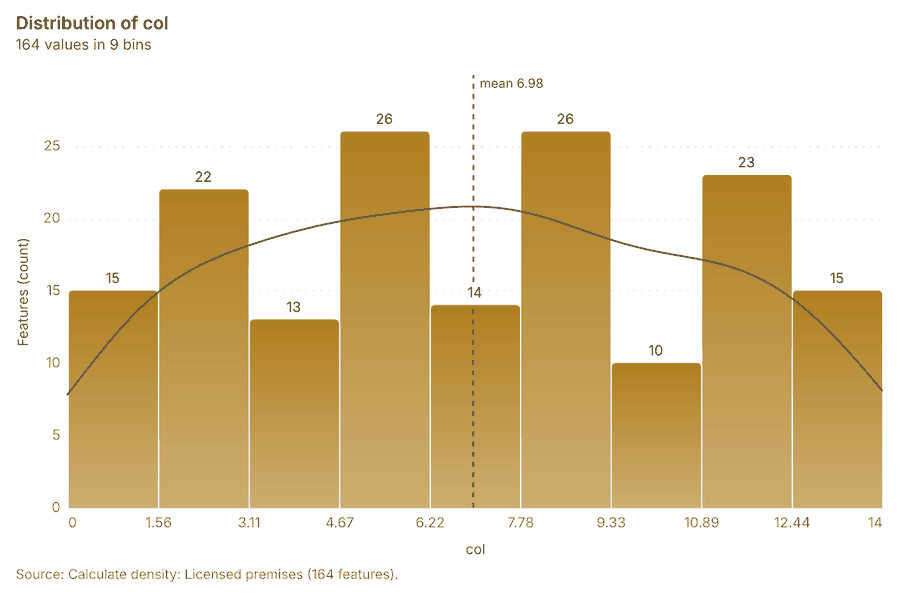
What it found. Calculate density on Licensed premises: Calculate density: 1 layer saved: Calculate density: Licensed premises (164 features) 1764. It reported result, count 164; result, elapsed ms 4; result, bandwidth m 1,000; result, cell size m 500; result, excluded null 0; result, max density per km2 42.62 64.
| Result | Value |
|---|---|
| result, count | 164 |
| result, elapsed ms | 4 |
| result, bandwidth m | 1,000 |
| result, cell size m | 500 |
| result, excluded null | 0 |
| result, max density per km2 | 42.62 |
| billing, cost | 0.0524 |
| billing, list price | 0.0524 |
| billing, upstream cost | 0 |
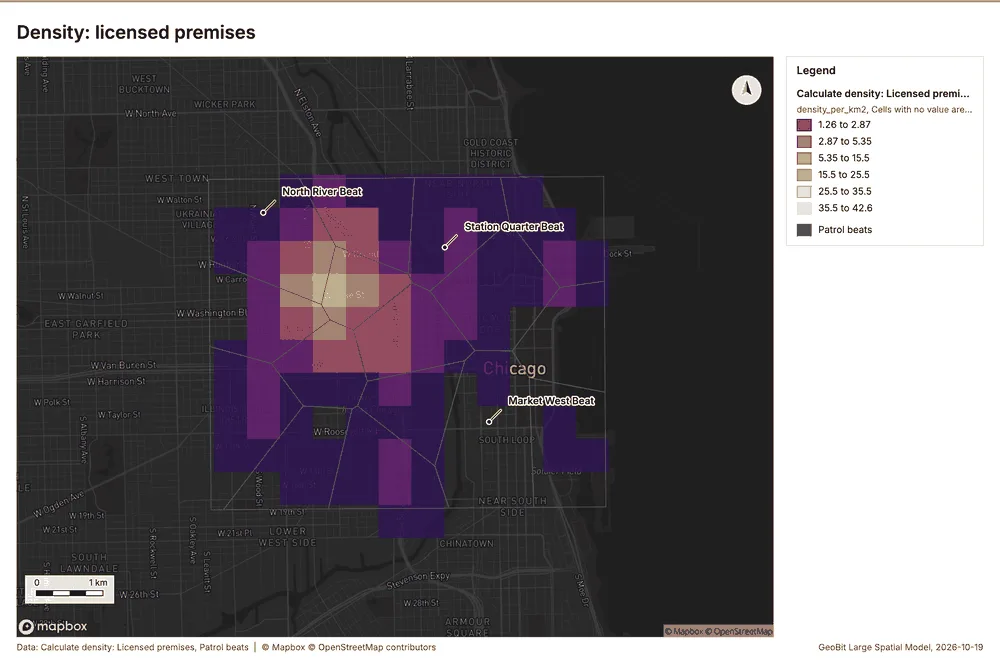
What the map shows. The map draws Calculate density: Licensed premises by density_per_km2 in 6 classes: 1.26 to 2.87, 2.87 to 5.35, 5.35 to 15.5, 15.5 to 25.5, 25.5 to 35.5, 35.5 to 42.6 65. The map draws Patrol beats with one symbol 65. It draws 180 features 65. It covers longitude -87.716 to -87.577 and latitude 41.839 to 41.918, at about 1:47,798 65.
Findings
- Evidenced: Calculate density on Licensed premises: Calculate density: 1 layer saved: Calculate density: Licensed premises (164 features) 1764.
- Evidenced: It reported result, count 164; result, elapsed ms 4; result, bandwidth m 1,000; result, cell size m 500; result, excluded null 0; result, max density per km2 42.62 64.
Tool gp_calculate_density; parameters {"kernel": "quartic", "project": "fe9df6b9-8a15-4264-946b-4b37b8dbb89d", "features": {"layer": "Licensed premises (055b5c2c)"}, "bandwidth_m": 1000.0, "cell_size_m": 500.0}
Calculate density
What this analysis is. Calculate density: Kernel density per square kilometer on a grid 62. In ArcGIS it is Calculate Density or Kernel Density; in QGIS, native:heatmapkerneldensityestimation 62.
Why it was run on this data. 1680 points in Incidents: a density surface shows where they concentrate 66. Measured: Incidents are clustered (nearest-neighbor ratio 0.73, z = -21.0), median spacing 34.3 m 66.
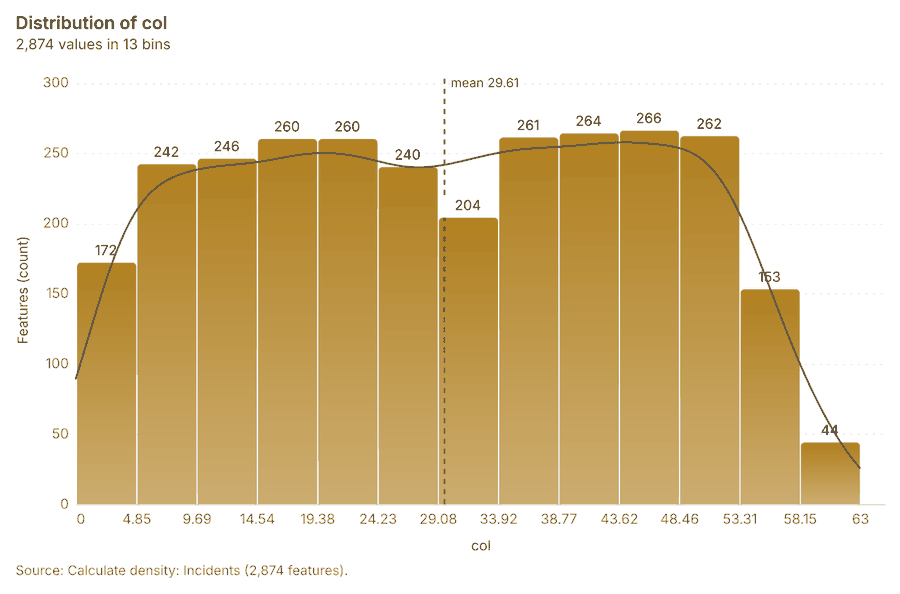
What it found. Calculate density on Incidents: Calculate density: 1 layer saved: Calculate density: Incidents (2874 features) 1267. It reported result, count 2,874; result, elapsed ms 50; result, bandwidth m 200; result, cell size m 100; result, excluded null 0; result, max density per km2 1,347 67.
| Result | Value |
|---|---|
| result, count | 2,874 |
| result, elapsed ms | 50 |
| result, bandwidth m | 200 |
| result, cell size m | 100 |
| result, excluded null | 0 |
| result, max density per km2 | 1,347 |
| billing, cost | 0.0836 |
| billing, list price | 0.0836 |
| billing, upstream cost | 0 |
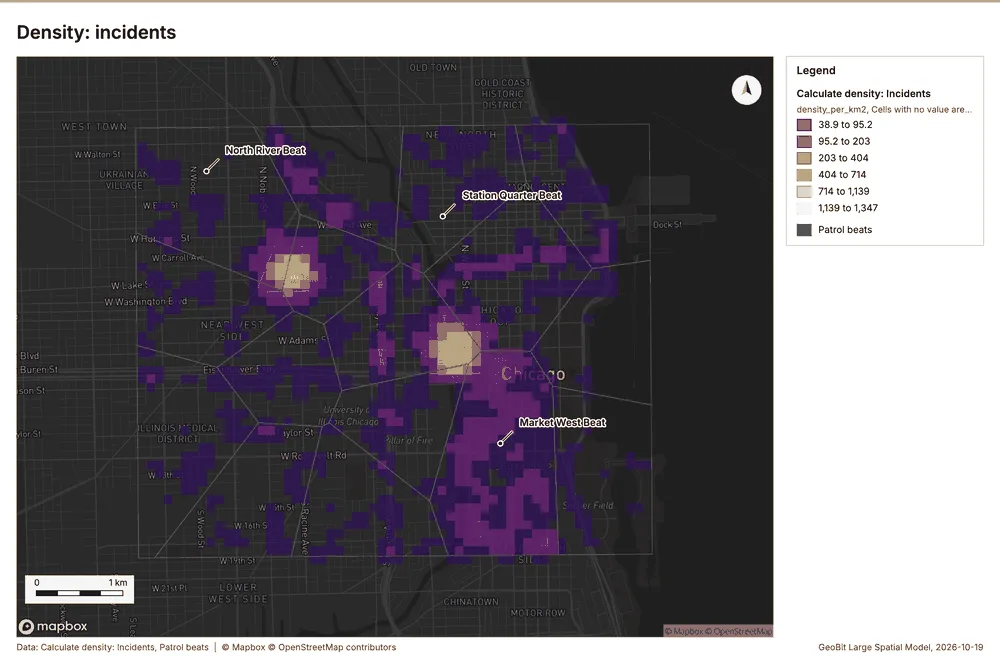
What the map shows. The map draws Calculate density: Incidents by density_per_km2 in 6 classes: 38.9 to 95.2, 95.2 to 203, 203 to 404, 404 to 714, 714 to 1,139, 1,139 to 1,347 68. The map draws Patrol beats with one symbol 68. It draws 2,890 features 68. It covers longitude -87.697 to -87.591 and latitude 41.848 to 41.909, at about 1:36,730 68.
Findings
- Evidenced: Calculate density on Incidents: Calculate density: 1 layer saved: Calculate density: Incidents (2874 features) 1267.
- Evidenced: It reported result, count 2,874; result, elapsed ms 50; result, bandwidth m 200; result, cell size m 100; result, excluded null 0; result, max density per km2 1,347 67.
Tool gp_calculate_density; parameters {"kernel": "quartic", "project": "fe9df6b9-8a15-4264-946b-4b37b8dbb89d", "features": {"layer": "Incidents (36ad5f7c)"}, "bandwidth_m": 200.0, "cell_size_m": 100.0}
Calculate density
What this analysis is. Calculate density: Kernel density per square kilometer on a grid 62. In ArcGIS it is Calculate Density or Kernel Density; in QGIS, native:heatmapkerneldensityestimation 62.
Why it was run on this data. 420 points in Street light outages: a density surface shows where they concentrate 69. Measured: Street light outages are clustered (nearest-neighbor ratio 0.88, z = -4.9), median spacing 74.9 m 69.
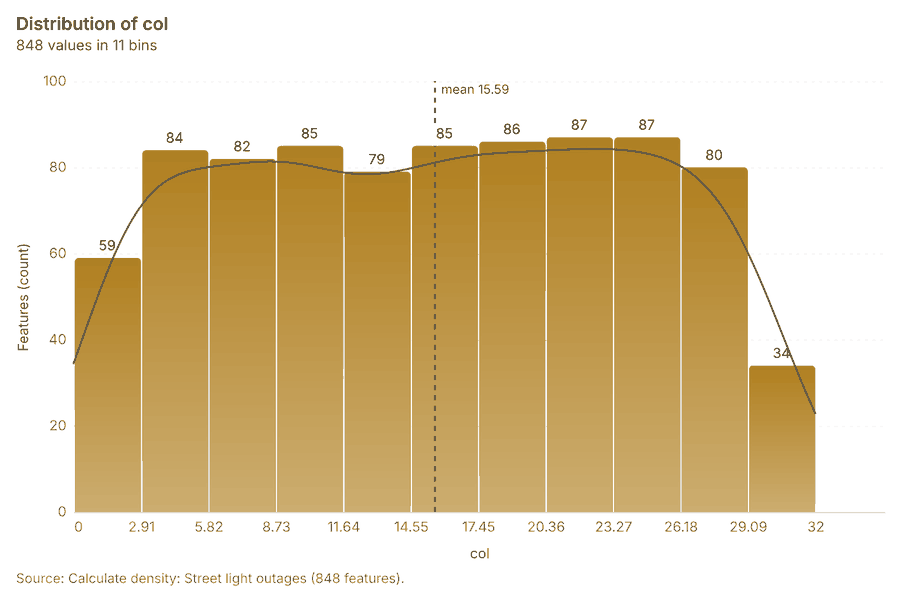
What it found. Calculate density on Street light outages: Calculate density: 1 layer saved: Calculate density: Street light outages (848 features) 1370. It reported result, count 848; result, elapsed ms 15; result, bandwidth m 500; result, cell size m 200; result, excluded null 0; result, max density per km2 107.5 70.
| Result | Value |
|---|---|
| result, count | 848 |
| result, elapsed ms | 15 |
| result, bandwidth m | 500 |
| result, cell size m | 200 |
| result, excluded null | 0 |
| result, max density per km2 | 107.5 |
| billing, cost | 0.0584 |
| billing, list price | 0.0584 |
| billing, upstream cost | 0 |
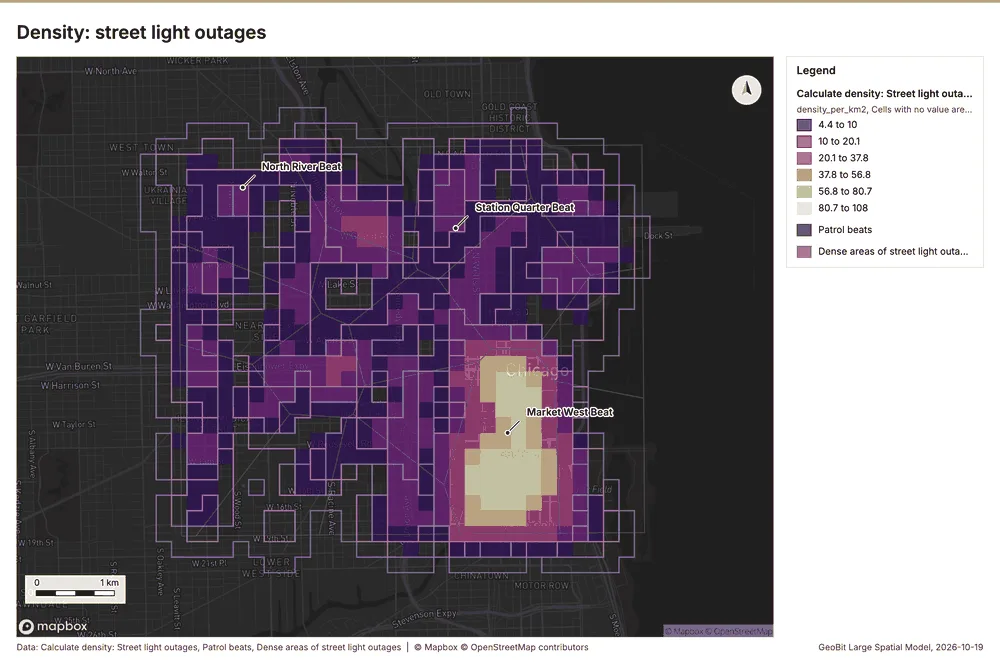
What the map shows. The map draws Calculate density: Street light outages by density_per_km2 in 6 classes: 4.4 to 10, 10 to 20.1, 20.1 to 37.8, 37.8 to 56.8, 56.8 to 80.7, 80.7 to 108 71. The map draws Patrol beats with one symbol 71. The map draws Dense areas of street light outages with one symbol 71. It draws 869 features 71. It covers longitude -87.706 to -87.588 and latitude 41.845 to 41.912, at about 1:40,754 71.
Findings
- Evidenced: Calculate density on Street light outages: Calculate density: 1 layer saved: Calculate density: Street light outages (848 features) 1370.
- Evidenced: It reported result, count 848; result, elapsed ms 15; result, bandwidth m 500; result, cell size m 200; result, excluded null 0; result, max density per km2 107.5 70.
Tool gp_calculate_density; parameters {"kernel": "quartic", "project": "fe9df6b9-8a15-4264-946b-4b37b8dbb89d", "features": {"layer": "Street light outages (a7218535)"}, "bandwidth_m": 500.0, "cell_size_m": 200.0}
Hot spots
What this analysis is. Hot spot analysis: Getis-Ord Gi* hot and cold spots with z-scores, p-values and confidence bins 20. In ArcGIS it is Find Hot Spots or Hot Spot Analysis (Getis-Ord Gi*); in QGIS, qgis:hotspot (plugin) 20.
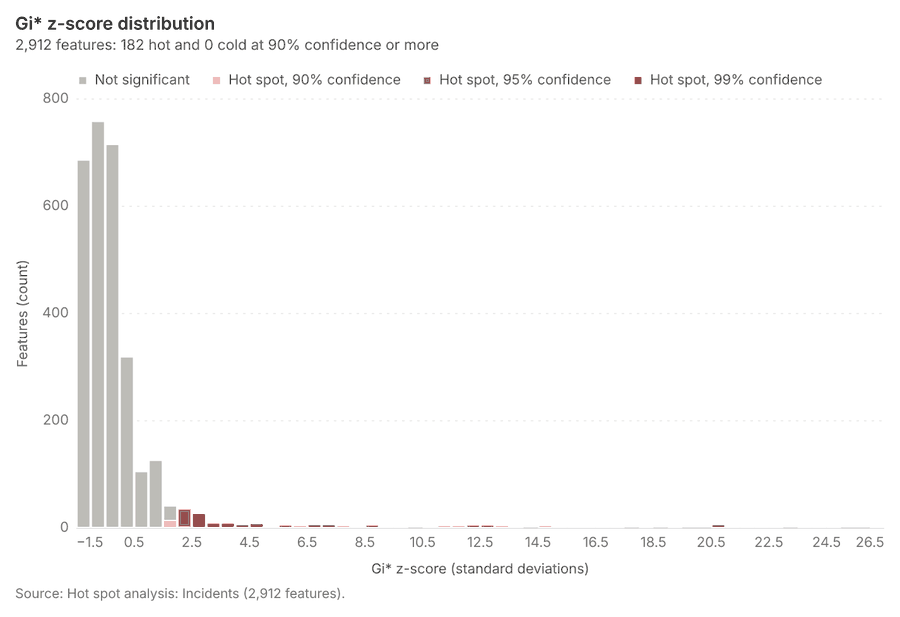
Why it was run on this data. 1680 points: Getis-Ord Gi* tests whether the concentrations in Incidents are statistically significant 72. Measured: Incidents are clustered (nearest-neighbor ratio 0.73, z = -21.0), median spacing 34.3 m 72. Cells of 100 m and a band of 200 m from the measured spacing 72.
What it found. Hot spots on Incidents: Hot spot analysis: 1 layer saved: Hot spot analysis: Incidents (2912 features) 1273. It reported result, bins 2,912; result, count 2,912; result, elapsed ms 100; result, cell size m 100; result, incidents used 1,680; result, distance band m 200 73.
| Result | Value |
|---|---|
| result, bins | 2,912 |
| result, count | 2,912 |
| result, elapsed ms | 100 |
| result, cell size m | 100 |
| result, incidents used | 1,680 |
| result, distance band m | 200 |
| billing, cost | 0.0836 |
| billing, list price | 0.0836 |
| billing, upstream cost | 0 |
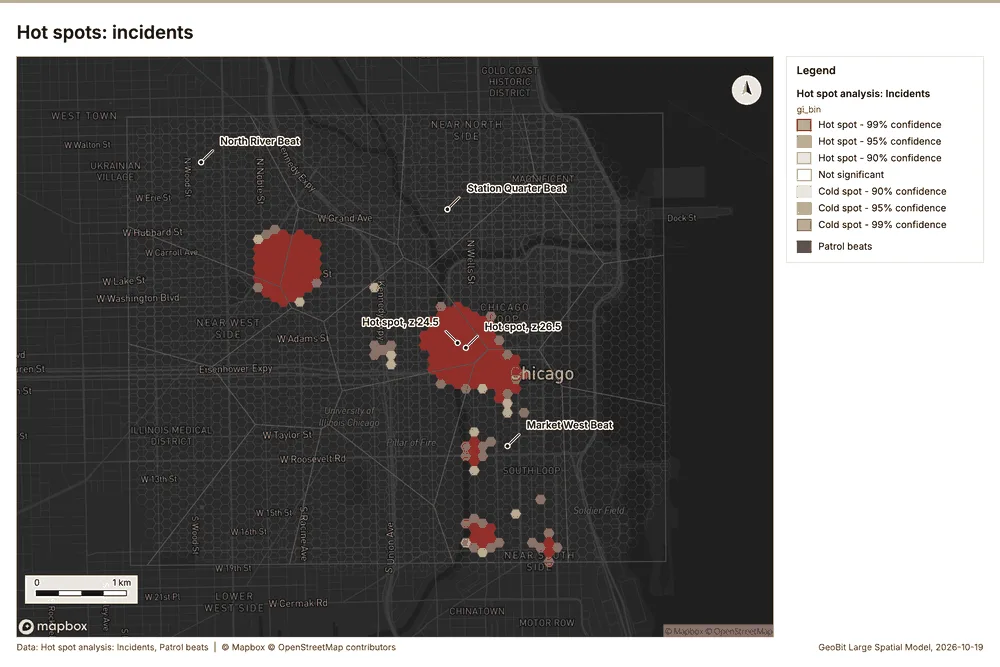
What the map shows. The map draws Hot spot analysis: Incidents by gi_bin in 7 classes: Hot spot - 99% confidence, Hot spot - 95% confidence, Hot spot - 90% confidence, Not significant, Cold spot - 90% confidence, Cold spot - 95% confidence and 1 more 74. The map draws Patrol beats with one symbol 74. It draws 2,928 features 74. It covers longitude -87.695 to -87.593 and latitude 41.849 to 41.907, at about 1:35,233 74.
Findings
- Evidenced: Hot spots on Incidents: Hot spot analysis: 1 layer saved: Hot spot analysis: Incidents (2912 features) 1273.
- Evidenced: It reported result, bins 2,912; result, count 2,912; result, elapsed ms 100; result, cell size m 100; result, incidents used 1,680; result, distance band m 200 73.
Tool gp_hot_spots; parameters {"project": "fe9df6b9-8a15-4264-946b-4b37b8dbb89d", "features": {"layer": "Incidents (36ad5f7c)"}, "aggregation": "hexagon", "cell_size_m": 100.0, "distance_band_m": 200.0}
Near repeat
What this analysis is. Repeat and near repeat classification: Classify incidents as originators, repeats (same place) or near repeats within a distance and time window, with a Knox test table 75. In ArcGIS it is Repeat and Near Repeat Classification or Near Repeat Calculator 75.
Why it was run on this data. Near repeat analysis tests whether Incidents close in space also follow each other within 30 days 76.
What it found. The gp\_near\_repeat tool processed the Incidents data 12 and generated results covering 30 days 77. The tool identified 1,680 results 77, involving 152 chains 77. This analysis calculated pairs linked involving 1,357 pairs 77 over a distance of 100 m 77. The total cost for this process was 0.1004 77.
| Result | Value |
|---|---|
| result, days | 30 |
| result, count | 1,680 |
| result, chains | 152 |
| result, distance m | 100 |
| result, elapsed ms | 39 |
| result, pairs linked | 1,357 |
| billing, cost | 0.1004 |
| billing, list price | 0.1004 |
| billing, upstream cost | 0 |
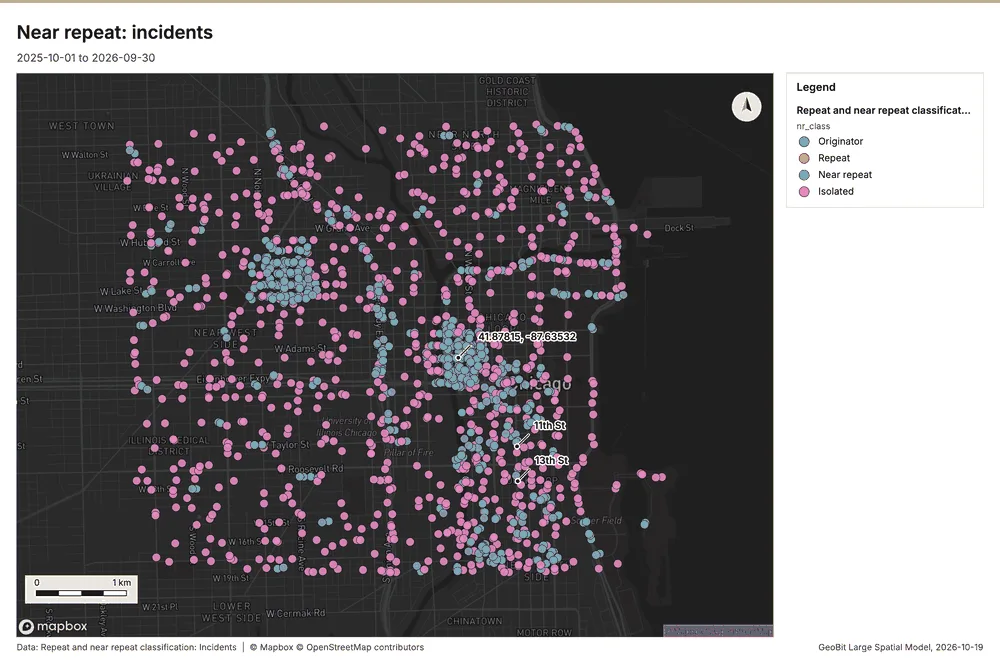
What the map shows. The map draws Repeat and near repeat classification: Incidents by nr_class in 4 classes: Originator, Repeat, Near repeat, Isolated 78. It draws 1,680 features 78. It covers longitude -87.695 to -87.593 and latitude 41.85 to 41.907, at about 1:35,233 78.
Findings
- Evidenced: Near repeat on Incidents: Repeat and near repeat classification: 1 layer saved: Repeat and near repeat classification: Incidents (1680 features) 1277.
- Evidenced: It reported result, days 30; result, count 1,680; result, chains 152; result, distance m 100; result, elapsed ms 39; result, pairs linked 1,357 77.
Tool gp_near_repeat; parameters {"days": 30, "project": "fe9df6b9-8a15-4264-946b-4b37b8dbb89d", "features": {"layer": "Incidents (36ad5f7c)"}, "distance_m": 100.0, "time_field": "reported_at"}
What follows from the results
Hot cells inside each cluster of licensed premises, from Hot spot analysis: Incidents and Find point clusters: cluster hulls: 1 of 3 clusters hold hot spot cells; cluster 0 holds the most (53) 797336. Change beside the counts per patrol beat, from Period change: Incidents (week of 2026-06-22 to week of 2026-06-29) and Summarize within: Patrol beats: the busiest area, Market West Beat (332 in all), changed by +9 87750. Change of incidents where density is high, from Period change: Incidents (week of 2026-06-22 to week of 2026-06-29) and Calculate density: Street light outages: the largest rise (+9, Market West Beat) is where density averages 58.82 per square kilometer 92770. Hot cells of CCTV cameras per patrol beat, from Hot spot analysis: CCTV cameras: 9 of 16 areas hold hot spot cells; Southgate Beat holds the most (5) 9722. Nearest police station to each cluster of licensed premises, from Find point clusters: cluster hulls: the 3 clusters lie 836 to 972 m from the nearest facility (Central District Station and others) 10336. Dense areas of street light outages, from Calculate density: Street light outages: the densest of five classes joins 170 cells into one area 10970. Change of street light outages per patrol beat, from Period change: Street light outages (week of 2026-02-02 to week of 2026-02-09): Parkview Beat rose the most (+2) and Market West Beat fell the most (-7) 1129.
Findings
- Evidenced: Hot cells inside each cluster of licensed premises, from Hot spot analysis: Incidents and Find point clusters: cluster hulls: 1 of 3 clusters hold hot spot cells; cluster 0 holds the most (53) 797336.
- Evidenced: Change beside the counts per patrol beat, from Period change: Incidents (week of 2026-06-22 to week of 2026-06-29) and Summarize within: Patrol beats: the busiest area, Market West Beat (332 in all), changed by +9 87750.
- Evidenced: Change of incidents where density is high, from Period change: Incidents (week of 2026-06-22 to week of 2026-06-29) and Calculate density: Street light outages: the largest rise (+9, Market West Beat) is where density averages 58.82 per square kilometer 92770.
- Evidenced: Hot cells of CCTV cameras per patrol beat, from Hot spot analysis: CCTV cameras: 9 of 16 areas hold hot spot cells; Southgate Beat holds the most (5) 9722.
- Evidenced: Nearest police station to each cluster of licensed premises, from Find point clusters: cluster hulls: the 3 clusters lie 836 to 972 m from the nearest facility (Central District Station and others) 10336.
- Evidenced: Dense areas of street light outages, from Calculate density: Street light outages: the densest of five classes joins 170 cells into one area 10970.
- Evidenced: Change of street light outages per patrol beat, from Period change: Street light outages (week of 2026-02-02 to week of 2026-02-09): Parkview Beat rose the most (+2) and Market West Beat fell the most (-7) 1129.
Hot cells inside each cluster of licensed premises
What this analysis is. Summarize within: Count and aggregate the features inside each polygon (or bin), proportionally for lines and polygons 44. In ArcGIS it is Summarize Within or Aggregate Points; in QGIS, native:countpointsinpolygon or native:sumlinelengths 44.
Why it was run on this data. Count CCTV cameras inside each feature of Patrol beats by ptz; the counts map as a choropleth (natural breaks, sequential colors) 45.
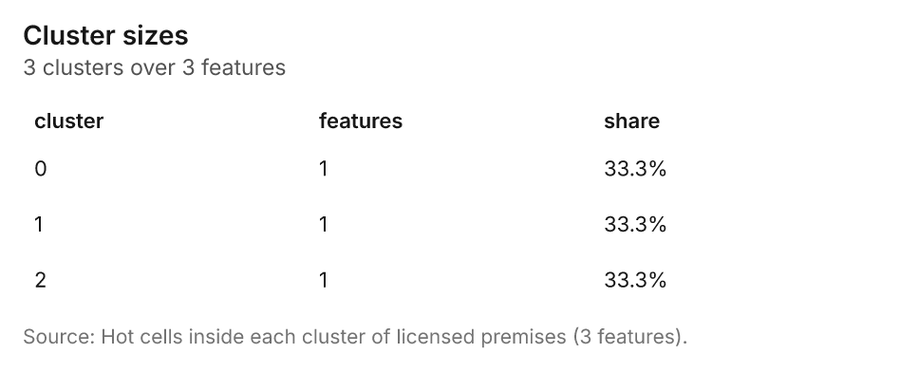
What it found. The gp_summarize_within analysis saved one layer called Hot cells inside each cluster of licensed premises with 3 features 79.
| Result | Value |
|---|---|
| result, count | 3 |
| result, elapsed ms | 6 |
| billing, cost | 0.0683 |
| billing, list price | 0.0683 |
| billing, upstream cost | 0 |
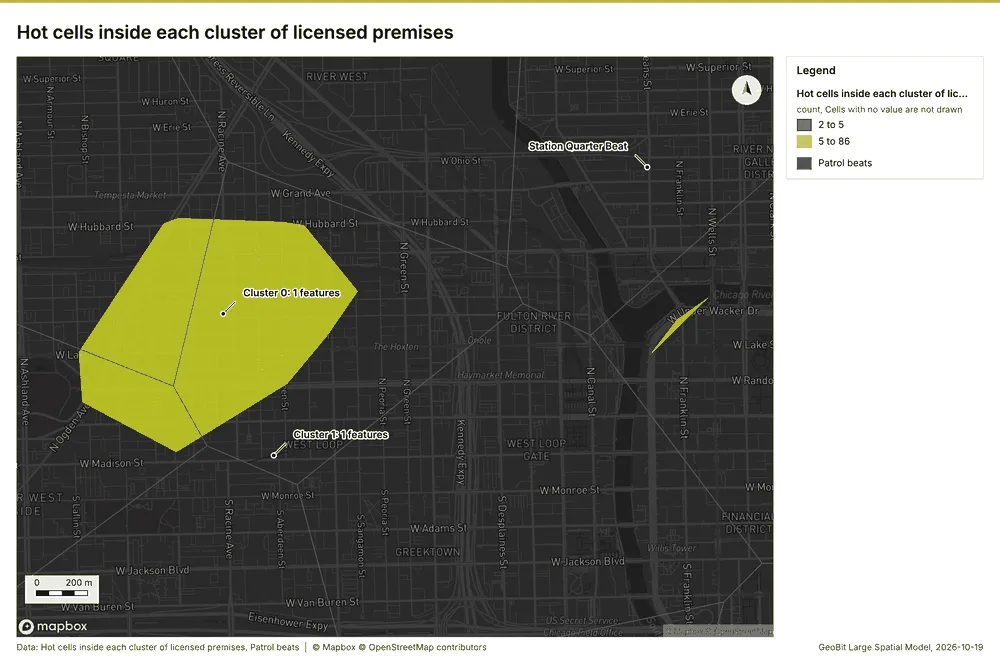
What the map shows. The map draws Hot cells inside each cluster of licensed premises by count in 2 classes: 2 to 5, 5 to 86 83. The map draws Patrol beats with one symbol 83. It draws 19 features 83. It covers longitude -87.667 to -87.631 and latitude 41.875 to 41.896, at about 1:12,455 83.
Findings
- Evidenced: Summarize within on Hot spot analysis: Incidents, Find point clusters: cluster hulls produced Hot cells inside each cluster of licensed premises (3 features) 79808182.
- Evidenced: It reported result, count 3; result, elapsed ms 6; billing, cost 0.0683; billing, list price 0.0683; billing, upstream cost 0 79.
- Evidenced: The chart Hot cells inside each cluster of licensed premises is drawn from 3 rows 84.
Tool gp_summarize_within; parameters {"project": "fe9df6b9-8a15-4264-946b-4b37b8dbb89d", "features": {"layer": "Hot spot analysis: Incidents (8382f930)"}, "group_by": "gi_bin", "polygons": {"layer": "Find point clusters: cluster hulls (4dfef6fb)"}, "output_name": "Hot cells inside each cluster of licensed premises"}
Change beside the counts per patrol beat
What this analysis is. Spatial join: Attach attributes (or aggregates) of matching features from another layer, by location, distance, time and attributes 85. In ArcGIS it is Join Features or Spatial Join; in QGIS, native:joinattributesbylocation or native:joinbylocationsummary 85.
Why it was run on this data. It was run toward the goal "Describe the project Sample: Public safety, Chicago: run the analyses that tell the most about its data, draw every result, and write a cited report" 86.
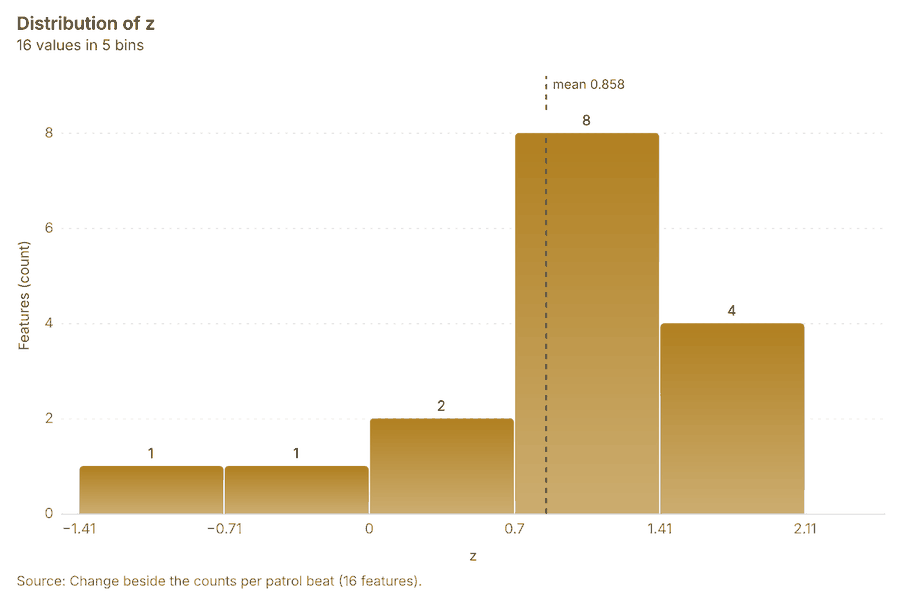
What it found. Spatial join on Summarize within: Patrol beats, Period change: Incidents (week of 2026-06-22 to week of 2026-06-29) produced Change beside the counts per patrol beat (16 features) 8878889. It reported result, count 16; result, elapsed ms 1; billing, cost 0.01066; billing, list price 0.01066; billing, upstream cost 0 87. The chart Change beside the counts per patrol beat is drawn from 5 rows 91.
| Result | Value |
|---|---|
| result, count | 16 |
| result, elapsed ms | 1 |
| billing, cost | 0.01066 |
| billing, list price | 0.01066 |
| billing, upstream cost | 0 |
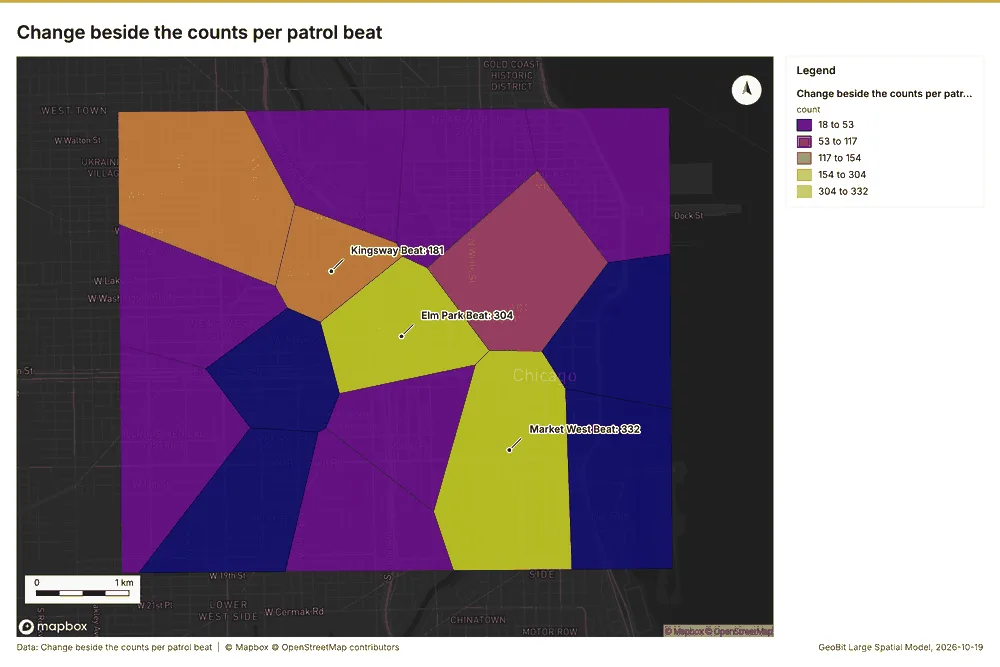
What the map shows. The map draws Change beside the counts per patrol beat by count in 5 classes: 18 to 53, 53 to 117, 117 to 154, 154 to 304, 304 to 332 90. It draws 16 features 90. It covers longitude -87.694 to -87.594 and latitude 41.85 to 41.907, at about 1:34,270 90.
Findings
- Evidenced: Spatial join on Summarize within: Patrol beats, Period change: Incidents (week of 2026-06-22 to week of 2026-06-29) produced Change beside the counts per patrol beat (16 features) 8878889.
- Evidenced: It reported result, count 16; result, elapsed ms 1; billing, cost 0.01066; billing, list price 0.01066; billing, upstream cost 0 87.
- Evidenced: The chart Change beside the counts per patrol beat is drawn from 5 rows 91.
Tool gp_spatial_join; parameters {"join": {"layer": "Summarize within: Patrol beats (31bedf68)"}, "fields": ["count"], "target": {"layer": "Period change: Incidents (week of 2026-06-22 to week of 2026-06-29) (1e0726ac)"}, "project": "fe9df6b9-8a15-4264-946b-4b37b8dbb89d", "predicate": "largest_overlap", "output_name": "Change beside the counts per patrol beat"}
Change of incidents where density is high
What this analysis is. Spatial join: Attach attributes (or aggregates) of matching features from another layer, by location, distance, time and attributes 85. In ArcGIS it is Join Features or Spatial Join; in QGIS, native:joinattributesbylocation or native:joinbylocationsummary 85.
Why it was run on this data. It was run toward the goal "Describe the project Sample: Public safety, Chicago: run the analyses that tell the most about its data, draw every result, and write a cited report" 86.
What it found. The spatial join utilized the Period change: Incidents data 8 and calculated density data from Street light outages 93.
| Result | Value |
|---|---|
| result, count | 16 |
| result, elapsed ms | 1 |
| billing, cost | 0.0273 |
| billing, list price | 0.0273 |
| billing, upstream cost | 0 |
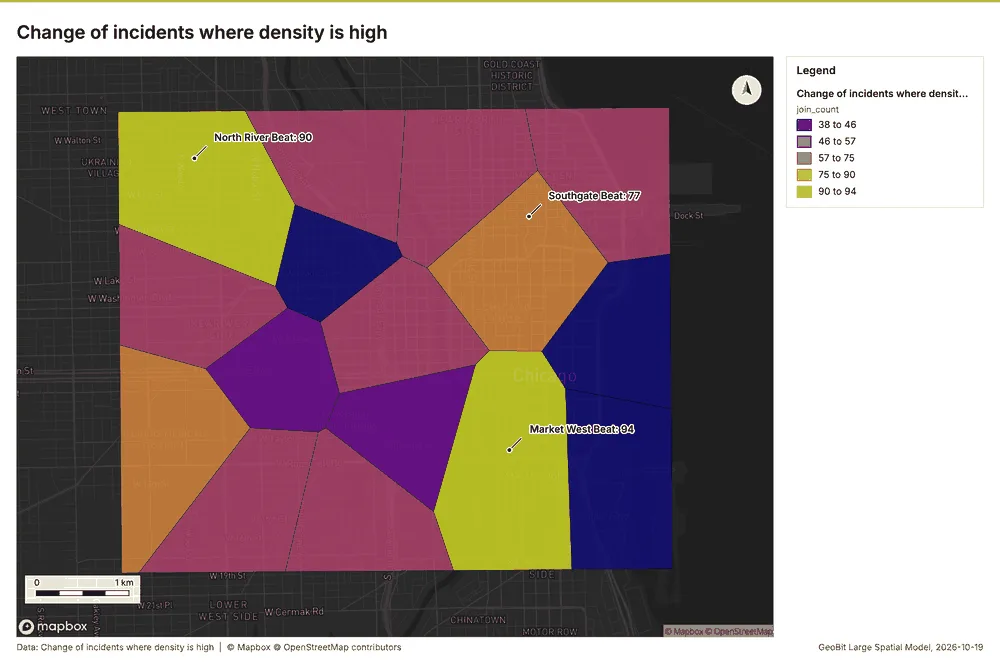
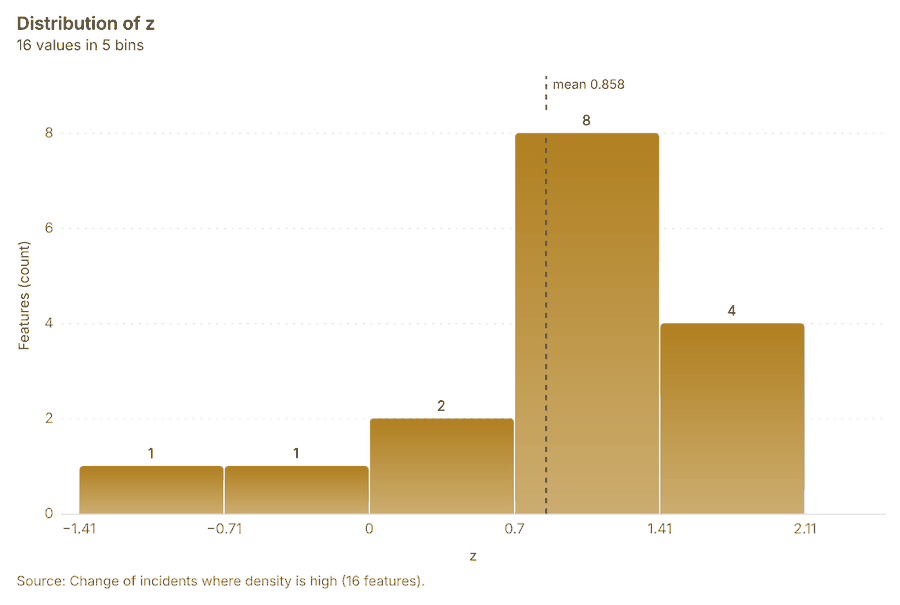
What the map shows. The map draws Change of incidents where density is high by join_count in 5 classes: 38 to 46, 46 to 57, 57 to 75, 75 to 90, 90 to 94 95. It draws 16 features 95. It covers longitude -87.694 to -87.594 and latitude 41.85 to 41.907, at about 1:34,270 95.
Findings
- Evidenced: Spatial join on Calculate density: Street light outages, Period change: Incidents (week of 2026-06-22 to week of 2026-06-29) produced Change of incidents where density is high (16 features) 8929394.
- Evidenced: It reported result, count 16; result, elapsed ms 1; billing, cost 0.0273; billing, list price 0.0273; billing, upstream cost 0 92.
- Evidenced: The chart Change of incidents where density is high is drawn from 5 rows 96.
Tool gp_spatial_join; parameters {"join": {"layer": "Calculate density: Street light outages (22316e02)"}, "stats": [{"agg": "mean", "field": "density_per_km2"}], "target": {"layer": "Period change: Incidents (week of 2026-06-22 to week of 2026-06-29) (1e0726ac)"}, "project": "fe9df6b9-8a15-4264-946b-4b37b8dbb89d", "predicate": "intersects", "output_name": "Change of incidents where density is high"}
Hot cells of CCTV cameras per patrol beat
What this analysis is. Summarize within: Count and aggregate the features inside each polygon (or bin), proportionally for lines and polygons 44. In ArcGIS it is Summarize Within or Aggregate Points; in QGIS, native:countpointsinpolygon or native:sumlinelengths 44.
Why it was run on this data. Count CCTV cameras inside each feature of Patrol beats by ptz; the counts map as a choropleth (natural breaks, sequential colors) 45.
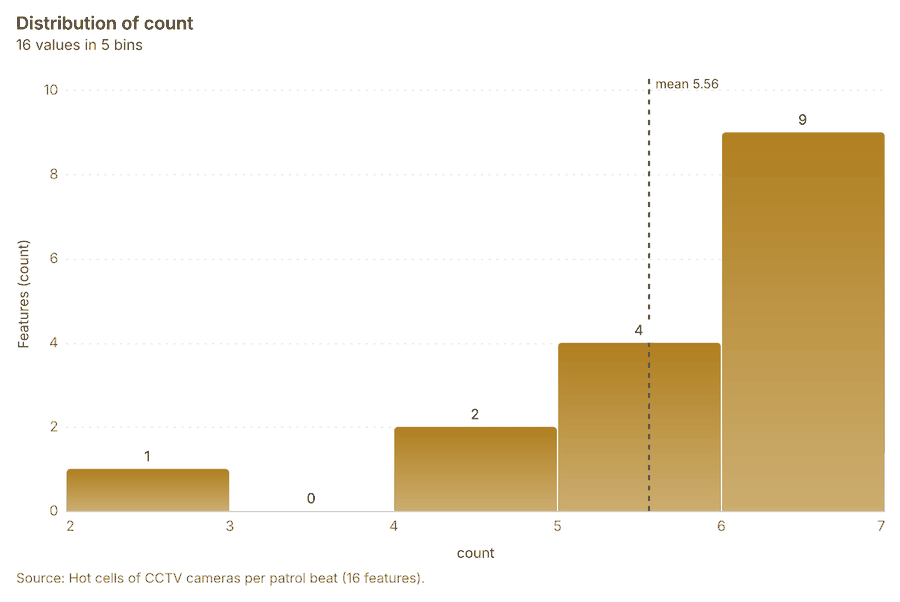
What it found. Summarize within on Hot spot analysis: CCTV cameras, Patrol beats produced Hot cells of CCTV cameras per patrol beat (16 features) 14979899. It reported result, count 16; result, elapsed ms 2; billing, cost 0.01104; billing, list price 0.01104; billing, upstream cost 0 97. The chart Hot cells of CCTV cameras per patrol beat is drawn from 5 rows 101.
| Result | Value |
|---|---|
| result, count | 16 |
| result, elapsed ms | 2 |
| billing, cost | 0.01104 |
| billing, list price | 0.01104 |
| billing, upstream cost | 0 |
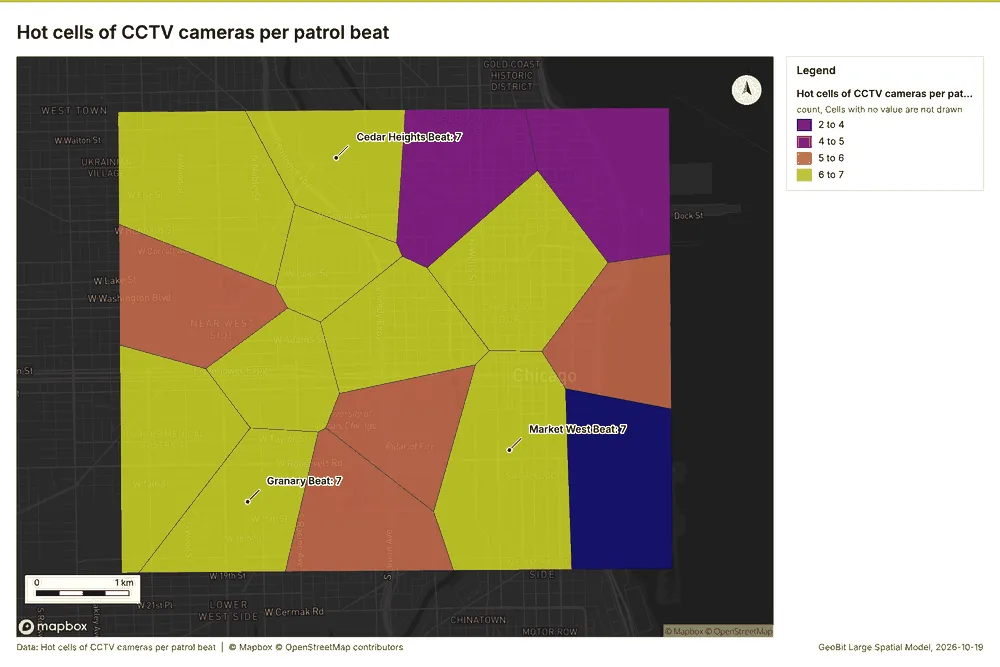
What the map shows. The map draws Hot cells of CCTV cameras per patrol beat by count in 4 classes: 2 to 4, 4 to 5, 5 to 6, 6 to 7 100. It draws 16 features 100. It covers longitude -87.694 to -87.594 and latitude 41.85 to 41.907, at about 1:34,270 100.
Findings
- Evidenced: Summarize within on Hot spot analysis: CCTV cameras, Patrol beats produced Hot cells of CCTV cameras per patrol beat (16 features) 14979899.
- Evidenced: It reported result, count 16; result, elapsed ms 2; billing, cost 0.01104; billing, list price 0.01104; billing, upstream cost 0 97.
- Evidenced: The chart Hot cells of CCTV cameras per patrol beat is drawn from 5 rows 101.
Tool gp_summarize_within; parameters {"project": "fe9df6b9-8a15-4264-946b-4b37b8dbb89d", "features": {"layer": "Hot spot analysis: CCTV cameras (2cc32b98)"}, "group_by": "gi_bin", "polygons": {"layer": "Patrol beats (8c67e28f)"}, "output_name": "Hot cells of CCTV cameras per patrol beat"}
Nearest police station to each cluster of licensed premises
What this analysis is. Find nearest: The k nearest features for each input, with geodesic distance and bearing 102. In ArcGIS it is Find Nearest or Near; in QGIS, native:joinbynearest or native:nearestneighbouranalysis 102.
Why it was run on this data. It was run toward the goal "Describe the project Sample: Public safety, Chicago: run the analyses that tell the most about its data, draw every result, and write a cited report" 86.
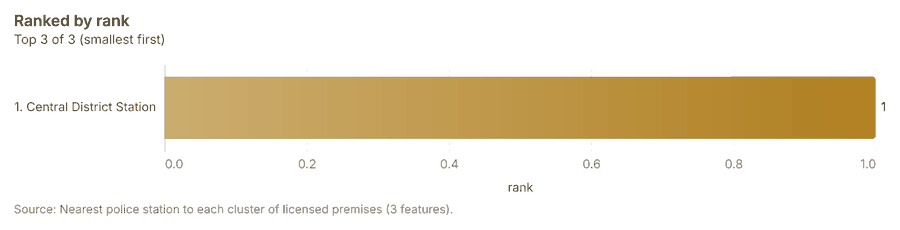
What it found. Find nearest on Police stations, Find point clusters: cluster hulls produced Nearest police station to each cluster of licensed premises (3 features) 1981103104. It reported result, count 3; result, elapsed ms 3; billing, cost 0.01012; billing, list price 0.01012; billing, upstream cost 0 103. The chart Nearest police station to each cluster of licensed premises is drawn from 3 rows 106.
| Result | Value |
|---|---|
| result, count | 3 |
| result, elapsed ms | 3 |
| billing, cost | 0.01012 |
| billing, list price | 0.01012 |
| billing, upstream cost | 0 |
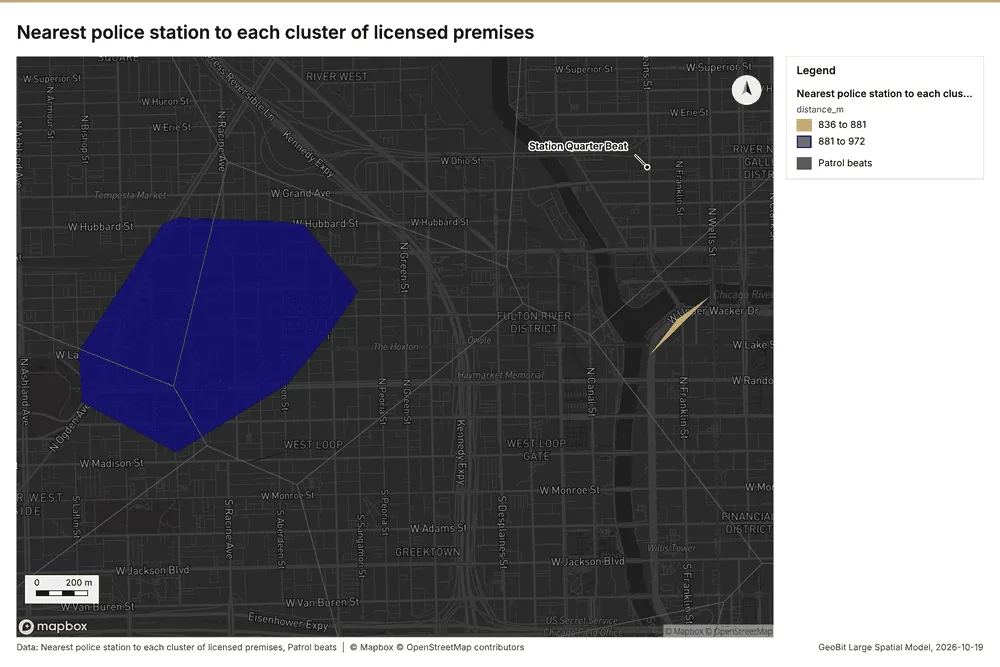
What the map shows. The map draws Nearest police station to each cluster of licensed premises by distance_m in 2 classes: 836 to 881, 881 to 972 105. The map draws Patrol beats with one symbol 105. It draws 19 features 105. It covers longitude -87.667 to -87.631 and latitude 41.875 to 41.896, at about 1:12,455 105.
Findings
- Evidenced: Find nearest on Police stations, Find point clusters: cluster hulls produced Nearest police station to each cluster of licensed premises (3 features) 1981103104.
- Evidenced: It reported result, count 3; result, elapsed ms 3; billing, cost 0.01012; billing, list price 0.01012; billing, upstream cost 0 103.
- Evidenced: The chart Nearest police station to each cluster of licensed premises is drawn from 3 rows 106.
Tool gp_find_nearest; parameters {"k": 1, "to": {"layer": "Police stations (6b7fdf5e)"}, "from": {"layer": "Find point clusters: cluster hulls (4dfef6fb)"}, "project": "fe9df6b9-8a15-4264-946b-4b37b8dbb89d", "output_name": "Nearest police station to each cluster of licensed premises"}
Dense areas of street light outages
What this analysis is. Pipeline: Run up to 20 GIS operations in one engine call; a step's params may use "$id" (an earlier step's result) or "$id.key", and layer references 107. Every step's map outputs are saved as styled layers 107.
Why it was run on this data. Patrol beats holds population in 'population': CCTV cameras per 10,000 people in each feature compares features of different size; mapped as a choropleth (natural breaks, sequential colors) 108.
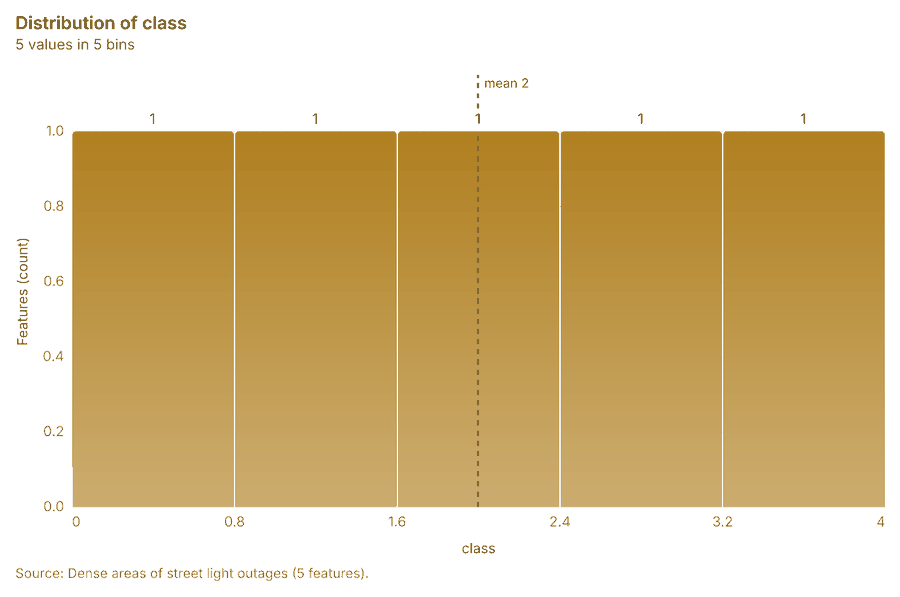
What it found. Pipeline on Calculate density: Street light outages produced Dense areas of street light outages (5 features) 93109110. It reported result, count 5; result, elapsed ms 13; billing, cost 0.03697; billing, list price 0.03697; billing, upstream cost 0; list price 0.03697 109. The chart Dense areas of street light outages is drawn from 5 rows 111.
| Result | Value |
|---|---|
| result, count | 5 |
| result, elapsed ms | 13 |
| billing, cost | 0.03697 |
| billing, list price | 0.03697 |
| billing, upstream cost | 0 |
| list price | 0.03697 |
What the map shows. Drawn with calculate density on the map Density: street light outages 71.
Findings
- Evidenced: Pipeline on Calculate density: Street light outages produced Dense areas of street light outages (5 features) 93109110.
- Evidenced: It reported result, count 5; result, elapsed ms 13; billing, cost 0.03697; billing, list price 0.03697; billing, upstream cost 0; list price 0.03697 109.
- Evidenced: The chart Dense areas of street light outages is drawn from 5 rows 111.
*Tool gp_pipeline; parameters {"save": "final", "steps": [{"id": "classes", "params": {"field": "density_per_km2", "method": "quantile", "classes": 5, "features": {"layer": "Calculate density: Street light outages (22316e02)"}}, "operation": "classify_field"}, {"id": "areas", "params": {"by": ["class"], "features": "$classes"}, "operation": "dissolve"}], "project": "fe9df6b9-8a15-4264-946b-4b37b8dbb89d", "output_name": "Dense *
Change of street light outages per patrol beat
What this analysis is. Summarize within: Count and aggregate the features inside each polygon (or bin), proportionally for lines and polygons 44. In ArcGIS it is Summarize Within or Aggregate Points; in QGIS, native:countpointsinpolygon or native:sumlinelengths 44.
Why it was run on this data. Count CCTV cameras inside each feature of Patrol beats by ptz; the counts map as a choropleth (natural breaks, sequential colors) 45.
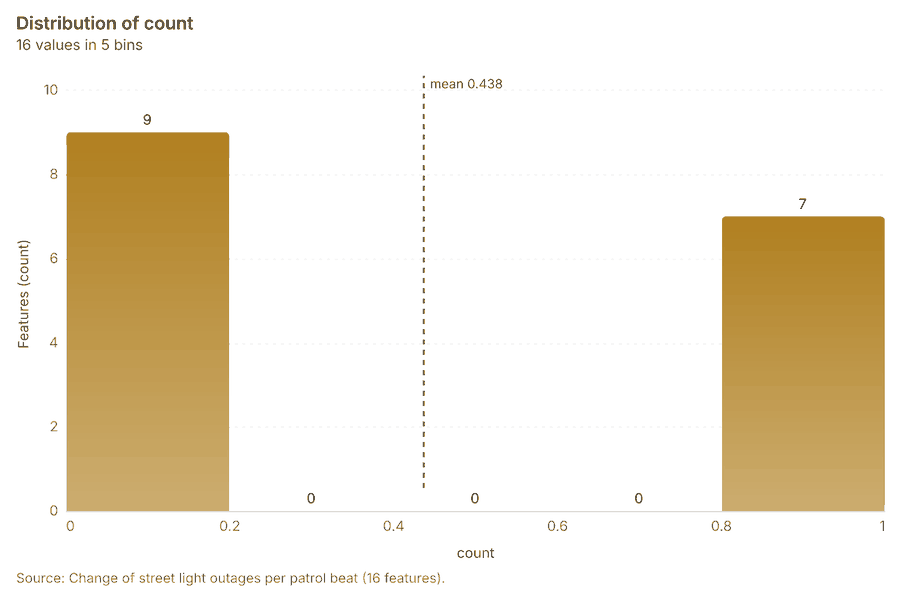
What it found. Summarize within on Period change: Street light outages (week of 2026-02-02 to week of 2026-02-09), Patrol beats produced Change of street light outages per patrol beat (16 features) 1014112113. It reported result, count 16; result, elapsed ms 1; billing, cost 0.01048; billing, list price 0.01048; billing, upstream cost 0 112. The chart Change of street light outages per patrol beat is drawn from 5 rows 115.
| Result | Value |
|---|---|
| result, count | 16 |
| result, elapsed ms | 1 |
| billing, cost | 0.01048 |
| billing, list price | 0.01048 |
| billing, upstream cost | 0 |
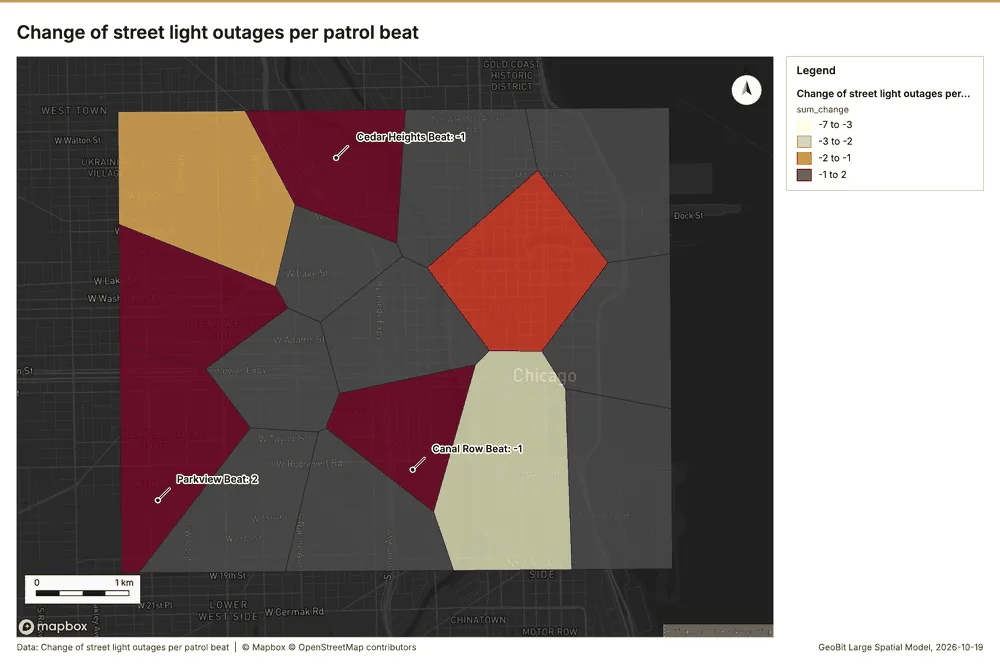
What the map shows. The map draws Change of street light outages per patrol beat by sum_change in 4 classes: -7 to -3, -3 to -2, -2 to -1, -1 to 2 114. It draws 16 features 114. It covers longitude -87.694 to -87.594 and latitude 41.85 to 41.907, at about 1:34,270 114.
Findings
- Evidenced: Summarize within on Period change: Street light outages (week of 2026-02-02 to week of 2026-02-09), Patrol beats produced Change of street light outages per patrol beat (16 features) 1014112113.
- Evidenced: It reported result, count 16; result, elapsed ms 1; billing, cost 0.01048; billing, list price 0.01048; billing, upstream cost 0 112.
- Evidenced: The chart Change of street light outages per patrol beat is drawn from 5 rows 115.
Tool gp_summarize_within; parameters {"stats": [{"agg": "sum", "field": "change"}], "project": "fe9df6b9-8a15-4264-946b-4b37b8dbb89d", "features": {"layer": "Period change: Street light outages (week of 2026-02-02 to week of 2026-02-09) (b942fd09)"}, "polygons": {"layer": "Patrol beats (8c67e28f)"}, "output_name": "Change of street light outages per patrol beat"}
Maps and charts
The run also made 25 chart(s) 116117118119120121122123124125126127128129130131132133134135136137138139140.
Documents
What the documents name. Quarterly crime and safety briefing, third quarter 2026 (1 page, 1 page(s) from the text layer) names 12 event terms and 11 places 141. Event terms in Quarterly crime and safety briefing, third quarter 2026: Thefts (page 1, line 7, 2 mentions), Transit (page 1, line 7, 2 mentions), street (page 1, line 9, 2 mentions), demonstration (page 1, line 3) 142. Places named in Quarterly crime and safety briefing, third quarter 2026: Central Transit Center (page 1, line 7, 2 mentions), Market West Beat (page 1, line 9, 2 mentions), N Elizabeth St (page 1, line 11, 2 mentions), Kingsway Beat (page 1, line 11, 2 mentions) 142. Hot spot patrol plan (1 page, 1 page(s) from the text layer) names 1 organization, 8 event terms and 6 places 143. Organizations named in Hot spot patrol plan: Focus (page 1, line 7) 144. Event terms in Hot spot patrol plan: theft (page 1, line 11, 2 mentions), patrol (page 1, line 1), Patrols (page 1, line 3), Transit (page 1, line 8) 144. Places named in Hot spot patrol plan: Central District Station (page 1, line 3), Westside Station (page 1, line 3), Riverside Station (page 1, line 3), Central Transit Center (page 1, line 8) 144.
| Result | Value |
|---|---|
| Documents | 2 |
| Entities | 38 |
| Organizations | 1 |
| Event terms | 20 |
| Places | 17 |
Findings
- Evidenced: Quarterly crime and safety briefing, third quarter 2026 (1 page, 1 page(s) from the text layer) names 12 event terms and 11 places.
- Evidenced: Event terms in Quarterly crime and safety briefing, third quarter 2026: Thefts (page 1, line 7, 2 mentions), Transit (page 1, line 7, 2 mentions), street (page 1, line 9, 2 mentions), demonstration (page 1, line 3).
- Evidenced: Places named in Quarterly crime and safety briefing, third quarter 2026: Central Transit Center (page 1, line 7, 2 mentions), Market West Beat (page 1, line 9, 2 mentions), N Elizabeth St (page 1, line 11, 2 mentions), Kingsway Beat (page 1, line 11, 2 mentions).
- Evidenced: Hot spot patrol plan (1 page, 1 page(s) from the text layer) names 1 organization, 8 event terms and 6 places.
- Evidenced: Organizations named in Hot spot patrol plan: Focus (page 1, line 7).
- Evidenced: Event terms in Hot spot patrol plan: theft (page 1, line 11, 2 mentions), patrol (page 1, line 1), Patrols (page 1, line 3), Transit (page 1, line 8).
- Evidenced: Places named in Hot spot patrol plan: Central District Station (page 1, line 3), Westside Station (page 1, line 3), Riverside Station (page 1, line 3), Central Transit Center (page 1, line 8).
Changes since the last run
94 number(s) changed since the report of 2026-10-19T04:03:32Z.
| Analysis | Measure | Before | After | Change |
|---|---|---|---|---|
| Hot spots | result, bins | 35 | 36 | 1 |
| Hot spots | result, count | 35 | 36 | 1 |
| Hot spots | result, elapsed ms | 2 | 3 | 1 |
| Hot spots | result, incidents used | 80 | 60 | -20 |
| Hot spots | result, distance band m | 1,000 | 2,000 | 1,000 |
| Hot spots | billing, cost | 0.0516 | 0.0512 | -0.0004 |
| Hot spots | billing, list price | 0.0516 | 0.0512 | -0.0004 |
| Hot spots | result, bins | 35 | 112 | 77 |
| Hot spots | result, count | 35 | 112 | 77 |
| Hot spots | result, elapsed ms | 2 | 5 | 3 |
| Hot spots | result, cell size m | 1,000 | 500 | -500 |
| Hot spots | result, incidents used | 80 | 120 | 40 |
| Hot spots | billing, cost | 0.0516 | 0.0524 | 0.0008 |
| Hot spots | billing, list price | 0.0516 | 0.0524 | 0.0008 |
| Space time hot spots | result, elapsed ms | 44 | 46 | 2 |
| Space time hot spots | result, count | 270 | 47 | -223 |
| Space time hot spots | result, elapsed ms | 44 | 10 | -34 |
| Space time hot spots | result, resolution | 9 | 8 | -1 |
| Space time hot spots | result, features used | 1,680 | 420 | -1,260 |
| Space time hot spots | billing, cost | 0.184 | 0.121 | -0.063 |
| Space time hot spots | billing, list price | 0.184 | 0.121 | -0.063 |
| Find point clusters | result, count | 1,680 | 120 | -1,560 |
| Find point clusters | result, noise | 1,609 | 61 | -1,548 |
| Find point clusters | result, distance m | 50 | 200 | 150 |
| Find point clusters | result, elapsed ms | 118 | 499 | 381 |
| Find point clusters | result, min points | 20 | 3 | -17 |
| Find point clusters | billing, cost | 0.0836 | 0.0524 | -0.0312 |
| Find point clusters | billing, list price | 0.0836 | 0.0524 | -0.0312 |
| Find point clusters | result, elapsed ms | 118 | 19 | -99 |
| Find point clusters | result, count | 1,680 | 420 | -1,260 |
| Find point clusters | result, noise | 1,609 | 410 | -1,199 |
| Find point clusters | result, distance m | 50 | 100 | 50 |
| Find point clusters | result, elapsed ms | 118 | 5 | -113 |
| Find point clusters | result, min points | 20 | 10 | -10 |
| Find point clusters | billing, cost | 0.0836 | 0.0584 | -0.0252 |
| Find point clusters | billing, list price | 0.0836 | 0.0584 | -0.0252 |
| Summarize within | result, elapsed ms | 1 | 0 | -1 |
| Summarize within | billing, cost | 0.01048 | 0.01154 | 0.00106 |
| Summarize within | billing, list price | 0.01048 | 0.01154 | 0.00106 |
| Summarize within | result, elapsed ms | 1 | 0 | -1 |
| Summarize within | billing, cost | 0.01048 | 0.01274 | 0.00226 |
| Summarize within | billing, list price | 0.01048 | 0.01274 | 0.00226 |
| Summarize within | result, elapsed ms | 1 | 2 | 1 |
| Summarize within | billing, cost | 0.01048 | 0.04394 | 0.03346 |
| Summarize within | billing, list price | 0.01048 | 0.04394 | 0.03346 |
| Calculate density | result, count | 2,874 | 164 | -2,710 |
| Calculate density | result, elapsed ms | 162 | 4 | -158 |
| Calculate density | result, bandwidth m | 200 | 1,000 | 800 |
| Calculate density | result, cell size m | 100 | 500 | 400 |
| Calculate density | result, max density per km2 | 1,347 | 42.62 | -1,305 |
| Calculate density | billing, cost | 0.0836 | 0.0524 | -0.0312 |
| Calculate density | billing, list price | 0.0836 | 0.0524 | -0.0312 |
| Calculate density | result, elapsed ms | 162 | 50 | -112 |
| Calculate density | result, count | 2,874 | 848 | -2,026 |
| Calculate density | result, elapsed ms | 162 | 15 | -147 |
| Calculate density | result, bandwidth m | 200 | 500 | 300 |
| Calculate density | result, cell size m | 100 | 200 | 100 |
| Calculate density | result, max density per km2 | 1,347 | 107.5 | -1,240 |
| Calculate density | billing, cost | 0.0836 | 0.0584 | -0.0252 |
| Calculate density | billing, list price | 0.0836 | 0.0584 | -0.0252 |
| Hot spots | result, bins | 35 | 2,912 | 2,877 |
| Hot spots | result, count | 35 | 2,912 | 2,877 |
| Hot spots | result, elapsed ms | 2 | 100 | 98 |
| Hot spots | result, cell size m | 1,000 | 100 | -900 |
| Hot spots | result, incidents used | 80 | 1,680 | 1,600 |
| Hot spots | result, distance band m | 1,000 | 200 | -800 |
| Hot spots | billing, cost | 0.0516 | 0.0836 | 0.032 |
| Hot spots | billing, list price | 0.0516 | 0.0836 | 0.032 |
| Near repeat | result, count | 420 | 1,680 | 1,260 |
| Near repeat | result, chains | 53 | 152 | 99 |
| Near repeat | result, distance m | 200 | 100 | -100 |
| Near repeat | result, elapsed ms | 10 | 39 | 29 |
| Near repeat | result, pairs linked | 185 | 1,357 | 1,172 |
| Near repeat | billing, cost | 0.0626 | 0.1004 | 0.0378 |
| Near repeat | billing, list price | 0.0626 | 0.1004 | 0.0378 |
| Hot cells inside each cluster of licensed premises | result, count | 16 | 3 | -13 |
| Hot cells inside each cluster of licensed premises | result, elapsed ms | 1 | 6 | 5 |
| Hot cells inside each cluster of licensed premises | billing, cost | 0.01048 | 0.0683 | 0.05782 |
| Hot cells inside each cluster of licensed premises | billing, list price | 0.01048 | 0.0683 | 0.05782 |
| Change beside the counts per patrol beat | billing, cost | 0.0273 | 0.01066 | -0.01664 |
| Change beside the counts per patrol beat | billing, list price | 0.0273 | 0.01066 | -0.01664 |
| Hot cells of CCTV cameras per patrol beat | result, elapsed ms | 1 | 2 | 1 |
| Hot cells of CCTV cameras per patrol beat | billing, cost | 0.01048 | 0.01104 | 0.00056 |
| Hot cells of CCTV cameras per patrol beat | billing, list price | 0.01048 | 0.01104 | 0.00056 |
| Nearest police station to each cluster of licensed premises | result, elapsed ms | 2 | 3 | 1 |
| Dense areas of street light outages | result, count | 936 | 5 | -931 |
| Dense areas of street light outages | result, elapsed ms | 22 | 13 | -9 |
| Dense areas of street light outages | billing, cost | 0.102 | 0.03697 | -0.06503 |
| Dense areas of street light outages | billing, list price | 0.102 | 0.03697 | -0.06503 |
| Dense areas of street light outages | list price | 0.102 | 0.03697 | -0.06503 |
| Documents | Documents | 17 | 2 | -15 |
| Documents | Entities | 17 | 38 | 21 |
| Documents | Organizations | 17 | 1 | -16 |
| Documents | Event terms | 17 | 20 | 3 |
New findings:
- Change beside the counts per patrol beat, from Period change: Incidents (week of 2026-06-22 to week of 2026-06-29) and Summarize within: Patrol beats: the busiest area, Market West Beat (332 in all), changed by +9 87750.
- Change of incidents where density is high, from Period change: Incidents (week of 2026-06-22 to week of 2026-06-29) and Calculate density: Street light outages: the largest rise (+9, Market West Beat) is where density averages 58.82 per square kilometer 92770.
- Change of street light outages per patrol beat, from Period change: Street light outages (week of 2026-02-02 to week of 2026-02-09): Parkview Beat rose the most (+2) and Market West Beat fell the most (-7) 1129.
- Dense areas of street light outages, from Calculate density: Street light outages: the densest of five classes joins 170 cells into one area 10970.
- Find nearest on Police stations, Find point clusters: cluster hulls produced Nearest police station to each cluster of licensed premises (3 features).
- Hot cells inside each cluster of licensed premises, from Hot spot analysis: Incidents and Find point clusters: cluster hulls: 1 of 3 clusters hold hot spot cells; cluster 0 holds the most (53) 797336.
- Hot cells of CCTV cameras per patrol beat, from Hot spot analysis: CCTV cameras: 9 of 16 areas hold hot spot cells; Southgate Beat holds the most (5) 9722.
- Hot spots on Incidents: Hot spot analysis: 1 layer saved: Hot spot analysis: Incidents (2912 features).
- Hot spots on Licensed premises: Hot spot analysis: 1 layer saved: Hot spot analysis: Licensed premises (112 features).
- It reported result, bins 112; result, count 112; result, elapsed ms 5; result, cell size m 500; result, incidents used 120; result, distance band m 1,000.
- It reported result, bins 2,912; result, count 2,912; result, elapsed ms 100; result, cell size m 100; result, incidents used 1,680; result, distance band m 200.
- It reported result, bins 36; result, count 36; result, elapsed ms 3; result, cell size m 1,000; result, incidents used 60; result, distance band m 2,000.
- It reported result, count 1,680; result, noise 1,609; result, distance m 50; result, elapsed ms 19; result, min points 20; billing, cost 0.0836.
- It reported result, count 120; result, noise 61; result, distance m 200; result, elapsed ms 499; result, min points 3; billing, cost 0.0524.
- It reported result, count 164; result, elapsed ms 4; result, bandwidth m 1,000; result, cell size m 500; result, excluded null 0; result, max density per km2 42.62.
- It reported result, count 16; result, elapsed ms 0; billing, cost 0.01274; billing, list price 0.01274; billing, upstream cost 0.
- It reported result, count 16; result, elapsed ms 2; billing, cost 0.04394; billing, list price 0.04394; billing, upstream cost 0.
- It reported result, count 2,874; result, elapsed ms 50; result, bandwidth m 200; result, cell size m 100; result, excluded null 0; result, max density per km2 1,347.
- It reported result, count 270; result, elapsed ms 46; result, resolution 9; result, features used 1,680; result, time neighbors 0; billing, cost 0.184.
- It reported result, count 3; result, elapsed ms 3; billing, cost 0.01012; billing, list price 0.01012; billing, upstream cost 0.
- It reported result, count 3; result, elapsed ms 6; billing, cost 0.0683; billing, list price 0.0683; billing, upstream cost 0.
- It reported result, count 420; result, noise 410; result, distance m 100; result, elapsed ms 5; result, min points 10; billing, cost 0.0584.
- It reported result, count 5; result, elapsed ms 13; billing, cost 0.03697; billing, list price 0.03697; billing, upstream cost 0; list price 0.03697.
- It reported result, count 848; result, elapsed ms 15; result, bandwidth m 500; result, cell size m 200; result, excluded null 0; result, max density per km2 107.5.
- It reported result, days 30; result, count 1,680; result, chains 152; result, distance m 100; result, elapsed ms 39; result, pairs linked 1,357.
- Near repeat on Incidents: Repeat and near repeat classification: 1 layer saved: Repeat and near repeat classification: Incidents (1680 features).
- Nearest police station to each cluster of licensed premises, from Find point clusters: cluster hulls: the 3 clusters lie 836 to 972 m from the nearest facility (Central District Station and others) 10336.
- Summarize within on Hot spot analysis: Incidents, Find point clusters: cluster hulls produced Hot cells inside each cluster of licensed premises (3 features).
- Summarize within on Incidents, Patrol beats: Summarize within: 1 layer saved: Summarize within: Patrol beats (16 features).
- Summarize within on Licensed premises, Patrol beats: Summarize within: 1 layer saved: Summarize within: Patrol beats (16 features).
- The chart Hot cells inside each cluster of licensed premises is drawn from 3 rows.
- The chart Nearest police station to each cluster of licensed premises is drawn from 3 rows.
Sources
- 1Rendering: Chart: Timeline: events per month by dataset. 72 rows id d013059e-6933-47a5-bb09-9a0dc42d4902
- 2Dataset: Incidents. vector, 1680 rows id 8e5ad24c-d6a6-4a58-8281-8b363a095f60
- 3Dataset: Street light outages. vector, 420 rows id abe096b9-4f2d-4a2c-8093-abb51b141f33
- 4Dataset: Calls for service by beat and month. table, 384 rows id 924696a2-7623-45fc-aa81-6181d9eba827
- 5Rendering: Chart: Timeline lanes: events per month by dataset. 72 rows id fb1cdee2-f533-45f4-983f-0cd951892613
- 6Rendering: Chart: Timeline: change from one month to the next. 23 rows id 2d043b97-3b7e-4081-a3cc-a2d4f2bb2246
- 7Tool result: gp_period_change, step 0. The count rose from 33 in week of 2026-06-22 to 72 in week of 2026-06-29 (+118.2%); a change this large is unlikely to be chance (p = 0.000178). id 2042e52a-03d6-42f1-8365-22ab6777dc1e:0
- 8Layer: Period change: Incidents (week of 2026-06-22 to week of 2026-06-29) id 1e0726ac-a223-423b-b680-55434fcfa5e6
- 9Tool result: gp_period_change, step 1. The count fell from 17 in week of 2026-02-02 to 4 in week of 2026-02-09 (-76.5%); a change this large is unlikely to be chance (p = 0.0072). id 2042e52a-03d6-42f1-8365-22ab6777dc1e:1
- 10Layer: Period change: Street light outages (week of 2026-02-02 to week of 2026-02-09) id b942fd09-4b01-4ffe-a2ab-c88503e90ef1
- 11Rendering: Map: Overview: the top 3 results. view longitude -87.71811 to -87.57468, latitude 41.83798 to 41.91748 id 79e66837-1f85-4f45-956b-0a34bfd5fe00
- 12Layer: Incidents. spatial profile id 36ad5f7c-eab7-4ac7-8256-9737c4a1b044
- 13Layer: Street light outages. spatial profile id a7218535-327c-4a76-b5d4-8caa09f44155
- 14Layer: Patrol beats. spatial profile id 8c67e28f-6678-462f-a450-e83d278138e8
- 15Layer: CCTV cameras. spatial profile id ad88aaeb-e7ac-4b9c-aa1c-c4626ae498b8
- 16Layer: Transit stops. spatial profile id 313ae694-78aa-4830-955c-22be11a8a8a3
- 17Layer: Licensed premises. spatial profile id 055b5c2c-2a86-4379-95be-6f38f708b65b
- 18Layer: Roads. spatial profile id f63e5a45-031b-44a5-bf1e-7b9d17cb2378
- 19Layer: Police stations. spatial profile id 6b7fdf5e-7de9-4f14-995d-0c918b2e91ec
- 20Catalog: Hot spot analysis (operation catalog, gp_hot_spots). Getis-Ord Gi* hot and cold spots with z-scores, p-values and confidence bins. ArcGIS: Find Hot Spots, Hot Spot Analysis (Getis-Ord Gi*). QGIS: qgis:hotspot (plugin). id gp_hot_spots
- 21Plan: Hot spots of CCTV cameras (the Start plan's candidate c_f0a51c3ce192). 60 points: Getis-Ord Gi* tests whether the concentrations in CCTV cameras are statistically significant. id f922208b-bbd9-4f8c-a605-3fb31853d7fd:c_f0a51c3ce192
- 22Tool result: gp_hot_spots, step 0. Hot spot analysis: 1 layer saved: Hot spot analysis: CCTV cameras (36 features). id 321ba186-8b6e-4c4b-bb58-94f915d8b6aa:0
- 23Rendering: Map: Hot spots: CCTV cameras. view longitude -87.7152 to -87.57762, latitude 41.83848 to 41.91701 id a5a339e4-5577-4333-9b86-911f2f84f49a
- 24Plan: Hot spots of Licensed premises (the Start plan's candidate c_91bb663e526f). 120 points: Getis-Ord Gi* tests whether the concentrations in Licensed premises are statistically significant. Measured: Licensed premises are clustered (nearest-neighbor ratio 0.85, z = -3.2), median spacing 121 m. Cells of 500 m and a band of 1000 m from the measured spacing. id f922208b-bbd9-4f8c-a605-3fb31853d7fd:c_91bb663e526f
- 25Tool result: gp_hot_spots, step 1. Hot spot analysis: 1 layer saved: Hot spot analysis: Licensed premises (112 features). id 321ba186-8b6e-4c4b-bb58-94f915d8b6aa:1
- 26Rendering: Map: Hot spots: licensed premises. view longitude -87.70465 to -87.5929, latitude 41.84743 to 41.91121 id 2145f368-15a9-49e0-ad22-77165edbf2be
- 27Catalog: Emerging hot spots (operation catalog, gp_space_time_hot_spots). Where hot spots are new, consecutive, intensifying, persistent, diminishing, sporadic, oscillating or historical over time. ArcGIS: Emerging Hot Spot Analysis, Create Space Time Cube. id gp_space_time_hot_spots
- 28Plan: Space time hot spots of Incidents (the Start plan's candidate c_1c60b58dbb29). Incidents carry dates in 'reported_at': emerging hot spot analysis finds new, intensifying and fading hot spots per week. Measured: the pattern of Incidents changes over time (earlier half clustered, later half clustered; the center moved 132 m). id f922208b-bbd9-4f8c-a605-3fb31853d7fd:c_1c60b58dbb29
- 29Tool result: gp_space_time_hot_spots, step 0. Emerging hot spots: 1 layer saved: Emerging hot spots: Incidents (270 features). id 961133c9-b424-4eba-880c-76b21b589fcb:0
- 30Rendering: Map: Emerging hot spots: incidents. view longitude -87.70246 to -87.58676, latitude 41.84569 to 41.90983 id 6f2b1b3c-6588-4aa1-b6cf-4e9a3a111f44
- 31Plan: Space time hot spots of Street light outages (the Start plan's candidate c_2469aa67bba0). Street light outages carry dates in 'reported_at': emerging hot spot analysis finds new, intensifying and fading hot spots per week. Measured: the pattern of Street light outages changes over time (earlier half clustered, later half clustered; the center moved 263 m). id f922208b-bbd9-4f8c-a605-3fb31853d7fd:c_2469aa67bba0
- 32Tool result: gp_space_time_hot_spots, step 1. Emerging hot spots: 1 layer saved: Emerging hot spots: Street light outages (47 features). id 961133c9-b424-4eba-880c-76b21b589fcb:1
- 33Rendering: Map: Emerging hot spots: street light outages. view longitude -87.71613 to -87.57759, latitude 41.83894 to 41.91574 id 91191d14-e6a0-40e1-a6fa-dd44826aaf6e
- 34Catalog: Find point clusters (operation catalog, gp_find_point_clusters). Density-based clusters (DBSCAN, HDBSCAN or OPTICS, optionally space-time) with hulls and noise. ArcGIS: Find Point Clusters, Density-based Clustering. QGIS: native:dbscanclustering, native:stdbscanclustering. id gp_find_point_clusters
- 35Plan: Cluster points of Licensed premises (the Start plan's candidate c_bca1140666e1). DBSCAN finds dense groups of Licensed premises and separates noise. Measured: Licensed premises are clustered (nearest-neighbor ratio 0.85, z = -3.2), median spacing 121 m. DBSCAN at 200 m (twice the measured spacing). id f922208b-bbd9-4f8c-a605-3fb31853d7fd:c_bca1140666e1
- 36Tool result: gp_find_point_clusters, step 0. Find point clusters: 2 layers saved: Find point clusters: Licensed premises (120 features); Find point clusters: cluster hulls (3 features). id 215b8c93-8d01-4390-b188-f5c767207b46:0
- 37Rendering: Map: Clusters: licensed premises. view longitude -87.69497 to -87.59835, latitude 41.85068 to 41.90582 id 2605dc65-0adc-4643-9694-8530ea34521a
- 38Plan: Cluster points of Incidents (the Start plan's candidate c_0aed3f12db5c). DBSCAN finds dense groups of Incidents and separates noise. Measured: Incidents are clustered (nearest-neighbor ratio 0.73, z = -21.0), median spacing 34.3 m. DBSCAN at 50 m (twice the measured spacing). id f922208b-bbd9-4f8c-a605-3fb31853d7fd:c_0aed3f12db5c
- 39Tool result: gp_find_point_clusters, step 1. Find point clusters: 2 layers saved: Find point clusters: Incidents (1680 features); Find point clusters: cluster hulls (3 features). id 215b8c93-8d01-4390-b188-f5c767207b46:1
- 40Rendering: Map: Clusters: incidents. view longitude -87.69327 to -87.59462, latitude 41.8503 to 41.9066 id d9cb38e3-2bbf-4bd6-8736-3a3f54e2766c
- 41Plan: Cluster points of Street light outages (the Start plan's candidate c_eac5e908317b). DBSCAN finds dense groups of Street light outages and separates noise. Measured: Street light outages are clustered (nearest-neighbor ratio 0.88, z = -4.9), median spacing 74.9 m. DBSCAN at 100 m (twice the measured spacing). id f922208b-bbd9-4f8c-a605-3fb31853d7fd:c_eac5e908317b
- 42Tool result: gp_find_point_clusters, step 2. Find point clusters: 2 layers saved: Find point clusters: Street light outages (420 features); Find point clusters: cluster hulls (1 feature). id 215b8c93-8d01-4390-b188-f5c767207b46:2
- 43Rendering: Map: Clusters: street light outages. view longitude -87.6954 to -87.59744, latitude 41.85029 to 41.9062 id e91b963b-96c8-45a2-9a13-6a160f41445f
- 44Catalog: Summarize within (operation catalog, gp_summarize_within). Count and aggregate the features inside each polygon (or bin), proportionally for lines and polygons. ArcGIS: Summarize Within, Aggregate Points. QGIS: native:countpointsinpolygon, native:sumlinelengths. id gp_summarize_within
- 45Plan: CCTV cameras per feature of Patrol beats (the Start plan's candidate c_c58f45b29b6e). Count CCTV cameras inside each feature of Patrol beats by ptz; the counts map as a choropleth (natural breaks, sequential colors). id f922208b-bbd9-4f8c-a605-3fb31853d7fd:c_c58f45b29b6e
- 46Tool result: gp_summarize_within, step 0. Summarize within: 1 layer saved: Summarize within: Patrol beats (16 features). id 5e359a15-f5e2-429c-a252-d2486c76e559:0
- 47Rendering: Map: Counts: CCTV cameras, by patrol beat. view longitude -87.69371 to -87.59438, latitude 41.85001 to 41.9067 id 1d6099da-be90-4b9c-9991-ddaea0c2a814
- 48Tool result: gp_summarize_within, step 1. Summarize within: 1 layer saved: Summarize within: Patrol beats (16 features). id 5e359a15-f5e2-429c-a252-d2486c76e559:1
- 49Rendering: Map: Counts: licensed premises, by patrol beat. view longitude -87.69371 to -87.59438, latitude 41.85001 to 41.9067 id f3ebc560-673b-4e0e-bfeb-f244b6e425c8
- 50Tool result: gp_summarize_within, step 2. Summarize within: 1 layer saved: Summarize within: Patrol beats (16 features). id 5e359a15-f5e2-429c-a252-d2486c76e559:2
- 51Rendering: Map: Counts: incidents, by patrol beat. view longitude -87.69371 to -87.59438, latitude 41.85001 to 41.9067 id f6217787-f7ba-4030-aa6d-63161fb23a9e
- 52Catalog: Period change (analysis catalog, gp_period_change). Counts or sums per period (week over week, month over month, any two periods, or before and after a date), per area, per H3 cell or in total, with the places of largest rise and fall and a significance note. ArcGIS: Summarize Percent Change (Crime Analysis), Change Point Detection. id gp_period_change
- 53Plan: Incidents: change per week per feature of Patrol beats (the Start plan's candidate c_55dcc49526ff). Incidents carry dates in 'reported_at' over 52 weeks: the count per week, week over week, with the places of largest rise and fall per feature of Patrol beats and whether the change is beyond chance. id f922208b-bbd9-4f8c-a605-3fb31853d7fd:c_55dcc49526ff
- 54Rendering: Map: Period change: incidents, by patrol beat. view longitude -87.69576 to -87.59221, latitude 41.8496 to 41.907 id f8fa38e0-6b2b-4027-9d48-4238d9d56b8b
- 55Rendering: Chart: Incidents: count per week. 53 rows id 669d11fe-6a6b-4977-827a-e6583fbb9ec8
- 56Rendering: Chart: Incidents: week of 2026-06-22 to week of 2026-06-29 by place. 30 rows id d57784f7-9e7d-4cb3-a1b4-5c224a8d2ffd
- 57Rendering: Chart: Period change: Incidents (week of 2026-06-22 to week of 2026-06-29). 5 rows id 8f97238b-666e-416b-87f0-c34f89646566
- 58Rendering: Map: Period change: street light outages, by patrol beat. view longitude -87.69969 to -87.59686, latitude 41.84969 to 41.90669 id 064b0349-aa03-4072-ac98-9eb86c884bd9
- 59Rendering: Chart: Street light outages: count per week. 53 rows id 73202d54-d8bb-4119-8b31-815538262a83
- 60Rendering: Chart: Street light outages: week of 2026-02-02 to week of 2026-02-09 by place. 14 rows id 56c46fab-d5ad-44bb-b563-5bba1cc24883
- 61Rendering: Chart: Period change: Street light outages (week of 2026-02-02 to week of 2026-02-09). 5 rows id d58ef4fc-c705-4cc6-bbc5-aca3bf3f48b6
- 62Catalog: Calculate density (operation catalog, gp_calculate_density). Kernel density per square kilometer on a grid. ArcGIS: Calculate Density, Kernel Density. QGIS: native:heatmapkerneldensityestimation. id gp_calculate_density
- 63Plan: Kernel density of Licensed premises (the Start plan's candidate c_2b247b24a505). 120 points in Licensed premises: a density surface shows where they concentrate. Measured: Licensed premises are clustered (nearest-neighbor ratio 0.85, z = -3.2), median spacing 121 m. id f922208b-bbd9-4f8c-a605-3fb31853d7fd:c_2b247b24a505
- 64Tool result: gp_calculate_density, step 0. Calculate density: 1 layer saved: Calculate density: Licensed premises (164 features). id 8475a7ee-691d-4552-8a24-41bb69bf46a4:0
- 65Rendering: Map: Density: licensed premises. view longitude -87.71552 to -87.57698, latitude 41.83894 to 41.91801 id 2d0ffd6b-492c-46b6-9708-edf0e8f348fa
- 66Plan: Kernel density of Incidents (the Start plan's candidate c_9007d02c4a41). 1680 points in Incidents: a density surface shows where they concentrate. Measured: Incidents are clustered (nearest-neighbor ratio 0.73, z = -21.0), median spacing 34.3 m. id f922208b-bbd9-4f8c-a605-3fb31853d7fd:c_9007d02c4a41
- 67Tool result: gp_calculate_density, step 1. Calculate density: 1 layer saved: Calculate density: Incidents (2874 features). id 8475a7ee-691d-4552-8a24-41bb69bf46a4:1
- 68Rendering: Map: Density: incidents. view longitude -87.69708 to -87.59062, latitude 41.848 to 41.90876 id 0aa6b6e6-e52d-4399-b08c-8e798eb73c93
- 69Plan: Kernel density of Street light outages (the Start plan's candidate c_bd626b9123bb). 420 points in Street light outages: a density surface shows where they concentrate. Measured: Street light outages are clustered (nearest-neighbor ratio 0.88, z = -4.9), median spacing 74.9 m. id f922208b-bbd9-4f8c-a605-3fb31853d7fd:c_bd626b9123bb
- 70Tool result: gp_calculate_density, step 2. Calculate density: 1 layer saved: Calculate density: Street light outages (848 features). id 8475a7ee-691d-4552-8a24-41bb69bf46a4:2
- 71Rendering: Map: Density: street light outages. view longitude -87.70567 to -87.58754, latitude 41.84454 to 41.91196 id 27e532e4-8298-4330-ad1a-0d9375f48b07
- 72Plan: Hot spots of Incidents (the Start plan's candidate c_c312b5d076a7). 1680 points: Getis-Ord Gi* tests whether the concentrations in Incidents are statistically significant. Measured: Incidents are clustered (nearest-neighbor ratio 0.73, z = -21.0), median spacing 34.3 m. Cells of 100 m and a band of 200 m from the measured spacing. id f922208b-bbd9-4f8c-a605-3fb31853d7fd:c_c312b5d076a7
- 73Tool result: gp_hot_spots, step 0. Hot spot analysis: 1 layer saved: Hot spot analysis: Incidents (2912 features). id bc2d155b-8245-44bd-bc02-ae3dd8ce99bd:0
- 74Rendering: Map: Hot spots: incidents. view longitude -87.69527 to -87.59314, latitude 41.84909 to 41.90737 id 207cb3df-c55c-401c-8124-cbf80367ad53
- 75Catalog: Repeat and near repeat classification (operation catalog, gp_near_repeat). Classify incidents as originators, repeats (same place) or near repeats within a distance and time window, with a Knox test table. ArcGIS: Repeat and Near Repeat Classification, Near Repeat Calculator. id gp_near_repeat
- 76Plan: Near repeat of Incidents (the Start plan's candidate c_cabb2c797127). Near repeat analysis tests whether Incidents close in space also follow each other within 30 days. id f922208b-bbd9-4f8c-a605-3fb31853d7fd:c_cabb2c797127
- 77Tool result: gp_near_repeat, step 0. Repeat and near repeat classification: 1 layer saved: Repeat and near repeat classification: Incidents (1680 features). id e703fd06-1a0c-47e1-8d41-9a7f7ca7a096:0
- 78Rendering: Map: Near repeat: incidents. view longitude -87.69493 to -87.59281, latitude 41.85009 to 41.9067 id 28e59ede-c587-4b24-bb28-3230a99a4d59
- 79Tool result: gp_summarize_within, step 0. Summarize within: 1 layer saved: Hot cells inside each cluster of licensed premises (3 features). id 47c5f0de-dfdf-494b-911d-90b10a714d4d:0
- 80Layer: Hot spot analysis: Incidents. 2,912 features id 8382f930-c9d0-432b-82b7-fabc618137e9
- 81Layer: Find point clusters: cluster hulls. 3 features id 4dfef6fb-4663-43a7-86b3-cb7ca742b344
- 82Layer: Hot cells inside each cluster of licensed premises. 3 features id ca4b4f64-91e3-4c8b-b95e-1027e417c18a
- 83Rendering: Map: Hot cells inside each cluster of licensed premises. view longitude -87.66722 to -87.63111, latitude 41.87536 to 41.89597 id 1f5b237f-456e-4271-ac5a-8b7c49ea1203
- 84Rendering: Chart: Hot cells inside each cluster of licensed premises. 3 rows id dc8f6491-2889-4c96-8892-a5a92ddccff9
- 85Catalog: Spatial join (operation catalog, gp_spatial_join). Attach attributes (or aggregates) of matching features from another layer, by location, distance, time and attributes. ArcGIS: Join Features, Spatial Join. QGIS: native:joinattributesbylocation, native:joinbylocationsummary, native:joinbynearest. id gp_spatial_join
- 86Plan: The run's goal. Describe the project Sample: Public safety, Chicago: run the analyses that tell the most about its data, draw every result, and write a cited report. id 2e6054ca-62f3-479f-b398-915fe26200ce:goal
- 87Tool result: gp_spatial_join, step 0. Spatial join: 1 layer saved: Change beside the counts per patrol beat (16 features). id b47bd286-7bf7-47ee-8462-aba2f7f03009:0
- 88Layer: Summarize within: Patrol beats. 16 features id 31bedf68-b7b3-41b2-abda-6a464b2f0776
- 89Layer: Change beside the counts per patrol beat. 16 features id a982a2d6-956f-4dfe-b821-16eefe49fc59
- 90Rendering: Map: Change beside the counts per patrol beat. view longitude -87.69371 to -87.59438, latitude 41.85001 to 41.9067 id 72abfc34-1aa3-41c0-918f-e1038e14d6e4
- 91Rendering: Chart: Change beside the counts per patrol beat. 5 rows id 0db6652b-8019-4841-a5c5-bb77cb37c605
- 92Tool result: gp_spatial_join, step 0. Spatial join: 1 layer saved: Change of incidents where density is high (16 features). id a507fc16-21fd-45b9-aeb6-d8c679c59bfa:0
- 93Layer: Calculate density: Street light outages. 848 features id 22316e02-9759-4f61-b1eb-206b935b14bb
- 94Layer: Change of incidents where density is high. 16 features id b18abe82-9e7c-4939-aba0-31147b337e8d
- 95Rendering: Map: Change of incidents where density is high. view longitude -87.69371 to -87.59438, latitude 41.85001 to 41.9067 id 4c6d9fb2-ffd0-4f64-8535-c3988767f184
- 96Rendering: Chart: Change of incidents where density is high. 5 rows id 92ea2477-a522-47ee-89b1-746ee6856ca5
- 97Tool result: gp_summarize_within, step 0. Summarize within: 1 layer saved: Hot cells of CCTV cameras per patrol beat (16 features). id 614dc9e6-1702-4222-aaee-d9710ae1d2fa:0
- 98Layer: Hot spot analysis: CCTV cameras. 36 features id 2cc32b98-9097-49ba-8818-944110cdf58f
- 99Layer: Hot cells of CCTV cameras per patrol beat. 16 features id d17a96b4-151e-4595-be18-86aaab10e46f
- 100Rendering: Map: Hot cells of CCTV cameras per patrol beat. view longitude -87.69371 to -87.59438, latitude 41.85001 to 41.9067 id b8be83a4-10bf-4533-a453-099468da0894
- 101Rendering: Chart: Hot cells of CCTV cameras per patrol beat. 5 rows id 35fadd76-8342-4832-bb6b-54b406cc2355
- 102Catalog: Find nearest (operation catalog, gp_find_nearest). The k nearest features for each input, with geodesic distance and bearing. ArcGIS: Find Nearest, Near, Generate Near Table. QGIS: native:joinbynearest, native:nearestneighbouranalysis. id gp_find_nearest
- 103Tool result: gp_find_nearest, step 0. Find nearest: 1 layer saved: Nearest police station to each cluster of licensed premises (3 features). id c991d762-1f84-44c6-96ae-3710f29ec64c:0
- 104Layer: Nearest police station to each cluster of licensed premises. 3 features id e1507503-e9d4-495b-92ae-125ebdaa2cf0
- 105Rendering: Map: Nearest police station to each cluster of licensed premises. view longitude -87.66722 to -87.63111, latitude 41.87536 to 41.89597 id 85be50e0-3982-4731-8c0e-823fa9294a88
- 106Rendering: Chart: Nearest police station to each cluster of licensed premises. 3 rows id 2dec7314-090d-4c50-abac-7f19aa87b8c3
- 107Catalog: Pipeline (tool description, gp_pipeline). Run up to 20 GIS operations in one engine call; a step's params may use "$id" (an earlier step's result) or "$id.key", and layer references. Every step's map outputs are saved as styled layers. Never calls Mapbox. id gp_pipeline
- 108Plan: CCTV cameras per 10,000 people per feature of Patrol beats (the Start plan's candidate c_c2ae8a2714b2). Patrol beats holds population in 'population': CCTV cameras per 10,000 people in each feature compares features of different size; mapped as a choropleth (natural breaks, sequential colors). id f922208b-bbd9-4f8c-a605-3fb31853d7fd:c_c2ae8a2714b2
- 109Tool result: gp_pipeline, step 0. Pipeline of 2 steps (classify_field > dissolve): 1 layer saved. id 6ca7bfd5-79a6-41c1-bf7d-8e6d94107d57:0
- 110Layer: Dense areas of street light outages. 5 features id ac9b6845-0f71-4373-bd6d-610425383c47
- 111Rendering: Chart: Dense areas of street light outages. 5 rows id eb14b23d-e657-47db-bbb9-6dc855c8b8cc
- 112Tool result: gp_summarize_within, step 0. Summarize within: 1 layer saved: Change of street light outages per patrol beat (16 features). id cc3dd633-eef0-4eb3-8158-2f9fd13fb200:0
- 113Layer: Change of street light outages per patrol beat. 16 features id 3aa058c3-6af3-4495-9b14-12531d1ab9a2
- 114Rendering: Map: Change of street light outages per patrol beat. view longitude -87.69371 to -87.59438, latitude 41.85001 to 41.9067 id 8c09d493-6848-4496-8154-9e4918bed43f
- 115Rendering: Chart: Change of street light outages per patrol beat. 5 rows id f5280b27-6c71-4ddf-ba62-2c3527a68ab7
- 116Rendering: Chart: Incidents over time (reported_at). 318 rows id 77127ac6-8e99-4791-97cd-fae719d89262
- 117Rendering: Chart: Street light outages over time (reported_at). 212 rows id f9621103-3d0a-49ab-b90b-f7b40f93745b
- 118Rendering: Chart: CCTV cameras over time (installed_year). 7 rows id d430a879-effd-4bd0-81f7-baa28a4e5360
- 119Rendering: Chart: Calls for service by beat and month over time (month). 24 rows id 7c56f65f-9b6b-4cdd-a312-17f1982d8de0
- 120Rendering: Chart: Hot spot analysis: CCTV cameras. 12 rows id 64aa9539-922f-4609-8b9a-6ef06a308a05
- 121Rendering: Chart: Hot spot analysis: Licensed premises. 15 rows id 4a5bc439-21a2-432b-9b8c-8615b719b8f0
- 122Rendering: Chart: Emerging hot spots: Incidents. 10 rows id 07721714-421e-4a56-9250-c62be37e8e3e
- 123Rendering: Chart: Emerging hot spots: Street light outages. 7 rows id 890e75d2-c676-4d56-aa47-5dc8fc6b1f37
- 124Rendering: Chart: Find point clusters: Licensed premises. 4 rows id eab8321b-459d-4b21-8ac3-03b4c9716a0b
- 125Rendering: Chart: Find point clusters: cluster hulls. 3 rows id 597c1cc7-6d4d-45ea-805f-e76406a7301d
- 126Rendering: Chart: Find point clusters: Incidents. 4 rows id 834a7e88-1f92-40c3-876e-07b230849ef1
- 127Rendering: Chart: Find point clusters: cluster hulls. 3 rows id b1d73a1a-bd54-4f9a-829e-a64da853e8b8
- 128Rendering: Chart: Find point clusters: Street light outages. 2 rows id da93f938-3c5c-4e4b-a1e9-332a9c4d97c4
- 129Rendering: Chart: Find point clusters: cluster hulls. 1 rows id d0a69a7c-4f2e-46e8-8fbb-3db7d1804d97
- 130Rendering: Chart: Summarize within: Patrol beats. 5 rows id cf0bb795-0579-4a40-a979-e2f725bdfd8a
- 131Rendering: Chart: Summarize within: Patrol beats. 5 rows id cf1142c2-7076-48aa-b438-d97d2f7f83d6
- 132Rendering: Chart: Summarize within: Patrol beats. 5 rows id 85f26d21-089a-4d33-bb0c-b985b8e6ddae
- 133Rendering: Chart: Calculate density: Licensed premises. 9 rows id 3365b9ed-e2bc-4612-b00e-b147032aaa0b
- 134Rendering: Chart: Calculate density: Incidents. 13 rows id 130ec3b4-ddc0-4f62-8c53-493253574a12
- 135Rendering: Chart: Calculate density: Street light outages. 11 rows id 5d19b0ed-c618-4e8e-9536-3f3a0821dcd8
- 136Rendering: Chart: Hot spot analysis: Incidents. 48 rows id dc40d842-a071-4cf4-87b5-9dbd4aff8223
- 137Rendering: Chart: Repeat and near repeat classification: Incidents. 106 rows id 2774b60c-5a11-46d6-a8e1-f56f2a252051
- 138Rendering: Chart: Repeat and near repeat classification: Incidents over time. 106 rows id d3456b40-f8d2-4674-9fe4-b420ca81087b
- 139Rendering: Chart: Find point clusters: Street light outages over time. 52 rows id b7008422-a117-4748-8bb2-7dd55cd29bdd
- 140Rendering: Chart: Find point clusters: Incidents over time. 106 rows id fcaf3d1b-6848-404c-9e97-b57b023c1cbd
- 141Document: Quarterly crime and safety briefing, third quarter 2026. 1 page(s), 1 page(s) from the text layer id 7f7de84b-c518-4d25-b279-e98be530690e
- 142Document page: Quarterly crime and safety briefing, third quarter 2026, page 1. Thefts and robberies remain concentrated around the Central Transit Center at 41.87815, -87.63532, mostly on weekday commuting hours. id 7f7de84b-c518-4d25-b279-e98be530690e:1
- 143Document: Hot spot patrol plan. 1 page(s), 1 page(s) from the text layer id 0bf0414d-d633-4517-a876-66ca320180f3
- 144Document page: Hot spot patrol plan, page 1. Focus id 0bf0414d-d633-4517-a876-66ca320180f3:1
- 145Dataset: Patrol beats. vector, 16 rows id ba848777-0930-4af3-b069-03edd17a2c3a
- 146Dataset: Police stations. vector, 3 rows id d3ceed49-4119-4de8-9218-65b32992e120
- 147Dataset: CCTV cameras. vector, 60 rows id 13e9e089-c520-4be6-9034-c0ecaf7790ab
- 148Dataset: Transit stops. vector, 80 rows id cc2e635f-1052-402a-82aa-95b2db052e76
- 149Dataset: Licensed premises. vector, 120 rows id 1a088947-ca4e-4632-b13d-975d48c05e97
- 150Dataset: Roads. vector, 1033 rows id e72c7c55-1cdd-49b2-b75d-3d2ec18b9c1e
- 151Dataset: Beat staffing by shift. table, 48 rows id 6abb3c2e-68b3-4a9c-b2a7-ce316203ebe8
- 152Dataset: Quarterly crime and safety briefing. document, ? rows id 535a8782-a933-42ff-af25-92ec818afdd6
- 153Dataset: Hot spot patrol plan. document, ? rows id 70e64e98-d266-4079-a9a1-7d54ac2c3e96
- 154Record: Sample: Public safety, Chicago id fe9df6b9-8a15-4264-946b-4b37b8dbb89d
- 155Layer: Hot spot analysis: Licensed premises. 112 features id 90322b1c-a218-4ac5-8478-7f0de2a327dd
- 156Layer: Emerging hot spots: Incidents. 270 features id ddbdee29-f892-4397-9f92-4fb6062a0a16
- 157Layer: Emerging hot spots: Street light outages. 47 features id 377fb9d7-1ae0-4b9d-b202-467adca71899
- 158Layer: Find point clusters: Licensed premises. 120 features id 0f39a418-fa9c-4906-bbe4-7afb6c00ba8c
- 159Layer: Find point clusters: Incidents. 1,680 features id 75dd415e-0b2c-4a18-b79c-cc2338385dd5
- 160Layer: Find point clusters: cluster hulls. 3 features id 99ba9a84-3453-4bca-a43e-5861ef41c540
- 161Layer: Find point clusters: Street light outages. 420 features id 4ac9e9ca-a714-4ec7-9df8-4e3869dbcc58
- 162Layer: Find point clusters: cluster hulls. 1 features id 6d783f7e-8f24-4458-8abc-6e3126e9630a
- 163Layer: Summarize within: Patrol beats. 16 features id 430dcae6-3721-44c7-9264-40595ff75b4e
- 164Layer: Summarize within: Patrol beats. 16 features id fabe7842-f3f5-4d5e-a46f-c3232381dc5f
- 165Layer: Calculate density: Licensed premises. 164 features id 76319405-6afb-4505-946b-c33b783be8eb
- 166Layer: Calculate density: Incidents. 2,874 features id 8d228b68-9a3d-43fd-96a3-e37297b29f9a
- 167Layer: Repeat and near repeat classification: Incidents. 1,680 features id aa6cf905-4fec-4559-9917-c9810ef2a94b
Appendix: the data behind the chartsShow
Figure 1. Timeline: events per month by dataset 1
| period | series | value |
|---|---|---|
| 2024-10-01 | Incidents | 0 |
| 2024-10-01 | Street light outages | 0 |
| 2024-10-01 | Calls for service by beat and month | 16 |
| 2024-11-01 | Incidents | 0 |
| 2024-11-01 | Street light outages | 0 |
| 2024-11-01 | Calls for service by beat and month | 16 |
| 2024-12-01 | Incidents | 0 |
| 2024-12-01 | Street light outages | 0 |
| 2024-12-01 | Calls for service by beat and month | 16 |
| 2025-01-01 | Incidents | 0 |
| 2025-01-01 | Street light outages | 0 |
| 2025-01-01 | Calls for service by beat and month | 16 |
| 2025-02-01 | Incidents | 0 |
| 2025-02-01 | Street light outages | 0 |
| 2025-02-01 | Calls for service by beat and month | 16 |
| 2025-03-01 | Incidents | 0 |
| 2025-03-01 | Street light outages | 0 |
| 2025-03-01 | Calls for service by beat and month | 16 |
| 2025-04-01 | Incidents | 0 |
| 2025-04-01 | Street light outages | 0 |
| 2025-04-01 | Calls for service by beat and month | 16 |
| 2025-05-01 | Incidents | 0 |
| 2025-05-01 | Street light outages | 0 |
| 2025-05-01 | Calls for service by beat and month | 16 |
| 2025-06-01 | Incidents | 0 |
| 2025-06-01 | Street light outages | 0 |
| 2025-06-01 | Calls for service by beat and month | 16 |
| 2025-07-01 | Incidents | 0 |
| 2025-07-01 | Street light outages | 0 |
| 2025-07-01 | Calls for service by beat and month | 16 |
| 2025-08-01 | Incidents | 0 |
| 2025-08-01 | Street light outages | 0 |
| 2025-08-01 | Calls for service by beat and month | 16 |
| 2025-09-01 | Incidents | 0 |
| 2025-09-01 | Street light outages | 0 |
| 2025-09-01 | Calls for service by beat and month | 16 |
| 2025-10-01 | Incidents | 114 |
| 2025-10-01 | Street light outages | 33 |
| 2025-10-01 | Calls for service by beat and month | 16 |
| 2025-11-01 | Incidents | 125 |
| 2025-11-01 | Street light outages | 26 |
| 2025-11-01 | Calls for service by beat and month | 16 |
| 2025-12-01 | Incidents | 119 |
| 2025-12-01 | Street light outages | 40 |
| 2025-12-01 | Calls for service by beat and month | 16 |
| 2026-01-01 | Incidents | 112 |
| 2026-01-01 | Street light outages | 49 |
| 2026-01-01 | Calls for service by beat and month | 16 |
| 2026-02-01 | Incidents | 90 |
| 2026-02-01 | Street light outages | 44 |
| 2026-02-01 | Calls for service by beat and month | 16 |
| 2026-03-01 | Incidents | 126 |
| 2026-03-01 | Street light outages | 37 |
| 2026-03-01 | Calls for service by beat and month | 16 |
| 2026-04-01 | Incidents | 133 |
| 2026-04-01 | Street light outages | 37 |
| 2026-04-01 | Calls for service by beat and month | 16 |
| 2026-05-01 | Incidents | 162 |
| 2026-05-01 | Street light outages | 28 |
| 2026-05-01 | Calls for service by beat and month | 16 |
| 2026-06-01 | Incidents | 143 |
| 2026-06-01 | Street light outages | 33 |
| 2026-06-01 | Calls for service by beat and month | 16 |
| 2026-07-01 | Incidents | 195 |
| 2026-07-01 | Street light outages | 24 |
| 2026-07-01 | Calls for service by beat and month | 16 |
| 2026-08-01 | Incidents | 179 |
| 2026-08-01 | Street light outages | 33 |
| 2026-08-01 | Calls for service by beat and month | 16 |
| 2026-09-01 | Incidents | 182 |
| 2026-09-01 | Street light outages | 36 |
| 2026-09-01 | Calls for service by beat and month | 16 |
Figure 2. Timeline lanes: events per month by dataset 5
| lane | period | period_end | value |
|---|---|---|---|
| Incidents | 2024-10-01 | 2024-11-01 | 0 |
| Incidents | 2024-11-01 | 2024-12-01 | 0 |
| Incidents | 2024-12-01 | 2025-01-01 | 0 |
| Incidents | 2025-01-01 | 2025-02-01 | 0 |
| Incidents | 2025-02-01 | 2025-03-01 | 0 |
| Incidents | 2025-03-01 | 2025-04-01 | 0 |
| Incidents | 2025-04-01 | 2025-05-01 | 0 |
| Incidents | 2025-05-01 | 2025-06-01 | 0 |
| Incidents | 2025-06-01 | 2025-07-01 | 0 |
| Incidents | 2025-07-01 | 2025-08-01 | 0 |
| Incidents | 2025-08-01 | 2025-09-01 | 0 |
| Incidents | 2025-09-01 | 2025-10-01 | 0 |
| Incidents | 2025-10-01 | 2025-11-01 | 114 |
| Incidents | 2025-11-01 | 2025-12-01 | 125 |
| Incidents | 2025-12-01 | 2026-01-01 | 119 |
| Incidents | 2026-01-01 | 2026-02-01 | 112 |
| Incidents | 2026-02-01 | 2026-03-01 | 90 |
| Incidents | 2026-03-01 | 2026-04-01 | 126 |
| Incidents | 2026-04-01 | 2026-05-01 | 133 |
| Incidents | 2026-05-01 | 2026-06-01 | 162 |
| Incidents | 2026-06-01 | 2026-07-01 | 143 |
| Incidents | 2026-07-01 | 2026-08-01 | 195 |
| Incidents | 2026-08-01 | 2026-09-01 | 179 |
| Incidents | 2026-09-01 | 2026-10-01 | 182 |
| Street light outages | 2024-10-01 | 2024-11-01 | 0 |
| Street light outages | 2024-11-01 | 2024-12-01 | 0 |
| Street light outages | 2024-12-01 | 2025-01-01 | 0 |
| Street light outages | 2025-01-01 | 2025-02-01 | 0 |
| Street light outages | 2025-02-01 | 2025-03-01 | 0 |
| Street light outages | 2025-03-01 | 2025-04-01 | 0 |
| Street light outages | 2025-04-01 | 2025-05-01 | 0 |
| Street light outages | 2025-05-01 | 2025-06-01 | 0 |
| Street light outages | 2025-06-01 | 2025-07-01 | 0 |
| Street light outages | 2025-07-01 | 2025-08-01 | 0 |
| Street light outages | 2025-08-01 | 2025-09-01 | 0 |
| Street light outages | 2025-09-01 | 2025-10-01 | 0 |
| Street light outages | 2025-10-01 | 2025-11-01 | 33 |
| Street light outages | 2025-11-01 | 2025-12-01 | 26 |
| Street light outages | 2025-12-01 | 2026-01-01 | 40 |
| Street light outages | 2026-01-01 | 2026-02-01 | 49 |
| Street light outages | 2026-02-01 | 2026-03-01 | 44 |
| Street light outages | 2026-03-01 | 2026-04-01 | 37 |
| Street light outages | 2026-04-01 | 2026-05-01 | 37 |
| Street light outages | 2026-05-01 | 2026-06-01 | 28 |
| Street light outages | 2026-06-01 | 2026-07-01 | 33 |
| Street light outages | 2026-07-01 | 2026-08-01 | 24 |
| Street light outages | 2026-08-01 | 2026-09-01 | 33 |
| Street light outages | 2026-09-01 | 2026-10-01 | 36 |
| Calls for service by beat and month | 2024-10-01 | 2024-11-01 | 16 |
| Calls for service by beat and month | 2024-11-01 | 2024-12-01 | 16 |
| Calls for service by beat and month | 2024-12-01 | 2025-01-01 | 16 |
| Calls for service by beat and month | 2025-01-01 | 2025-02-01 | 16 |
| Calls for service by beat and month | 2025-02-01 | 2025-03-01 | 16 |
| Calls for service by beat and month | 2025-03-01 | 2025-04-01 | 16 |
| Calls for service by beat and month | 2025-04-01 | 2025-05-01 | 16 |
| Calls for service by beat and month | 2025-05-01 | 2025-06-01 | 16 |
| Calls for service by beat and month | 2025-06-01 | 2025-07-01 | 16 |
| Calls for service by beat and month | 2025-07-01 | 2025-08-01 | 16 |
| Calls for service by beat and month | 2025-08-01 | 2025-09-01 | 16 |
| Calls for service by beat and month | 2025-09-01 | 2025-10-01 | 16 |
| Calls for service by beat and month | 2025-10-01 | 2025-11-01 | 16 |
| Calls for service by beat and month | 2025-11-01 | 2025-12-01 | 16 |
| Calls for service by beat and month | 2025-12-01 | 2026-01-01 | 16 |
| Calls for service by beat and month | 2026-01-01 | 2026-02-01 | 16 |
| Calls for service by beat and month | 2026-02-01 | 2026-03-01 | 16 |
| Calls for service by beat and month | 2026-03-01 | 2026-04-01 | 16 |
| Calls for service by beat and month | 2026-04-01 | 2026-05-01 | 16 |
| Calls for service by beat and month | 2026-05-01 | 2026-06-01 | 16 |
| Calls for service by beat and month | 2026-06-01 | 2026-07-01 | 16 |
| Calls for service by beat and month | 2026-07-01 | 2026-08-01 | 16 |
| Calls for service by beat and month | 2026-08-01 | 2026-09-01 | 16 |
| Calls for service by beat and month | 2026-09-01 | 2026-10-01 | 16 |
Figure 3. Timeline: change from one month to the next 6
| period | period_end | value | previous | change |
|---|---|---|---|---|
| 2024-11-01 | 2024-12-01 | 16 | 16 | 0 |
| 2024-12-01 | 2025-01-01 | 16 | 16 | 0 |
| 2025-01-01 | 2025-02-01 | 16 | 16 | 0 |
| 2025-02-01 | 2025-03-01 | 16 | 16 | 0 |
| 2025-03-01 | 2025-04-01 | 16 | 16 | 0 |
| 2025-04-01 | 2025-05-01 | 16 | 16 | 0 |
| 2025-05-01 | 2025-06-01 | 16 | 16 | 0 |
| 2025-06-01 | 2025-07-01 | 16 | 16 | 0 |
| 2025-07-01 | 2025-08-01 | 16 | 16 | 0 |
| 2025-08-01 | 2025-09-01 | 16 | 16 | 0 |
| 2025-09-01 | 2025-10-01 | 16 | 16 | 0 |
| 2025-10-01 | 2025-11-01 | 163 | 16 | 147 |
| 2025-11-01 | 2025-12-01 | 167 | 163 | 4 |
| 2025-12-01 | 2026-01-01 | 175 | 167 | 8 |
| 2026-01-01 | 2026-02-01 | 177 | 175 | 2 |
| 2026-02-01 | 2026-03-01 | 150 | 177 | -27 |
| 2026-03-01 | 2026-04-01 | 179 | 150 | 29 |
| 2026-04-01 | 2026-05-01 | 186 | 179 | 7 |
| 2026-05-01 | 2026-06-01 | 206 | 186 | 20 |
| 2026-06-01 | 2026-07-01 | 192 | 206 | -14 |
| 2026-07-01 | 2026-08-01 | 235 | 192 | 43 |
| 2026-08-01 | 2026-09-01 | 228 | 235 | -7 |
| 2026-09-01 | 2026-10-01 | 234 | 228 | 6 |
Figure 16. Incidents: count per week 55
| period | value |
|---|---|
| 2025-09-29 | 16 |
| 2025-10-06 | 25 |
| 2025-10-13 | 29 |
| 2025-10-20 | 19 |
| 2025-10-27 | 31 |
| 2025-11-03 | 37 |
| 2025-11-10 | 31 |
| 2025-11-17 | 31 |
| 2025-11-24 | 20 |
| 2025-12-01 | 22 |
| 2025-12-08 | 32 |
| 2025-12-15 | 28 |
| 2025-12-22 | 24 |
| 2025-12-29 | 32 |
| 2026-01-05 | 22 |
| 2026-01-12 | 24 |
| 2026-01-19 | 26 |
| 2026-01-26 | 24 |
| 2026-02-02 | 18 |
| 2026-02-09 | 18 |
| 2026-02-16 | 26 |
| 2026-02-23 | 29 |
| 2026-03-02 | 16 |
| 2026-03-09 | 23 |
| 2026-03-16 | 34 |
| 2026-03-23 | 39 |
| 2026-03-30 | 25 |
| 2026-04-06 | 41 |
| 2026-04-13 | 22 |
| 2026-04-20 | 36 |
| 2026-04-27 | 36 |
| 2026-05-04 | 36 |
| 2026-05-11 | 32 |
| 2026-05-18 | 40 |
| 2026-05-25 | 37 |
| 2026-06-01 | 22 |
| 2026-06-08 | 37 |
| 2026-06-15 | 42 |
| 2026-06-22 | 33 |
| 2026-06-29 | 72 |
| 2026-07-06 | 34 |
| 2026-07-13 | 36 |
| 2026-07-20 | 36 |
| 2026-07-27 | 40 |
| 2026-08-03 | 31 |
| 2026-08-10 | 24 |
| 2026-08-17 | 46 |
| 2026-08-24 | 55 |
| 2026-08-31 | 41 |
| 2026-09-07 | 41 |
| 2026-09-14 | 49 |
| 2026-09-21 | 47 |
| 2026-09-28 | 13 |
Figure 17. Incidents: week of 2026-06-22 to week of 2026-06-29 by place 56
| group | period | value |
|---|---|---|
| Market West Beat | week of 2026-06-22 | 7 |
| Market West Beat | week of 2026-06-29 | 16 |
| Kingsway Beat | week of 2026-06-22 | 6 |
| Kingsway Beat | week of 2026-06-29 | 13 |
| Southgate Beat | week of 2026-06-22 | 2 |
| Southgate Beat | week of 2026-06-29 | 9 |
| Elm Park Beat | week of 2026-06-22 | 5 |
| Elm Park Beat | week of 2026-06-29 | 9 |
| North River Beat | week of 2026-06-22 | 5 |
| North River Beat | week of 2026-06-29 | 9 |
| Granary Beat | week of 2026-06-22 | 2 |
| Granary Beat | week of 2026-06-29 | 0 |
| Midtown Beat | week of 2026-06-22 | 1 |
| Midtown Beat | week of 2026-06-29 | 3 |
| Old Mill Beat | week of 2026-06-22 | 1 |
| Old Mill Beat | week of 2026-06-29 | 3 |
| Westbrook Beat | week of 2026-06-22 | 0 |
| Westbrook Beat | week of 2026-06-29 | 2 |
| Brickworks Beat | week of 2026-06-22 | 0 |
| Brickworks Beat | week of 2026-06-29 | 1 |
| Cedar Heights Beat | week of 2026-06-22 | 0 |
| Cedar Heights Beat | week of 2026-06-29 | 1 |
| Foundry Beat | week of 2026-06-22 | 0 |
| Foundry Beat | week of 2026-06-29 | 1 |
| Parkview Beat | week of 2026-06-22 | 2 |
| Parkview Beat | week of 2026-06-29 | 1 |
| Station Quarter Beat | week of 2026-06-22 | 1 |
| Station Quarter Beat | week of 2026-06-29 | 2 |
| Union Yards Beat | week of 2026-06-22 | 0 |
| Union Yards Beat | week of 2026-06-29 | 1 |
Figure 18. Period change: Incidents (week of 2026-06-22 to week of 2026-06-29) 57
| bin_start | bin_end | count |
|---|---|---|
| -1.414 | -0.7092 | 1 |
| -0.7092 | -0.00428 | 1 |
| -0.00428 | 0.7007 | 2 |
| 0.7007 | 1.406 | 8 |
| 1.406 | 2.111 | 4 |
Figure 20. Street light outages: count per week 59
| period | value |
|---|---|
| 2025-09-29 | 4 |
| 2025-10-06 | 6 |
| 2025-10-13 | 6 |
| 2025-10-20 | 10 |
| 2025-10-27 | 10 |
| 2025-11-03 | 7 |
| 2025-11-10 | 7 |
| 2025-11-17 | 4 |
| 2025-11-24 | 5 |
| 2025-12-01 | 14 |
| 2025-12-08 | 11 |
| 2025-12-15 | 7 |
| 2025-12-22 | 7 |
| 2025-12-29 | 11 |
| 2026-01-05 | 9 |
| 2026-01-12 | 9 |
| 2026-01-19 | 16 |
| 2026-01-26 | 6 |
| 2026-02-02 | 17 |
| 2026-02-09 | 4 |
| 2026-02-16 | 12 |
| 2026-02-23 | 11 |
| 2026-03-02 | 4 |
| 2026-03-09 | 9 |
| 2026-03-16 | 6 |
| 2026-03-23 | 12 |
| 2026-03-30 | 13 |
| 2026-04-06 | 9 |
| 2026-04-13 | 9 |
| 2026-04-20 | 7 |
| 2026-04-27 | 7 |
| 2026-05-04 | 3 |
| 2026-05-11 | 8 |
| 2026-05-18 | 8 |
| 2026-05-25 | 6 |
| 2026-06-01 | 12 |
| 2026-06-08 | 7 |
| 2026-06-15 | 3 |
| 2026-06-22 | 10 |
| 2026-06-29 | 5 |
| 2026-07-06 | 6 |
| 2026-07-13 | 6 |
| 2026-07-20 | 7 |
| 2026-07-27 | 6 |
| 2026-08-03 | 7 |
| 2026-08-10 | 9 |
| 2026-08-17 | 6 |
| 2026-08-24 | 5 |
| 2026-08-31 | 10 |
| 2026-09-07 | 8 |
| 2026-09-14 | 8 |
| 2026-09-21 | 9 |
| 2026-09-28 | 2 |
Figure 21. Street light outages: week of 2026-02-02 to week of 2026-02-09 by place 60
| group | period | value |
|---|---|---|
| Market West Beat | week of 2026-02-02 | 9 |
| Market West Beat | week of 2026-02-09 | 2 |
| North River Beat | week of 2026-02-02 | 3 |
| North River Beat | week of 2026-02-09 | 0 |
| Parkview Beat | week of 2026-02-02 | 0 |
| Parkview Beat | week of 2026-02-09 | 2 |
| Southgate Beat | week of 2026-02-02 | 2 |
| Southgate Beat | week of 2026-02-09 | 0 |
| Canal Row Beat | week of 2026-02-02 | 1 |
| Canal Row Beat | week of 2026-02-09 | 0 |
| Cedar Heights Beat | week of 2026-02-02 | 1 |
| Cedar Heights Beat | week of 2026-02-09 | 0 |
| Westbrook Beat | week of 2026-02-02 | 1 |
| Westbrook Beat | week of 2026-02-09 | 0 |
Figure 22. Period change: Street light outages (week of 2026-02-02 to week of 2026-02-09) 61
| bin_start | bin_end | count |
|---|---|---|
| -2.111 | -1.406 | 3 |
| -1.406 | -0.7007 | 3 |
| -0.7007 | 0.00428 | 0 |
| 0.00428 | 0.7092 | 0 |
| 0.7092 | 1.414 | 1 |
Figure 29. Hot cells inside each cluster of licensed premises 84
| cluster | features | fraction | share |
|---|---|---|---|
| 0 | 1 | 0.3333 | 33.3% |
| 1 | 1 | 0.3333 | 33.3% |
| 2 | 1 | 0.3333 | 33.3% |
Figure 31. Change beside the counts per patrol beat 91
| bin_start | bin_end | count |
|---|---|---|
| -1.414 | -0.7092 | 1 |
| -0.7092 | -0.00428 | 1 |
| -0.00428 | 0.7007 | 2 |
| 0.7007 | 1.406 | 8 |
| 1.406 | 2.111 | 4 |
Figure 33. Change of incidents where density is high 96
| bin_start | bin_end | count |
|---|---|---|
| -1.414 | -0.7092 | 1 |
| -0.7092 | -0.00428 | 1 |
| -0.00428 | 0.7007 | 2 |
| 0.7007 | 1.406 | 8 |
| 1.406 | 2.111 | 4 |
Figure 35. Hot cells of CCTV cameras per patrol beat 101
| bin_start | bin_end | count |
|---|---|---|
| 2 | 3 | 1 |
| 3 | 4 | 0 |
| 4 | 5 | 2 |
| 5 | 6 | 4 |
| 6 | 7 | 9 |
Figure 37. Nearest police station to each cluster of licensed premises 106
| rank | name |
|---|---|
| 1 | Central District Station |
| 1 | Central District Station |
| 1 | Central District Station |
Figure 38. Dense areas of street light outages 111
| bin_start | bin_end | count |
|---|---|---|
| 0 | 0.8 | 1 |
| 0.8 | 1.6 | 1 |
| 1.6 | 2.4 | 1 |
| 2.4 | 3.2 | 1 |
| 3.2 | 4 | 1 |
Figure 40. Change of street light outages per patrol beat 115
| bin_start | bin_end | count |
|---|---|---|
| 0 | 0.2 | 9 |
| 0.2 | 0.4 | 0 |
| 0.4 | 0.6 | 0 |
| 0.6 | 0.8 | 0 |
| 0.8 | 1 | 7 |
Figure 41. Incidents over time (reported_at) 116
| period | series | value |
|---|---|---|
| 2025-09-29 | theft | 8 |
| 2025-09-29 | battery | 4 |
| 2025-09-29 | criminal damage | 0 |
| 2025-09-29 | burglary | 1 |
| 2025-09-29 | motor vehicle theft | 0 |
| 2025-09-29 | Other | 3 |
| 2025-10-06 | theft | 8 |
| 2025-10-06 | battery | 1 |
| 2025-10-06 | criminal damage | 3 |
| 2025-10-06 | burglary | 9 |
| 2025-10-06 | motor vehicle theft | 0 |
| 2025-10-06 | Other | 4 |
| 2025-10-13 | theft | 10 |
| 2025-10-13 | battery | 5 |
| 2025-10-13 | criminal damage | 6 |
| 2025-10-13 | burglary | 1 |
| 2025-10-13 | motor vehicle theft | 3 |
| 2025-10-13 | Other | 4 |
| 2025-10-20 | theft | 8 |
| 2025-10-20 | battery | 2 |
| 2025-10-20 | criminal damage | 3 |
| 2025-10-20 | burglary | 2 |
| 2025-10-20 | motor vehicle theft | 2 |
| 2025-10-20 | Other | 2 |
| 2025-10-27 | theft | 11 |
| 2025-10-27 | battery | 5 |
| 2025-10-27 | criminal damage | 3 |
| 2025-10-27 | burglary | 5 |
| 2025-10-27 | motor vehicle theft | 1 |
| 2025-10-27 | Other | 6 |
| 2025-11-03 | theft | 12 |
| 2025-11-03 | battery | 7 |
| 2025-11-03 | criminal damage | 1 |
| 2025-11-03 | burglary | 7 |
| 2025-11-03 | motor vehicle theft | 1 |
| 2025-11-03 | Other | 9 |
| 2025-11-10 | theft | 7 |
| 2025-11-10 | battery | 8 |
| 2025-11-10 | criminal damage | 5 |
| 2025-11-10 | burglary | 2 |
| 2025-11-10 | motor vehicle theft | 4 |
| 2025-11-10 | Other | 5 |
| 2025-11-17 | theft | 9 |
| 2025-11-17 | battery | 4 |
| 2025-11-17 | criminal damage | 5 |
| 2025-11-17 | burglary | 3 |
| 2025-11-17 | motor vehicle theft | 4 |
| 2025-11-17 | Other | 6 |
| 2025-11-24 | theft | 5 |
| 2025-11-24 | battery | 3 |
| 2025-11-24 | criminal damage | 2 |
| 2025-11-24 | burglary | 2 |
| 2025-11-24 | motor vehicle theft | 4 |
| 2025-11-24 | Other | 4 |
| 2025-12-01 | theft | 6 |
| 2025-12-01 | battery | 4 |
| 2025-12-01 | criminal damage | 4 |
| 2025-12-01 | burglary | 3 |
| 2025-12-01 | motor vehicle theft | 0 |
| 2025-12-01 | Other | 5 |
| 2025-12-08 | theft | 8 |
| 2025-12-08 | battery | 3 |
| 2025-12-08 | criminal damage | 8 |
| 2025-12-08 | burglary | 4 |
| 2025-12-08 | motor vehicle theft | 2 |
| 2025-12-08 | Other | 7 |
| 2025-12-15 | theft | 8 |
| 2025-12-15 | battery | 5 |
| 2025-12-15 | criminal damage | 6 |
| 2025-12-15 | burglary | 2 |
| 2025-12-15 | motor vehicle theft | 2 |
| 2025-12-15 | Other | 5 |
| 2025-12-22 | theft | 8 |
| 2025-12-22 | battery | 2 |
| 2025-12-22 | criminal damage | 3 |
| 2025-12-22 | burglary | 5 |
| 2025-12-22 | motor vehicle theft | 2 |
| 2025-12-22 | Other | 4 |
| 2025-12-29 | theft | 11 |
| 2025-12-29 | battery | 2 |
| 2025-12-29 | criminal damage | 6 |
| 2025-12-29 | burglary | 4 |
| 2025-12-29 | motor vehicle theft | 1 |
| 2025-12-29 | Other | 8 |
| 2026-01-05 | theft | 7 |
| 2026-01-05 | battery | 5 |
| 2026-01-05 | criminal damage | 3 |
| 2026-01-05 | burglary | 0 |
| 2026-01-05 | motor vehicle theft | 4 |
| 2026-01-05 | Other | 3 |
| 2026-01-12 | theft | 10 |
| 2026-01-12 | battery | 3 |
| 2026-01-12 | criminal damage | 0 |
| 2026-01-12 | burglary | 5 |
| 2026-01-12 | motor vehicle theft | 3 |
| 2026-01-12 | Other | 3 |
| 2026-01-19 | theft | 10 |
| 2026-01-19 | battery | 1 |
| 2026-01-19 | criminal damage | 1 |
| 2026-01-19 | burglary | 4 |
| 2026-01-19 | motor vehicle theft | 2 |
| 2026-01-19 | Other | 8 |
| 2026-01-26 | theft | 12 |
| 2026-01-26 | battery | 1 |
| 2026-01-26 | criminal damage | 3 |
| 2026-01-26 | burglary | 3 |
| 2026-01-26 | motor vehicle theft | 0 |
| 2026-01-26 | Other | 5 |
| 2026-02-02 | theft | 9 |
| 2026-02-02 | battery | 1 |
| 2026-02-02 | criminal damage | 1 |
| 2026-02-02 | burglary | 1 |
| 2026-02-02 | motor vehicle theft | 4 |
| 2026-02-02 | Other | 2 |
| 2026-02-09 | theft | 6 |
| 2026-02-09 | battery | 2 |
| 2026-02-09 | criminal damage | 2 |
| 2026-02-09 | burglary | 3 |
| 2026-02-09 | motor vehicle theft | 3 |
| 2026-02-09 | Other | 2 |
| 2026-02-16 | theft | 9 |
| 2026-02-16 | battery | 3 |
| 2026-02-16 | criminal damage | 2 |
| 2026-02-16 | burglary | 7 |
| 2026-02-16 | motor vehicle theft | 3 |
| 2026-02-16 | Other | 2 |
| 2026-02-23 | theft | 13 |
| 2026-02-23 | battery | 4 |
| 2026-02-23 | criminal damage | 1 |
| 2026-02-23 | burglary | 0 |
| 2026-02-23 | motor vehicle theft | 6 |
| 2026-02-23 | Other | 5 |
| 2026-03-02 | theft | 5 |
| 2026-03-02 | battery | 1 |
| 2026-03-02 | criminal damage | 1 |
| 2026-03-02 | burglary | 4 |
| 2026-03-02 | motor vehicle theft | 3 |
| 2026-03-02 | Other | 2 |
| 2026-03-09 | theft | 7 |
| 2026-03-09 | battery | 4 |
| 2026-03-09 | criminal damage | 2 |
| 2026-03-09 | burglary | 1 |
| 2026-03-09 | motor vehicle theft | 6 |
| 2026-03-09 | Other | 3 |
| 2026-03-16 | theft | 7 |
| 2026-03-16 | battery | 8 |
| 2026-03-16 | criminal damage | 6 |
| 2026-03-16 | burglary | 7 |
| 2026-03-16 | motor vehicle theft | 1 |
| 2026-03-16 | Other | 5 |
| 2026-03-23 | theft | 9 |
| 2026-03-23 | battery | 4 |
| 2026-03-23 | criminal damage | 5 |
| 2026-03-23 | burglary | 5 |
| 2026-03-23 | motor vehicle theft | 7 |
| 2026-03-23 | Other | 9 |
| 2026-03-30 | theft | 6 |
| 2026-03-30 | battery | 8 |
| 2026-03-30 | criminal damage | 2 |
| 2026-03-30 | burglary | 2 |
| 2026-03-30 | motor vehicle theft | 3 |
| 2026-03-30 | Other | 4 |
| 2026-04-06 | theft | 11 |
| 2026-04-06 | battery | 7 |
| 2026-04-06 | criminal damage | 5 |
| 2026-04-06 | burglary | 8 |
| 2026-04-06 | motor vehicle theft | 5 |
| 2026-04-06 | Other | 5 |
| 2026-04-13 | theft | 8 |
| 2026-04-13 | battery | 7 |
| 2026-04-13 | criminal damage | 1 |
| 2026-04-13 | burglary | 2 |
| 2026-04-13 | motor vehicle theft | 2 |
| 2026-04-13 | Other | 2 |
| 2026-04-20 | theft | 9 |
| 2026-04-20 | battery | 9 |
| 2026-04-20 | criminal damage | 5 |
| 2026-04-20 | burglary | 5 |
| 2026-04-20 | motor vehicle theft | 3 |
| 2026-04-20 | Other | 5 |
| 2026-04-27 | theft | 9 |
| 2026-04-27 | battery | 10 |
| 2026-04-27 | criminal damage | 6 |
| 2026-04-27 | burglary | 4 |
| 2026-04-27 | motor vehicle theft | 2 |
| 2026-04-27 | Other | 5 |
| 2026-05-04 | theft | 14 |
| 2026-05-04 | battery | 2 |
| 2026-05-04 | criminal damage | 7 |
| 2026-05-04 | burglary | 4 |
| 2026-05-04 | motor vehicle theft | 4 |
| 2026-05-04 | Other | 5 |
| 2026-05-11 | theft | 11 |
| 2026-05-11 | battery | 4 |
| 2026-05-11 | criminal damage | 2 |
| 2026-05-11 | burglary | 7 |
| 2026-05-11 | motor vehicle theft | 5 |
| 2026-05-11 | Other | 3 |
| 2026-05-18 | theft | 14 |
| 2026-05-18 | battery | 7 |
| 2026-05-18 | criminal damage | 7 |
| 2026-05-18 | burglary | 3 |
| 2026-05-18 | motor vehicle theft | 3 |
| 2026-05-18 | Other | 6 |
| 2026-05-25 | theft | 14 |
| 2026-05-25 | battery | 5 |
| 2026-05-25 | criminal damage | 7 |
| 2026-05-25 | burglary | 3 |
| 2026-05-25 | motor vehicle theft | 3 |
| 2026-05-25 | Other | 5 |
| 2026-06-01 | theft | 6 |
| 2026-06-01 | battery | 3 |
| 2026-06-01 | criminal damage | 6 |
| 2026-06-01 | burglary | 2 |
| 2026-06-01 | motor vehicle theft | 3 |
| 2026-06-01 | Other | 2 |
| 2026-06-08 | theft | 6 |
| 2026-06-08 | battery | 7 |
| 2026-06-08 | criminal damage | 7 |
| 2026-06-08 | burglary | 7 |
| 2026-06-08 | motor vehicle theft | 5 |
| 2026-06-08 | Other | 5 |
| 2026-06-15 | theft | 8 |
| 2026-06-15 | battery | 14 |
| 2026-06-15 | criminal damage | 4 |
| 2026-06-15 | burglary | 4 |
| 2026-06-15 | motor vehicle theft | 6 |
| 2026-06-15 | Other | 6 |
| 2026-06-22 | theft | 12 |
| 2026-06-22 | battery | 6 |
| 2026-06-22 | criminal damage | 10 |
| 2026-06-22 | burglary | 1 |
| 2026-06-22 | motor vehicle theft | 2 |
| 2026-06-22 | Other | 2 |
| 2026-06-29 | theft | 20 |
| 2026-06-29 | battery | 21 |
| 2026-06-29 | criminal damage | 9 |
| 2026-06-29 | burglary | 6 |
| 2026-06-29 | motor vehicle theft | 7 |
| 2026-06-29 | Other | 9 |
| 2026-07-06 | theft | 12 |
| 2026-07-06 | battery | 7 |
| 2026-07-06 | criminal damage | 1 |
| 2026-07-06 | burglary | 7 |
| 2026-07-06 | motor vehicle theft | 3 |
| 2026-07-06 | Other | 4 |
| 2026-07-13 | theft | 9 |
| 2026-07-13 | battery | 4 |
| 2026-07-13 | criminal damage | 4 |
| 2026-07-13 | burglary | 4 |
| 2026-07-13 | motor vehicle theft | 7 |
| 2026-07-13 | Other | 8 |
| 2026-07-20 | theft | 7 |
| 2026-07-20 | battery | 9 |
| 2026-07-20 | criminal damage | 6 |
| 2026-07-20 | burglary | 2 |
| 2026-07-20 | motor vehicle theft | 3 |
| 2026-07-20 | Other | 9 |
| 2026-07-27 | theft | 15 |
| 2026-07-27 | battery | 5 |
| 2026-07-27 | criminal damage | 6 |
| 2026-07-27 | burglary | 3 |
| 2026-07-27 | motor vehicle theft | 7 |
| 2026-07-27 | Other | 4 |
| 2026-08-03 | theft | 11 |
| 2026-08-03 | battery | 7 |
| 2026-08-03 | criminal damage | 4 |
| 2026-08-03 | burglary | 1 |
| 2026-08-03 | motor vehicle theft | 4 |
| 2026-08-03 | Other | 4 |
| 2026-08-10 | theft | 11 |
| 2026-08-10 | battery | 2 |
| 2026-08-10 | criminal damage | 3 |
| 2026-08-10 | burglary | 1 |
| 2026-08-10 | motor vehicle theft | 4 |
| 2026-08-10 | Other | 3 |
| 2026-08-17 | theft | 18 |
| 2026-08-17 | battery | 6 |
| 2026-08-17 | criminal damage | 7 |
| 2026-08-17 | burglary | 5 |
| 2026-08-17 | motor vehicle theft | 6 |
| 2026-08-17 | Other | 4 |
| 2026-08-24 | theft | 18 |
| 2026-08-24 | battery | 7 |
| 2026-08-24 | criminal damage | 5 |
| 2026-08-24 | burglary | 5 |
| 2026-08-24 | motor vehicle theft | 8 |
| 2026-08-24 | Other | 12 |
| 2026-08-31 | theft | 15 |
| 2026-08-31 | battery | 8 |
| 2026-08-31 | criminal damage | 2 |
| 2026-08-31 | burglary | 3 |
| 2026-08-31 | motor vehicle theft | 6 |
| 2026-08-31 | Other | 7 |
| 2026-09-07 | theft | 19 |
| 2026-09-07 | battery | 3 |
| 2026-09-07 | criminal damage | 3 |
| 2026-09-07 | burglary | 5 |
| 2026-09-07 | motor vehicle theft | 2 |
| 2026-09-07 | Other | 9 |
| 2026-09-14 | theft | 15 |
| 2026-09-14 | battery | 12 |
| 2026-09-14 | criminal damage | 4 |
| 2026-09-14 | burglary | 7 |
| 2026-09-14 | motor vehicle theft | 4 |
| 2026-09-14 | Other | 7 |
| 2026-09-21 | theft | 17 |
| 2026-09-21 | battery | 9 |
| 2026-09-21 | criminal damage | 1 |
| 2026-09-21 | burglary | 5 |
| 2026-09-21 | motor vehicle theft | 7 |
| 2026-09-21 | Other | 8 |
| 2026-09-28 | theft | 1 |
| 2026-09-28 | battery | 5 |
| 2026-09-28 | criminal damage | 1 |
| 2026-09-28 | burglary | 0 |
| 2026-09-28 | motor vehicle theft | 1 |
| 2026-09-28 | Other | 5 |
Figure 42. Street light outages over time (reported_at) 117
| period | series | value |
|---|---|---|
| 2025-09-29 | lamp failure | 2 |
| 2025-09-29 | cable fault | 1 |
| 2025-09-29 | vandalism | 1 |
| 2025-09-29 | collision | 0 |
| 2025-10-06 | lamp failure | 4 |
| 2025-10-06 | cable fault | 0 |
| 2025-10-06 | vandalism | 2 |
| 2025-10-06 | collision | 0 |
| 2025-10-13 | lamp failure | 4 |
| 2025-10-13 | cable fault | 0 |
| 2025-10-13 | vandalism | 2 |
| 2025-10-13 | collision | 0 |
| 2025-10-20 | lamp failure | 6 |
| 2025-10-20 | cable fault | 3 |
| 2025-10-20 | vandalism | 0 |
| 2025-10-20 | collision | 1 |
| 2025-10-27 | lamp failure | 3 |
| 2025-10-27 | cable fault | 3 |
| 2025-10-27 | vandalism | 3 |
| 2025-10-27 | collision | 1 |
| 2025-11-03 | lamp failure | 4 |
| 2025-11-03 | cable fault | 2 |
| 2025-11-03 | vandalism | 1 |
| 2025-11-03 | collision | 0 |
| 2025-11-10 | lamp failure | 5 |
| 2025-11-10 | cable fault | 1 |
| 2025-11-10 | vandalism | 1 |
| 2025-11-10 | collision | 0 |
| 2025-11-17 | lamp failure | 2 |
| 2025-11-17 | cable fault | 1 |
| 2025-11-17 | vandalism | 1 |
| 2025-11-17 | collision | 0 |
| 2025-11-24 | lamp failure | 2 |
| 2025-11-24 | cable fault | 0 |
| 2025-11-24 | vandalism | 2 |
| 2025-11-24 | collision | 1 |
| 2025-12-01 | lamp failure | 6 |
| 2025-12-01 | cable fault | 4 |
| 2025-12-01 | vandalism | 2 |
| 2025-12-01 | collision | 2 |
| 2025-12-08 | lamp failure | 6 |
| 2025-12-08 | cable fault | 1 |
| 2025-12-08 | vandalism | 2 |
| 2025-12-08 | collision | 2 |
| 2025-12-15 | lamp failure | 2 |
| 2025-12-15 | cable fault | 2 |
| 2025-12-15 | vandalism | 2 |
| 2025-12-15 | collision | 1 |
| 2025-12-22 | lamp failure | 2 |
| 2025-12-22 | cable fault | 4 |
| 2025-12-22 | vandalism | 0 |
| 2025-12-22 | collision | 1 |
| 2025-12-29 | lamp failure | 7 |
| 2025-12-29 | cable fault | 3 |
| 2025-12-29 | vandalism | 0 |
| 2025-12-29 | collision | 1 |
| 2026-01-05 | lamp failure | 5 |
| 2026-01-05 | cable fault | 3 |
| 2026-01-05 | vandalism | 1 |
| 2026-01-05 | collision | 0 |
| 2026-01-12 | lamp failure | 5 |
| 2026-01-12 | cable fault | 1 |
| 2026-01-12 | vandalism | 1 |
| 2026-01-12 | collision | 2 |
| 2026-01-19 | lamp failure | 6 |
| 2026-01-19 | cable fault | 6 |
| 2026-01-19 | vandalism | 3 |
| 2026-01-19 | collision | 1 |
| 2026-01-26 | lamp failure | 1 |
| 2026-01-26 | cable fault | 2 |
| 2026-01-26 | vandalism | 1 |
| 2026-01-26 | collision | 2 |
| 2026-02-02 | lamp failure | 8 |
| 2026-02-02 | cable fault | 1 |
| 2026-02-02 | vandalism | 5 |
| 2026-02-02 | collision | 3 |
| 2026-02-09 | lamp failure | 2 |
| 2026-02-09 | cable fault | 1 |
| 2026-02-09 | vandalism | 0 |
| 2026-02-09 | collision | 1 |
| 2026-02-16 | lamp failure | 4 |
| 2026-02-16 | cable fault | 1 |
| 2026-02-16 | vandalism | 4 |
| 2026-02-16 | collision | 3 |
| 2026-02-23 | lamp failure | 6 |
| 2026-02-23 | cable fault | 2 |
| 2026-02-23 | vandalism | 1 |
| 2026-02-23 | collision | 2 |
| 2026-03-02 | lamp failure | 1 |
| 2026-03-02 | cable fault | 3 |
| 2026-03-02 | vandalism | 0 |
| 2026-03-02 | collision | 0 |
| 2026-03-09 | lamp failure | 4 |
| 2026-03-09 | cable fault | 4 |
| 2026-03-09 | vandalism | 0 |
| 2026-03-09 | collision | 1 |
| 2026-03-16 | lamp failure | 3 |
| 2026-03-16 | cable fault | 2 |
| 2026-03-16 | vandalism | 1 |
| 2026-03-16 | collision | 0 |
| 2026-03-23 | lamp failure | 8 |
| 2026-03-23 | cable fault | 1 |
| 2026-03-23 | vandalism | 3 |
| 2026-03-23 | collision | 0 |
| 2026-03-30 | lamp failure | 10 |
| 2026-03-30 | cable fault | 1 |
| 2026-03-30 | vandalism | 1 |
| 2026-03-30 | collision | 1 |
| 2026-04-06 | lamp failure | 3 |
| 2026-04-06 | cable fault | 3 |
| 2026-04-06 | vandalism | 2 |
| 2026-04-06 | collision | 1 |
| 2026-04-13 | lamp failure | 6 |
| 2026-04-13 | cable fault | 2 |
| 2026-04-13 | vandalism | 1 |
| 2026-04-13 | collision | 0 |
| 2026-04-20 | lamp failure | 4 |
| 2026-04-20 | cable fault | 1 |
| 2026-04-20 | vandalism | 2 |
| 2026-04-20 | collision | 0 |
| 2026-04-27 | lamp failure | 3 |
| 2026-04-27 | cable fault | 3 |
| 2026-04-27 | vandalism | 1 |
| 2026-04-27 | collision | 0 |
| 2026-05-04 | lamp failure | 0 |
| 2026-05-04 | cable fault | 1 |
| 2026-05-04 | vandalism | 0 |
| 2026-05-04 | collision | 2 |
| 2026-05-11 | lamp failure | 5 |
| 2026-05-11 | cable fault | 1 |
| 2026-05-11 | vandalism | 2 |
| 2026-05-11 | collision | 0 |
| 2026-05-18 | lamp failure | 5 |
| 2026-05-18 | cable fault | 2 |
| 2026-05-18 | vandalism | 0 |
| 2026-05-18 | collision | 1 |
| 2026-05-25 | lamp failure | 5 |
| 2026-05-25 | cable fault | 1 |
| 2026-05-25 | vandalism | 0 |
| 2026-05-25 | collision | 0 |
| 2026-06-01 | lamp failure | 9 |
| 2026-06-01 | cable fault | 1 |
| 2026-06-01 | vandalism | 1 |
| 2026-06-01 | collision | 1 |
| 2026-06-08 | lamp failure | 4 |
| 2026-06-08 | cable fault | 0 |
| 2026-06-08 | vandalism | 3 |
| 2026-06-08 | collision | 0 |
| 2026-06-15 | lamp failure | 0 |
| 2026-06-15 | cable fault | 1 |
| 2026-06-15 | vandalism | 1 |
| 2026-06-15 | collision | 1 |
| 2026-06-22 | lamp failure | 4 |
| 2026-06-22 | cable fault | 3 |
| 2026-06-22 | vandalism | 1 |
| 2026-06-22 | collision | 2 |
| 2026-06-29 | lamp failure | 2 |
| 2026-06-29 | cable fault | 1 |
| 2026-06-29 | vandalism | 1 |
| 2026-06-29 | collision | 1 |
| 2026-07-06 | lamp failure | 4 |
| 2026-07-06 | cable fault | 1 |
| 2026-07-06 | vandalism | 0 |
| 2026-07-06 | collision | 1 |
| 2026-07-13 | lamp failure | 4 |
| 2026-07-13 | cable fault | 1 |
| 2026-07-13 | vandalism | 1 |
| 2026-07-13 | collision | 0 |
| 2026-07-20 | lamp failure | 1 |
| 2026-07-20 | cable fault | 4 |
| 2026-07-20 | vandalism | 0 |
| 2026-07-20 | collision | 2 |
| 2026-07-27 | lamp failure | 4 |
| 2026-07-27 | cable fault | 0 |
| 2026-07-27 | vandalism | 1 |
| 2026-07-27 | collision | 1 |
| 2026-08-03 | lamp failure | 5 |
| 2026-08-03 | cable fault | 1 |
| 2026-08-03 | vandalism | 0 |
| 2026-08-03 | collision | 1 |
| 2026-08-10 | lamp failure | 3 |
| 2026-08-10 | cable fault | 6 |
| 2026-08-10 | vandalism | 0 |
| 2026-08-10 | collision | 0 |
| 2026-08-17 | lamp failure | 2 |
| 2026-08-17 | cable fault | 2 |
| 2026-08-17 | vandalism | 1 |
| 2026-08-17 | collision | 1 |
| 2026-08-24 | lamp failure | 3 |
| 2026-08-24 | cable fault | 0 |
| 2026-08-24 | vandalism | 1 |
| 2026-08-24 | collision | 1 |
| 2026-08-31 | lamp failure | 4 |
| 2026-08-31 | cable fault | 5 |
| 2026-08-31 | vandalism | 0 |
| 2026-08-31 | collision | 1 |
| 2026-09-07 | lamp failure | 2 |
| 2026-09-07 | cable fault | 3 |
| 2026-09-07 | vandalism | 2 |
| 2026-09-07 | collision | 1 |
| 2026-09-14 | lamp failure | 4 |
| 2026-09-14 | cable fault | 1 |
| 2026-09-14 | vandalism | 2 |
| 2026-09-14 | collision | 1 |
| 2026-09-21 | lamp failure | 4 |
| 2026-09-21 | cable fault | 3 |
| 2026-09-21 | vandalism | 1 |
| 2026-09-21 | collision | 1 |
| 2026-09-28 | lamp failure | 1 |
| 2026-09-28 | cable fault | 0 |
| 2026-09-28 | vandalism | 0 |
| 2026-09-28 | collision | 1 |
Figure 43. CCTV cameras over time (installed_year) 118
| bin_start | bin_end | count |
|---|---|---|
| 2,012 | 2,014 | 9 |
| 2,014 | 2,016 | 7 |
| 2,016 | 2,018 | 8 |
| 2,018 | 2,019 | 11 |
| 2,019 | 2,021 | 11 |
| 2,021 | 2,023 | 8 |
| 2,023 | 2,025 | 6 |
Figure 44. Calls for service by beat and month over time (month) 119
| period | value |
|---|---|
| 2024-10-01 | 3,466 |
| 2024-11-01 | 3,080 |
| 2024-12-01 | 2,721 |
| 2025-01-01 | 2,613 |
| 2025-02-01 | 2,623 |
| 2025-03-01 | 2,843 |
| 2025-04-01 | 3,288 |
| 2025-05-01 | 3,726 |
| 2025-06-01 | 4,161 |
| 2025-07-01 | 4,458 |
| 2025-08-01 | 4,448 |
| 2025-09-01 | 4,171 |
| 2025-10-01 | 3,824 |
| 2025-11-01 | 3,418 |
| 2025-12-01 | 2,939 |
| 2026-01-01 | 2,808 |
| 2026-02-01 | 2,892 |
| 2026-03-01 | 3,079 |
| 2026-04-01 | 3,632 |
| 2026-05-01 | 4,128 |
| 2026-06-01 | 4,507 |
| 2026-07-01 | 4,792 |
| 2026-08-01 | 4,812 |
| 2026-09-01 | 4,551 |
Figure 45. Hot spot analysis: CCTV cameras 120
| bin_start | bin_end | band | band_label | count |
|---|---|---|---|---|
| -2 | -1.5 | cold_90 | Cold spot, 90% confidence | 1 |
| -2 | -1.5 | not_significant | Not significant | 1 |
| -1.5 | -1 | not_significant | Not significant | 1 |
| -1 | -0.5 | not_significant | Not significant | 10 |
| -0.5 | 0 | not_significant | Not significant | 4 |
| 0 | 0.5 | not_significant | Not significant | 5 |
| 0.5 | 1 | not_significant | Not significant | 2 |
| 1 | 1.5 | not_significant | Not significant | 4 |
| 1.5 | 2 | hot_90 | Hot spot, 90% confidence | 1 |
| 1.5 | 2 | hot_95 | Hot spot, 95% confidence | 1 |
| 2 | 2.5 | hot_95 | Hot spot, 95% confidence | 5 |
| 2.5 | 3 | hot_99 | Hot spot, 99% confidence | 1 |
Figure 46. Hot spot analysis: Licensed premises 121
| bin_start | bin_end | band | band_label | count |
|---|---|---|---|---|
| -1.5 | -1 | not_significant | Not significant | 12 |
| -1 | -0.5 | not_significant | Not significant | 49 |
| -0.5 | 0 | not_significant | Not significant | 28 |
| 0 | 0.5 | not_significant | Not significant | 2 |
| 0.5 | 1 | not_significant | Not significant | 2 |
| 1 | 1.5 | not_significant | Not significant | 2 |
| 1.5 | 2 | hot_90 | Hot spot, 90% confidence | 2 |
| 1.5 | 2 | not_significant | Not significant | 1 |
| 2 | 2.5 | hot_95 | Hot spot, 95% confidence | 2 |
| 3 | 3.5 | hot_99 | Hot spot, 99% confidence | 3 |
| 3.5 | 4 | hot_99 | Hot spot, 99% confidence | 1 |
| 4 | 4.5 | hot_99 | Hot spot, 99% confidence | 2 |
| 4.5 | 5 | hot_99 | Hot spot, 99% confidence | 2 |
| 5 | 5.5 | hot_99 | Hot spot, 99% confidence | 1 |
| 5.5 | 6 | hot_99 | Hot spot, 99% confidence | 3 |
Figure 47. Emerging hot spots: Incidents 122
| bin_start | bin_end | count |
|---|---|---|
| -0.659 | -0.1378 | 163 |
| -0.1378 | 0.3834 | 72 |
| 0.3834 | 0.9046 | 2 |
| 0.9046 | 1.426 | 0 |
| 1.426 | 1.947 | 19 |
| 1.947 | 2.468 | 6 |
| 2.468 | 2.989 | 0 |
| 2.989 | 3.511 | 0 |
| 3.511 | 4.032 | 6 |
| 4.032 | 4.553 | 2 |
Figure 48. Emerging hot spots: Street light outages 123
| bin_start | bin_end | count |
|---|---|---|
| -0.707 | -0.2919 | 28 |
| -0.2919 | 0.1233 | 0 |
| 0.1233 | 0.5384 | 14 |
| 0.5384 | 0.9536 | 0 |
| 0.9536 | 1.369 | 4 |
| 1.369 | 1.784 | 0 |
| 1.784 | 2.199 | 1 |
Figure 49. Find point clusters: Licensed premises 124
| cluster | features | fraction | share |
|---|---|---|---|
| Noise | 61 | 0.5083 | 50.8% |
| 0 | 53 | 0.4417 | 44.2% |
| 1 | 3 | 0.025 | 2.5% |
| 2 | 3 | 0.025 | 2.5% |
Figure 50. Find point clusters: cluster hulls 125
| cluster | features | fraction | share |
|---|---|---|---|
| 0 | 1 | 0.3333 | 33.3% |
| 1 | 1 | 0.3333 | 33.3% |
| 2 | 1 | 0.3333 | 33.3% |
Figure 51. Find point clusters: Incidents 126
| cluster | features | fraction | share |
|---|---|---|---|
| Noise | 1,609 | 0.9577 | 95.8% |
| 0 | 30 | 0.01786 | 1.8% |
| 1 | 21 | 0.0125 | 1.2% |
| 2 | 20 | 0.01191 | 1.2% |
Figure 52. Find point clusters: cluster hulls 127
| cluster | features | fraction | share |
|---|---|---|---|
| 0 | 1 | 0.3333 | 33.3% |
| 1 | 1 | 0.3333 | 33.3% |
| 2 | 1 | 0.3333 | 33.3% |
Figure 53. Find point clusters: Street light outages 128
| cluster | features | fraction | share |
|---|---|---|---|
| Noise | 410 | 0.9762 | 97.6% |
| 0 | 10 | 0.02381 | 2.4% |
Figure 54. Find point clusters: cluster hulls 129
| cluster | features | fraction | share |
|---|---|---|---|
| 0 | 1 | 1 | 100.0% |
Figure 55. Summarize within: Patrol beats 130
| bin_start | bin_end | count |
|---|---|---|
| 1 | 3.4 | 11 |
| 3.4 | 5.8 | 3 |
| 5.8 | 8.2 | 1 |
| 8.2 | 10.6 | 0 |
| 10.6 | 13 | 1 |
Figure 56. Summarize within: Patrol beats 131
| bin_start | bin_end | count |
|---|---|---|
| 1 | 7 | 10 |
| 7 | 13 | 4 |
| 13 | 19 | 0 |
| 19 | 25 | 1 |
| 25 | 31 | 1 |
Figure 57. Summarize within: Patrol beats 132
| bin_start | bin_end | count |
|---|---|---|
| 18 | 80.8 | 10 |
| 80.8 | 143.6 | 2 |
| 143.6 | 206.4 | 2 |
| 206.4 | 269.2 | 0 |
| 269.2 | 332 | 2 |
Figure 58. Calculate density: Licensed premises 133
| bin_start | bin_end | count |
|---|---|---|
| 0 | 1.556 | 15 |
| 1.556 | 3.111 | 22 |
| 3.111 | 4.667 | 13 |
| 4.667 | 6.222 | 26 |
| 6.222 | 7.778 | 14 |
| 7.778 | 9.333 | 26 |
| 9.333 | 10.89 | 10 |
| 10.89 | 12.44 | 23 |
| 12.44 | 14 | 15 |
Figure 59. Calculate density: Incidents 134
| bin_start | bin_end | count |
|---|---|---|
| 0 | 4.846 | 172 |
| 4.846 | 9.692 | 242 |
| 9.692 | 14.54 | 246 |
| 14.54 | 19.38 | 260 |
| 19.38 | 24.23 | 260 |
| 24.23 | 29.08 | 240 |
| 29.08 | 33.92 | 204 |
| 33.92 | 38.77 | 261 |
| 38.77 | 43.62 | 264 |
| 43.62 | 48.46 | 266 |
| 48.46 | 53.31 | 262 |
| 53.31 | 58.15 | 153 |
| 58.15 | 63 | 44 |
Figure 60. Calculate density: Street light outages 135
| bin_start | bin_end | count |
|---|---|---|
| 0 | 2.909 | 59 |
| 2.909 | 5.818 | 84 |
| 5.818 | 8.727 | 82 |
| 8.727 | 11.64 | 85 |
| 11.64 | 14.55 | 79 |
| 14.55 | 17.45 | 85 |
| 17.45 | 20.36 | 86 |
| 20.36 | 23.27 | 87 |
| 23.27 | 26.18 | 87 |
| 26.18 | 29.09 | 80 |
| 29.09 | 32 | 34 |
Figure 61. Hot spot analysis: Incidents 136
| bin_start | bin_end | band | band_label | count |
|---|---|---|---|---|
| -1.5 | -1 | not_significant | Not significant | 685 |
| -1 | -0.5 | not_significant | Not significant | 757 |
| -0.5 | 0 | not_significant | Not significant | 714 |
| 0 | 0.5 | not_significant | Not significant | 318 |
| 0.5 | 1 | not_significant | Not significant | 104 |
| 1 | 1.5 | not_significant | Not significant | 125 |
| 1.5 | 2 | hot_90 | Hot spot, 90% confidence | 13 |
| 1.5 | 2 | not_significant | Not significant | 27 |
| 2 | 2.5 | hot_95 | Hot spot, 95% confidence | 35 |
| 2.5 | 3 | hot_99 | Hot spot, 99% confidence | 26 |
| 3 | 3.5 | hot_99 | Hot spot, 99% confidence | 8 |
| 3.5 | 4 | hot_99 | Hot spot, 99% confidence | 8 |
| 4 | 4.5 | hot_99 | Hot spot, 99% confidence | 5 |
| 4.5 | 5 | hot_99 | Hot spot, 99% confidence | 7 |
| 5 | 5.5 | hot_99 | Hot spot, 99% confidence | 2 |
| 5.5 | 6 | hot_99 | Hot spot, 99% confidence | 4 |
| 6 | 6.5 | hot_99 | Hot spot, 99% confidence | 3 |
| 6.5 | 7 | hot_99 | Hot spot, 99% confidence | 5 |
| 7 | 7.5 | hot_99 | Hot spot, 99% confidence | 5 |
| 7.5 | 8 | hot_99 | Hot spot, 99% confidence | 3 |
| 8 | 8.5 | hot_99 | Hot spot, 99% confidence | 2 |
| 8.5 | 9 | hot_99 | Hot spot, 99% confidence | 4 |
| 9 | 9.5 | hot_99 | Hot spot, 99% confidence | 2 |
| 9.5 | 10 | hot_99 | Hot spot, 99% confidence | 2 |
| 10.5 | 11 | hot_99 | Hot spot, 99% confidence | 1 |
| 11 | 11.5 | hot_99 | Hot spot, 99% confidence | 3 |
| 11.5 | 12 | hot_99 | Hot spot, 99% confidence | 3 |
| 12 | 12.5 | hot_99 | Hot spot, 99% confidence | 4 |
| 12.5 | 13 | hot_99 | Hot spot, 99% confidence | 4 |
| 13 | 13.5 | hot_99 | Hot spot, 99% confidence | 3 |
| 13.5 | 14 | hot_99 | Hot spot, 99% confidence | 2 |
| 14.5 | 15 | hot_99 | Hot spot, 99% confidence | 3 |
| 15 | 15.5 | hot_99 | Hot spot, 99% confidence | 2 |
| 15.5 | 16 | hot_99 | Hot spot, 99% confidence | 1 |
| 16 | 16.5 | hot_99 | Hot spot, 99% confidence | 1 |
| 16.5 | 17 | hot_99 | Hot spot, 99% confidence | 2 |
| 17 | 17.5 | hot_99 | Hot spot, 99% confidence | 1 |
| 18 | 18.5 | hot_99 | Hot spot, 99% confidence | 1 |
| 19 | 19.5 | hot_99 | Hot spot, 99% confidence | 1 |
| 20.5 | 21 | hot_99 | Hot spot, 99% confidence | 5 |
| 21 | 21.5 | hot_99 | Hot spot, 99% confidence | 2 |
| 21.5 | 22 | hot_99 | Hot spot, 99% confidence | 2 |
| 22 | 22.5 | hot_99 | Hot spot, 99% confidence | 2 |
| 22.5 | 23 | hot_99 | Hot spot, 99% confidence | 1 |
| 23.5 | 24 | hot_99 | Hot spot, 99% confidence | 1 |
| 24 | 24.5 | hot_99 | Hot spot, 99% confidence | 1 |
| 24.5 | 25 | hot_99 | Hot spot, 99% confidence | 1 |
| 26 | 26.5 | hot_99 | Hot spot, 99% confidence | 1 |
Figure 62. Repeat and near repeat classification: Incidents 137
| period | series | value |
|---|---|---|
| 2025-09-29 | no arrest | 13 |
| 2025-09-29 | arrest | 3 |
| 2025-10-06 | no arrest | 20 |
| 2025-10-06 | arrest | 5 |
| 2025-10-13 | no arrest | 24 |
| 2025-10-13 | arrest | 5 |
| 2025-10-20 | no arrest | 19 |
| 2025-10-20 | arrest | 0 |
| 2025-10-27 | no arrest | 25 |
| 2025-10-27 | arrest | 6 |
| 2025-11-03 | no arrest | 31 |
| 2025-11-03 | arrest | 6 |
| 2025-11-10 | no arrest | 28 |
| 2025-11-10 | arrest | 3 |
| 2025-11-17 | no arrest | 24 |
| 2025-11-17 | arrest | 7 |
| 2025-11-24 | no arrest | 16 |
| 2025-11-24 | arrest | 4 |
| 2025-12-01 | no arrest | 21 |
| 2025-12-01 | arrest | 1 |
| 2025-12-08 | no arrest | 29 |
| 2025-12-08 | arrest | 3 |
| 2025-12-15 | no arrest | 26 |
| 2025-12-15 | arrest | 2 |
| 2025-12-22 | no arrest | 23 |
| 2025-12-22 | arrest | 1 |
| 2025-12-29 | no arrest | 27 |
| 2025-12-29 | arrest | 5 |
| 2026-01-05 | no arrest | 19 |
| 2026-01-05 | arrest | 3 |
| 2026-01-12 | no arrest | 17 |
| 2026-01-12 | arrest | 7 |
| 2026-01-19 | no arrest | 22 |
| 2026-01-19 | arrest | 4 |
| 2026-01-26 | no arrest | 22 |
| 2026-01-26 | arrest | 2 |
| 2026-02-02 | no arrest | 17 |
| 2026-02-02 | arrest | 1 |
| 2026-02-09 | no arrest | 16 |
| 2026-02-09 | arrest | 2 |
| 2026-02-16 | no arrest | 25 |
| 2026-02-16 | arrest | 1 |
| 2026-02-23 | no arrest | 29 |
| 2026-02-23 | arrest | 0 |
| 2026-03-02 | no arrest | 13 |
| 2026-03-02 | arrest | 3 |
| 2026-03-09 | no arrest | 22 |
| 2026-03-09 | arrest | 1 |
| 2026-03-16 | no arrest | 31 |
| 2026-03-16 | arrest | 3 |
| 2026-03-23 | no arrest | 32 |
| 2026-03-23 | arrest | 7 |
| 2026-03-30 | no arrest | 20 |
| 2026-03-30 | arrest | 5 |
| 2026-04-06 | no arrest | 37 |
| 2026-04-06 | arrest | 4 |
| 2026-04-13 | no arrest | 19 |
| 2026-04-13 | arrest | 3 |
| 2026-04-20 | no arrest | 34 |
| 2026-04-20 | arrest | 2 |
| 2026-04-27 | no arrest | 33 |
| 2026-04-27 | arrest | 3 |
| 2026-05-04 | no arrest | 31 |
| 2026-05-04 | arrest | 5 |
| 2026-05-11 | no arrest | 25 |
| 2026-05-11 | arrest | 7 |
| 2026-05-18 | no arrest | 39 |
| 2026-05-18 | arrest | 1 |
| 2026-05-25 | no arrest | 34 |
| 2026-05-25 | arrest | 3 |
| 2026-06-01 | no arrest | 21 |
| 2026-06-01 | arrest | 1 |
| 2026-06-08 | no arrest | 33 |
| 2026-06-08 | arrest | 4 |
| 2026-06-15 | no arrest | 34 |
| 2026-06-15 | arrest | 8 |
| 2026-06-22 | no arrest | 28 |
| 2026-06-22 | arrest | 5 |
| 2026-06-29 | no arrest | 58 |
| 2026-06-29 | arrest | 14 |
| 2026-07-06 | no arrest | 29 |
| 2026-07-06 | arrest | 5 |
| 2026-07-13 | no arrest | 36 |
| 2026-07-13 | arrest | 0 |
| 2026-07-20 | no arrest | 27 |
| 2026-07-20 | arrest | 9 |
| 2026-07-27 | no arrest | 36 |
| 2026-07-27 | arrest | 4 |
| 2026-08-03 | no arrest | 27 |
| 2026-08-03 | arrest | 4 |
| 2026-08-10 | no arrest | 21 |
| 2026-08-10 | arrest | 3 |
| 2026-08-17 | no arrest | 43 |
| 2026-08-17 | arrest | 3 |
| 2026-08-24 | no arrest | 48 |
| 2026-08-24 | arrest | 7 |
| 2026-08-31 | no arrest | 38 |
| 2026-08-31 | arrest | 3 |
| 2026-09-07 | no arrest | 35 |
| 2026-09-07 | arrest | 6 |
| 2026-09-14 | no arrest | 43 |
| 2026-09-14 | arrest | 6 |
| 2026-09-21 | no arrest | 38 |
| 2026-09-21 | arrest | 9 |
| 2026-09-28 | no arrest | 11 |
| 2026-09-28 | arrest | 2 |
Figure 63. Repeat and near repeat classification: Incidents over time 138
| period | series | value |
|---|---|---|
| 2025-09-29 | no arrest | 13 |
| 2025-09-29 | arrest | 3 |
| 2025-10-06 | no arrest | 20 |
| 2025-10-06 | arrest | 5 |
| 2025-10-13 | no arrest | 24 |
| 2025-10-13 | arrest | 5 |
| 2025-10-20 | no arrest | 19 |
| 2025-10-20 | arrest | 0 |
| 2025-10-27 | no arrest | 25 |
| 2025-10-27 | arrest | 6 |
| 2025-11-03 | no arrest | 31 |
| 2025-11-03 | arrest | 6 |
| 2025-11-10 | no arrest | 28 |
| 2025-11-10 | arrest | 3 |
| 2025-11-17 | no arrest | 24 |
| 2025-11-17 | arrest | 7 |
| 2025-11-24 | no arrest | 16 |
| 2025-11-24 | arrest | 4 |
| 2025-12-01 | no arrest | 21 |
| 2025-12-01 | arrest | 1 |
| 2025-12-08 | no arrest | 29 |
| 2025-12-08 | arrest | 3 |
| 2025-12-15 | no arrest | 26 |
| 2025-12-15 | arrest | 2 |
| 2025-12-22 | no arrest | 23 |
| 2025-12-22 | arrest | 1 |
| 2025-12-29 | no arrest | 27 |
| 2025-12-29 | arrest | 5 |
| 2026-01-05 | no arrest | 19 |
| 2026-01-05 | arrest | 3 |
| 2026-01-12 | no arrest | 17 |
| 2026-01-12 | arrest | 7 |
| 2026-01-19 | no arrest | 22 |
| 2026-01-19 | arrest | 4 |
| 2026-01-26 | no arrest | 22 |
| 2026-01-26 | arrest | 2 |
| 2026-02-02 | no arrest | 17 |
| 2026-02-02 | arrest | 1 |
| 2026-02-09 | no arrest | 16 |
| 2026-02-09 | arrest | 2 |
| 2026-02-16 | no arrest | 25 |
| 2026-02-16 | arrest | 1 |
| 2026-02-23 | no arrest | 29 |
| 2026-02-23 | arrest | 0 |
| 2026-03-02 | no arrest | 13 |
| 2026-03-02 | arrest | 3 |
| 2026-03-09 | no arrest | 22 |
| 2026-03-09 | arrest | 1 |
| 2026-03-16 | no arrest | 31 |
| 2026-03-16 | arrest | 3 |
| 2026-03-23 | no arrest | 32 |
| 2026-03-23 | arrest | 7 |
| 2026-03-30 | no arrest | 20 |
| 2026-03-30 | arrest | 5 |
| 2026-04-06 | no arrest | 37 |
| 2026-04-06 | arrest | 4 |
| 2026-04-13 | no arrest | 19 |
| 2026-04-13 | arrest | 3 |
| 2026-04-20 | no arrest | 34 |
| 2026-04-20 | arrest | 2 |
| 2026-04-27 | no arrest | 33 |
| 2026-04-27 | arrest | 3 |
| 2026-05-04 | no arrest | 31 |
| 2026-05-04 | arrest | 5 |
| 2026-05-11 | no arrest | 25 |
| 2026-05-11 | arrest | 7 |
| 2026-05-18 | no arrest | 39 |
| 2026-05-18 | arrest | 1 |
| 2026-05-25 | no arrest | 34 |
| 2026-05-25 | arrest | 3 |
| 2026-06-01 | no arrest | 21 |
| 2026-06-01 | arrest | 1 |
| 2026-06-08 | no arrest | 33 |
| 2026-06-08 | arrest | 4 |
| 2026-06-15 | no arrest | 34 |
| 2026-06-15 | arrest | 8 |
| 2026-06-22 | no arrest | 28 |
| 2026-06-22 | arrest | 5 |
| 2026-06-29 | no arrest | 58 |
| 2026-06-29 | arrest | 14 |
| 2026-07-06 | no arrest | 29 |
| 2026-07-06 | arrest | 5 |
| 2026-07-13 | no arrest | 36 |
| 2026-07-13 | arrest | 0 |
| 2026-07-20 | no arrest | 27 |
| 2026-07-20 | arrest | 9 |
| 2026-07-27 | no arrest | 36 |
| 2026-07-27 | arrest | 4 |
| 2026-08-03 | no arrest | 27 |
| 2026-08-03 | arrest | 4 |
| 2026-08-10 | no arrest | 21 |
| 2026-08-10 | arrest | 3 |
| 2026-08-17 | no arrest | 43 |
| 2026-08-17 | arrest | 3 |
| 2026-08-24 | no arrest | 48 |
| 2026-08-24 | arrest | 7 |
| 2026-08-31 | no arrest | 38 |
| 2026-08-31 | arrest | 3 |
| 2026-09-07 | no arrest | 35 |
| 2026-09-07 | arrest | 6 |
| 2026-09-14 | no arrest | 43 |
| 2026-09-14 | arrest | 6 |
| 2026-09-21 | no arrest | 38 |
| 2026-09-21 | arrest | 9 |
| 2026-09-28 | no arrest | 11 |
| 2026-09-28 | arrest | 2 |
Figure 64. Find point clusters: Street light outages over time 139
| period | series | value |
|---|---|---|
| 2025-10-01 | lamp failure | 15 |
| 2025-10-01 | cable fault | 3 |
| 2025-10-01 | vandalism | 6 |
| 2025-10-01 | collision | 1 |
| 2025-11-01 | lamp failure | 16 |
| 2025-11-01 | cable fault | 8 |
| 2025-11-01 | vandalism | 5 |
| 2025-11-01 | collision | 1 |
| 2025-12-01 | lamp failure | 17 |
| 2025-12-01 | cable fault | 11 |
| 2025-12-01 | vandalism | 8 |
| 2025-12-01 | collision | 7 |
| 2026-01-01 | lamp failure | 22 |
| 2026-01-01 | cable fault | 13 |
| 2026-01-01 | vandalism | 6 |
| 2026-01-01 | collision | 4 |
| 2026-02-01 | lamp failure | 19 |
| 2026-02-01 | cable fault | 6 |
| 2026-02-01 | vandalism | 9 |
| 2026-02-01 | collision | 9 |
| 2026-03-01 | lamp failure | 15 |
| 2026-03-01 | cable fault | 11 |
| 2026-03-01 | vandalism | 2 |
| 2026-03-01 | collision | 3 |
| 2026-04-01 | lamp failure | 23 |
| 2026-04-01 | cable fault | 6 |
| 2026-04-01 | vandalism | 8 |
| 2026-04-01 | collision | 2 |
| 2026-05-01 | lamp failure | 17 |
| 2026-05-01 | cable fault | 8 |
| 2026-05-01 | vandalism | 3 |
| 2026-05-01 | collision | 3 |
| 2026-06-01 | lamp failure | 20 |
| 2026-06-01 | cable fault | 4 |
| 2026-06-01 | vandalism | 5 |
| 2026-06-01 | collision | 3 |
| 2026-07-01 | lamp failure | 13 |
| 2026-07-01 | cable fault | 8 |
| 2026-07-01 | vandalism | 3 |
| 2026-07-01 | collision | 4 |
| 2026-08-01 | lamp failure | 13 |
| 2026-08-01 | cable fault | 8 |
| 2026-08-01 | vandalism | 3 |
| 2026-08-01 | collision | 4 |
| 2026-09-01 | lamp failure | 15 |
| 2026-09-01 | cable fault | 11 |
| 2026-09-01 | vandalism | 5 |
| 2026-09-01 | collision | 4 |
| 2026-10-01 | lamp failure | 4 |
| 2026-10-01 | cable fault | 3 |
| 2026-10-01 | vandalism | 1 |
| 2026-10-01 | collision | 2 |
Figure 65. Find point clusters: Incidents over time 140
| period | series | value |
|---|---|---|
| 2025-09-29 | no arrest | 13 |
| 2025-09-29 | arrest | 3 |
| 2025-10-06 | no arrest | 20 |
| 2025-10-06 | arrest | 5 |
| 2025-10-13 | no arrest | 24 |
| 2025-10-13 | arrest | 5 |
| 2025-10-20 | no arrest | 19 |
| 2025-10-20 | arrest | 0 |
| 2025-10-27 | no arrest | 25 |
| 2025-10-27 | arrest | 6 |
| 2025-11-03 | no arrest | 31 |
| 2025-11-03 | arrest | 6 |
| 2025-11-10 | no arrest | 28 |
| 2025-11-10 | arrest | 3 |
| 2025-11-17 | no arrest | 24 |
| 2025-11-17 | arrest | 7 |
| 2025-11-24 | no arrest | 16 |
| 2025-11-24 | arrest | 4 |
| 2025-12-01 | no arrest | 21 |
| 2025-12-01 | arrest | 1 |
| 2025-12-08 | no arrest | 29 |
| 2025-12-08 | arrest | 3 |
| 2025-12-15 | no arrest | 26 |
| 2025-12-15 | arrest | 2 |
| 2025-12-22 | no arrest | 23 |
| 2025-12-22 | arrest | 1 |
| 2025-12-29 | no arrest | 27 |
| 2025-12-29 | arrest | 5 |
| 2026-01-05 | no arrest | 19 |
| 2026-01-05 | arrest | 3 |
| 2026-01-12 | no arrest | 17 |
| 2026-01-12 | arrest | 7 |
| 2026-01-19 | no arrest | 22 |
| 2026-01-19 | arrest | 4 |
| 2026-01-26 | no arrest | 22 |
| 2026-01-26 | arrest | 2 |
| 2026-02-02 | no arrest | 17 |
| 2026-02-02 | arrest | 1 |
| 2026-02-09 | no arrest | 16 |
| 2026-02-09 | arrest | 2 |
| 2026-02-16 | no arrest | 25 |
| 2026-02-16 | arrest | 1 |
| 2026-02-23 | no arrest | 29 |
| 2026-02-23 | arrest | 0 |
| 2026-03-02 | no arrest | 13 |
| 2026-03-02 | arrest | 3 |
| 2026-03-09 | no arrest | 22 |
| 2026-03-09 | arrest | 1 |
| 2026-03-16 | no arrest | 31 |
| 2026-03-16 | arrest | 3 |
| 2026-03-23 | no arrest | 32 |
| 2026-03-23 | arrest | 7 |
| 2026-03-30 | no arrest | 20 |
| 2026-03-30 | arrest | 5 |
| 2026-04-06 | no arrest | 37 |
| 2026-04-06 | arrest | 4 |
| 2026-04-13 | no arrest | 19 |
| 2026-04-13 | arrest | 3 |
| 2026-04-20 | no arrest | 34 |
| 2026-04-20 | arrest | 2 |
| 2026-04-27 | no arrest | 33 |
| 2026-04-27 | arrest | 3 |
| 2026-05-04 | no arrest | 31 |
| 2026-05-04 | arrest | 5 |
| 2026-05-11 | no arrest | 25 |
| 2026-05-11 | arrest | 7 |
| 2026-05-18 | no arrest | 39 |
| 2026-05-18 | arrest | 1 |
| 2026-05-25 | no arrest | 34 |
| 2026-05-25 | arrest | 3 |
| 2026-06-01 | no arrest | 21 |
| 2026-06-01 | arrest | 1 |
| 2026-06-08 | no arrest | 33 |
| 2026-06-08 | arrest | 4 |
| 2026-06-15 | no arrest | 34 |
| 2026-06-15 | arrest | 8 |
| 2026-06-22 | no arrest | 28 |
| 2026-06-22 | arrest | 5 |
| 2026-06-29 | no arrest | 58 |
| 2026-06-29 | arrest | 14 |
| 2026-07-06 | no arrest | 29 |
| 2026-07-06 | arrest | 5 |
| 2026-07-13 | no arrest | 36 |
| 2026-07-13 | arrest | 0 |
| 2026-07-20 | no arrest | 27 |
| 2026-07-20 | arrest | 9 |
| 2026-07-27 | no arrest | 36 |
| 2026-07-27 | arrest | 4 |
| 2026-08-03 | no arrest | 27 |
| 2026-08-03 | arrest | 4 |
| 2026-08-10 | no arrest | 21 |
| 2026-08-10 | arrest | 3 |
| 2026-08-17 | no arrest | 43 |
| 2026-08-17 | arrest | 3 |
| 2026-08-24 | no arrest | 48 |
| 2026-08-24 | arrest | 7 |
| 2026-08-31 | no arrest | 38 |
| 2026-08-31 | arrest | 3 |
| 2026-09-07 | no arrest | 35 |
| 2026-09-07 | arrest | 6 |
| 2026-09-14 | no arrest | 43 |
| 2026-09-14 | arrest | 6 |
| 2026-09-21 | no arrest | 38 |
| 2026-09-21 | arrest | 9 |
| 2026-09-28 | no arrest | 11 |
| 2026-09-28 | arrest | 2 |
GeoBit Large Spatial Model. Findings are labeled Evidenced (computed by a tool), Inferred (a reading or reasoning) or Unverified (no evidence yet).