Sample: Insurance, Brisbane: report
Project: Sample: Insurance, Brisbane
Goal: Describe the project Sample: Insurance, Brisbane: run the analyses that tell the most about its data, draw every result, and write a cited report.
Run: d38c36b4-096d-4cf3-8fe0-eb532bd8bcd0 (running, 11 agent run(s))
Generated: 2026-10-18T05:07:17Z, version 1
Model cost: USD 0.0000 over 0 model call(s)
Data used
| Data | Kind | Rows | Time span | Summary | Source |
|---|---|---|---|---|---|
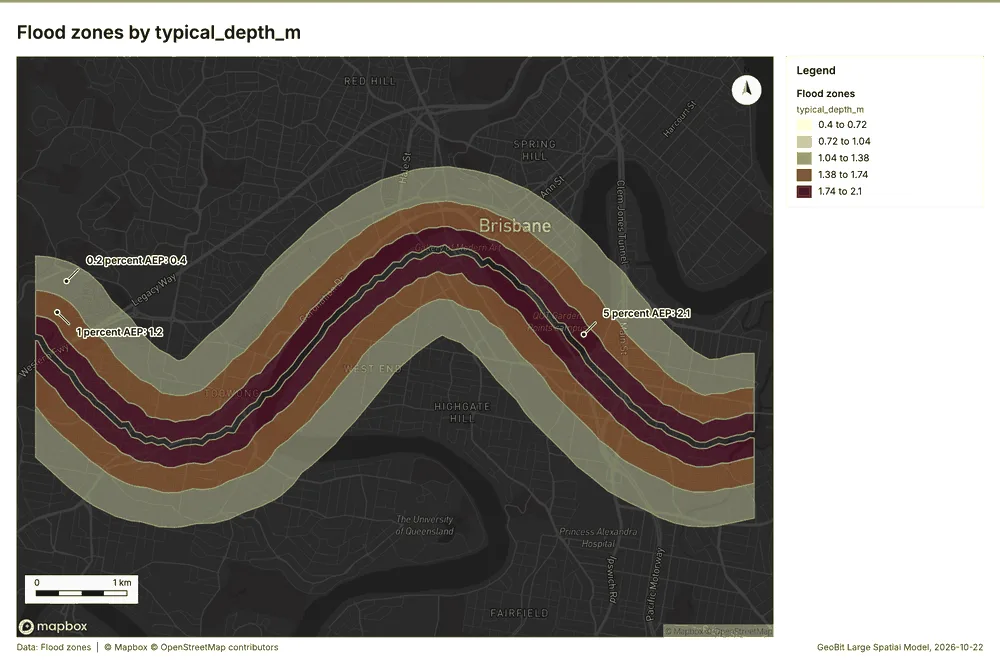
| Flood zones | vector, MultiPolygon | 3 | 3 polygon (area) features; 'zone' has 3 values (top: 0.2 percent AEP 1, 1 percent AEP 1, 5 percent AEP 1); 'typical_depth_m' 0.4 to 2.1 (mean 1.233); 'aep_pct' 0.2 to 5 (mean 2.067); 'return_period_years' 20 to 500 (mean 206.7); total area 17.53 km2; extent 152.9695,-27.4991 to 153.0505,-27.4631. Areas (Flood zones) with typical_depth_m to compare and map. | 89 | |
| River | vector, LineString | 1 | 1 line features; 'width_m' 70 to 70 (mean 70); named by 'name' (e.g. Main river channel); total length 10.52 km; extent 152.9695,-27.4910 to 153.0505,-27.4712. Lines (River) such as routes or networks. | 90 | |
| Suburbs | vector, Polygon | 14 | 14 polygon (area) features; 'households' 2,478 to 11,774 (mean 6905); 'median_value_aud' 514,269 to 1,216,669 (mean 8.224e+05); named by 'name' (e.g. Parkside, Riverside, Brickfield); total area 48.04 km2; extent 152.9695,-27.5071 to 153.0505,-27.4529. Areas (Suburbs) with households to compare and map. | 91 | |
| Insured properties | vector, Point | 1,400 | 1,400 point features; 'occupancy' has 3 values (top: residential 996, commercial 255, industrial 149); 'construction' has 4 values (top: timber 641, brick veneer 406, double brick 207); 'sum_insured_aud' 231,235 to 10,738,456 (mean 1,371,380); 'year_built' 1,925 to 2,024 (mean 1976); 'floors' 1 to 3 (mean 1.804); extent 152.9705,-27.5064 to 153.0494,-27.4535. Point locations of Insured properties by occupancy. | 92 | |
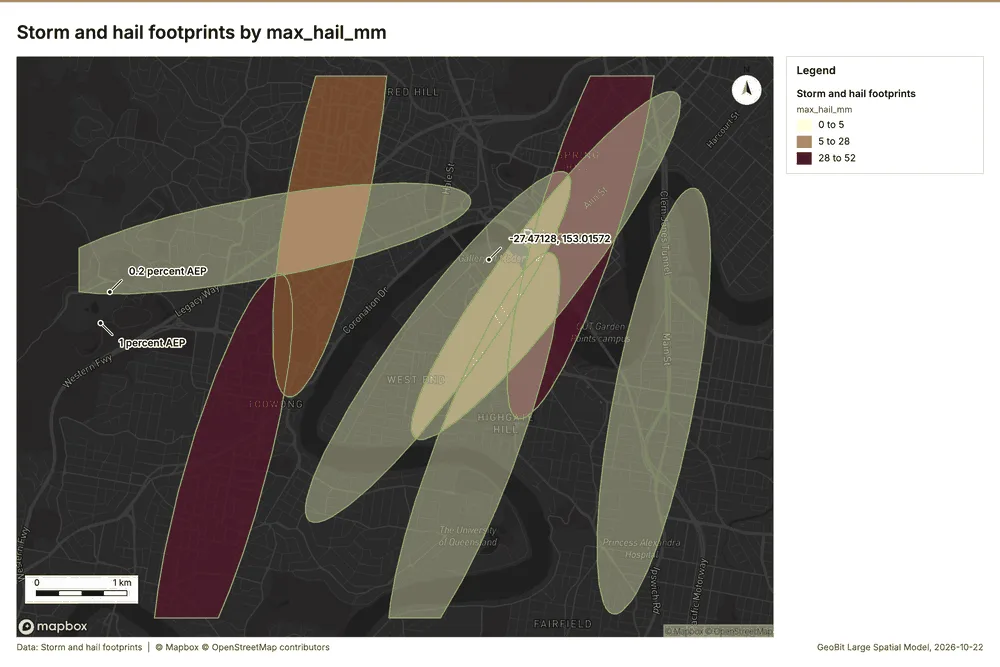
| Storm and hail footprints | vector, Polygon | 8 | 2023-01-09 to 2026-03-14 | 8 polygon (area) features; dated by 'event_date' from 2023-01-09 to 2026-03-14; 'peril' has 3 values (top: storm 4, hail 3, flood rain 1); 'max_hail_mm' 0 to 52 (mean 13.38); 'max_gust_kmh' 74 to 124 (mean 93); 'rain_24h_mm' 91 to 247 (mean 153.6); total area 25.39 km2; extent 152.9695,-27.5071 to 153.0407,-27.4529. Areas (Storm and hail footprints) with max_hail_mm to compare and map. | 2 |
| Claims | vector, Point | 900 | 2022-01-09 to 2026-09-08 | 900 point features; dated by 'reported_at' from 2022-01-09 to 2026-09-08; 'peril' has 6 values (top: hail 237, flood 230, storm 176); 'status' has 2 values (top: closed 895, open 5); 'paid_aud' 1,025 to 363,329 (mean 3.385e+04); extent 152.9705,-27.5063 to 153.0494,-27.4538. Dated point events by peril: where and when Claims happen. | 3 |
| River gauges | vector, Point | 8 | 8 point features; 'minor_flood_m' 1.82 to 2.16 (mean 2.005); 'major_flood_m' 3.44 to 4.38 (mean 3.775); named by 'name' (e.g. River gauge station 1, River gauge station 2, River gauge station 3); extent 152.9743,-27.4905 to 153.0442,-27.4711. Point locations of River gauges. | 93 | |
| Levees | vector, LineString | 6 | 6 line features; 'condition' has 3 values (top: poor 3, fair 2, good 1); 'crest_height_m' 2.86 to 3.97 (mean 3.44); 'built' 1,986 to 2,010 (mean 1995); total length 4.202 km; extent 152.9916,-27.4906 to 153.0325,-27.4737. Lines (Levees) such as routes or networks. | 94 | |
| Policy register | table | 1,400 | Table of 1,400 rows and 5 columns without geometry; 'renewal_month' has 4 values (top: Apr 368, Jul 362, Jan 353); 'channel' has 3 values (top: broker 488, bank partner 458, direct 454); 'annual_premium_aud' 474 to 27,543 (mean 3951); 'deductible_aud' 500 to 5,000 (mean 2170). A table of Policy register without locations. | 95 | |
| Depth-damage curves | table | 28 | Table of 28 rows and 3 columns without geometry; 'construction' has 4 values (top: timber 7, brick veneer 7, double brick 7); 'depth_m' 0 to 3 (mean 1.179); 'damage_ratio' 0 to 1 (mean 0.3857). A table of Depth-damage curves without locations. | 96 | |
| Portfolio exposure memo | document | 1-page pdf document 'Portfolio exposure memo'; language en; mentions 9 place(s): Riverside (1), -27.47128, 153.01572 (1), Elmstead (1), Foundry Row (1), Ashby Green (1). A document about Riverside, -27.47128, 153.01572, Elmstead. | 97 | ||
| Underwriting guidelines for flood zones | document | 1-page md document 'Underwriting guidelines for flood zones'; language en; mentions 2 place(s): Elmstead (2), Foundry Row (1). A document about Elmstead, Foundry Row. | 98 | ||
| Sample: Insurance, Brisbane | record | 99 | |||
| Summarize within: Storm and hail footprints | layer, Polygon | 8 | 100 | ||
| Summarize within: Storm and hail footprints | layer, Polygon | 8 | 101 | ||
| Hot spot analysis: Claims | layer, Polygon | 207 | 102 | ||
| Hot spot analysis: Insured properties | layer, Polygon | 208 | 103 | ||
| Hot spot analysis: Storm and hail footprints | layer, Polygon | 8 | 104 | ||
| Emerging hot spots: Claims | layer, Polygon | 68 | 105 | ||
| Repeat and near repeat classification: Claims | layer, Point | 900 | 106 | ||
| Calculate density: Claims | layer, Polygon | 1,334 | 107 | ||
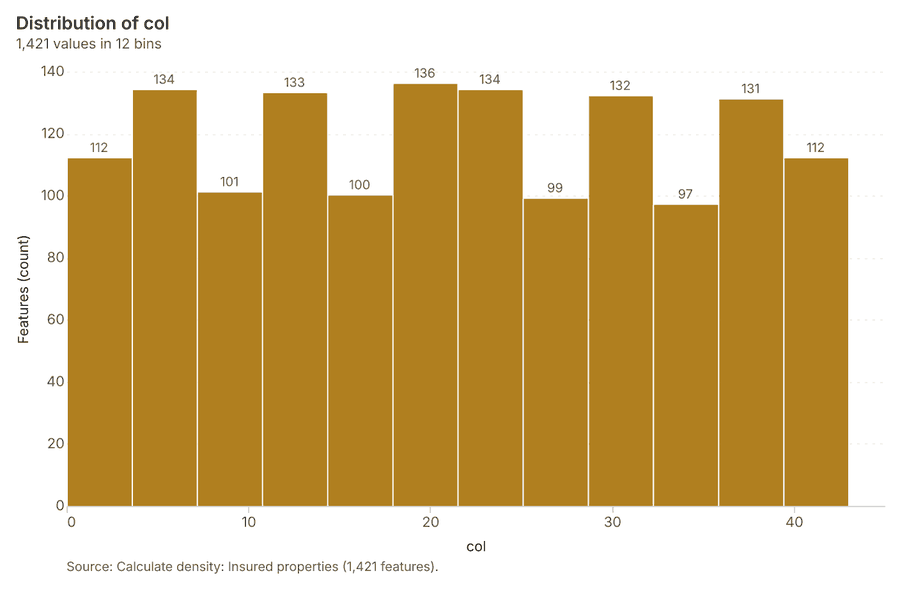
| Calculate density: Insured properties | layer, Polygon | 1,421 | 108 | ||
| Find point clusters: Claims | layer, Point | 900 | 109 | ||
| Find point clusters: cluster hulls | layer, Polygon | 2 | 110 | ||
| Find point clusters: Insured properties | layer, Point | 1,400 | 111 | ||
| Find point clusters: cluster hulls | layer, Polygon | 1 | 112 | ||
| Find outliers: Storm and hail footprints | layer, Polygon | 8 | 113 | ||
| Find outliers: Suburbs | layer, Polygon | 14 | 114 | ||
| Summarize within: Storm and hail footprints | layer, Polygon | 8 | 115 |
Timeline
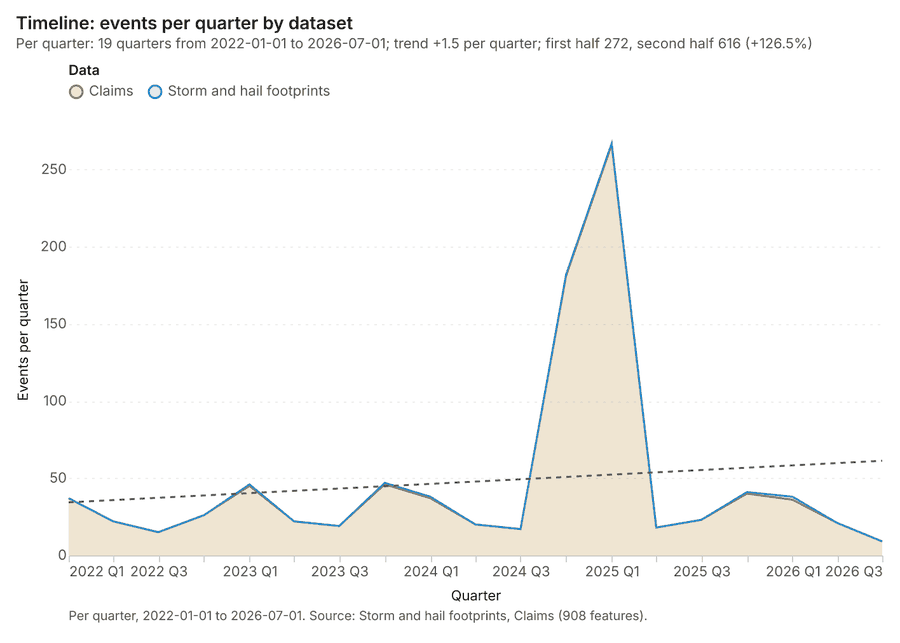
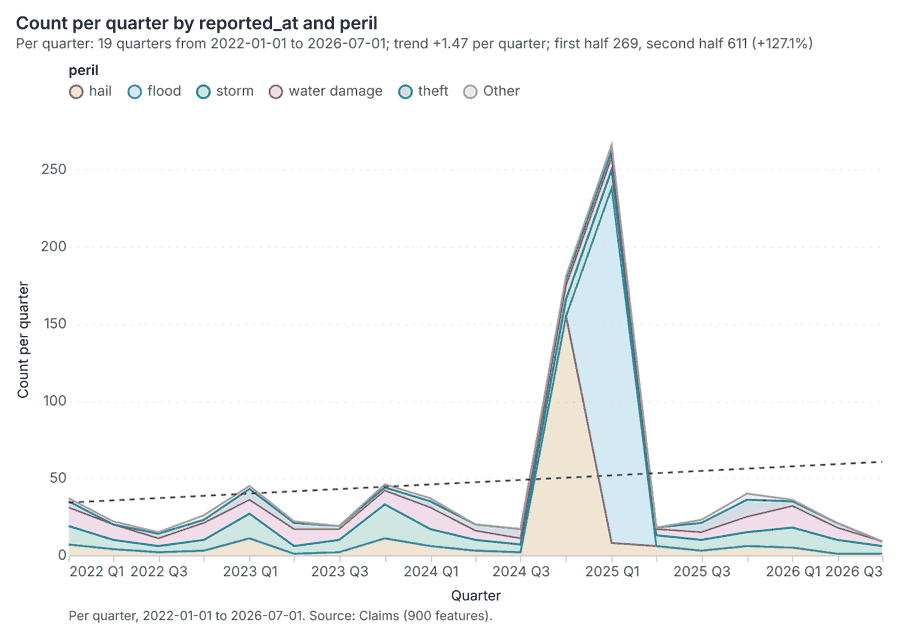
The timeline counts 908 dated events in Storm and hail footprints, Claims per quarter, from Q1 2022 to Q3 2026 123. By dataset: Claims 900; Storm and hail footprints 8 1. The trend is +1.5 events per quarter; the second half of the quarters has 616 against 272 in the first (+126.5%) 1.
Busiest quarters
Quietest quarters
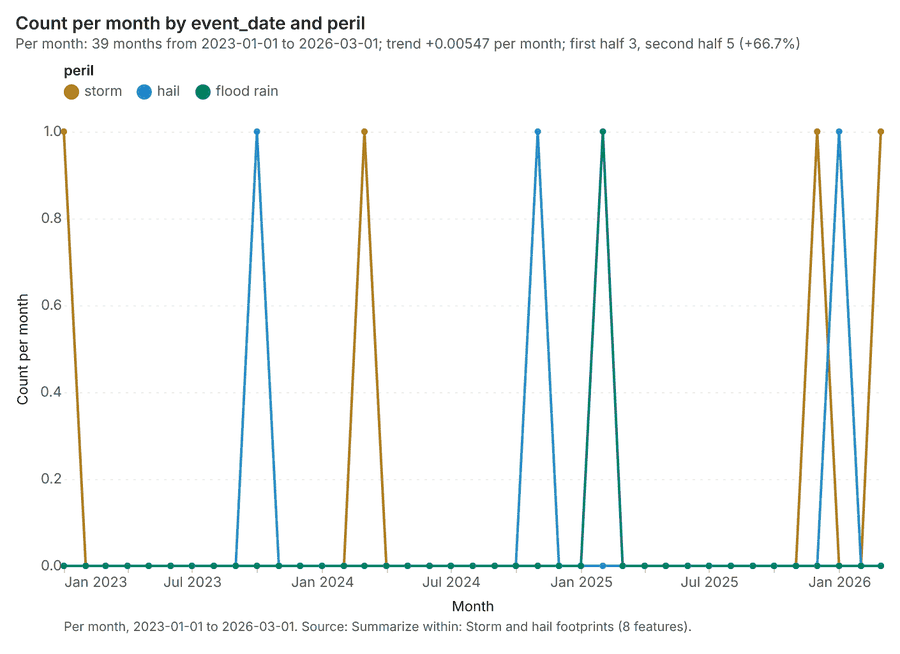
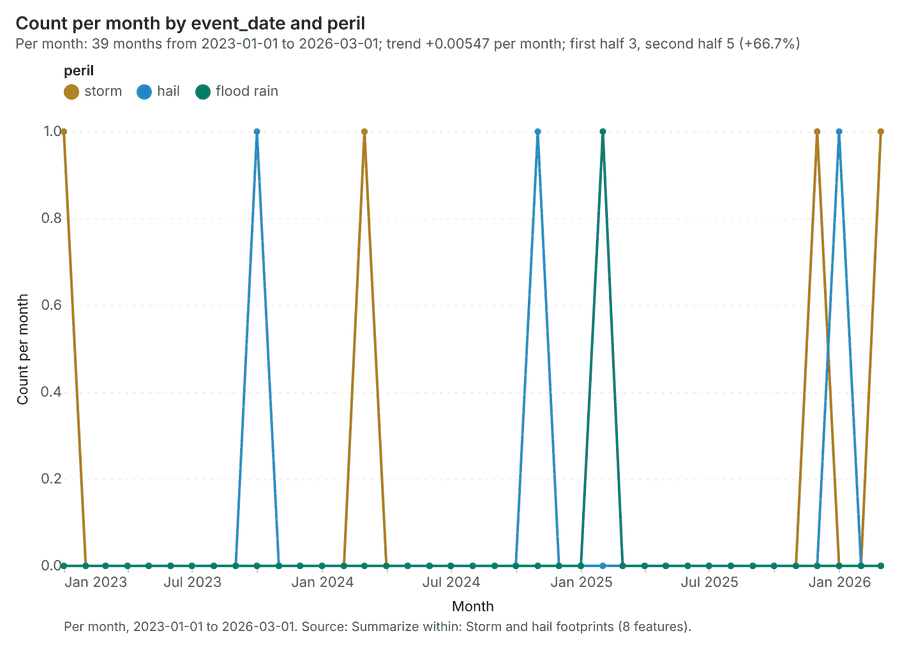
Summarize within
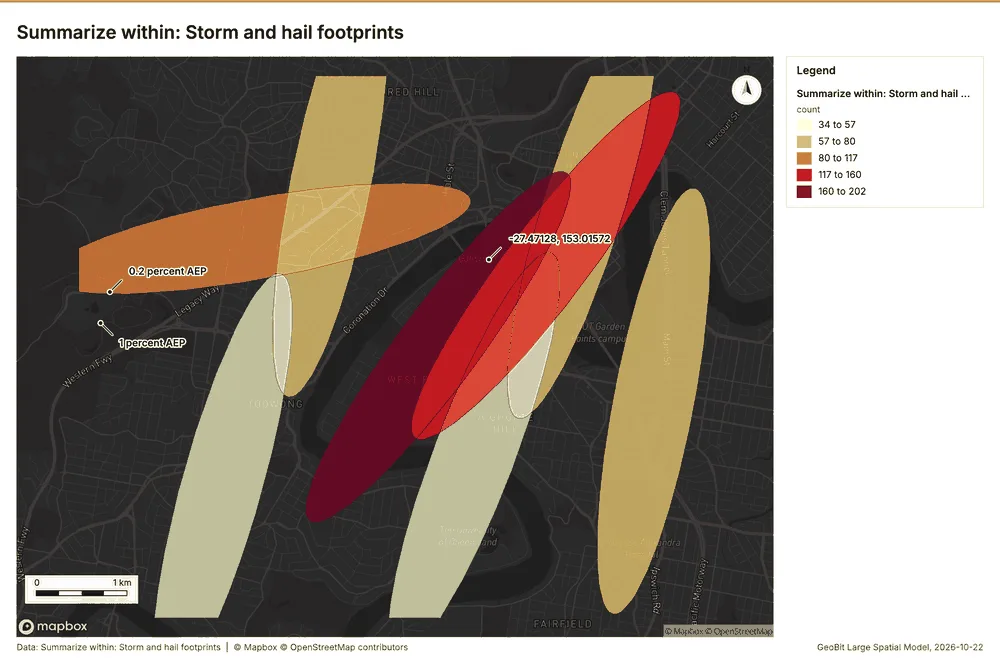
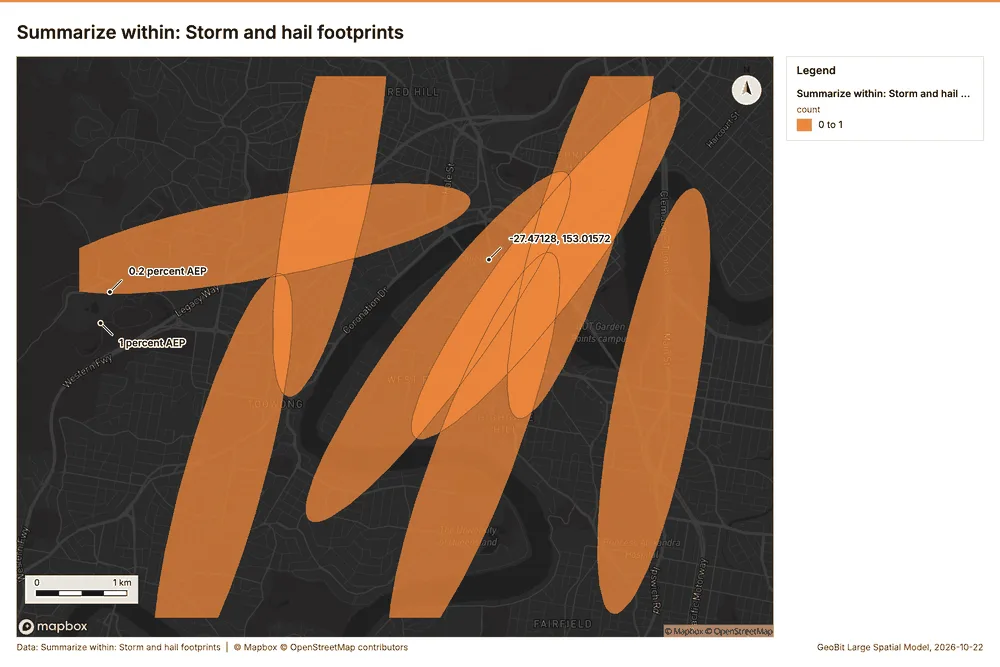
What this analysis is. Summarize within: Count and aggregate the features inside each polygon (or bin), proportionally for lines and polygons 4. In ArcGIS it is Summarize Within or Aggregate Points; in QGIS, native:countpointsinpolygon or native:sumlinelengths 4.
Why it was run on this data. Count Claims inside each feature of Storm and hail footprints by peril; the counts map as a choropleth (natural breaks, sequential colors) 5.
What it found. The analysis utilized the gp_summarize_within tool 6. This process required the inputs Claims 7 and Storm and hail footprints 8.
| Result | Value |
|---|---|
| result, count | 8 |
| result, elapsed ms | 2 |
| billing, cost | 0.02818 |
| billing, list price | 0.02818 |
| billing, upstream cost | 0 |
Findings
- Evidenced: Summarize within on Claims, Storm and hail footprints: Summarize within: 1 layer saved: Summarize within: Storm and hail footprints (8 features) 678.
- Evidenced: It reported result, count 8; result, elapsed ms 2; billing, cost 0.02818; billing, list price 0.02818; billing, upstream cost 0 6.
Tool gp_summarize_within; parameters {"stats": [{"stat": "sum", "field": "paid_aud"}], "project": "45adc477-2b11-425a-ada1-ef48522eb87e", "features": {"layer": "Claims (1572e189)"}, "group_by": "peril", "polygons": {"layer": "Storm and hail footprints (2681856b)"}}
Summarize within
What this analysis is. Summarize within: Count and aggregate the features inside each polygon (or bin), proportionally for lines and polygons 4. In ArcGIS it is Summarize Within or Aggregate Points; in QGIS, native:countpointsinpolygon or native:sumlinelengths 4.
Why it was run on this data. Count Claims inside each feature of Storm and hail footprints by peril; the counts map as a choropleth (natural breaks, sequential colors) 5.
What it found. Summarize within on River gauges, Storm and hail footprints: Summarize within: 1 layer saved: Summarize within: Storm and hail footprints (8 features) 8910. It reported result, count 8; result, elapsed ms 0; billing, cost 0.01034; billing, list price 0.01034; billing, upstream cost 0 9.
| Result | Value |
|---|---|
| result, count | 8 |
| result, elapsed ms | 0 |
| billing, cost | 0.01034 |
| billing, list price | 0.01034 |
| billing, upstream cost | 0 |
Findings
- Evidenced: Summarize within on River gauges, Storm and hail footprints: Summarize within: 1 layer saved: Summarize within: Storm and hail footprints (8 features) 8910.
- Evidenced: It reported result, count 8; result, elapsed ms 0; billing, cost 0.01034; billing, list price 0.01034; billing, upstream cost 0 9.
Tool gp_summarize_within; parameters {"stats": [{"stat": "sum", "field": "minor_flood_m"}], "project": "45adc477-2b11-425a-ada1-ef48522eb87e", "features": {"layer": "River gauges (af5a84eb)"}, "polygons": {"layer": "Storm and hail footprints (2681856b)"}}
Hot spots
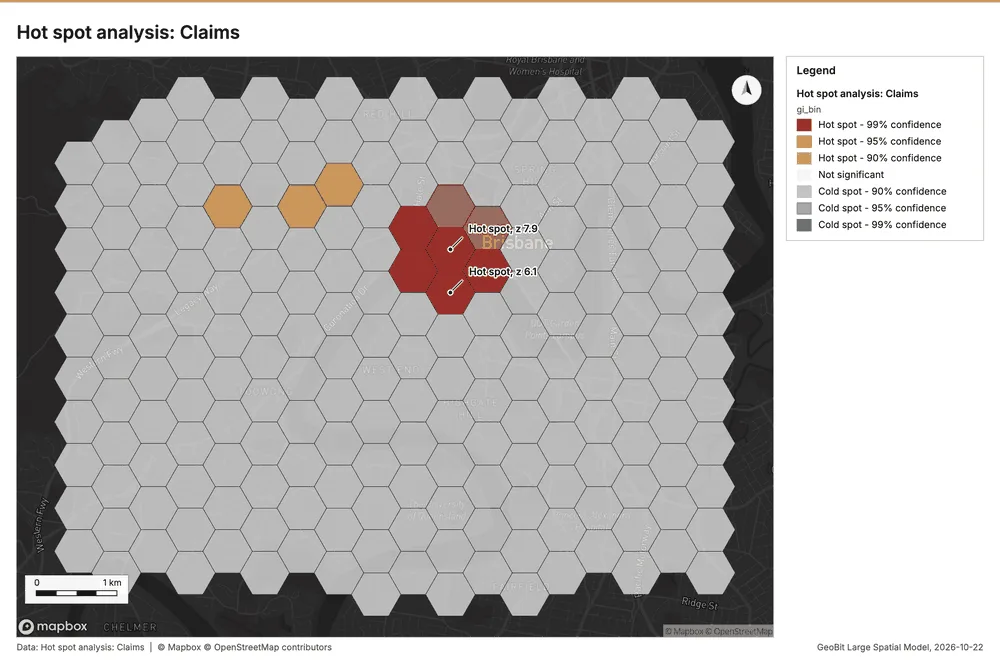
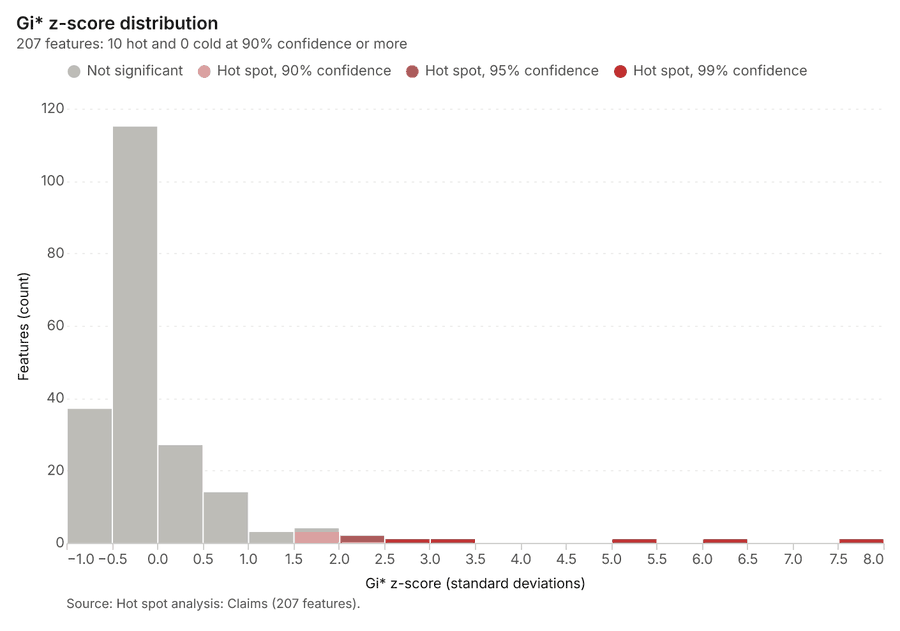
What this analysis is. Hot spot analysis: Getis-Ord Gi* hot and cold spots with z-scores, p-values and confidence bins 11. In ArcGIS it is Find Hot Spots or Hot Spot Analysis (Getis-Ord Gi*); in QGIS, qgis:hotspot (plugin) 11.
Why it was run on this data. 900 points: Getis-Ord Gi* tests whether the concentrations in Claims are statistically significant 12.
What it found. The hot spot analysis was executed using Claims data as the input 7. The tool saved one layer containing 207 features as results 13. The analysis was run using a distance band of 500 m and utilized 900 incidents 13.
| Result | Value |
|---|---|
| result, bins | 207 |
| result, count | 207 |
| result, elapsed ms | 13 |
| result, cell size m | 500 |
| result, incidents used | 900 |
| result, distance band m | 500 |
| billing, cost | 0.068 |
| billing, list price | 0.068 |
| billing, upstream cost | 0 |
Findings
- Evidenced: Hot spots on Claims: Hot spot analysis: 1 layer saved: Hot spot analysis: Claims (207 features) 713.
- Evidenced: It reported result, bins 207; result, count 207; result, elapsed ms 13; result, cell size m 500; result, incidents used 900; result, distance band m 500 13.
Tool gp_hot_spots; parameters {"project": "45adc477-2b11-425a-ada1-ef48522eb87e", "features": {"layer": "Claims (1572e189)"}, "aggregation": "hexagon", "cell_size_m": 500.0, "distance_band_m": 500.0}
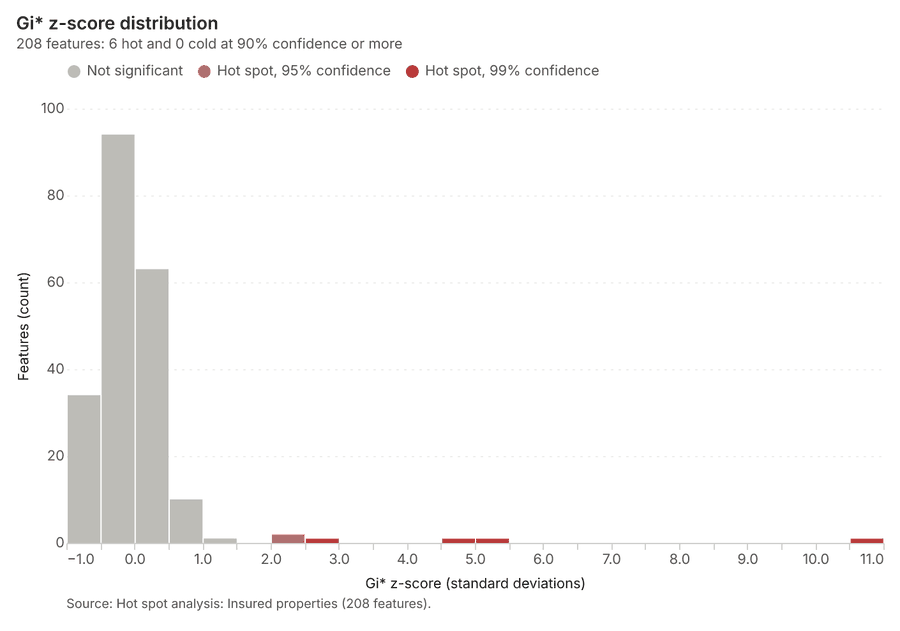
Hot spots
What this analysis is. Hot spot analysis: Getis-Ord Gi* hot and cold spots with z-scores, p-values and confidence bins 11. In ArcGIS it is Find Hot Spots or Hot Spot Analysis (Getis-Ord Gi*); in QGIS, qgis:hotspot (plugin) 11.
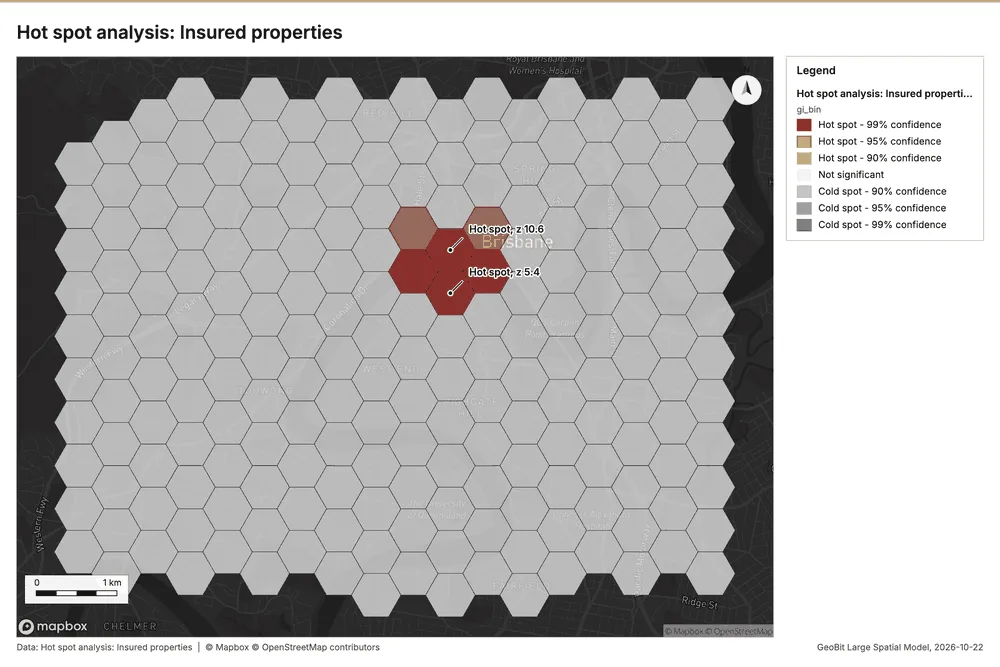
Why it was run on this data. 1400 points: Getis-Ord Gi* tests whether the concentrations in Insured properties are statistically significant 14.
What it found. Hot spots on Insured properties: Hot spot analysis: 1 layer saved: Hot spot analysis: Insured properties (208 features) 1516. It reported result, bins 208; result, count 208; result, elapsed ms 14; result, cell size m 500; result, incidents used 1,400; result, distance band m 500 15.
| Result | Value |
|---|---|
| result, bins | 208 |
| result, count | 208 |
| result, elapsed ms | 14 |
| result, cell size m | 500 |
| result, incidents used | 1,400 |
| result, distance band m | 500 |
| billing, cost | 0.078 |
| billing, list price | 0.078 |
| billing, upstream cost | 0 |
Findings
- Evidenced: Hot spots on Insured properties: Hot spot analysis: 1 layer saved: Hot spot analysis: Insured properties (208 features) 1516.
- Evidenced: It reported result, bins 208; result, count 208; result, elapsed ms 14; result, cell size m 500; result, incidents used 1,400; result, distance band m 500 15.
Tool gp_hot_spots; parameters {"project": "45adc477-2b11-425a-ada1-ef48522eb87e", "features": {"layer": "Insured properties (7fe53ce9)"}, "aggregation": "hexagon", "cell_size_m": 500.0, "distance_band_m": 500.0}
Hot spots
What this analysis is. Hot spot analysis: Getis-Ord Gi* hot and cold spots with z-scores, p-values and confidence bins 11. In ArcGIS it is Find Hot Spots or Hot Spot Analysis (Getis-Ord Gi*); in QGIS, qgis:hotspot (plugin) 11.
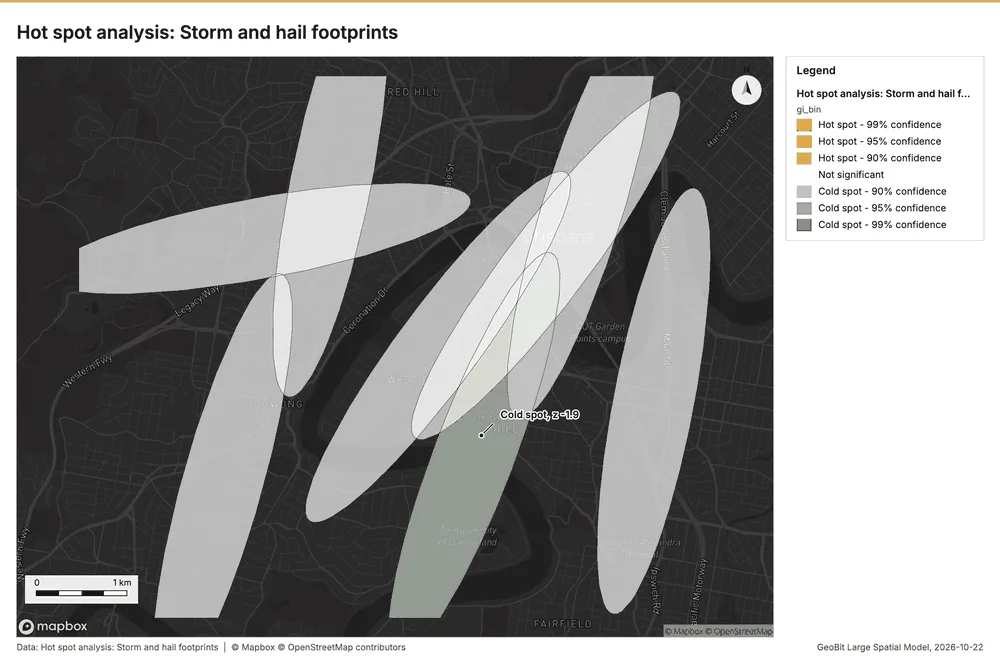
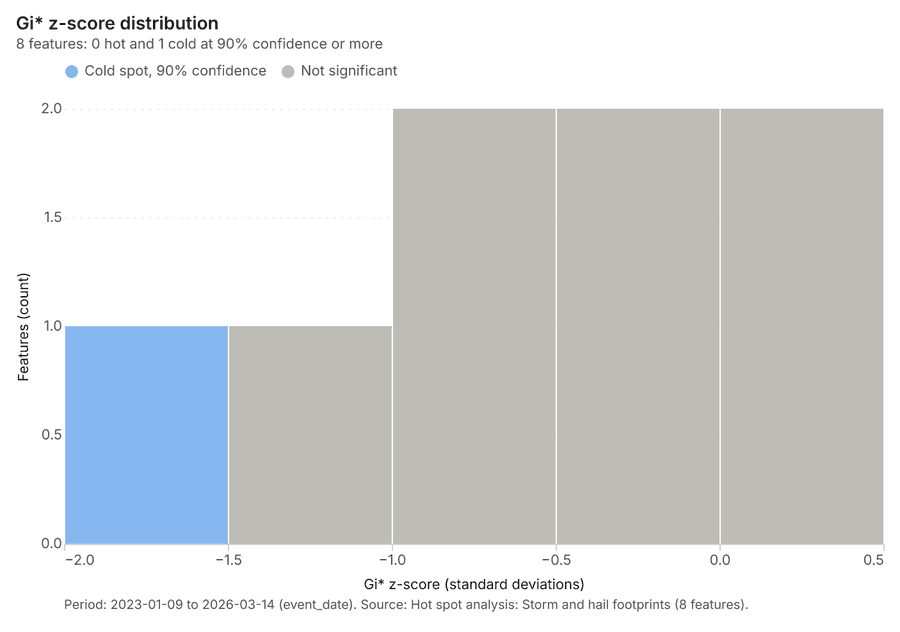
Why it was run on this data. Gi* hot spots of 'max_hail_mm' across the areas 17.
What it found. The hot spot analysis tool was applied using the Storm and hail footprints layer as input 18. The process saved one layer, titled Hot spot analysis: Storm and hail footprints 18. This analysis yielded a total of 8 features 18, completing the task in 1 elapsed ms 18.
| Result | Value |
|---|---|
| result, count | 8 |
| result, elapsed ms | 1 |
| result, excluded null | 0 |
| result, distance band m | 2,528 |
| billing, cost | 0.05016 |
| billing, list price | 0.05016 |
| billing, upstream cost | 0 |
Findings
- Evidenced: Hot spots on Storm and hail footprints: Hot spot analysis: 1 layer saved: Hot spot analysis: Storm and hail footprints (8 features) 818.
- Evidenced: It reported result, count 8; result, elapsed ms 1; result, excluded null 0; result, distance band m 2,528; billing, cost 0.05016; billing, list price 0.05016 18.
Tool gp_hot_spots; parameters {"field": "max_hail_mm", "project": "45adc477-2b11-425a-ada1-ef48522eb87e", "features": {"layer": "Storm and hail footprints (2681856b)"}}
Space time hot spots
What this analysis is. Emerging hot spots: Where hot spots are new, consecutive, intensifying, persistent, diminishing, sporadic, oscillating or historical over time 19. In ArcGIS it is Emerging Hot Spot Analysis or Create Space Time Cube 19.
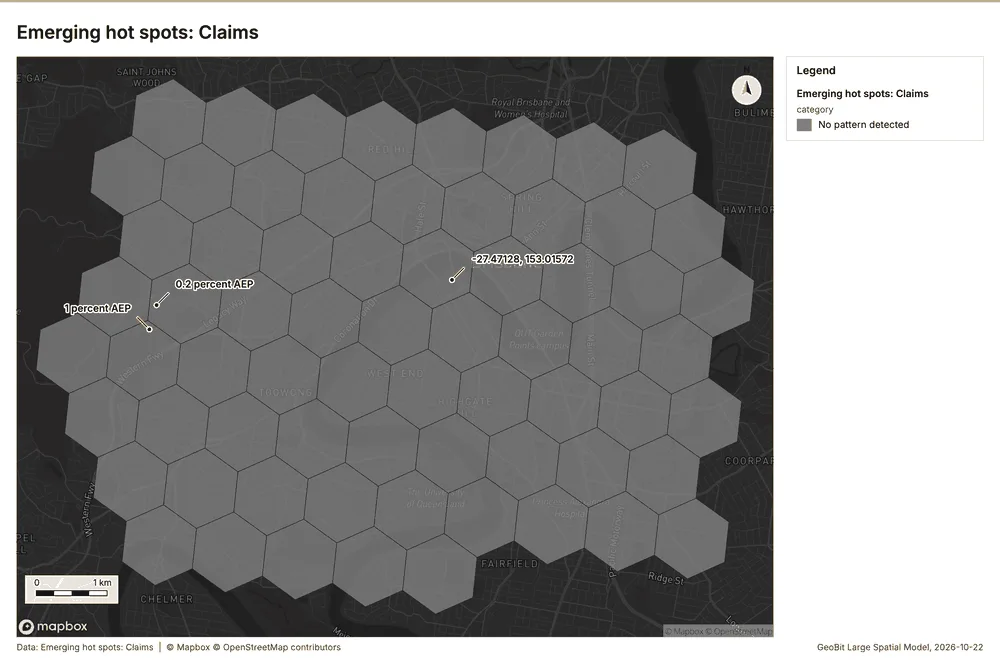
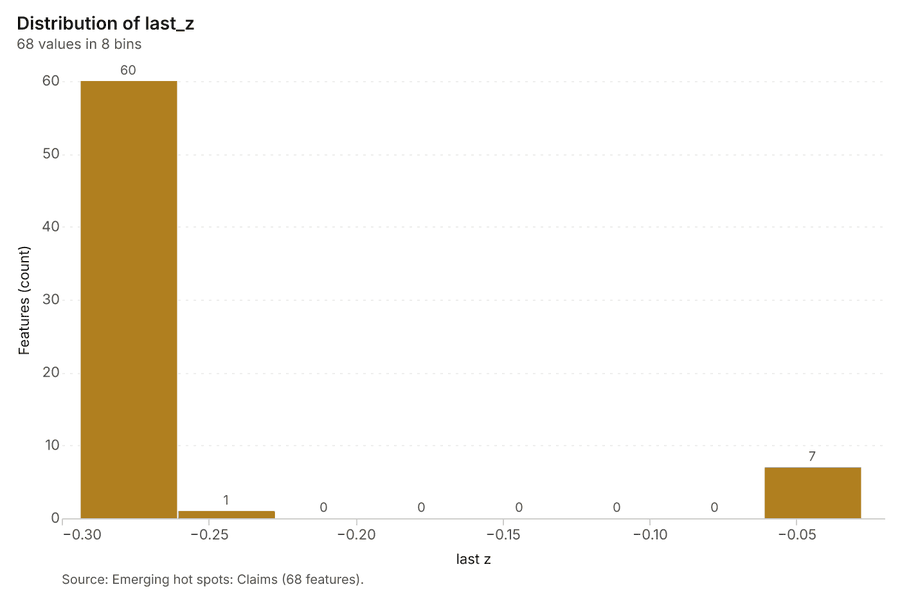
Why it was run on this data. Claims carry dates in 'reported_at': emerging hot spot analysis finds new, intensifying and fading hot spots per month 20.
What it found. The analysis used the Claims layer as its input 7. The gp_space_time_hot_spots tool successfully saved 68 features into the Emerging hot spots: Claims layer 21. This operation processed 900 features and was completed in 15 milliseconds 21. Furthermore, the resulting cost for this analysis was 0.145, which matched the list price 21.
| Result | Value |
|---|---|
| result, count | 68 |
| result, elapsed ms | 15 |
| result, resolution | 8 |
| result, features used | 900 |
| result, time neighbors | 0 |
| billing, cost | 0.145 |
| billing, list price | 0.145 |
| billing, upstream cost | 0 |
Findings
- Evidenced: Space time hot spots on Claims: Emerging hot spots: 1 layer saved: Emerging hot spots: Claims (68 features) 721.
- Evidenced: It reported result, count 68; result, elapsed ms 15; result, resolution 8; result, features used 900; result, time neighbors 0; billing, cost 0.145 21.
Tool gp_space_time_hot_spots; parameters {"project": "45adc477-2b11-425a-ada1-ef48522eb87e", "features": {"layer": "Claims (1572e189)"}, "interval": "month", "bin_shape": "h3", "resolution": 8, "time_field": "reported_at"}
Near repeat
What this analysis is. Repeat and near repeat classification: Classify incidents as originators, repeats (same place) or near repeats within a distance and time window, with a Knox test table 22. In ArcGIS it is Repeat and Near Repeat Classification or Near Repeat Calculator 22.
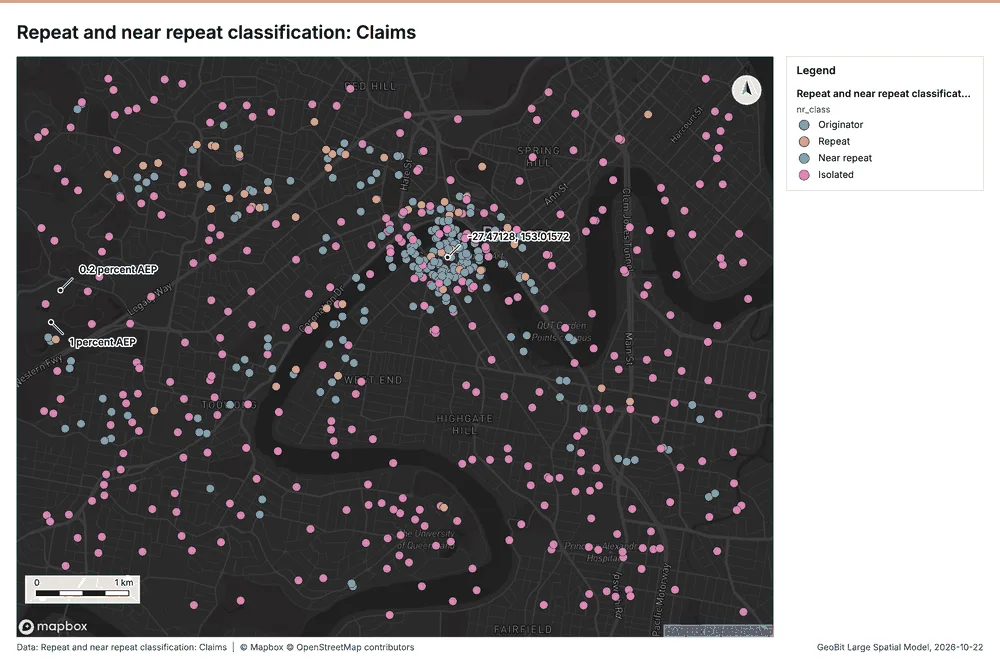
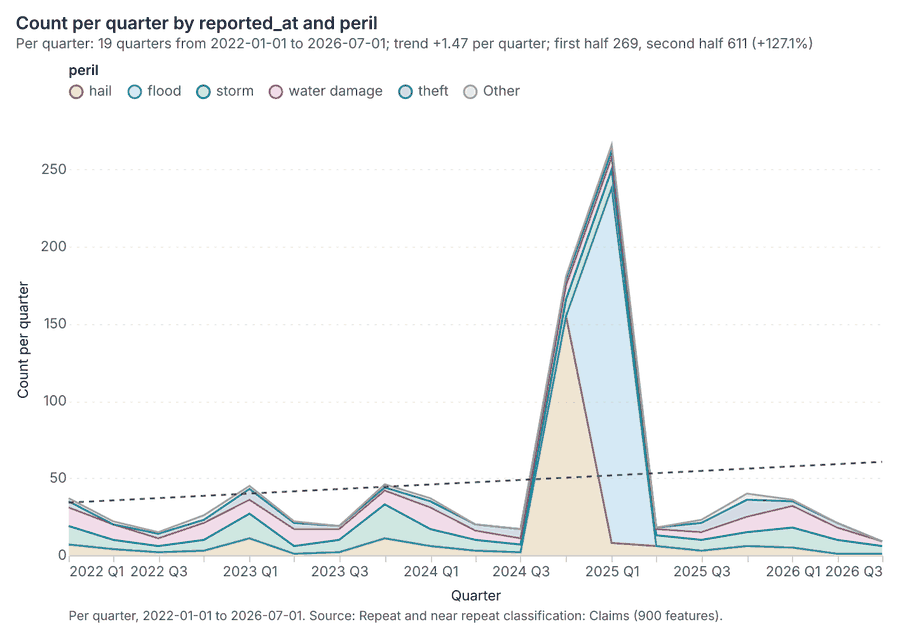
Why it was run on this data. Near repeat analysis tests whether Claims close in space also follow each other within 30 days 23.
What it found. Near repeat on Claims: Repeat and near repeat classification: 1 layer saved: Repeat and near repeat classification: Claims (900 features) 724. It reported result, days 30; result, count 900; result, chains 83; result, distance m 200; result, elapsed ms 22; result, pairs linked 1,571 24.
| Result | Value |
|---|---|
| result, days | 30 |
| result, count | 900 |
| result, chains | 83 |
| result, distance m | 200 |
| result, elapsed ms | 22 |
| result, pairs linked | 1,571 |
| billing, cost | 0.077 |
| billing, list price | 0.077 |
| billing, upstream cost | 0 |
Findings
- Evidenced: Near repeat on Claims: Repeat and near repeat classification: 1 layer saved: Repeat and near repeat classification: Claims (900 features) 724.
- Evidenced: It reported result, days 30; result, count 900; result, chains 83; result, distance m 200; result, elapsed ms 22; result, pairs linked 1,571 24.
Tool gp_near_repeat; parameters {"days": 30, "project": "45adc477-2b11-425a-ada1-ef48522eb87e", "features": {"layer": "Claims (1572e189)"}, "distance_m": 200.0, "time_field": "reported_at"}
Calculate density
What this analysis is. Calculate density: Kernel density per square kilometer on a grid 25. In ArcGIS it is Calculate Density or Kernel Density; in QGIS, native:heatmapkerneldensityestimation 25.
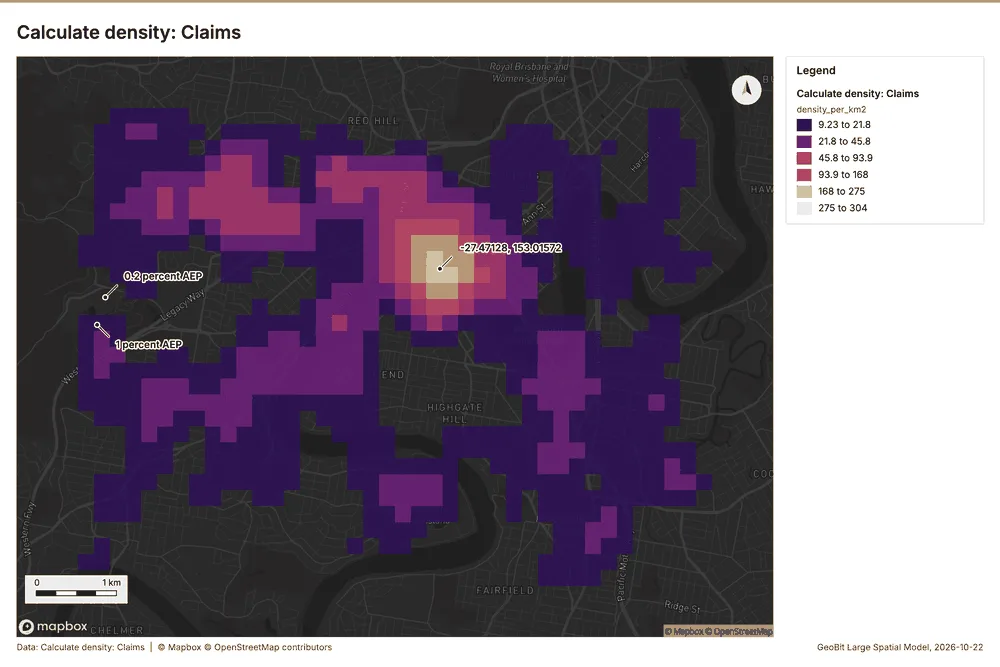
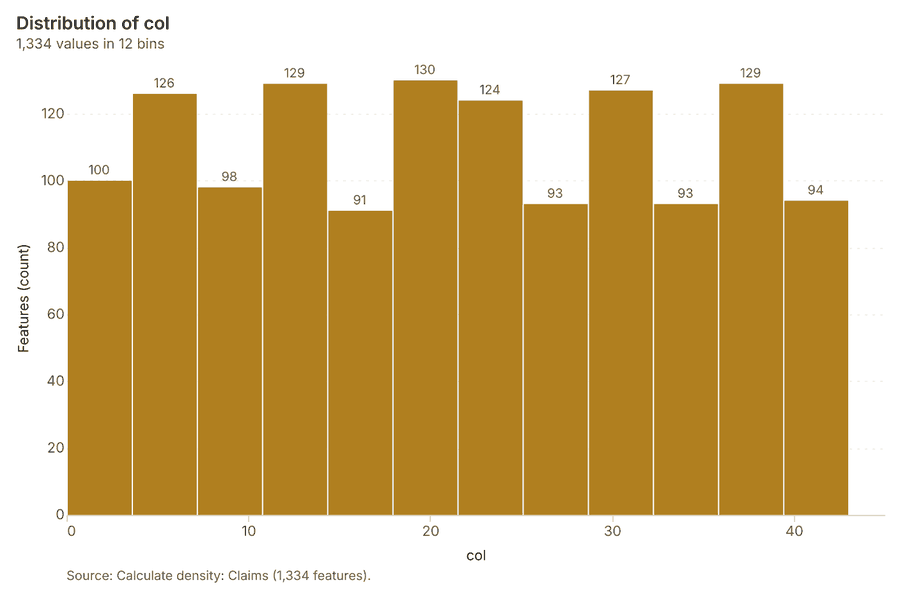
Why it was run on this data. 900 points in Claims: a density surface shows where they concentrate 26.
What it found. Calculate density on Claims: Calculate density: 1 layer saved: Calculate density: Claims (1334 features) 727. It reported result, count 1,334; result, elapsed ms 36; result, bandwidth m 500; result, cell size m 200; result, excluded null 0; result, max density per km2 303.9 27.
| Result | Value |
|---|---|
| result, count | 1,334 |
| result, elapsed ms | 36 |
| result, bandwidth m | 500 |
| result, cell size m | 200 |
| result, excluded null | 0 |
| result, max density per km2 | 303.9 |
| billing, cost | 0.068 |
| billing, list price | 0.068 |
| billing, upstream cost | 0 |
Findings
- Evidenced: Calculate density on Claims: Calculate density: 1 layer saved: Calculate density: Claims (1334 features) 727.
- Evidenced: It reported result, count 1,334; result, elapsed ms 36; result, bandwidth m 500; result, cell size m 200; result, excluded null 0; result, max density per km2 303.9 27.
Tool gp_calculate_density; parameters {"kernel": "quartic", "project": "45adc477-2b11-425a-ada1-ef48522eb87e", "features": {"layer": "Claims (1572e189)"}, "bandwidth_m": 500.0, "cell_size_m": 200.0}
Calculate density
What this analysis is. Calculate density: Kernel density per square kilometer on a grid 25. In ArcGIS it is Calculate Density or Kernel Density; in QGIS, native:heatmapkerneldensityestimation 25.
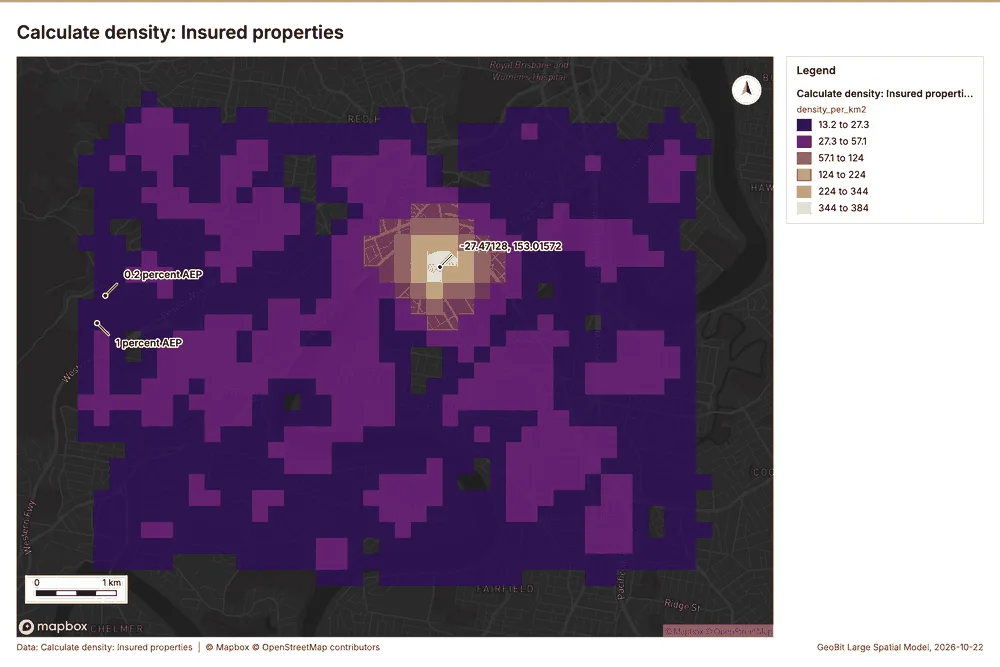
Why it was run on this data. 1400 points in Insured properties: a density surface shows where they concentrate 28.
What it found. Calculate density on Insured properties: Calculate density: 1 layer saved: Calculate density: Insured properties (1421 features) 1629. It reported result, count 1,421; result, elapsed ms 40; result, bandwidth m 500; result, cell size m 200; result, excluded null 0; result, max density per km2 383.9 29.
| Result | Value |
|---|---|
| result, count | 1,421 |
| result, elapsed ms | 40 |
| result, bandwidth m | 500 |
| result, cell size m | 200 |
| result, excluded null | 0 |
| result, max density per km2 | 383.9 |
| billing, cost | 0.078 |
| billing, list price | 0.078 |
| billing, upstream cost | 0 |
Findings
- Evidenced: Calculate density on Insured properties: Calculate density: 1 layer saved: Calculate density: Insured properties (1421 features) 1629.
- Evidenced: It reported result, count 1,421; result, elapsed ms 40; result, bandwidth m 500; result, cell size m 200; result, excluded null 0; result, max density per km2 383.9 29.
Tool gp_calculate_density; parameters {"kernel": "quartic", "project": "45adc477-2b11-425a-ada1-ef48522eb87e", "features": {"layer": "Insured properties (7fe53ce9)"}, "bandwidth_m": 500.0, "cell_size_m": 200.0}
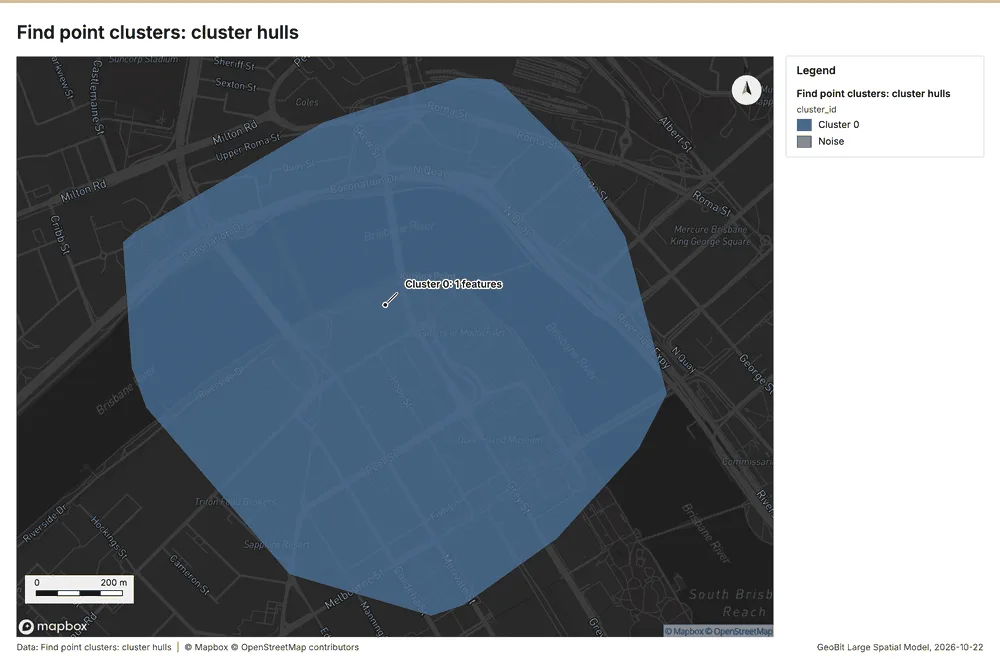
Find point clusters
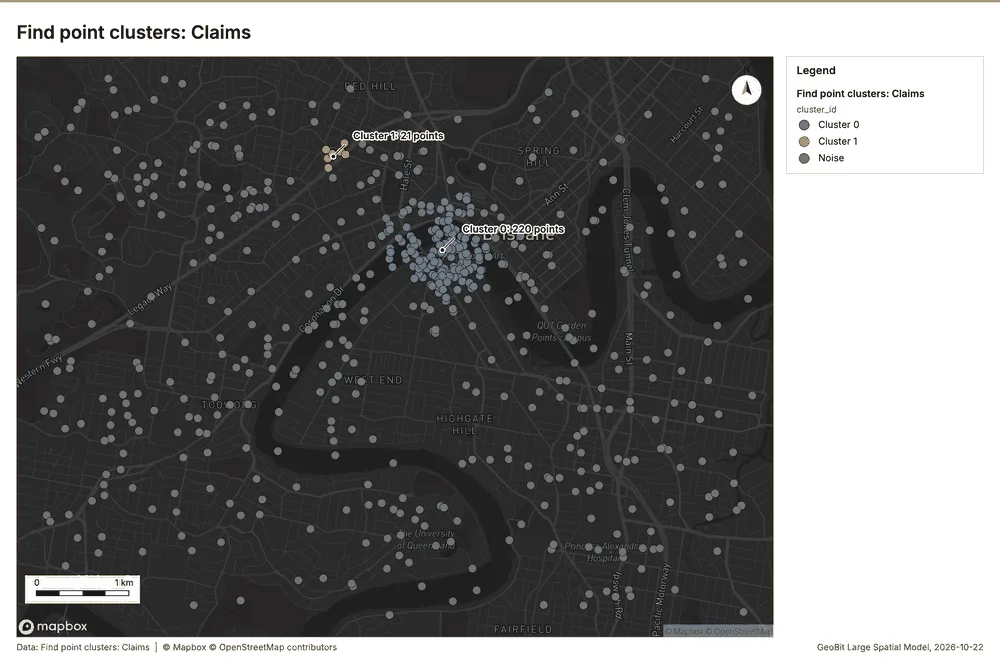
What this analysis is. Find point clusters: Density-based clusters (DBSCAN, HDBSCAN or OPTICS, optionally space-time) with hulls and noise 30. In ArcGIS it is Find Point Clusters or Density-based Clustering; in QGIS, native:dbscanclustering or native:stdbscanclustering 30.
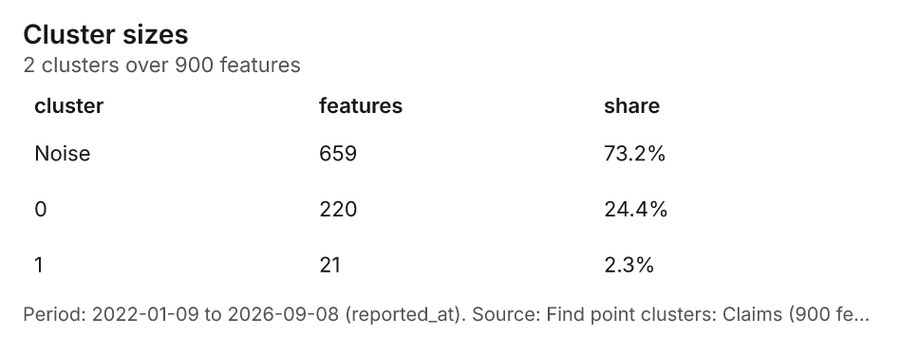
Why it was run on this data. DBSCAN finds dense groups of Claims and separates noise 31.
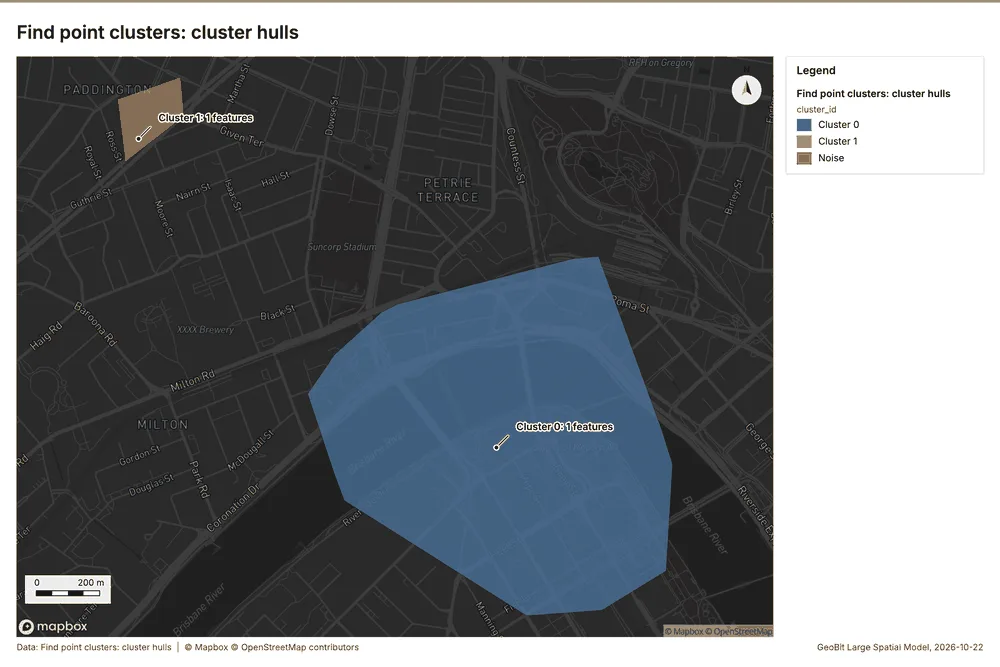
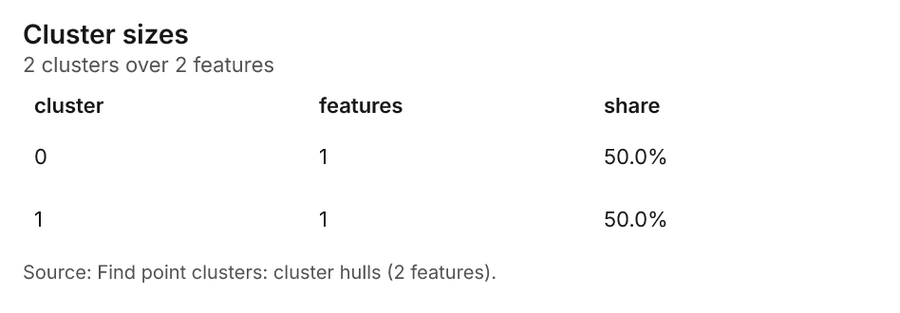
What it found. Find point clusters on Claims: Find point clusters: 2 layers saved: Find point clusters: Claims (900 features); Find point clusters: cluster hulls (2 features) 732. It reported result, count 900; result, noise 659; result, distance m 200; result, elapsed ms 15; result, min points 20; billing, cost 0.068 32.
| Result | Value |
|---|---|
| result, count | 900 |
| result, noise | 659 |
| result, distance m | 200 |
| result, elapsed ms | 15 |
| result, min points | 20 |
| billing, cost | 0.068 |
| billing, list price | 0.068 |
| billing, upstream cost | 0 |
Findings
- Evidenced: Find point clusters on Claims: Find point clusters: 2 layers saved: Find point clusters: Claims (900 features); Find point clusters: cluster hulls (2 features) 732.
- Evidenced: It reported result, count 900; result, noise 659; result, distance m 200; result, elapsed ms 15; result, min points 20; billing, cost 0.068 32.
Tool gp_find_point_clusters; parameters {"method": "dbscan", "project": "45adc477-2b11-425a-ada1-ef48522eb87e", "features": {"layer": "Claims (1572e189)"}, "distance_m": 200.0, "min_points": 20}
Find point clusters
What this analysis is. Find point clusters: Density-based clusters (DBSCAN, HDBSCAN or OPTICS, optionally space-time) with hulls and noise 30. In ArcGIS it is Find Point Clusters or Density-based Clustering; in QGIS, native:dbscanclustering or native:stdbscanclustering 30.
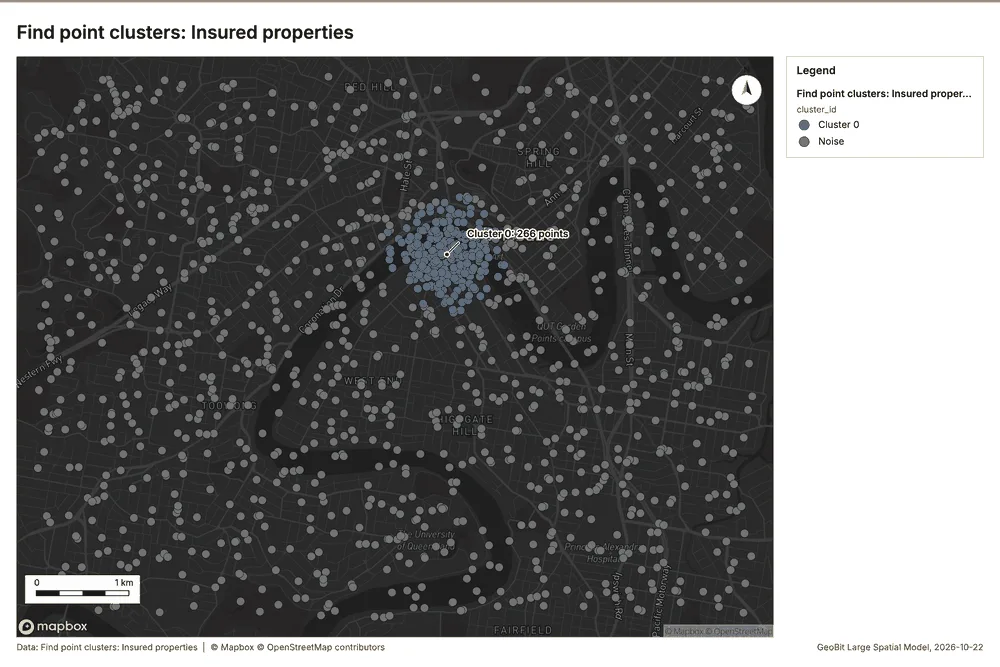
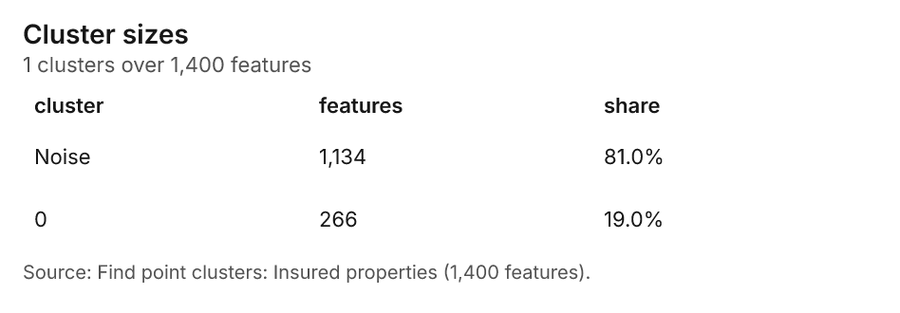
Why it was run on this data. DBSCAN finds dense groups of Insured properties and separates noise 33.
What it found. Find point clusters on Insured properties: Find point clusters: 2 layers saved: Find point clusters: Insured properties (1400 features); Find point clusters: cluster hulls (1 feature) 1634. It reported result, count 1,400; result, noise 1,134; result, distance m 200; result, elapsed ms 17; result, min points 20; billing, cost 0.078 34.
| Result | Value |
|---|---|
| result, count | 1,400 |
| result, noise | 1,134 |
| result, distance m | 200 |
| result, elapsed ms | 17 |
| result, min points | 20 |
| billing, cost | 0.078 |
| billing, list price | 0.078 |
| billing, upstream cost | 0 |
Findings
- Evidenced: Find point clusters on Insured properties: Find point clusters: 2 layers saved: Find point clusters: Insured properties (1400 features); Find point clusters: cluster hulls (1 feature) 1634.
- Evidenced: It reported result, count 1,400; result, noise 1,134; result, distance m 200; result, elapsed ms 17; result, min points 20; billing, cost 0.078 34.
Tool gp_find_point_clusters; parameters {"method": "dbscan", "project": "45adc477-2b11-425a-ada1-ef48522eb87e", "features": {"layer": "Insured properties (7fe53ce9)"}, "distance_m": 200.0, "min_points": 20}
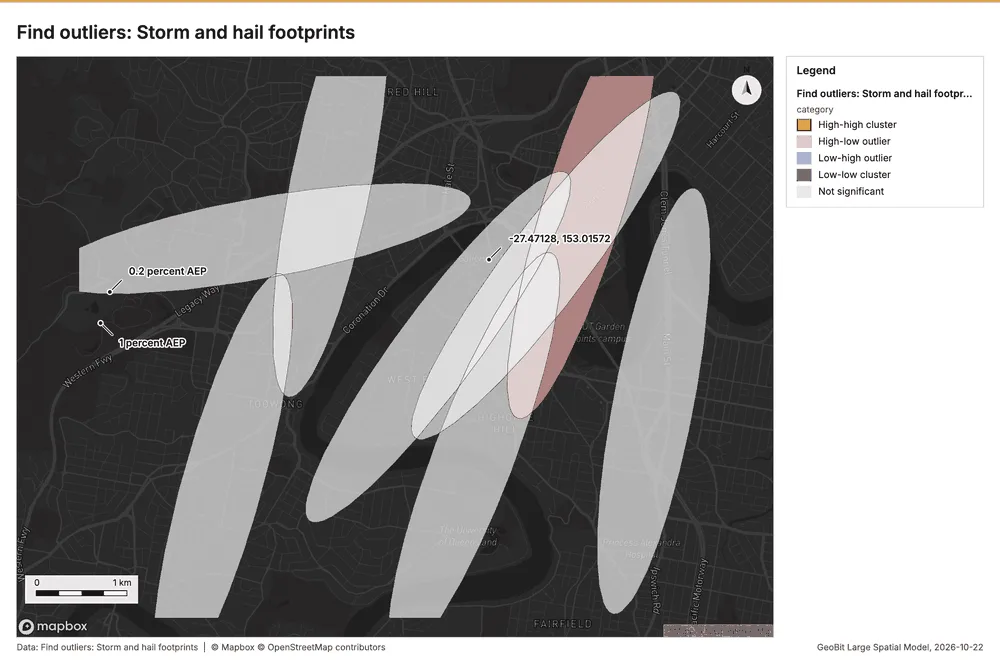
Outliers
What this analysis is. Find outliers: Anselin local Moran’s I: HH, LL clusters and HL, LH outliers 35. In ArcGIS it is Find Outliers or Cluster and Outlier Analysis (Anselin Local Moran’s I) 35.
Why it was run on this data. Local Moran's I maps clusters and outliers of 'max_hail_mm' 36.
What it found. Outliers on Storm and hail footprints: Find outliers: 1 layer saved: Find outliers: Storm and hail footprints (8 features) 837. It reported result, count 8; result, elapsed ms 4; result, permutations 199; result, excluded null 0; result, distance band m 2,528; billing, cost 0.05024 37.
| Result | Value |
|---|---|
| result, count | 8 |
| result, elapsed ms | 4 |
| result, permutations | 199 |
| result, excluded null | 0 |
| result, distance band m | 2,528 |
| billing, cost | 0.05024 |
| billing, list price | 0.05024 |
| billing, upstream cost | 0 |
Findings
- Evidenced: Outliers on Storm and hail footprints: Find outliers: 1 layer saved: Find outliers: Storm and hail footprints (8 features) 837.
- Evidenced: It reported result, count 8; result, elapsed ms 4; result, permutations 199; result, excluded null 0; result, distance band m 2,528; billing, cost 0.05024 37.
Tool gp_outliers; parameters {"field": "max_hail_mm", "project": "45adc477-2b11-425a-ada1-ef48522eb87e", "features": {"layer": "Storm and hail footprints (2681856b)"}, "aggregation": "hexagon"}
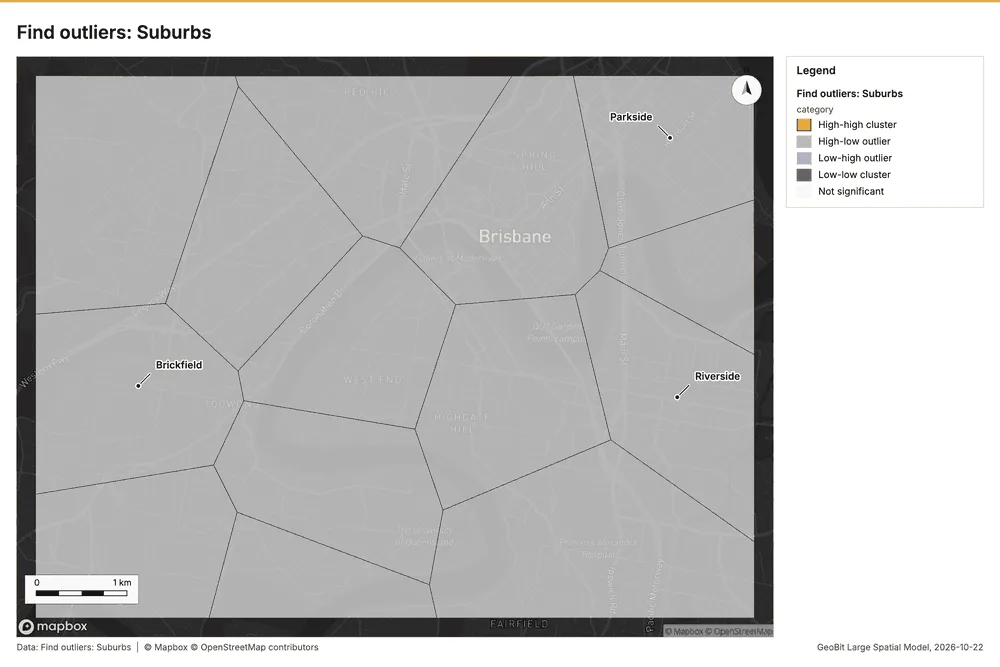
Outliers
What this analysis is. Find outliers: Anselin local Moran’s I: HH, LL clusters and HL, LH outliers 35. In ArcGIS it is Find Outliers or Cluster and Outlier Analysis (Anselin Local Moran’s I) 35.
Why it was run on this data. Local Moran's I maps clusters and outliers of 'households' 38.
What it found. Outliers on Suburbs: Find outliers: 1 layer saved: Find outliers: Suburbs (14 features) 3940. It reported result, count 14; result, elapsed ms 1; result, permutations 199; result, excluded null 0; result, distance band m 1,936; billing, cost 0.05042 39.
| Result | Value |
|---|---|
| result, count | 14 |
| result, elapsed ms | 1 |
| result, permutations | 199 |
| result, excluded null | 0 |
| result, distance band m | 1,936 |
| billing, cost | 0.05042 |
| billing, list price | 0.05042 |
| billing, upstream cost | 0 |
Findings
- Evidenced: Outliers on Suburbs: Find outliers: 1 layer saved: Find outliers: Suburbs (14 features) 3940.
- Evidenced: It reported result, count 14; result, elapsed ms 1; result, permutations 199; result, excluded null 0; result, distance band m 1,936; billing, cost 0.05042 39.
Tool gp_outliers; parameters {"field": "households", "project": "45adc477-2b11-425a-ada1-ef48522eb87e", "features": {"layer": "Suburbs (fb82f048)"}, "aggregation": "hexagon"}
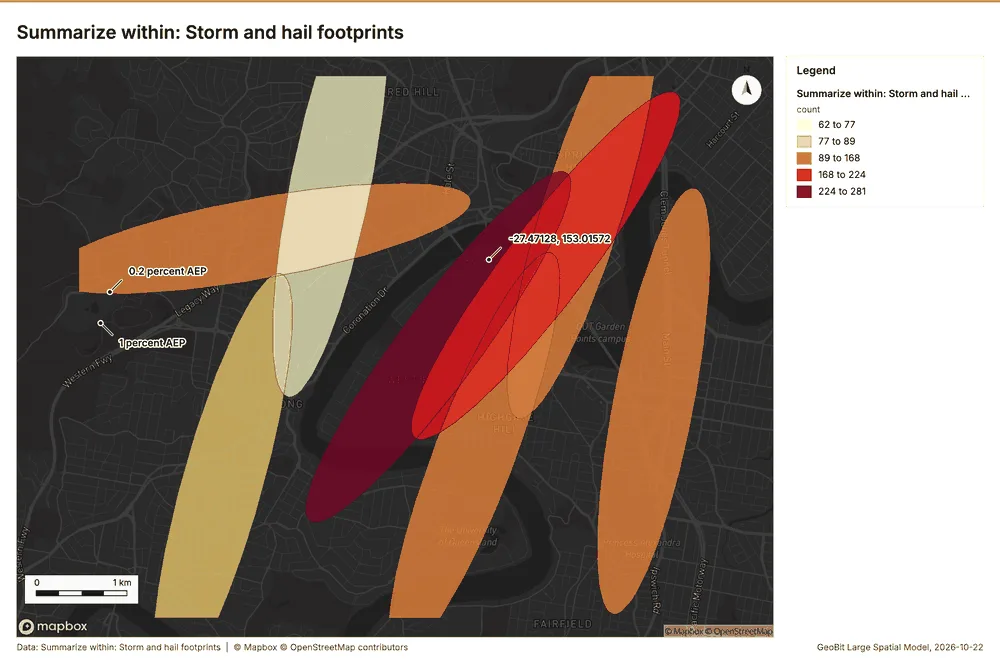
Summarize within
What this analysis is. Summarize within: Count and aggregate the features inside each polygon (or bin), proportionally for lines and polygons 4. In ArcGIS it is Summarize Within or Aggregate Points; in QGIS, native:countpointsinpolygon or native:sumlinelengths 4.
Why it was run on this data. Count Insured properties inside each feature of Storm and hail footprints by occupancy; the counts map as a choropleth (natural breaks, sequential colors) 41.
What it found. Summarize within on Insured properties, Storm and hail footprints: Summarize within: 1 layer saved: Summarize within: Storm and hail footprints (8 features) 81642. It reported result, count 8; result, elapsed ms 2; billing, cost 0.03818; billing, list price 0.03818; billing, upstream cost 0 42.
| Result | Value |
|---|---|
| result, count | 8 |
| result, elapsed ms | 2 |
| billing, cost | 0.03818 |
| billing, list price | 0.03818 |
| billing, upstream cost | 0 |
Findings
- Evidenced: Summarize within on Insured properties, Storm and hail footprints: Summarize within: 1 layer saved: Summarize within: Storm and hail footprints (8 features) 81642.
- Evidenced: It reported result, count 8; result, elapsed ms 2; billing, cost 0.03818; billing, list price 0.03818; billing, upstream cost 0 42.
Tool gp_summarize_within; parameters {"stats": [{"stat": "sum", "field": "sum_insured_aud"}], "project": "45adc477-2b11-425a-ada1-ef48522eb87e", "features": {"layer": "Insured properties (7fe53ce9)"}, "group_by": "occupancy", "polygons": {"layer": "Storm and hail footprints (2681856b)"}}
Maps and charts
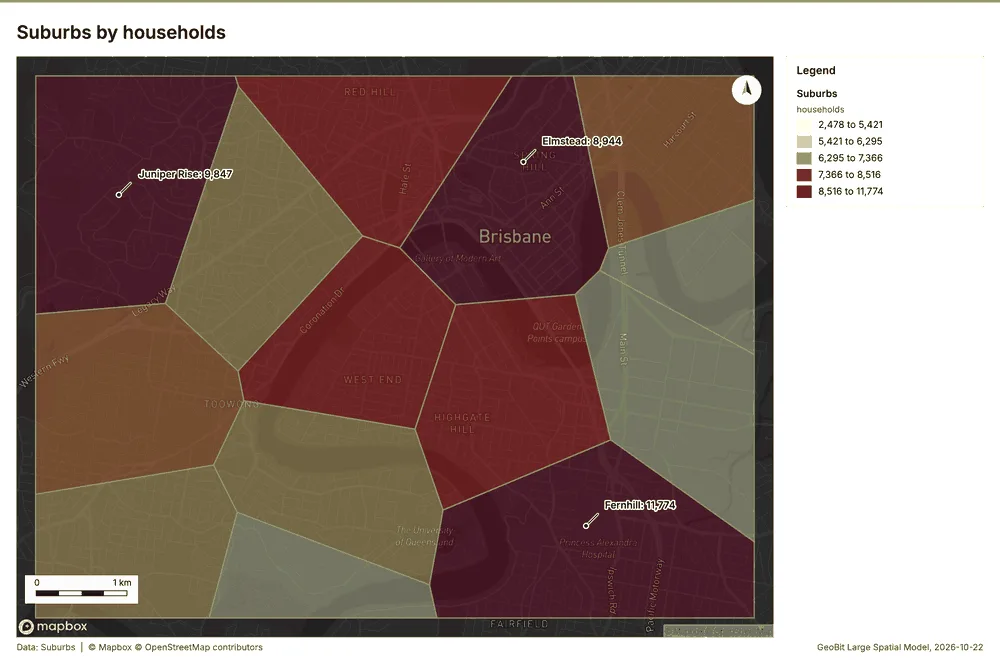
The run also made 19 map image(s) 43444546474849505152535455565758596061 and 27 chart(s) 626364656667686970717273747576777879808182838485868788.
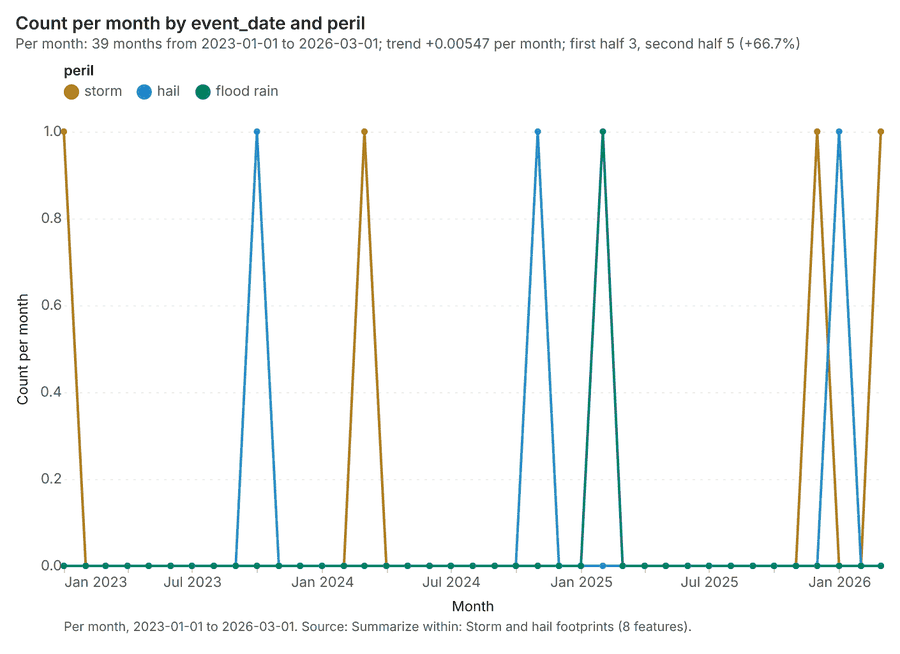
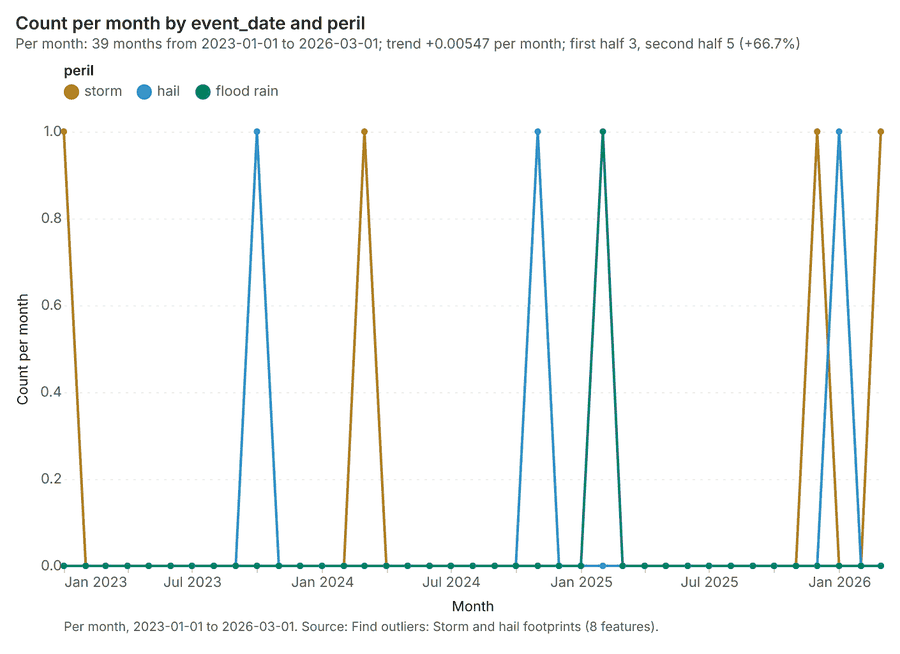
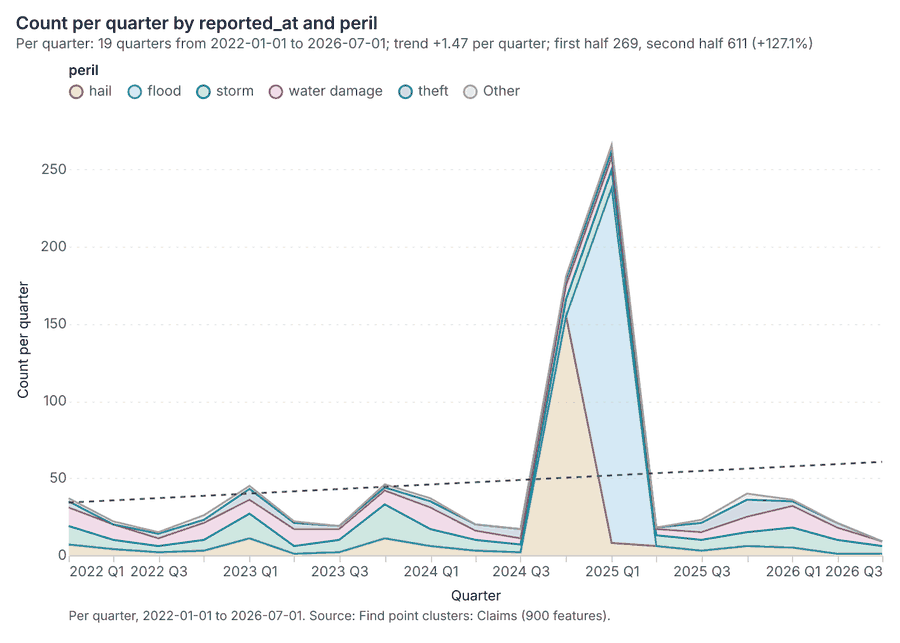
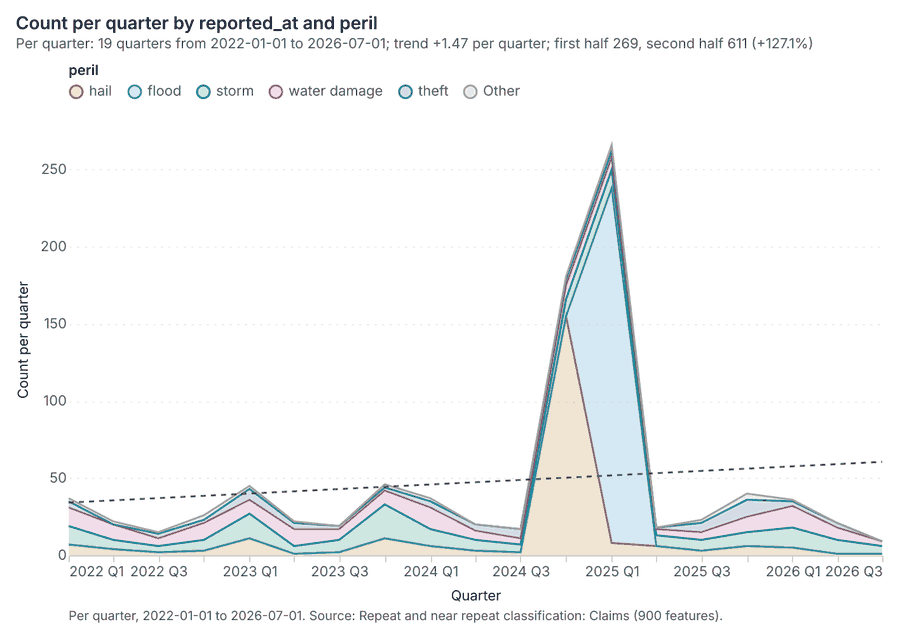
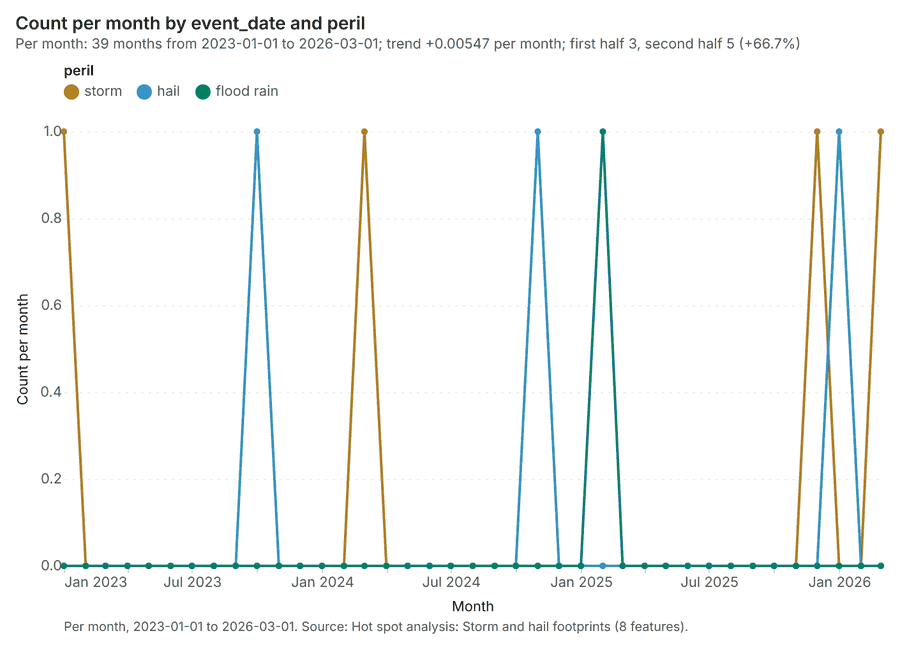
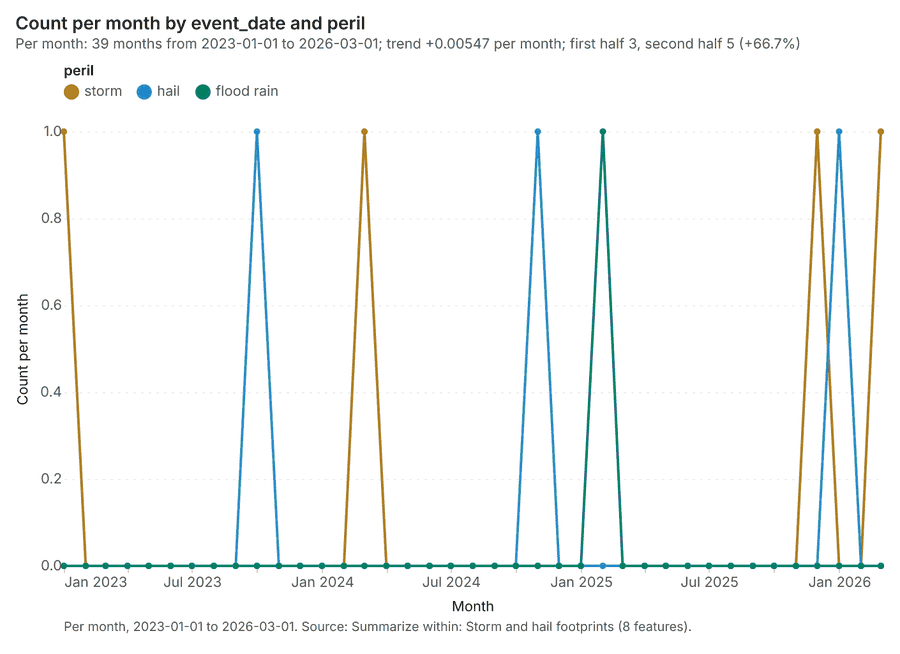
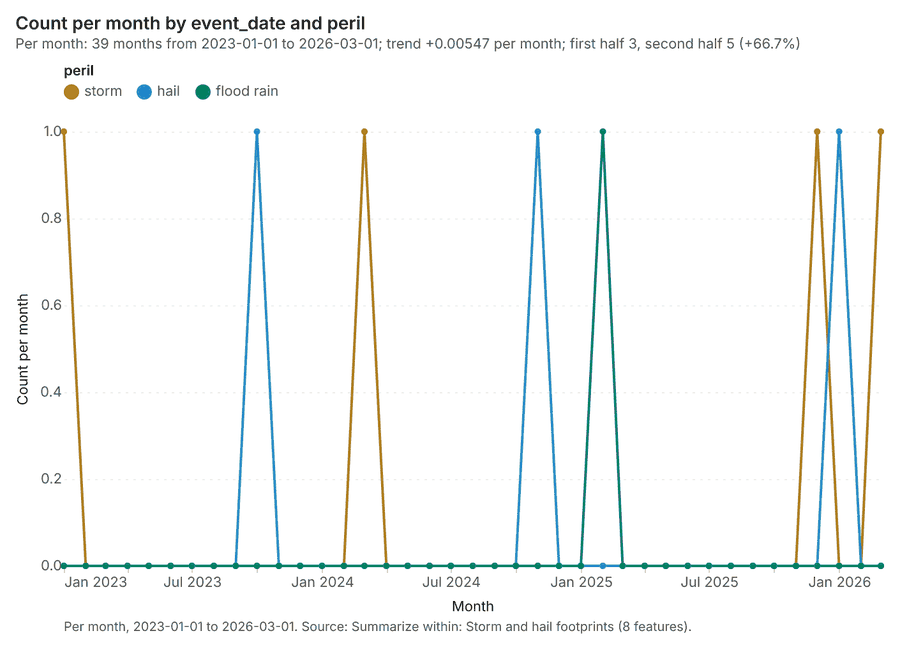
Changes since the last run
This is the first report of this project.
Sources
- 1Rendering: Chart: Timeline: events per quarter by dataset. 38 rows id 5eff943c-4f40-4974-826f-340c196a25f8
- 2Dataset: Storm and hail footprints. vector, 8 rows id 677fcb18-5109-46eb-a1ee-fa3ad15dd34f
- 3Dataset: Claims. vector, 900 rows id 6588dd91-5576-4a92-8d10-39bd636340c7
- 4Catalog: Summarize within (operation catalog, gp_summarize_within). Count and aggregate the features inside each polygon (or bin), proportionally for lines and polygons. ArcGIS: Summarize Within, Aggregate Points. QGIS: native:countpointsinpolygon, native:sumlinelengths. id gp_summarize_within
- 5Plan: Claims per feature of Storm and hail footprints (the Start plan's candidate c_3ce931de86b1). Count Claims inside each feature of Storm and hail footprints by peril; the counts map as a choropleth (natural breaks, sequential colors). id 06d8dbec-fb93-4c0a-9be6-0a9d1ccc71be:c_3ce931de86b1
- 6Tool result: gp_summarize_within, step 0. Summarize within: 1 layer saved: Summarize within: Storm and hail footprints (8 features). id a0114b7b-51fd-42f8-9f06-c527e020edfd:0
- 7Layer: Claims. 900 features id 1572e189-e7b2-4e6f-a830-ed552da56575
- 8Layer: Storm and hail footprints. 8 features id 2681856b-be9b-4f63-8284-615f870c0be2
- 9Tool result: gp_summarize_within, step 1. Summarize within: 1 layer saved: Summarize within: Storm and hail footprints (8 features). id a0114b7b-51fd-42f8-9f06-c527e020edfd:1
- 10Layer: River gauges. 8 features id af5a84eb-6d2b-423b-bb0a-445cd0c09e95
- 11Catalog: Hot spot analysis (operation catalog, gp_hot_spots). Getis-Ord Gi* hot and cold spots with z-scores, p-values and confidence bins. ArcGIS: Find Hot Spots, Hot Spot Analysis (Getis-Ord Gi*). QGIS: qgis:hotspot (plugin). id gp_hot_spots
- 12Plan: Hot spots of Claims (the Start plan's candidate c_9ab60fc1c203). 900 points: Getis-Ord Gi* tests whether the concentrations in Claims are statistically significant. id 06d8dbec-fb93-4c0a-9be6-0a9d1ccc71be:c_9ab60fc1c203
- 13Tool result: gp_hot_spots, step 0. Hot spot analysis: 1 layer saved: Hot spot analysis: Claims (207 features). id 316325ff-a684-43d3-bbf3-652ebc37b3e4:0
- 14Plan: Hot spots of Insured properties (the Start plan's candidate c_69adcd5be75e). 1400 points: Getis-Ord Gi* tests whether the concentrations in Insured properties are statistically significant. id 06d8dbec-fb93-4c0a-9be6-0a9d1ccc71be:c_69adcd5be75e
- 15Tool result: gp_hot_spots, step 1. Hot spot analysis: 1 layer saved: Hot spot analysis: Insured properties (208 features). id 316325ff-a684-43d3-bbf3-652ebc37b3e4:1
- 16Layer: Insured properties. 1,400 features id 7fe53ce9-7e3f-4c5c-9f52-a8f6ec7fe611
- 17Plan: Hot spots of Storm and hail footprints (the Start plan's candidate c_f4c86eb32d2b). Gi* hot spots of 'max_hail_mm' across the areas. id 06d8dbec-fb93-4c0a-9be6-0a9d1ccc71be:c_f4c86eb32d2b
- 18Tool result: gp_hot_spots, step 2. Hot spot analysis: 1 layer saved: Hot spot analysis: Storm and hail footprints (8 features). id 316325ff-a684-43d3-bbf3-652ebc37b3e4:2
- 19Catalog: Emerging hot spots (operation catalog, gp_space_time_hot_spots). Where hot spots are new, consecutive, intensifying, persistent, diminishing, sporadic, oscillating or historical over time. ArcGIS: Emerging Hot Spot Analysis, Create Space Time Cube. id gp_space_time_hot_spots
- 20Plan: Space time hot spots of Claims (the Start plan's candidate c_40588a07718a). Claims carry dates in 'reported_at': emerging hot spot analysis finds new, intensifying and fading hot spots per month. id 06d8dbec-fb93-4c0a-9be6-0a9d1ccc71be:c_40588a07718a
- 21Tool result: gp_space_time_hot_spots, step 0. Emerging hot spots: 1 layer saved: Emerging hot spots: Claims (68 features). id d0e51480-2493-4ab8-a463-1c97e8e32710:0
- 22Catalog: Repeat and near repeat classification (operation catalog, gp_near_repeat). Classify incidents as originators, repeats (same place) or near repeats within a distance and time window, with a Knox test table. ArcGIS: Repeat and Near Repeat Classification, Near Repeat Calculator. id gp_near_repeat
- 23Plan: Near repeat of Claims (the Start plan's candidate c_f4deb424175b). Near repeat analysis tests whether Claims close in space also follow each other within 30 days. id 06d8dbec-fb93-4c0a-9be6-0a9d1ccc71be:c_f4deb424175b
- 24Tool result: gp_near_repeat, step 1. Repeat and near repeat classification: 1 layer saved: Repeat and near repeat classification: Claims (900 features). id d0e51480-2493-4ab8-a463-1c97e8e32710:1
- 25Catalog: Calculate density (operation catalog, gp_calculate_density). Kernel density per square kilometer on a grid. ArcGIS: Calculate Density, Kernel Density. QGIS: native:heatmapkerneldensityestimation. id gp_calculate_density
- 26Plan: Kernel density of Claims (the Start plan's candidate c_26d4d74b1df1). 900 points in Claims: a density surface shows where they concentrate. id 06d8dbec-fb93-4c0a-9be6-0a9d1ccc71be:c_26d4d74b1df1
- 27Tool result: gp_calculate_density, step 0. Calculate density: 1 layer saved: Calculate density: Claims (1334 features). id 9884c7e7-d853-4005-bf7a-999f5bc9cc52:0
- 28Plan: Kernel density of Insured properties (the Start plan's candidate c_0ea6c9ca57d7). 1400 points in Insured properties: a density surface shows where they concentrate. id 06d8dbec-fb93-4c0a-9be6-0a9d1ccc71be:c_0ea6c9ca57d7
- 29Tool result: gp_calculate_density, step 1. Calculate density: 1 layer saved: Calculate density: Insured properties (1421 features). id 9884c7e7-d853-4005-bf7a-999f5bc9cc52:1
- 30Catalog: Find point clusters (operation catalog, gp_find_point_clusters). Density-based clusters (DBSCAN, HDBSCAN or OPTICS, optionally space-time) with hulls and noise. ArcGIS: Find Point Clusters, Density-based Clustering. QGIS: native:dbscanclustering, native:stdbscanclustering. id gp_find_point_clusters
- 31Plan: Cluster points of Claims (the Start plan's candidate c_ce029e1407c2). DBSCAN finds dense groups of Claims and separates noise. id 06d8dbec-fb93-4c0a-9be6-0a9d1ccc71be:c_ce029e1407c2
- 32Tool result: gp_find_point_clusters, step 0. Find point clusters: 2 layers saved: Find point clusters: Claims (900 features); Find point clusters: cluster hulls (2 features). id 7a8de26e-4331-45f4-a997-64ea2b53e411:0
- 33Plan: Cluster points of Insured properties (the Start plan's candidate c_33558a731f2d). DBSCAN finds dense groups of Insured properties and separates noise. id 06d8dbec-fb93-4c0a-9be6-0a9d1ccc71be:c_33558a731f2d
- 34Tool result: gp_find_point_clusters, step 1. Find point clusters: 2 layers saved: Find point clusters: Insured properties (1400 features); Find point clusters: cluster hulls (1 feature). id 7a8de26e-4331-45f4-a997-64ea2b53e411:1
- 35Catalog: Find outliers (operation catalog, gp_outliers). Anselin local Moran’s I: HH, LL clusters and HL, LH outliers. ArcGIS: Find Outliers, Cluster and Outlier Analysis (Anselin Local Moran’s I). id gp_outliers
- 36Plan: Local morans i of Storm and hail footprints (the Start plan's candidate c_4980425ab5ac). Local Moran's I maps clusters and outliers of 'max_hail_mm'. id 06d8dbec-fb93-4c0a-9be6-0a9d1ccc71be:c_4980425ab5ac
- 37Tool result: gp_outliers, step 0. Find outliers: 1 layer saved: Find outliers: Storm and hail footprints (8 features). id 98ffd9d7-e22c-464f-acd6-d17bdd616b2d:0
- 38Plan: Local morans i of Suburbs (the Start plan's candidate c_fe84d27234ac). Local Moran's I maps clusters and outliers of 'households'. id 06d8dbec-fb93-4c0a-9be6-0a9d1ccc71be:c_fe84d27234ac
- 39Tool result: gp_outliers, step 1. Find outliers: 1 layer saved: Find outliers: Suburbs (14 features). id 98ffd9d7-e22c-464f-acd6-d17bdd616b2d:1
- 40Layer: Suburbs. 14 features id fb82f048-f105-416a-bf03-e2acaab297e7
- 41Plan: Insured properties per feature of Storm and hail footprints (the Start plan's candidate c_94f8ecf5d95d). Count Insured properties inside each feature of Storm and hail footprints by occupancy; the counts map as a choropleth (natural breaks, sequential colors). id 06d8dbec-fb93-4c0a-9be6-0a9d1ccc71be:c_94f8ecf5d95d
- 42Tool result: gp_summarize_within, step 0. Summarize within: 1 layer saved: Summarize within: Storm and hail footprints (8 features). id 87fb30a5-7def-44b9-b558-2525d31918b0:0
- 43Rendering: Map: Summarize within: Storm and hail footprints id 2a1aaf16-223e-4075-bceb-302fef50736e
- 44Rendering: Map: Summarize within: Storm and hail footprints id a7e144f5-0b71-48f6-ac87-e92dd74fcb2a
- 45Rendering: Map: Hot spot analysis: Claims id 7982e9a2-c0e5-45be-a5c5-31b9b945fc19
- 46Rendering: Map: Hot spot analysis: Insured properties id e409fec4-375a-4521-bc6c-9e9ba19cdee1
- 47Rendering: Map: Hot spot analysis: Storm and hail footprints id 4157c216-416d-4e7b-9591-e76aa734122a
- 48Rendering: Map: Emerging hot spots: Claims id a2572cd7-31cf-49d7-8590-9c9188958738
- 49Rendering: Map: Repeat and near repeat classification: Claims id ad4d31e6-edd2-4091-ae9e-986c5980635d
- 50Rendering: Map: Calculate density: Claims id e90e2e84-8ae2-4ddf-89c1-8e9cb99846f5
- 51Rendering: Map: Calculate density: Insured properties id aca6ffec-56b4-437a-9237-8042f2451842
- 52Rendering: Map: Storm and hail footprints by max_hail_mm id 542c2970-4f8f-4518-9047-759e443972dc
- 53Rendering: Map: Flood zones by typical_depth_m id c2b90df1-67a4-4858-8e9d-46309defb94d
- 54Rendering: Map: Suburbs by households id 47988ada-460b-44ad-8fbf-b6caf5890b21
- 55Rendering: Map: Find point clusters: Claims id 65781e45-6d77-4466-abc1-ccf65b978fd5
- 56Rendering: Map: Find point clusters: cluster hulls id 13ddfb40-5c9a-46c0-9af5-ae2bbe72be38
- 57Rendering: Map: Find point clusters: Insured properties id a28a92fa-f6da-4952-95bd-bcd717ae80e5
- 58Rendering: Map: Find point clusters: cluster hulls id 93578793-0a4a-409b-917d-f245b87c7c0a
- 59Rendering: Map: Find outliers: Storm and hail footprints id 21b81e4b-9076-4527-acfc-0ac44c04a562
- 60Rendering: Map: Find outliers: Suburbs id 83af531c-9820-486f-b04f-30b70b9056df
- 61Rendering: Map: Summarize within: Storm and hail footprints id 1d135757-0516-446f-a7c6-b6db7e98747b
- 62Rendering: Chart: Insured properties over time (year_built). 12 rows id 8d4e2d79-aac5-4c6e-abac-e21331c131b5
- 63Rendering: Chart: Storm and hail footprints over time (event_date). 117 rows id 64775539-9daf-497b-9274-e7024b9b7580
- 64Rendering: Chart: Claims over time (reported_at). 114 rows id 3e7bf944-1b18-4cfd-92e7-02084d4ad6af
- 65Rendering: Chart: Policy register over time (renewal_month). 12 rows id bb394e48-05d5-45c8-8e10-e9c6cd1c1e22
- 66Rendering: Chart: Summarize within: Storm and hail footprints. 117 rows id 8d611e4f-5e30-41e5-a17b-8fd774fbb333
- 67Rendering: Chart: Summarize within: Storm and hail footprints. 117 rows id 2921949c-cc8b-49e8-8f36-372708ec0ec9
- 68Rendering: Chart: Hot spot analysis: Claims. 13 rows id 1c547987-63a6-4225-9fc5-f8a1f4f40bc9
- 69Rendering: Chart: Hot spot analysis: Insured properties. 10 rows id c688d50d-41b5-4273-bee3-14304883a86e
- 70Rendering: Chart: Hot spot analysis: Storm and hail footprints. 5 rows id 7a11d17b-e742-4289-80a4-56c828ed814a
- 71Rendering: Chart: Emerging hot spots: Claims. 8 rows id ac19af8e-92fa-4354-8343-6fe31255a078
- 72Rendering: Chart: Repeat and near repeat classification: Claims. 114 rows id bb30ce9a-b6c1-4c0a-8492-1403ee006f23
- 73Rendering: Chart: Calculate density: Claims. 12 rows id b980344c-c078-4dbe-a95f-0ae8eebe3ff6
- 74Rendering: Chart: Calculate density: Insured properties. 12 rows id 025d939a-b4ae-4c9a-aa35-a12ef8a45586
- 75Rendering: Chart: Find point clusters: Claims. 3 rows id 8728ce25-5e56-459f-92e6-de81f519a61c
- 76Rendering: Chart: Find point clusters: cluster hulls. 2 rows id d2463227-185a-4d40-b5b3-e7812cc679e9
- 77Rendering: Chart: Find point clusters: Insured properties. 2 rows id 5404c19d-8b94-4d9a-b40f-9912eb859cbb
- 78Rendering: Chart: Find point clusters: cluster hulls. 1 rows id 1c25a4c8-6c19-45d4-aba5-9a3129c05f70
- 79Rendering: Chart: Find outliers: Storm and hail footprints. 8 rows id e6de1baa-beb2-418f-8153-8793e70fc2ad
- 80Rendering: Chart: Find outliers: Suburbs. 14 rows id 1f04f579-5f9b-414c-8ce1-17a7102c48dd
- 81Rendering: Chart: Summarize within: Storm and hail footprints. 117 rows id 39560fea-7fad-479f-b618-a0c0204e7345
- 82Rendering: Chart: Summarize within: Storm and hail footprints over time. 117 rows id 6920192b-c42f-45e7-b970-d477640fcdd8
- 83Rendering: Chart: Find outliers: Storm and hail footprints over time. 117 rows id 942d51e3-f098-4b37-9152-999b3cbea4c1
- 84Rendering: Chart: Find point clusters: Claims over time. 114 rows id 9e4c70ff-e34e-4809-b15a-f0dc8cc60f38
- 85Rendering: Chart: Repeat and near repeat classification: Claims over time. 114 rows id d8be7ef1-a24d-4ad4-8527-372f6fa7abd4
- 86Rendering: Chart: Hot spot analysis: Storm and hail footprints over time. 117 rows id 7d410c0b-09b1-4ad6-bdac-9d8ac60bd780
- 87Rendering: Chart: Summarize within: Storm and hail footprints over time. 117 rows id 90935ae0-56d1-432d-a4c4-0c237d27fc7e
- 88Rendering: Chart: Summarize within: Storm and hail footprints over time. 117 rows id d5a96672-ab36-47b6-9af9-6ecb9aa53ed8
- 89Dataset: Flood zones. vector, 3 rows id 9ff7cd07-9707-4139-9501-699d367ac589
- 90Dataset: River. vector, 1 rows id 2ae3f47a-cb7b-4a6f-8f11-4fad2d865c48
- 91Dataset: Suburbs. vector, 14 rows id f84efb12-ec44-4ffb-9a4b-731fc92b0ff4
- 92Dataset: Insured properties. vector, 1400 rows id db8fb622-dcb0-450a-b376-1f30939b1f04
- 93Dataset: River gauges. vector, 8 rows id bc462c44-e561-4f0b-85e5-e1ed939da508
- 94Dataset: Levees. vector, 6 rows id d0e2941b-d2d3-4587-bca1-8ad0d6046a7a
- 95Dataset: Policy register. table, 1400 rows id 270b5574-288d-4ef6-b58a-64621756f91c
- 96Dataset: Depth-damage curves. table, 28 rows id a51443ce-2e0b-48b7-b869-93eb5bf70044
- 97Dataset: Portfolio exposure memo. document, ? rows id 705c2955-c1f1-464c-b094-d1aea428e6cb
- 98Dataset: Underwriting guidelines for flood zones. document, ? rows id d7e25805-fa99-4630-adf1-bd51214bd5d6
- 99Record: Sample: Insurance, Brisbane id 45adc477-2b11-425a-ada1-ef48522eb87e
- 100Layer: Summarize within: Storm and hail footprints. 8 features id f96865cb-7df1-42b5-9e46-55d014c12fe3
- 101Layer: Summarize within: Storm and hail footprints. 8 features id 96c5a7ae-3002-43b2-822a-d548a052a0a8
- 102Layer: Hot spot analysis: Claims. 207 features id 4e47f295-19b9-4c46-9b06-9f9dbfb63d94
- 103Layer: Hot spot analysis: Insured properties. 208 features id b322b158-2dd7-4092-9c87-b4df7b23c40a
- 104Layer: Hot spot analysis: Storm and hail footprints. 8 features id 8c364057-1ad8-4de9-9bee-e32bb6309d1b
- 105Layer: Emerging hot spots: Claims. 68 features id b605aa48-02fd-4f66-a10c-4cd4828bb0a3
- 106Layer: Repeat and near repeat classification: Claims. 900 features id 91fe9915-8c82-43f0-8a58-c4662a7ed370
- 107Layer: Calculate density: Claims. 1,334 features id d9529f47-12c6-44d1-a1ff-7650822864bb
- 108Layer: Calculate density: Insured properties. 1,421 features id 22892878-2807-40a9-8985-4a9271df26df
- 109Layer: Find point clusters: Claims. 900 features id c9572018-f633-4939-be7b-87082a048abb
- 110Layer: Find point clusters: cluster hulls. 2 features id 38d533f5-098f-4de2-b2fa-2ed589169af1
- 111Layer: Find point clusters: Insured properties. 1,400 features id dfd881e3-2b48-4be4-96e0-5ec3d592c5e9
- 112Layer: Find point clusters: cluster hulls. 1 features id 8d98e96a-9a2f-4616-8164-1bac0df14ad3
- 113Layer: Find outliers: Storm and hail footprints. 8 features id d4fe68e2-fd83-4c6f-8e98-04be0d55904b
- 114Layer: Find outliers: Suburbs. 14 features id f8ed8015-1aa6-4628-b2cf-2994274f3295
- 115Layer: Summarize within: Storm and hail footprints. 8 features id 5cc6baeb-9e4e-4539-8c3d-f2e3bb4355db
Appendix: the data behind the chartsShow
Figure 1. Timeline: events per quarter by dataset 1
| period | series | value |
|---|---|---|
| 2022-01-01 | Claims | 37 |
| 2022-01-01 | Storm and hail footprints | 0 |
| 2022-04-01 | Claims | 22 |
| 2022-04-01 | Storm and hail footprints | 0 |
| 2022-07-01 | Claims | 15 |
| 2022-07-01 | Storm and hail footprints | 0 |
| 2022-10-01 | Claims | 26 |
| 2022-10-01 | Storm and hail footprints | 0 |
| 2023-01-01 | Claims | 45 |
| 2023-01-01 | Storm and hail footprints | 1 |
| 2023-04-01 | Claims | 22 |
| 2023-04-01 | Storm and hail footprints | 0 |
| 2023-07-01 | Claims | 19 |
| 2023-07-01 | Storm and hail footprints | 0 |
| 2023-10-01 | Claims | 46 |
| 2023-10-01 | Storm and hail footprints | 1 |
| 2024-01-01 | Claims | 37 |
| 2024-01-01 | Storm and hail footprints | 1 |
| 2024-04-01 | Claims | 20 |
| 2024-04-01 | Storm and hail footprints | 0 |
| 2024-07-01 | Claims | 17 |
| 2024-07-01 | Storm and hail footprints | 0 |
| 2024-10-01 | Claims | 181 |
| 2024-10-01 | Storm and hail footprints | 1 |
| 2025-01-01 | Claims | 266 |
| 2025-01-01 | Storm and hail footprints | 1 |
| 2025-04-01 | Claims | 18 |
| 2025-04-01 | Storm and hail footprints | 0 |
| 2025-07-01 | Claims | 23 |
| 2025-07-01 | Storm and hail footprints | 0 |
| 2025-10-01 | Claims | 40 |
| 2025-10-01 | Storm and hail footprints | 1 |
| 2026-01-01 | Claims | 36 |
| 2026-01-01 | Storm and hail footprints | 2 |
| 2026-04-01 | Claims | 21 |
| 2026-04-01 | Storm and hail footprints | 0 |
| 2026-07-01 | Claims | 9 |
| 2026-07-01 | Storm and hail footprints | 0 |
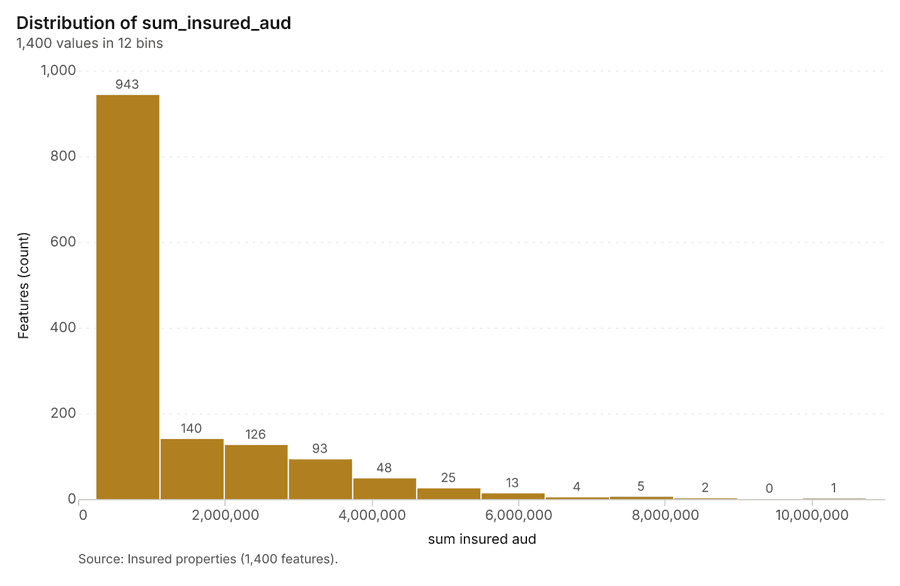
Figure 21. Insured properties over time (year_built) 62
| bin_start | bin_end | count |
|---|---|---|
| 2.312e+05 | 1,106,837 | 943 |
| 1,106,837 | 1,982,438 | 140 |
| 1,982,438 | 2,858,040 | 126 |
| 2,858,040 | 3,733,642 | 93 |
| 3,733,642 | 4,609,244 | 48 |
| 4,609,244 | 5,484,846 | 25 |
| 5,484,846 | 6,360,447 | 13 |
| 6,360,447 | 7,236,049 | 4 |
| 7,236,049 | 8,111,651 | 5 |
| 8,111,651 | 8,987,252 | 2 |
| 8,987,252 | 9,862,854 | 0 |
| 9,862,854 | 10,738,456 | 1 |
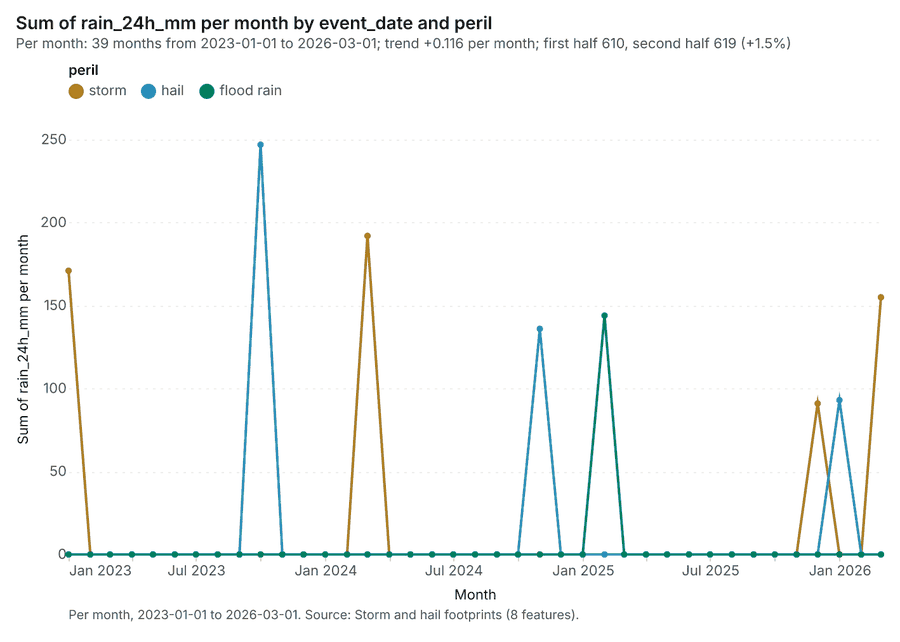
Figure 22. Storm and hail footprints over time (event_date) 63
| period | series | value |
|---|---|---|
| 2023-01-01 | storm | 171 |
| 2023-01-01 | hail | 0 |
| 2023-01-01 | flood rain | 0 |
| 2023-02-01 | storm | 0 |
| 2023-02-01 | hail | 0 |
| 2023-02-01 | flood rain | 0 |
| 2023-03-01 | storm | 0 |
| 2023-03-01 | hail | 0 |
| 2023-03-01 | flood rain | 0 |
| 2023-04-01 | storm | 0 |
| 2023-04-01 | hail | 0 |
| 2023-04-01 | flood rain | 0 |
| 2023-05-01 | storm | 0 |
| 2023-05-01 | hail | 0 |
| 2023-05-01 | flood rain | 0 |
| 2023-06-01 | storm | 0 |
| 2023-06-01 | hail | 0 |
| 2023-06-01 | flood rain | 0 |
| 2023-07-01 | storm | 0 |
| 2023-07-01 | hail | 0 |
| 2023-07-01 | flood rain | 0 |
| 2023-08-01 | storm | 0 |
| 2023-08-01 | hail | 0 |
| 2023-08-01 | flood rain | 0 |
| 2023-09-01 | storm | 0 |
| 2023-09-01 | hail | 0 |
| 2023-09-01 | flood rain | 0 |
| 2023-10-01 | storm | 0 |
| 2023-10-01 | hail | 247 |
| 2023-10-01 | flood rain | 0 |
| 2023-11-01 | storm | 0 |
| 2023-11-01 | hail | 0 |
| 2023-11-01 | flood rain | 0 |
| 2023-12-01 | storm | 0 |
| 2023-12-01 | hail | 0 |
| 2023-12-01 | flood rain | 0 |
| 2024-01-01 | storm | 0 |
| 2024-01-01 | hail | 0 |
| 2024-01-01 | flood rain | 0 |
| 2024-02-01 | storm | 0 |
| 2024-02-01 | hail | 0 |
| 2024-02-01 | flood rain | 0 |
| 2024-03-01 | storm | 192 |
| 2024-03-01 | hail | 0 |
| 2024-03-01 | flood rain | 0 |
| 2024-04-01 | storm | 0 |
| 2024-04-01 | hail | 0 |
| 2024-04-01 | flood rain | 0 |
| 2024-05-01 | storm | 0 |
| 2024-05-01 | hail | 0 |
| 2024-05-01 | flood rain | 0 |
| 2024-06-01 | storm | 0 |
| 2024-06-01 | hail | 0 |
| 2024-06-01 | flood rain | 0 |
| 2024-07-01 | storm | 0 |
| 2024-07-01 | hail | 0 |
| 2024-07-01 | flood rain | 0 |
| 2024-08-01 | storm | 0 |
| 2024-08-01 | hail | 0 |
| 2024-08-01 | flood rain | 0 |
| 2024-09-01 | storm | 0 |
| 2024-09-01 | hail | 0 |
| 2024-09-01 | flood rain | 0 |
| 2024-10-01 | storm | 0 |
| 2024-10-01 | hail | 0 |
| 2024-10-01 | flood rain | 0 |
| 2024-11-01 | storm | 0 |
| 2024-11-01 | hail | 136 |
| 2024-11-01 | flood rain | 0 |
| 2024-12-01 | storm | 0 |
| 2024-12-01 | hail | 0 |
| 2024-12-01 | flood rain | 0 |
| 2025-01-01 | storm | 0 |
| 2025-01-01 | hail | 0 |
| 2025-01-01 | flood rain | 0 |
| 2025-02-01 | storm | 0 |
| 2025-02-01 | hail | 0 |
| 2025-02-01 | flood rain | 144 |
| 2025-03-01 | storm | 0 |
| 2025-03-01 | hail | 0 |
| 2025-03-01 | flood rain | 0 |
| 2025-04-01 | storm | 0 |
| 2025-04-01 | hail | 0 |
| 2025-04-01 | flood rain | 0 |
| 2025-05-01 | storm | 0 |
| 2025-05-01 | hail | 0 |
| 2025-05-01 | flood rain | 0 |
| 2025-06-01 | storm | 0 |
| 2025-06-01 | hail | 0 |
| 2025-06-01 | flood rain | 0 |
| 2025-07-01 | storm | 0 |
| 2025-07-01 | hail | 0 |
| 2025-07-01 | flood rain | 0 |
| 2025-08-01 | storm | 0 |
| 2025-08-01 | hail | 0 |
| 2025-08-01 | flood rain | 0 |
| 2025-09-01 | storm | 0 |
| 2025-09-01 | hail | 0 |
| 2025-09-01 | flood rain | 0 |
| 2025-10-01 | storm | 0 |
| 2025-10-01 | hail | 0 |
| 2025-10-01 | flood rain | 0 |
| 2025-11-01 | storm | 0 |
| 2025-11-01 | hail | 0 |
| 2025-11-01 | flood rain | 0 |
| 2025-12-01 | storm | 91 |
| 2025-12-01 | hail | 0 |
| 2025-12-01 | flood rain | 0 |
| 2026-01-01 | storm | 0 |
| 2026-01-01 | hail | 93 |
| 2026-01-01 | flood rain | 0 |
| 2026-02-01 | storm | 0 |
| 2026-02-01 | hail | 0 |
| 2026-02-01 | flood rain | 0 |
| 2026-03-01 | storm | 155 |
| 2026-03-01 | hail | 0 |
| 2026-03-01 | flood rain | 0 |
Figure 23. Claims over time (reported_at) 64
| period | series | value |
|---|---|---|
| 2022-01-01 | hail | 7 |
| 2022-01-01 | flood | 0 |
| 2022-01-01 | storm | 12 |
| 2022-01-01 | water damage | 12 |
| 2022-01-01 | theft | 4 |
| 2022-01-01 | Other | 2 |
| 2022-04-01 | hail | 4 |
| 2022-04-01 | flood | 0 |
| 2022-04-01 | storm | 6 |
| 2022-04-01 | water damage | 10 |
| 2022-04-01 | theft | 0 |
| 2022-04-01 | Other | 2 |
| 2022-07-01 | hail | 2 |
| 2022-07-01 | flood | 0 |
| 2022-07-01 | storm | 4 |
| 2022-07-01 | water damage | 5 |
| 2022-07-01 | theft | 3 |
| 2022-07-01 | Other | 1 |
| 2022-10-01 | hail | 3 |
| 2022-10-01 | flood | 0 |
| 2022-10-01 | storm | 7 |
| 2022-10-01 | water damage | 11 |
| 2022-10-01 | theft | 2 |
| 2022-10-01 | Other | 3 |
| 2023-01-01 | hail | 11 |
| 2023-01-01 | flood | 0 |
| 2023-01-01 | storm | 16 |
| 2023-01-01 | water damage | 9 |
| 2023-01-01 | theft | 7 |
| 2023-01-01 | Other | 2 |
| 2023-04-01 | hail | 1 |
| 2023-04-01 | flood | 0 |
| 2023-04-01 | storm | 5 |
| 2023-04-01 | water damage | 11 |
| 2023-04-01 | theft | 4 |
| 2023-04-01 | Other | 1 |
| 2023-07-01 | hail | 2 |
| 2023-07-01 | flood | 0 |
| 2023-07-01 | storm | 8 |
| 2023-07-01 | water damage | 7 |
| 2023-07-01 | theft | 2 |
| 2023-07-01 | Other | 0 |
| 2023-10-01 | hail | 11 |
| 2023-10-01 | flood | 0 |
| 2023-10-01 | storm | 22 |
| 2023-10-01 | water damage | 9 |
| 2023-10-01 | theft | 2 |
| 2023-10-01 | Other | 2 |
| 2024-01-01 | hail | 6 |
| 2024-01-01 | flood | 0 |
| 2024-01-01 | storm | 11 |
| 2024-01-01 | water damage | 14 |
| 2024-01-01 | theft | 4 |
| 2024-01-01 | Other | 2 |
| 2024-04-01 | hail | 3 |
| 2024-04-01 | flood | 0 |
| 2024-04-01 | storm | 7 |
| 2024-04-01 | water damage | 6 |
| 2024-04-01 | theft | 4 |
| 2024-04-01 | Other | 0 |
| 2024-07-01 | hail | 2 |
| 2024-07-01 | flood | 0 |
| 2024-07-01 | storm | 5 |
| 2024-07-01 | water damage | 4 |
| 2024-07-01 | theft | 6 |
| 2024-07-01 | Other | 0 |
| 2024-10-01 | hail | 155 |
| 2024-10-01 | flood | 0 |
| 2024-10-01 | storm | 11 |
| 2024-10-01 | water damage | 9 |
| 2024-10-01 | theft | 4 |
| 2024-10-01 | Other | 2 |
| 2025-01-01 | hail | 8 |
| 2025-01-01 | flood | 230 |
| 2025-01-01 | storm | 12 |
| 2025-01-01 | water damage | 8 |
| 2025-01-01 | theft | 4 |
| 2025-01-01 | Other | 4 |
| 2025-04-01 | hail | 6 |
| 2025-04-01 | flood | 0 |
| 2025-04-01 | storm | 7 |
| 2025-04-01 | water damage | 4 |
| 2025-04-01 | theft | 1 |
| 2025-04-01 | Other | 0 |
| 2025-07-01 | hail | 3 |
| 2025-07-01 | flood | 0 |
| 2025-07-01 | storm | 7 |
| 2025-07-01 | water damage | 5 |
| 2025-07-01 | theft | 6 |
| 2025-07-01 | Other | 2 |
| 2025-10-01 | hail | 6 |
| 2025-10-01 | flood | 0 |
| 2025-10-01 | storm | 9 |
| 2025-10-01 | water damage | 10 |
| 2025-10-01 | theft | 11 |
| 2025-10-01 | Other | 4 |
| 2026-01-01 | hail | 5 |
| 2026-01-01 | flood | 0 |
| 2026-01-01 | storm | 13 |
| 2026-01-01 | water damage | 14 |
| 2026-01-01 | theft | 3 |
| 2026-01-01 | Other | 1 |
| 2026-04-01 | hail | 1 |
| 2026-04-01 | flood | 0 |
| 2026-04-01 | storm | 9 |
| 2026-04-01 | water damage | 8 |
| 2026-04-01 | theft | 3 |
| 2026-04-01 | Other | 0 |
| 2026-07-01 | hail | 1 |
| 2026-07-01 | flood | 0 |
| 2026-07-01 | storm | 5 |
| 2026-07-01 | water damage | 3 |
| 2026-07-01 | theft | 0 |
| 2026-07-01 | Other | 0 |
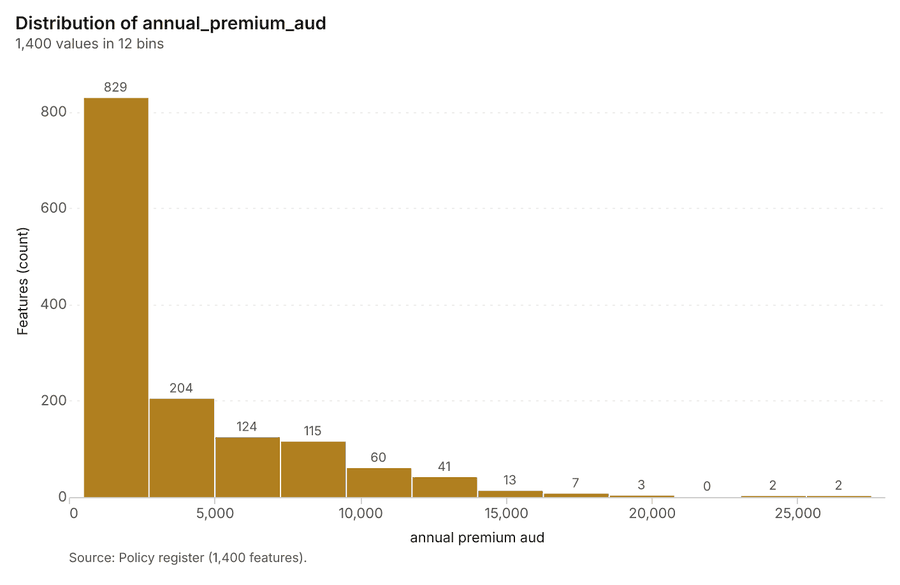
Figure 24. Policy register over time (renewal_month) 65
| bin_start | bin_end | count |
|---|---|---|
| 474 | 2,730 | 829 |
| 2,730 | 4,986 | 204 |
| 4,986 | 7,241 | 124 |
| 7,241 | 9,497 | 115 |
| 9,497 | 1.175e+04 | 60 |
| 1.175e+04 | 1.401e+04 | 41 |
| 1.401e+04 | 1.626e+04 | 13 |
| 1.626e+04 | 1.852e+04 | 7 |
| 1.852e+04 | 2.078e+04 | 3 |
| 2.078e+04 | 2.303e+04 | 0 |
| 2.303e+04 | 2.529e+04 | 2 |
| 2.529e+04 | 2.754e+04 | 2 |
Figure 25. Summarize within: Storm and hail footprints 66
| period | series | value |
|---|---|---|
| 2023-01-01 | storm | 1 |
| 2023-01-01 | hail | 0 |
| 2023-01-01 | flood rain | 0 |
| 2023-02-01 | storm | 0 |
| 2023-02-01 | hail | 0 |
| 2023-02-01 | flood rain | 0 |
| 2023-03-01 | storm | 0 |
| 2023-03-01 | hail | 0 |
| 2023-03-01 | flood rain | 0 |
| 2023-04-01 | storm | 0 |
| 2023-04-01 | hail | 0 |
| 2023-04-01 | flood rain | 0 |
| 2023-05-01 | storm | 0 |
| 2023-05-01 | hail | 0 |
| 2023-05-01 | flood rain | 0 |
| 2023-06-01 | storm | 0 |
| 2023-06-01 | hail | 0 |
| 2023-06-01 | flood rain | 0 |
| 2023-07-01 | storm | 0 |
| 2023-07-01 | hail | 0 |
| 2023-07-01 | flood rain | 0 |
| 2023-08-01 | storm | 0 |
| 2023-08-01 | hail | 0 |
| 2023-08-01 | flood rain | 0 |
| 2023-09-01 | storm | 0 |
| 2023-09-01 | hail | 0 |
| 2023-09-01 | flood rain | 0 |
| 2023-10-01 | storm | 0 |
| 2023-10-01 | hail | 1 |
| 2023-10-01 | flood rain | 0 |
| 2023-11-01 | storm | 0 |
| 2023-11-01 | hail | 0 |
| 2023-11-01 | flood rain | 0 |
| 2023-12-01 | storm | 0 |
| 2023-12-01 | hail | 0 |
| 2023-12-01 | flood rain | 0 |
| 2024-01-01 | storm | 0 |
| 2024-01-01 | hail | 0 |
| 2024-01-01 | flood rain | 0 |
| 2024-02-01 | storm | 0 |
| 2024-02-01 | hail | 0 |
| 2024-02-01 | flood rain | 0 |
| 2024-03-01 | storm | 1 |
| 2024-03-01 | hail | 0 |
| 2024-03-01 | flood rain | 0 |
| 2024-04-01 | storm | 0 |
| 2024-04-01 | hail | 0 |
| 2024-04-01 | flood rain | 0 |
| 2024-05-01 | storm | 0 |
| 2024-05-01 | hail | 0 |
| 2024-05-01 | flood rain | 0 |
| 2024-06-01 | storm | 0 |
| 2024-06-01 | hail | 0 |
| 2024-06-01 | flood rain | 0 |
| 2024-07-01 | storm | 0 |
| 2024-07-01 | hail | 0 |
| 2024-07-01 | flood rain | 0 |
| 2024-08-01 | storm | 0 |
| 2024-08-01 | hail | 0 |
| 2024-08-01 | flood rain | 0 |
| 2024-09-01 | storm | 0 |
| 2024-09-01 | hail | 0 |
| 2024-09-01 | flood rain | 0 |
| 2024-10-01 | storm | 0 |
| 2024-10-01 | hail | 0 |
| 2024-10-01 | flood rain | 0 |
| 2024-11-01 | storm | 0 |
| 2024-11-01 | hail | 1 |
| 2024-11-01 | flood rain | 0 |
| 2024-12-01 | storm | 0 |
| 2024-12-01 | hail | 0 |
| 2024-12-01 | flood rain | 0 |
| 2025-01-01 | storm | 0 |
| 2025-01-01 | hail | 0 |
| 2025-01-01 | flood rain | 0 |
| 2025-02-01 | storm | 0 |
| 2025-02-01 | hail | 0 |
| 2025-02-01 | flood rain | 1 |
| 2025-03-01 | storm | 0 |
| 2025-03-01 | hail | 0 |
| 2025-03-01 | flood rain | 0 |
| 2025-04-01 | storm | 0 |
| 2025-04-01 | hail | 0 |
| 2025-04-01 | flood rain | 0 |
| 2025-05-01 | storm | 0 |
| 2025-05-01 | hail | 0 |
| 2025-05-01 | flood rain | 0 |
| 2025-06-01 | storm | 0 |
| 2025-06-01 | hail | 0 |
| 2025-06-01 | flood rain | 0 |
| 2025-07-01 | storm | 0 |
| 2025-07-01 | hail | 0 |
| 2025-07-01 | flood rain | 0 |
| 2025-08-01 | storm | 0 |
| 2025-08-01 | hail | 0 |
| 2025-08-01 | flood rain | 0 |
| 2025-09-01 | storm | 0 |
| 2025-09-01 | hail | 0 |
| 2025-09-01 | flood rain | 0 |
| 2025-10-01 | storm | 0 |
| 2025-10-01 | hail | 0 |
| 2025-10-01 | flood rain | 0 |
| 2025-11-01 | storm | 0 |
| 2025-11-01 | hail | 0 |
| 2025-11-01 | flood rain | 0 |
| 2025-12-01 | storm | 1 |
| 2025-12-01 | hail | 0 |
| 2025-12-01 | flood rain | 0 |
| 2026-01-01 | storm | 0 |
| 2026-01-01 | hail | 1 |
| 2026-01-01 | flood rain | 0 |
| 2026-02-01 | storm | 0 |
| 2026-02-01 | hail | 0 |
| 2026-02-01 | flood rain | 0 |
| 2026-03-01 | storm | 1 |
| 2026-03-01 | hail | 0 |
| 2026-03-01 | flood rain | 0 |
Figure 26. Summarize within: Storm and hail footprints 67
| period | series | value |
|---|---|---|
| 2023-01-01 | storm | 1 |
| 2023-01-01 | hail | 0 |
| 2023-01-01 | flood rain | 0 |
| 2023-02-01 | storm | 0 |
| 2023-02-01 | hail | 0 |
| 2023-02-01 | flood rain | 0 |
| 2023-03-01 | storm | 0 |
| 2023-03-01 | hail | 0 |
| 2023-03-01 | flood rain | 0 |
| 2023-04-01 | storm | 0 |
| 2023-04-01 | hail | 0 |
| 2023-04-01 | flood rain | 0 |
| 2023-05-01 | storm | 0 |
| 2023-05-01 | hail | 0 |
| 2023-05-01 | flood rain | 0 |
| 2023-06-01 | storm | 0 |
| 2023-06-01 | hail | 0 |
| 2023-06-01 | flood rain | 0 |
| 2023-07-01 | storm | 0 |
| 2023-07-01 | hail | 0 |
| 2023-07-01 | flood rain | 0 |
| 2023-08-01 | storm | 0 |
| 2023-08-01 | hail | 0 |
| 2023-08-01 | flood rain | 0 |
| 2023-09-01 | storm | 0 |
| 2023-09-01 | hail | 0 |
| 2023-09-01 | flood rain | 0 |
| 2023-10-01 | storm | 0 |
| 2023-10-01 | hail | 1 |
| 2023-10-01 | flood rain | 0 |
| 2023-11-01 | storm | 0 |
| 2023-11-01 | hail | 0 |
| 2023-11-01 | flood rain | 0 |
| 2023-12-01 | storm | 0 |
| 2023-12-01 | hail | 0 |
| 2023-12-01 | flood rain | 0 |
| 2024-01-01 | storm | 0 |
| 2024-01-01 | hail | 0 |
| 2024-01-01 | flood rain | 0 |
| 2024-02-01 | storm | 0 |
| 2024-02-01 | hail | 0 |
| 2024-02-01 | flood rain | 0 |
| 2024-03-01 | storm | 1 |
| 2024-03-01 | hail | 0 |
| 2024-03-01 | flood rain | 0 |
| 2024-04-01 | storm | 0 |
| 2024-04-01 | hail | 0 |
| 2024-04-01 | flood rain | 0 |
| 2024-05-01 | storm | 0 |
| 2024-05-01 | hail | 0 |
| 2024-05-01 | flood rain | 0 |
| 2024-06-01 | storm | 0 |
| 2024-06-01 | hail | 0 |
| 2024-06-01 | flood rain | 0 |
| 2024-07-01 | storm | 0 |
| 2024-07-01 | hail | 0 |
| 2024-07-01 | flood rain | 0 |
| 2024-08-01 | storm | 0 |
| 2024-08-01 | hail | 0 |
| 2024-08-01 | flood rain | 0 |
| 2024-09-01 | storm | 0 |
| 2024-09-01 | hail | 0 |
| 2024-09-01 | flood rain | 0 |
| 2024-10-01 | storm | 0 |
| 2024-10-01 | hail | 0 |
| 2024-10-01 | flood rain | 0 |
| 2024-11-01 | storm | 0 |
| 2024-11-01 | hail | 1 |
| 2024-11-01 | flood rain | 0 |
| 2024-12-01 | storm | 0 |
| 2024-12-01 | hail | 0 |
| 2024-12-01 | flood rain | 0 |
| 2025-01-01 | storm | 0 |
| 2025-01-01 | hail | 0 |
| 2025-01-01 | flood rain | 0 |
| 2025-02-01 | storm | 0 |
| 2025-02-01 | hail | 0 |
| 2025-02-01 | flood rain | 1 |
| 2025-03-01 | storm | 0 |
| 2025-03-01 | hail | 0 |
| 2025-03-01 | flood rain | 0 |
| 2025-04-01 | storm | 0 |
| 2025-04-01 | hail | 0 |
| 2025-04-01 | flood rain | 0 |
| 2025-05-01 | storm | 0 |
| 2025-05-01 | hail | 0 |
| 2025-05-01 | flood rain | 0 |
| 2025-06-01 | storm | 0 |
| 2025-06-01 | hail | 0 |
| 2025-06-01 | flood rain | 0 |
| 2025-07-01 | storm | 0 |
| 2025-07-01 | hail | 0 |
| 2025-07-01 | flood rain | 0 |
| 2025-08-01 | storm | 0 |
| 2025-08-01 | hail | 0 |
| 2025-08-01 | flood rain | 0 |
| 2025-09-01 | storm | 0 |
| 2025-09-01 | hail | 0 |
| 2025-09-01 | flood rain | 0 |
| 2025-10-01 | storm | 0 |
| 2025-10-01 | hail | 0 |
| 2025-10-01 | flood rain | 0 |
| 2025-11-01 | storm | 0 |
| 2025-11-01 | hail | 0 |
| 2025-11-01 | flood rain | 0 |
| 2025-12-01 | storm | 1 |
| 2025-12-01 | hail | 0 |
| 2025-12-01 | flood rain | 0 |
| 2026-01-01 | storm | 0 |
| 2026-01-01 | hail | 1 |
| 2026-01-01 | flood rain | 0 |
| 2026-02-01 | storm | 0 |
| 2026-02-01 | hail | 0 |
| 2026-02-01 | flood rain | 0 |
| 2026-03-01 | storm | 1 |
| 2026-03-01 | hail | 0 |
| 2026-03-01 | flood rain | 0 |
Figure 27. Hot spot analysis: Claims 68
| bin_start | bin_end | band | band_label | count |
|---|---|---|---|---|
| -1 | -0.5 | not_significant | Not significant | 37 |
| -0.5 | 0 | not_significant | Not significant | 115 |
| 0 | 0.5 | not_significant | Not significant | 27 |
| 0.5 | 1 | not_significant | Not significant | 14 |
| 1 | 1.5 | not_significant | Not significant | 3 |
| 1.5 | 2 | hot_90 | Hot spot, 90% confidence | 3 |
| 1.5 | 2 | not_significant | Not significant | 1 |
| 2 | 2.5 | hot_95 | Hot spot, 95% confidence | 2 |
| 2.5 | 3 | hot_99 | Hot spot, 99% confidence | 1 |
| 3 | 3.5 | hot_99 | Hot spot, 99% confidence | 1 |
| 5 | 5.5 | hot_99 | Hot spot, 99% confidence | 1 |
| 6 | 6.5 | hot_99 | Hot spot, 99% confidence | 1 |
| 7.5 | 8 | hot_99 | Hot spot, 99% confidence | 1 |
Figure 28. Hot spot analysis: Insured properties 69
| bin_start | bin_end | band | band_label | count |
|---|---|---|---|---|
| -1 | -0.5 | not_significant | Not significant | 34 |
| -0.5 | 0 | not_significant | Not significant | 94 |
| 0 | 0.5 | not_significant | Not significant | 63 |
| 0.5 | 1 | not_significant | Not significant | 10 |
| 1 | 1.5 | not_significant | Not significant | 1 |
| 2 | 2.5 | hot_95 | Hot spot, 95% confidence | 2 |
| 2.5 | 3 | hot_99 | Hot spot, 99% confidence | 1 |
| 4.5 | 5 | hot_99 | Hot spot, 99% confidence | 1 |
| 5 | 5.5 | hot_99 | Hot spot, 99% confidence | 1 |
| 10.5 | 11 | hot_99 | Hot spot, 99% confidence | 1 |
Figure 29. Hot spot analysis: Storm and hail footprints 70
| bin_start | bin_end | band | band_label | count |
|---|---|---|---|---|
| -2 | -1.5 | cold_90 | Cold spot, 90% confidence | 1 |
| -1.5 | -1 | not_significant | Not significant | 1 |
| -1 | -0.5 | not_significant | Not significant | 2 |
| -0.5 | 0 | not_significant | Not significant | 2 |
| 0 | 0.5 | not_significant | Not significant | 2 |
Figure 30. Emerging hot spots: Claims 71
| bin_start | bin_end | count |
|---|---|---|
| -0.294 | -0.2607 | 60 |
| -0.2607 | -0.2275 | 1 |
| -0.2275 | -0.1943 | 0 |
| -0.1943 | -0.161 | 0 |
| -0.161 | -0.1278 | 0 |
| -0.1278 | -0.0945 | 0 |
| -0.0945 | -0.06125 | 0 |
| -0.06125 | -0.028 | 7 |
Figure 31. Repeat and near repeat classification: Claims 72
| period | series | value |
|---|---|---|
| 2022-01-01 | hail | 7 |
| 2022-01-01 | flood | 0 |
| 2022-01-01 | storm | 12 |
| 2022-01-01 | water damage | 12 |
| 2022-01-01 | theft | 4 |
| 2022-01-01 | Other | 2 |
| 2022-04-01 | hail | 4 |
| 2022-04-01 | flood | 0 |
| 2022-04-01 | storm | 6 |
| 2022-04-01 | water damage | 10 |
| 2022-04-01 | theft | 0 |
| 2022-04-01 | Other | 2 |
| 2022-07-01 | hail | 2 |
| 2022-07-01 | flood | 0 |
| 2022-07-01 | storm | 4 |
| 2022-07-01 | water damage | 5 |
| 2022-07-01 | theft | 3 |
| 2022-07-01 | Other | 1 |
| 2022-10-01 | hail | 3 |
| 2022-10-01 | flood | 0 |
| 2022-10-01 | storm | 7 |
| 2022-10-01 | water damage | 11 |
| 2022-10-01 | theft | 2 |
| 2022-10-01 | Other | 3 |
| 2023-01-01 | hail | 11 |
| 2023-01-01 | flood | 0 |
| 2023-01-01 | storm | 16 |
| 2023-01-01 | water damage | 9 |
| 2023-01-01 | theft | 7 |
| 2023-01-01 | Other | 2 |
| 2023-04-01 | hail | 1 |
| 2023-04-01 | flood | 0 |
| 2023-04-01 | storm | 5 |
| 2023-04-01 | water damage | 11 |
| 2023-04-01 | theft | 4 |
| 2023-04-01 | Other | 1 |
| 2023-07-01 | hail | 2 |
| 2023-07-01 | flood | 0 |
| 2023-07-01 | storm | 8 |
| 2023-07-01 | water damage | 7 |
| 2023-07-01 | theft | 2 |
| 2023-07-01 | Other | 0 |
| 2023-10-01 | hail | 11 |
| 2023-10-01 | flood | 0 |
| 2023-10-01 | storm | 22 |
| 2023-10-01 | water damage | 9 |
| 2023-10-01 | theft | 2 |
| 2023-10-01 | Other | 2 |
| 2024-01-01 | hail | 6 |
| 2024-01-01 | flood | 0 |
| 2024-01-01 | storm | 11 |
| 2024-01-01 | water damage | 14 |
| 2024-01-01 | theft | 4 |
| 2024-01-01 | Other | 2 |
| 2024-04-01 | hail | 3 |
| 2024-04-01 | flood | 0 |
| 2024-04-01 | storm | 7 |
| 2024-04-01 | water damage | 6 |
| 2024-04-01 | theft | 4 |
| 2024-04-01 | Other | 0 |
| 2024-07-01 | hail | 2 |
| 2024-07-01 | flood | 0 |
| 2024-07-01 | storm | 5 |
| 2024-07-01 | water damage | 4 |
| 2024-07-01 | theft | 6 |
| 2024-07-01 | Other | 0 |
| 2024-10-01 | hail | 155 |
| 2024-10-01 | flood | 0 |
| 2024-10-01 | storm | 11 |
| 2024-10-01 | water damage | 9 |
| 2024-10-01 | theft | 4 |
| 2024-10-01 | Other | 2 |
| 2025-01-01 | hail | 8 |
| 2025-01-01 | flood | 230 |
| 2025-01-01 | storm | 12 |
| 2025-01-01 | water damage | 8 |
| 2025-01-01 | theft | 4 |
| 2025-01-01 | Other | 4 |
| 2025-04-01 | hail | 6 |
| 2025-04-01 | flood | 0 |
| 2025-04-01 | storm | 7 |
| 2025-04-01 | water damage | 4 |
| 2025-04-01 | theft | 1 |
| 2025-04-01 | Other | 0 |
| 2025-07-01 | hail | 3 |
| 2025-07-01 | flood | 0 |
| 2025-07-01 | storm | 7 |
| 2025-07-01 | water damage | 5 |
| 2025-07-01 | theft | 6 |
| 2025-07-01 | Other | 2 |
| 2025-10-01 | hail | 6 |
| 2025-10-01 | flood | 0 |
| 2025-10-01 | storm | 9 |
| 2025-10-01 | water damage | 10 |
| 2025-10-01 | theft | 11 |
| 2025-10-01 | Other | 4 |
| 2026-01-01 | hail | 5 |
| 2026-01-01 | flood | 0 |
| 2026-01-01 | storm | 13 |
| 2026-01-01 | water damage | 14 |
| 2026-01-01 | theft | 3 |
| 2026-01-01 | Other | 1 |
| 2026-04-01 | hail | 1 |
| 2026-04-01 | flood | 0 |
| 2026-04-01 | storm | 9 |
| 2026-04-01 | water damage | 8 |
| 2026-04-01 | theft | 3 |
| 2026-04-01 | Other | 0 |
| 2026-07-01 | hail | 1 |
| 2026-07-01 | flood | 0 |
| 2026-07-01 | storm | 5 |
| 2026-07-01 | water damage | 3 |
| 2026-07-01 | theft | 0 |
| 2026-07-01 | Other | 0 |
Figure 32. Calculate density: Claims 73
| bin_start | bin_end | count |
|---|---|---|
| 0 | 3.583 | 100 |
| 3.583 | 7.167 | 126 |
| 7.167 | 10.75 | 98 |
| 10.75 | 14.33 | 129 |
| 14.33 | 17.92 | 91 |
| 17.92 | 21.5 | 130 |
| 21.5 | 25.08 | 124 |
| 25.08 | 28.67 | 93 |
| 28.67 | 32.25 | 127 |
| 32.25 | 35.83 | 93 |
| 35.83 | 39.42 | 129 |
| 39.42 | 43 | 94 |
Figure 33. Calculate density: Insured properties 74
| bin_start | bin_end | count |
|---|---|---|
| 0 | 3.583 | 112 |
| 3.583 | 7.167 | 134 |
| 7.167 | 10.75 | 101 |
| 10.75 | 14.33 | 133 |
| 14.33 | 17.92 | 100 |
| 17.92 | 21.5 | 136 |
| 21.5 | 25.08 | 134 |
| 25.08 | 28.67 | 99 |
| 28.67 | 32.25 | 132 |
| 32.25 | 35.83 | 97 |
| 35.83 | 39.42 | 131 |
| 39.42 | 43 | 112 |
Figure 34. Find point clusters: Claims 75
| cluster | features | fraction | share |
|---|---|---|---|
| Noise | 659 | 0.7322 | 73.2% |
| 0 | 220 | 0.2444 | 24.4% |
| 1 | 21 | 0.02333 | 2.3% |
Figure 35. Find point clusters: cluster hulls 76
| cluster | features | fraction | share |
|---|---|---|---|
| 0 | 1 | 0.5 | 50.0% |
| 1 | 1 | 0.5 | 50.0% |
Figure 36. Find point clusters: Insured properties 77
| cluster | features | fraction | share |
|---|---|---|---|
| Noise | 1,134 | 0.81 | 81.0% |
| 0 | 266 | 0.19 | 19.0% |
Figure 37. Find point clusters: cluster hulls 78
| cluster | features | fraction | share |
|---|---|---|---|
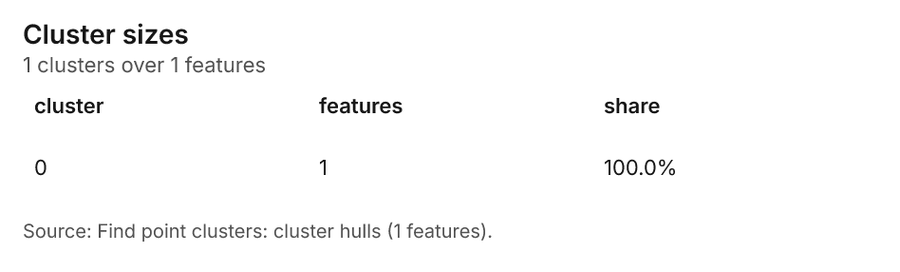
| 0 | 1 | 1 | 100.0% |
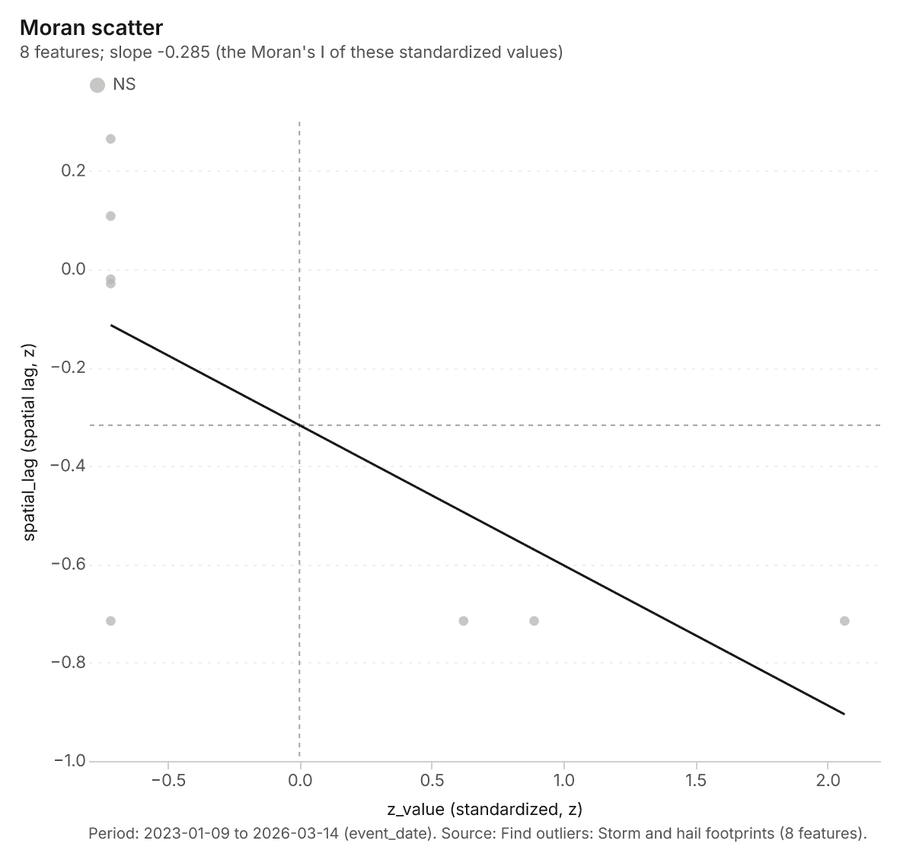
Figure 38. Find outliers: Storm and hail footprints 79
| value | lag | type |
|---|---|---|
| -0.7152 | 0.2651 | NS |
| 2.065 | -0.7152 | NS |
| -0.7152 | -0.7152 | NS |
| 0.6216 | -0.7152 | NS |
| -0.7152 | -0.029 | NS |
| -0.7152 | -0.0201 | NS |
| 0.889 | -0.7152 | NS |
| -0.7152 | 0.1083 | NS |
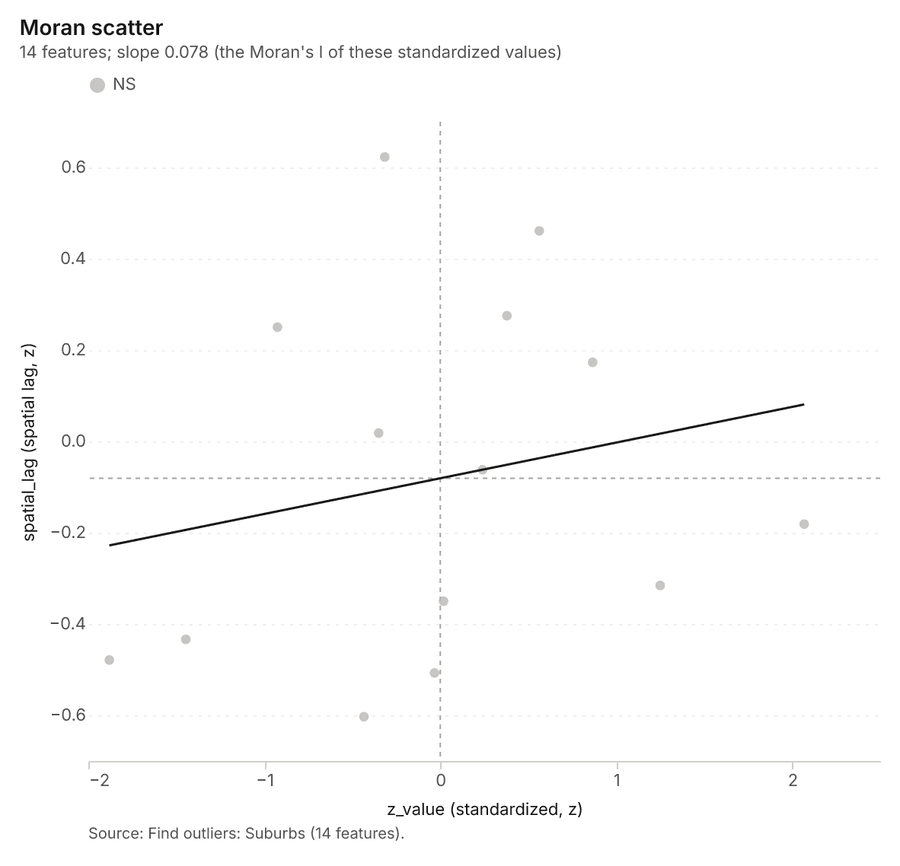
Figure 39. Find outliers: Suburbs 80
| value | lag | type |
|---|---|---|
| -0.0327 | -0.5072 | NS |
| -0.9251 | 0.2501 | NS |
| 0.0182 | -0.35 | NS |
| 0.24 | -0.0622 | NS |
| -0.35 | 0.0182 | NS |
| -0.3156 | 0.6228 | NS |
| -0.4337 | -0.603 | NS |
| 0.866 | 0.1731 | NS |
| 2.068 | -0.1812 | NS |
| -1.88 | -0.4789 | NS |
| 0.5628 | 0.461 | NS |
| -1.446 | -0.4337 | NS |
| 1.25 | -0.3156 | NS |
| 0.3788 | 0.2752 | NS |
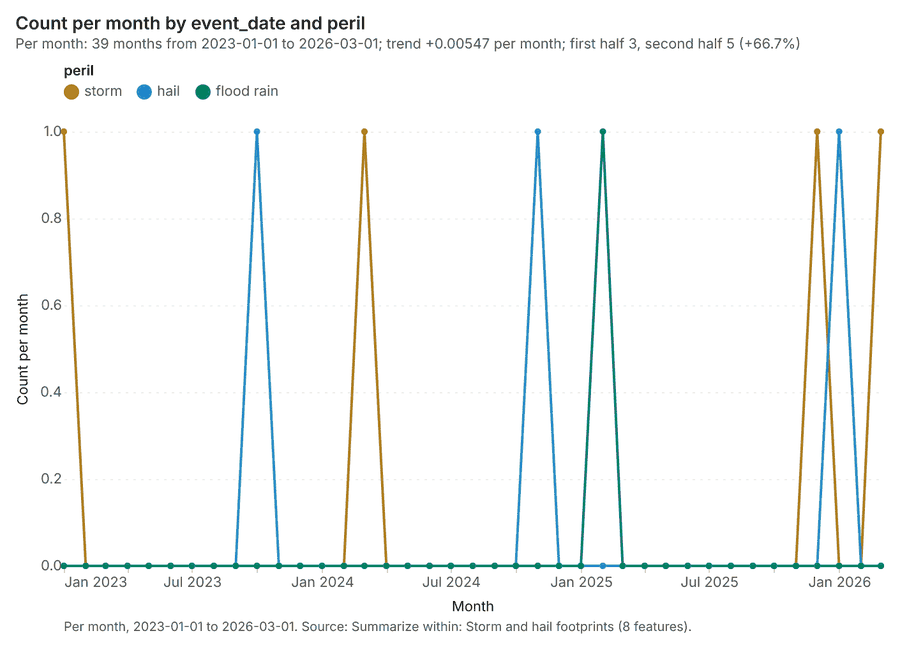
Figure 40. Summarize within: Storm and hail footprints 81
| period | series | value |
|---|---|---|
| 2023-01-01 | storm | 1 |
| 2023-01-01 | hail | 0 |
| 2023-01-01 | flood rain | 0 |
| 2023-02-01 | storm | 0 |
| 2023-02-01 | hail | 0 |
| 2023-02-01 | flood rain | 0 |
| 2023-03-01 | storm | 0 |
| 2023-03-01 | hail | 0 |
| 2023-03-01 | flood rain | 0 |
| 2023-04-01 | storm | 0 |
| 2023-04-01 | hail | 0 |
| 2023-04-01 | flood rain | 0 |
| 2023-05-01 | storm | 0 |
| 2023-05-01 | hail | 0 |
| 2023-05-01 | flood rain | 0 |
| 2023-06-01 | storm | 0 |
| 2023-06-01 | hail | 0 |
| 2023-06-01 | flood rain | 0 |
| 2023-07-01 | storm | 0 |
| 2023-07-01 | hail | 0 |
| 2023-07-01 | flood rain | 0 |
| 2023-08-01 | storm | 0 |
| 2023-08-01 | hail | 0 |
| 2023-08-01 | flood rain | 0 |
| 2023-09-01 | storm | 0 |
| 2023-09-01 | hail | 0 |
| 2023-09-01 | flood rain | 0 |
| 2023-10-01 | storm | 0 |
| 2023-10-01 | hail | 1 |
| 2023-10-01 | flood rain | 0 |
| 2023-11-01 | storm | 0 |
| 2023-11-01 | hail | 0 |
| 2023-11-01 | flood rain | 0 |
| 2023-12-01 | storm | 0 |
| 2023-12-01 | hail | 0 |
| 2023-12-01 | flood rain | 0 |
| 2024-01-01 | storm | 0 |
| 2024-01-01 | hail | 0 |
| 2024-01-01 | flood rain | 0 |
| 2024-02-01 | storm | 0 |
| 2024-02-01 | hail | 0 |
| 2024-02-01 | flood rain | 0 |
| 2024-03-01 | storm | 1 |
| 2024-03-01 | hail | 0 |
| 2024-03-01 | flood rain | 0 |
| 2024-04-01 | storm | 0 |
| 2024-04-01 | hail | 0 |
| 2024-04-01 | flood rain | 0 |
| 2024-05-01 | storm | 0 |
| 2024-05-01 | hail | 0 |
| 2024-05-01 | flood rain | 0 |
| 2024-06-01 | storm | 0 |
| 2024-06-01 | hail | 0 |
| 2024-06-01 | flood rain | 0 |
| 2024-07-01 | storm | 0 |
| 2024-07-01 | hail | 0 |
| 2024-07-01 | flood rain | 0 |
| 2024-08-01 | storm | 0 |
| 2024-08-01 | hail | 0 |
| 2024-08-01 | flood rain | 0 |
| 2024-09-01 | storm | 0 |
| 2024-09-01 | hail | 0 |
| 2024-09-01 | flood rain | 0 |
| 2024-10-01 | storm | 0 |
| 2024-10-01 | hail | 0 |
| 2024-10-01 | flood rain | 0 |
| 2024-11-01 | storm | 0 |
| 2024-11-01 | hail | 1 |
| 2024-11-01 | flood rain | 0 |
| 2024-12-01 | storm | 0 |
| 2024-12-01 | hail | 0 |
| 2024-12-01 | flood rain | 0 |
| 2025-01-01 | storm | 0 |
| 2025-01-01 | hail | 0 |
| 2025-01-01 | flood rain | 0 |
| 2025-02-01 | storm | 0 |
| 2025-02-01 | hail | 0 |
| 2025-02-01 | flood rain | 1 |
| 2025-03-01 | storm | 0 |
| 2025-03-01 | hail | 0 |
| 2025-03-01 | flood rain | 0 |
| 2025-04-01 | storm | 0 |
| 2025-04-01 | hail | 0 |
| 2025-04-01 | flood rain | 0 |
| 2025-05-01 | storm | 0 |
| 2025-05-01 | hail | 0 |
| 2025-05-01 | flood rain | 0 |
| 2025-06-01 | storm | 0 |
| 2025-06-01 | hail | 0 |
| 2025-06-01 | flood rain | 0 |
| 2025-07-01 | storm | 0 |
| 2025-07-01 | hail | 0 |
| 2025-07-01 | flood rain | 0 |
| 2025-08-01 | storm | 0 |
| 2025-08-01 | hail | 0 |
| 2025-08-01 | flood rain | 0 |
| 2025-09-01 | storm | 0 |
| 2025-09-01 | hail | 0 |
| 2025-09-01 | flood rain | 0 |
| 2025-10-01 | storm | 0 |
| 2025-10-01 | hail | 0 |
| 2025-10-01 | flood rain | 0 |
| 2025-11-01 | storm | 0 |
| 2025-11-01 | hail | 0 |
| 2025-11-01 | flood rain | 0 |
| 2025-12-01 | storm | 1 |
| 2025-12-01 | hail | 0 |
| 2025-12-01 | flood rain | 0 |
| 2026-01-01 | storm | 0 |
| 2026-01-01 | hail | 1 |
| 2026-01-01 | flood rain | 0 |
| 2026-02-01 | storm | 0 |
| 2026-02-01 | hail | 0 |
| 2026-02-01 | flood rain | 0 |
| 2026-03-01 | storm | 1 |
| 2026-03-01 | hail | 0 |
| 2026-03-01 | flood rain | 0 |
Figure 41. Summarize within: Storm and hail footprints over time 82
| period | series | value |
|---|---|---|
| 2023-01-01 | storm | 1 |
| 2023-01-01 | hail | 0 |
| 2023-01-01 | flood rain | 0 |
| 2023-02-01 | storm | 0 |
| 2023-02-01 | hail | 0 |
| 2023-02-01 | flood rain | 0 |
| 2023-03-01 | storm | 0 |
| 2023-03-01 | hail | 0 |
| 2023-03-01 | flood rain | 0 |
| 2023-04-01 | storm | 0 |
| 2023-04-01 | hail | 0 |
| 2023-04-01 | flood rain | 0 |
| 2023-05-01 | storm | 0 |
| 2023-05-01 | hail | 0 |
| 2023-05-01 | flood rain | 0 |
| 2023-06-01 | storm | 0 |
| 2023-06-01 | hail | 0 |
| 2023-06-01 | flood rain | 0 |
| 2023-07-01 | storm | 0 |
| 2023-07-01 | hail | 0 |
| 2023-07-01 | flood rain | 0 |
| 2023-08-01 | storm | 0 |
| 2023-08-01 | hail | 0 |
| 2023-08-01 | flood rain | 0 |
| 2023-09-01 | storm | 0 |
| 2023-09-01 | hail | 0 |
| 2023-09-01 | flood rain | 0 |
| 2023-10-01 | storm | 0 |
| 2023-10-01 | hail | 1 |
| 2023-10-01 | flood rain | 0 |
| 2023-11-01 | storm | 0 |
| 2023-11-01 | hail | 0 |
| 2023-11-01 | flood rain | 0 |
| 2023-12-01 | storm | 0 |
| 2023-12-01 | hail | 0 |
| 2023-12-01 | flood rain | 0 |
| 2024-01-01 | storm | 0 |
| 2024-01-01 | hail | 0 |
| 2024-01-01 | flood rain | 0 |
| 2024-02-01 | storm | 0 |
| 2024-02-01 | hail | 0 |
| 2024-02-01 | flood rain | 0 |
| 2024-03-01 | storm | 1 |
| 2024-03-01 | hail | 0 |
| 2024-03-01 | flood rain | 0 |
| 2024-04-01 | storm | 0 |
| 2024-04-01 | hail | 0 |
| 2024-04-01 | flood rain | 0 |
| 2024-05-01 | storm | 0 |
| 2024-05-01 | hail | 0 |
| 2024-05-01 | flood rain | 0 |
| 2024-06-01 | storm | 0 |
| 2024-06-01 | hail | 0 |
| 2024-06-01 | flood rain | 0 |
| 2024-07-01 | storm | 0 |
| 2024-07-01 | hail | 0 |
| 2024-07-01 | flood rain | 0 |
| 2024-08-01 | storm | 0 |
| 2024-08-01 | hail | 0 |
| 2024-08-01 | flood rain | 0 |
| 2024-09-01 | storm | 0 |
| 2024-09-01 | hail | 0 |
| 2024-09-01 | flood rain | 0 |
| 2024-10-01 | storm | 0 |
| 2024-10-01 | hail | 0 |
| 2024-10-01 | flood rain | 0 |
| 2024-11-01 | storm | 0 |
| 2024-11-01 | hail | 1 |
| 2024-11-01 | flood rain | 0 |
| 2024-12-01 | storm | 0 |
| 2024-12-01 | hail | 0 |
| 2024-12-01 | flood rain | 0 |
| 2025-01-01 | storm | 0 |
| 2025-01-01 | hail | 0 |
| 2025-01-01 | flood rain | 0 |
| 2025-02-01 | storm | 0 |
| 2025-02-01 | hail | 0 |
| 2025-02-01 | flood rain | 1 |
| 2025-03-01 | storm | 0 |
| 2025-03-01 | hail | 0 |
| 2025-03-01 | flood rain | 0 |
| 2025-04-01 | storm | 0 |
| 2025-04-01 | hail | 0 |
| 2025-04-01 | flood rain | 0 |
| 2025-05-01 | storm | 0 |
| 2025-05-01 | hail | 0 |
| 2025-05-01 | flood rain | 0 |
| 2025-06-01 | storm | 0 |
| 2025-06-01 | hail | 0 |
| 2025-06-01 | flood rain | 0 |
| 2025-07-01 | storm | 0 |
| 2025-07-01 | hail | 0 |
| 2025-07-01 | flood rain | 0 |
| 2025-08-01 | storm | 0 |
| 2025-08-01 | hail | 0 |
| 2025-08-01 | flood rain | 0 |
| 2025-09-01 | storm | 0 |
| 2025-09-01 | hail | 0 |
| 2025-09-01 | flood rain | 0 |
| 2025-10-01 | storm | 0 |
| 2025-10-01 | hail | 0 |
| 2025-10-01 | flood rain | 0 |
| 2025-11-01 | storm | 0 |
| 2025-11-01 | hail | 0 |
| 2025-11-01 | flood rain | 0 |
| 2025-12-01 | storm | 1 |
| 2025-12-01 | hail | 0 |
| 2025-12-01 | flood rain | 0 |
| 2026-01-01 | storm | 0 |
| 2026-01-01 | hail | 1 |
| 2026-01-01 | flood rain | 0 |
| 2026-02-01 | storm | 0 |
| 2026-02-01 | hail | 0 |
| 2026-02-01 | flood rain | 0 |
| 2026-03-01 | storm | 1 |
| 2026-03-01 | hail | 0 |
| 2026-03-01 | flood rain | 0 |
Figure 42. Find outliers: Storm and hail footprints over time 83
| period | series | value |
|---|---|---|
| 2023-01-01 | storm | 1 |
| 2023-01-01 | hail | 0 |
| 2023-01-01 | flood rain | 0 |
| 2023-02-01 | storm | 0 |
| 2023-02-01 | hail | 0 |
| 2023-02-01 | flood rain | 0 |
| 2023-03-01 | storm | 0 |
| 2023-03-01 | hail | 0 |
| 2023-03-01 | flood rain | 0 |
| 2023-04-01 | storm | 0 |
| 2023-04-01 | hail | 0 |
| 2023-04-01 | flood rain | 0 |
| 2023-05-01 | storm | 0 |
| 2023-05-01 | hail | 0 |
| 2023-05-01 | flood rain | 0 |
| 2023-06-01 | storm | 0 |
| 2023-06-01 | hail | 0 |
| 2023-06-01 | flood rain | 0 |
| 2023-07-01 | storm | 0 |
| 2023-07-01 | hail | 0 |
| 2023-07-01 | flood rain | 0 |
| 2023-08-01 | storm | 0 |
| 2023-08-01 | hail | 0 |
| 2023-08-01 | flood rain | 0 |
| 2023-09-01 | storm | 0 |
| 2023-09-01 | hail | 0 |
| 2023-09-01 | flood rain | 0 |
| 2023-10-01 | storm | 0 |
| 2023-10-01 | hail | 1 |
| 2023-10-01 | flood rain | 0 |
| 2023-11-01 | storm | 0 |
| 2023-11-01 | hail | 0 |
| 2023-11-01 | flood rain | 0 |
| 2023-12-01 | storm | 0 |
| 2023-12-01 | hail | 0 |
| 2023-12-01 | flood rain | 0 |
| 2024-01-01 | storm | 0 |
| 2024-01-01 | hail | 0 |
| 2024-01-01 | flood rain | 0 |
| 2024-02-01 | storm | 0 |
| 2024-02-01 | hail | 0 |
| 2024-02-01 | flood rain | 0 |
| 2024-03-01 | storm | 1 |
| 2024-03-01 | hail | 0 |
| 2024-03-01 | flood rain | 0 |
| 2024-04-01 | storm | 0 |
| 2024-04-01 | hail | 0 |
| 2024-04-01 | flood rain | 0 |
| 2024-05-01 | storm | 0 |
| 2024-05-01 | hail | 0 |
| 2024-05-01 | flood rain | 0 |
| 2024-06-01 | storm | 0 |
| 2024-06-01 | hail | 0 |
| 2024-06-01 | flood rain | 0 |
| 2024-07-01 | storm | 0 |
| 2024-07-01 | hail | 0 |
| 2024-07-01 | flood rain | 0 |
| 2024-08-01 | storm | 0 |
| 2024-08-01 | hail | 0 |
| 2024-08-01 | flood rain | 0 |
| 2024-09-01 | storm | 0 |
| 2024-09-01 | hail | 0 |
| 2024-09-01 | flood rain | 0 |
| 2024-10-01 | storm | 0 |
| 2024-10-01 | hail | 0 |
| 2024-10-01 | flood rain | 0 |
| 2024-11-01 | storm | 0 |
| 2024-11-01 | hail | 1 |
| 2024-11-01 | flood rain | 0 |
| 2024-12-01 | storm | 0 |
| 2024-12-01 | hail | 0 |
| 2024-12-01 | flood rain | 0 |
| 2025-01-01 | storm | 0 |
| 2025-01-01 | hail | 0 |
| 2025-01-01 | flood rain | 0 |
| 2025-02-01 | storm | 0 |
| 2025-02-01 | hail | 0 |
| 2025-02-01 | flood rain | 1 |
| 2025-03-01 | storm | 0 |
| 2025-03-01 | hail | 0 |
| 2025-03-01 | flood rain | 0 |
| 2025-04-01 | storm | 0 |
| 2025-04-01 | hail | 0 |
| 2025-04-01 | flood rain | 0 |
| 2025-05-01 | storm | 0 |
| 2025-05-01 | hail | 0 |
| 2025-05-01 | flood rain | 0 |
| 2025-06-01 | storm | 0 |
| 2025-06-01 | hail | 0 |
| 2025-06-01 | flood rain | 0 |
| 2025-07-01 | storm | 0 |
| 2025-07-01 | hail | 0 |
| 2025-07-01 | flood rain | 0 |
| 2025-08-01 | storm | 0 |
| 2025-08-01 | hail | 0 |
| 2025-08-01 | flood rain | 0 |
| 2025-09-01 | storm | 0 |
| 2025-09-01 | hail | 0 |
| 2025-09-01 | flood rain | 0 |
| 2025-10-01 | storm | 0 |
| 2025-10-01 | hail | 0 |
| 2025-10-01 | flood rain | 0 |
| 2025-11-01 | storm | 0 |
| 2025-11-01 | hail | 0 |
| 2025-11-01 | flood rain | 0 |
| 2025-12-01 | storm | 1 |
| 2025-12-01 | hail | 0 |
| 2025-12-01 | flood rain | 0 |
| 2026-01-01 | storm | 0 |
| 2026-01-01 | hail | 1 |
| 2026-01-01 | flood rain | 0 |
| 2026-02-01 | storm | 0 |
| 2026-02-01 | hail | 0 |
| 2026-02-01 | flood rain | 0 |
| 2026-03-01 | storm | 1 |
| 2026-03-01 | hail | 0 |
| 2026-03-01 | flood rain | 0 |
Figure 43. Find point clusters: Claims over time 84
| period | series | value |
|---|---|---|
| 2022-01-01 | hail | 7 |
| 2022-01-01 | flood | 0 |
| 2022-01-01 | storm | 12 |
| 2022-01-01 | water damage | 12 |
| 2022-01-01 | theft | 4 |
| 2022-01-01 | Other | 2 |
| 2022-04-01 | hail | 4 |
| 2022-04-01 | flood | 0 |
| 2022-04-01 | storm | 6 |
| 2022-04-01 | water damage | 10 |
| 2022-04-01 | theft | 0 |
| 2022-04-01 | Other | 2 |
| 2022-07-01 | hail | 2 |
| 2022-07-01 | flood | 0 |
| 2022-07-01 | storm | 4 |
| 2022-07-01 | water damage | 5 |
| 2022-07-01 | theft | 3 |
| 2022-07-01 | Other | 1 |
| 2022-10-01 | hail | 3 |
| 2022-10-01 | flood | 0 |
| 2022-10-01 | storm | 7 |
| 2022-10-01 | water damage | 11 |
| 2022-10-01 | theft | 2 |
| 2022-10-01 | Other | 3 |
| 2023-01-01 | hail | 11 |
| 2023-01-01 | flood | 0 |
| 2023-01-01 | storm | 16 |
| 2023-01-01 | water damage | 9 |
| 2023-01-01 | theft | 7 |
| 2023-01-01 | Other | 2 |
| 2023-04-01 | hail | 1 |
| 2023-04-01 | flood | 0 |
| 2023-04-01 | storm | 5 |
| 2023-04-01 | water damage | 11 |
| 2023-04-01 | theft | 4 |
| 2023-04-01 | Other | 1 |
| 2023-07-01 | hail | 2 |
| 2023-07-01 | flood | 0 |
| 2023-07-01 | storm | 8 |
| 2023-07-01 | water damage | 7 |
| 2023-07-01 | theft | 2 |
| 2023-07-01 | Other | 0 |
| 2023-10-01 | hail | 11 |
| 2023-10-01 | flood | 0 |
| 2023-10-01 | storm | 22 |
| 2023-10-01 | water damage | 9 |
| 2023-10-01 | theft | 2 |
| 2023-10-01 | Other | 2 |
| 2024-01-01 | hail | 6 |
| 2024-01-01 | flood | 0 |
| 2024-01-01 | storm | 11 |
| 2024-01-01 | water damage | 14 |
| 2024-01-01 | theft | 4 |
| 2024-01-01 | Other | 2 |
| 2024-04-01 | hail | 3 |
| 2024-04-01 | flood | 0 |
| 2024-04-01 | storm | 7 |
| 2024-04-01 | water damage | 6 |
| 2024-04-01 | theft | 4 |
| 2024-04-01 | Other | 0 |
| 2024-07-01 | hail | 2 |
| 2024-07-01 | flood | 0 |
| 2024-07-01 | storm | 5 |
| 2024-07-01 | water damage | 4 |
| 2024-07-01 | theft | 6 |
| 2024-07-01 | Other | 0 |
| 2024-10-01 | hail | 155 |
| 2024-10-01 | flood | 0 |
| 2024-10-01 | storm | 11 |
| 2024-10-01 | water damage | 9 |
| 2024-10-01 | theft | 4 |
| 2024-10-01 | Other | 2 |
| 2025-01-01 | hail | 8 |
| 2025-01-01 | flood | 230 |
| 2025-01-01 | storm | 12 |
| 2025-01-01 | water damage | 8 |
| 2025-01-01 | theft | 4 |
| 2025-01-01 | Other | 4 |
| 2025-04-01 | hail | 6 |
| 2025-04-01 | flood | 0 |
| 2025-04-01 | storm | 7 |
| 2025-04-01 | water damage | 4 |
| 2025-04-01 | theft | 1 |
| 2025-04-01 | Other | 0 |
| 2025-07-01 | hail | 3 |
| 2025-07-01 | flood | 0 |
| 2025-07-01 | storm | 7 |
| 2025-07-01 | water damage | 5 |
| 2025-07-01 | theft | 6 |
| 2025-07-01 | Other | 2 |
| 2025-10-01 | hail | 6 |
| 2025-10-01 | flood | 0 |
| 2025-10-01 | storm | 9 |
| 2025-10-01 | water damage | 10 |
| 2025-10-01 | theft | 11 |
| 2025-10-01 | Other | 4 |
| 2026-01-01 | hail | 5 |
| 2026-01-01 | flood | 0 |
| 2026-01-01 | storm | 13 |
| 2026-01-01 | water damage | 14 |
| 2026-01-01 | theft | 3 |
| 2026-01-01 | Other | 1 |
| 2026-04-01 | hail | 1 |
| 2026-04-01 | flood | 0 |
| 2026-04-01 | storm | 9 |
| 2026-04-01 | water damage | 8 |
| 2026-04-01 | theft | 3 |
| 2026-04-01 | Other | 0 |
| 2026-07-01 | hail | 1 |
| 2026-07-01 | flood | 0 |
| 2026-07-01 | storm | 5 |
| 2026-07-01 | water damage | 3 |
| 2026-07-01 | theft | 0 |
| 2026-07-01 | Other | 0 |
Figure 44. Repeat and near repeat classification: Claims over time 85
| period | series | value |
|---|---|---|
| 2022-01-01 | hail | 7 |
| 2022-01-01 | flood | 0 |
| 2022-01-01 | storm | 12 |
| 2022-01-01 | water damage | 12 |
| 2022-01-01 | theft | 4 |
| 2022-01-01 | Other | 2 |
| 2022-04-01 | hail | 4 |
| 2022-04-01 | flood | 0 |
| 2022-04-01 | storm | 6 |
| 2022-04-01 | water damage | 10 |
| 2022-04-01 | theft | 0 |
| 2022-04-01 | Other | 2 |
| 2022-07-01 | hail | 2 |
| 2022-07-01 | flood | 0 |
| 2022-07-01 | storm | 4 |
| 2022-07-01 | water damage | 5 |
| 2022-07-01 | theft | 3 |
| 2022-07-01 | Other | 1 |
| 2022-10-01 | hail | 3 |
| 2022-10-01 | flood | 0 |
| 2022-10-01 | storm | 7 |
| 2022-10-01 | water damage | 11 |
| 2022-10-01 | theft | 2 |
| 2022-10-01 | Other | 3 |
| 2023-01-01 | hail | 11 |
| 2023-01-01 | flood | 0 |
| 2023-01-01 | storm | 16 |
| 2023-01-01 | water damage | 9 |
| 2023-01-01 | theft | 7 |
| 2023-01-01 | Other | 2 |
| 2023-04-01 | hail | 1 |
| 2023-04-01 | flood | 0 |
| 2023-04-01 | storm | 5 |
| 2023-04-01 | water damage | 11 |
| 2023-04-01 | theft | 4 |
| 2023-04-01 | Other | 1 |
| 2023-07-01 | hail | 2 |
| 2023-07-01 | flood | 0 |
| 2023-07-01 | storm | 8 |
| 2023-07-01 | water damage | 7 |
| 2023-07-01 | theft | 2 |
| 2023-07-01 | Other | 0 |
| 2023-10-01 | hail | 11 |
| 2023-10-01 | flood | 0 |
| 2023-10-01 | storm | 22 |
| 2023-10-01 | water damage | 9 |
| 2023-10-01 | theft | 2 |
| 2023-10-01 | Other | 2 |
| 2024-01-01 | hail | 6 |
| 2024-01-01 | flood | 0 |
| 2024-01-01 | storm | 11 |
| 2024-01-01 | water damage | 14 |
| 2024-01-01 | theft | 4 |
| 2024-01-01 | Other | 2 |
| 2024-04-01 | hail | 3 |
| 2024-04-01 | flood | 0 |
| 2024-04-01 | storm | 7 |
| 2024-04-01 | water damage | 6 |
| 2024-04-01 | theft | 4 |
| 2024-04-01 | Other | 0 |
| 2024-07-01 | hail | 2 |
| 2024-07-01 | flood | 0 |
| 2024-07-01 | storm | 5 |
| 2024-07-01 | water damage | 4 |
| 2024-07-01 | theft | 6 |
| 2024-07-01 | Other | 0 |
| 2024-10-01 | hail | 155 |
| 2024-10-01 | flood | 0 |
| 2024-10-01 | storm | 11 |
| 2024-10-01 | water damage | 9 |
| 2024-10-01 | theft | 4 |
| 2024-10-01 | Other | 2 |
| 2025-01-01 | hail | 8 |
| 2025-01-01 | flood | 230 |
| 2025-01-01 | storm | 12 |
| 2025-01-01 | water damage | 8 |
| 2025-01-01 | theft | 4 |
| 2025-01-01 | Other | 4 |
| 2025-04-01 | hail | 6 |
| 2025-04-01 | flood | 0 |
| 2025-04-01 | storm | 7 |
| 2025-04-01 | water damage | 4 |
| 2025-04-01 | theft | 1 |
| 2025-04-01 | Other | 0 |
| 2025-07-01 | hail | 3 |
| 2025-07-01 | flood | 0 |
| 2025-07-01 | storm | 7 |
| 2025-07-01 | water damage | 5 |
| 2025-07-01 | theft | 6 |
| 2025-07-01 | Other | 2 |
| 2025-10-01 | hail | 6 |
| 2025-10-01 | flood | 0 |
| 2025-10-01 | storm | 9 |
| 2025-10-01 | water damage | 10 |
| 2025-10-01 | theft | 11 |
| 2025-10-01 | Other | 4 |
| 2026-01-01 | hail | 5 |
| 2026-01-01 | flood | 0 |
| 2026-01-01 | storm | 13 |
| 2026-01-01 | water damage | 14 |
| 2026-01-01 | theft | 3 |
| 2026-01-01 | Other | 1 |
| 2026-04-01 | hail | 1 |
| 2026-04-01 | flood | 0 |
| 2026-04-01 | storm | 9 |
| 2026-04-01 | water damage | 8 |
| 2026-04-01 | theft | 3 |
| 2026-04-01 | Other | 0 |
| 2026-07-01 | hail | 1 |
| 2026-07-01 | flood | 0 |
| 2026-07-01 | storm | 5 |
| 2026-07-01 | water damage | 3 |
| 2026-07-01 | theft | 0 |
| 2026-07-01 | Other | 0 |
Figure 45. Hot spot analysis: Storm and hail footprints over time 86
| period | series | value |
|---|---|---|
| 2023-01-01 | storm | 1 |
| 2023-01-01 | hail | 0 |
| 2023-01-01 | flood rain | 0 |
| 2023-02-01 | storm | 0 |
| 2023-02-01 | hail | 0 |
| 2023-02-01 | flood rain | 0 |
| 2023-03-01 | storm | 0 |
| 2023-03-01 | hail | 0 |
| 2023-03-01 | flood rain | 0 |
| 2023-04-01 | storm | 0 |
| 2023-04-01 | hail | 0 |
| 2023-04-01 | flood rain | 0 |
| 2023-05-01 | storm | 0 |
| 2023-05-01 | hail | 0 |
| 2023-05-01 | flood rain | 0 |
| 2023-06-01 | storm | 0 |
| 2023-06-01 | hail | 0 |
| 2023-06-01 | flood rain | 0 |
| 2023-07-01 | storm | 0 |
| 2023-07-01 | hail | 0 |
| 2023-07-01 | flood rain | 0 |
| 2023-08-01 | storm | 0 |
| 2023-08-01 | hail | 0 |
| 2023-08-01 | flood rain | 0 |
| 2023-09-01 | storm | 0 |
| 2023-09-01 | hail | 0 |
| 2023-09-01 | flood rain | 0 |
| 2023-10-01 | storm | 0 |
| 2023-10-01 | hail | 1 |
| 2023-10-01 | flood rain | 0 |
| 2023-11-01 | storm | 0 |
| 2023-11-01 | hail | 0 |
| 2023-11-01 | flood rain | 0 |
| 2023-12-01 | storm | 0 |
| 2023-12-01 | hail | 0 |
| 2023-12-01 | flood rain | 0 |
| 2024-01-01 | storm | 0 |
| 2024-01-01 | hail | 0 |
| 2024-01-01 | flood rain | 0 |
| 2024-02-01 | storm | 0 |
| 2024-02-01 | hail | 0 |
| 2024-02-01 | flood rain | 0 |
| 2024-03-01 | storm | 1 |
| 2024-03-01 | hail | 0 |
| 2024-03-01 | flood rain | 0 |
| 2024-04-01 | storm | 0 |
| 2024-04-01 | hail | 0 |
| 2024-04-01 | flood rain | 0 |
| 2024-05-01 | storm | 0 |
| 2024-05-01 | hail | 0 |
| 2024-05-01 | flood rain | 0 |
| 2024-06-01 | storm | 0 |
| 2024-06-01 | hail | 0 |
| 2024-06-01 | flood rain | 0 |
| 2024-07-01 | storm | 0 |
| 2024-07-01 | hail | 0 |
| 2024-07-01 | flood rain | 0 |
| 2024-08-01 | storm | 0 |
| 2024-08-01 | hail | 0 |
| 2024-08-01 | flood rain | 0 |
| 2024-09-01 | storm | 0 |
| 2024-09-01 | hail | 0 |
| 2024-09-01 | flood rain | 0 |
| 2024-10-01 | storm | 0 |
| 2024-10-01 | hail | 0 |
| 2024-10-01 | flood rain | 0 |
| 2024-11-01 | storm | 0 |
| 2024-11-01 | hail | 1 |
| 2024-11-01 | flood rain | 0 |
| 2024-12-01 | storm | 0 |
| 2024-12-01 | hail | 0 |
| 2024-12-01 | flood rain | 0 |
| 2025-01-01 | storm | 0 |
| 2025-01-01 | hail | 0 |
| 2025-01-01 | flood rain | 0 |
| 2025-02-01 | storm | 0 |
| 2025-02-01 | hail | 0 |
| 2025-02-01 | flood rain | 1 |
| 2025-03-01 | storm | 0 |
| 2025-03-01 | hail | 0 |
| 2025-03-01 | flood rain | 0 |
| 2025-04-01 | storm | 0 |
| 2025-04-01 | hail | 0 |
| 2025-04-01 | flood rain | 0 |
| 2025-05-01 | storm | 0 |
| 2025-05-01 | hail | 0 |
| 2025-05-01 | flood rain | 0 |
| 2025-06-01 | storm | 0 |
| 2025-06-01 | hail | 0 |
| 2025-06-01 | flood rain | 0 |
| 2025-07-01 | storm | 0 |
| 2025-07-01 | hail | 0 |
| 2025-07-01 | flood rain | 0 |
| 2025-08-01 | storm | 0 |
| 2025-08-01 | hail | 0 |
| 2025-08-01 | flood rain | 0 |
| 2025-09-01 | storm | 0 |
| 2025-09-01 | hail | 0 |
| 2025-09-01 | flood rain | 0 |
| 2025-10-01 | storm | 0 |
| 2025-10-01 | hail | 0 |
| 2025-10-01 | flood rain | 0 |
| 2025-11-01 | storm | 0 |
| 2025-11-01 | hail | 0 |
| 2025-11-01 | flood rain | 0 |
| 2025-12-01 | storm | 1 |
| 2025-12-01 | hail | 0 |
| 2025-12-01 | flood rain | 0 |
| 2026-01-01 | storm | 0 |
| 2026-01-01 | hail | 1 |
| 2026-01-01 | flood rain | 0 |
| 2026-02-01 | storm | 0 |
| 2026-02-01 | hail | 0 |
| 2026-02-01 | flood rain | 0 |
| 2026-03-01 | storm | 1 |
| 2026-03-01 | hail | 0 |
| 2026-03-01 | flood rain | 0 |
Figure 46. Summarize within: Storm and hail footprints over time 87
| period | series | value |
|---|---|---|
| 2023-01-01 | storm | 1 |
| 2023-01-01 | hail | 0 |
| 2023-01-01 | flood rain | 0 |
| 2023-02-01 | storm | 0 |
| 2023-02-01 | hail | 0 |
| 2023-02-01 | flood rain | 0 |
| 2023-03-01 | storm | 0 |
| 2023-03-01 | hail | 0 |
| 2023-03-01 | flood rain | 0 |
| 2023-04-01 | storm | 0 |
| 2023-04-01 | hail | 0 |
| 2023-04-01 | flood rain | 0 |
| 2023-05-01 | storm | 0 |
| 2023-05-01 | hail | 0 |
| 2023-05-01 | flood rain | 0 |
| 2023-06-01 | storm | 0 |
| 2023-06-01 | hail | 0 |
| 2023-06-01 | flood rain | 0 |
| 2023-07-01 | storm | 0 |
| 2023-07-01 | hail | 0 |
| 2023-07-01 | flood rain | 0 |
| 2023-08-01 | storm | 0 |
| 2023-08-01 | hail | 0 |
| 2023-08-01 | flood rain | 0 |
| 2023-09-01 | storm | 0 |
| 2023-09-01 | hail | 0 |
| 2023-09-01 | flood rain | 0 |
| 2023-10-01 | storm | 0 |
| 2023-10-01 | hail | 1 |
| 2023-10-01 | flood rain | 0 |
| 2023-11-01 | storm | 0 |
| 2023-11-01 | hail | 0 |
| 2023-11-01 | flood rain | 0 |
| 2023-12-01 | storm | 0 |
| 2023-12-01 | hail | 0 |
| 2023-12-01 | flood rain | 0 |
| 2024-01-01 | storm | 0 |
| 2024-01-01 | hail | 0 |
| 2024-01-01 | flood rain | 0 |
| 2024-02-01 | storm | 0 |
| 2024-02-01 | hail | 0 |
| 2024-02-01 | flood rain | 0 |
| 2024-03-01 | storm | 1 |
| 2024-03-01 | hail | 0 |
| 2024-03-01 | flood rain | 0 |
| 2024-04-01 | storm | 0 |
| 2024-04-01 | hail | 0 |
| 2024-04-01 | flood rain | 0 |
| 2024-05-01 | storm | 0 |
| 2024-05-01 | hail | 0 |
| 2024-05-01 | flood rain | 0 |
| 2024-06-01 | storm | 0 |
| 2024-06-01 | hail | 0 |
| 2024-06-01 | flood rain | 0 |
| 2024-07-01 | storm | 0 |
| 2024-07-01 | hail | 0 |
| 2024-07-01 | flood rain | 0 |
| 2024-08-01 | storm | 0 |
| 2024-08-01 | hail | 0 |
| 2024-08-01 | flood rain | 0 |
| 2024-09-01 | storm | 0 |
| 2024-09-01 | hail | 0 |
| 2024-09-01 | flood rain | 0 |
| 2024-10-01 | storm | 0 |
| 2024-10-01 | hail | 0 |
| 2024-10-01 | flood rain | 0 |
| 2024-11-01 | storm | 0 |
| 2024-11-01 | hail | 1 |
| 2024-11-01 | flood rain | 0 |
| 2024-12-01 | storm | 0 |
| 2024-12-01 | hail | 0 |
| 2024-12-01 | flood rain | 0 |
| 2025-01-01 | storm | 0 |
| 2025-01-01 | hail | 0 |
| 2025-01-01 | flood rain | 0 |
| 2025-02-01 | storm | 0 |
| 2025-02-01 | hail | 0 |
| 2025-02-01 | flood rain | 1 |
| 2025-03-01 | storm | 0 |
| 2025-03-01 | hail | 0 |
| 2025-03-01 | flood rain | 0 |
| 2025-04-01 | storm | 0 |
| 2025-04-01 | hail | 0 |
| 2025-04-01 | flood rain | 0 |
| 2025-05-01 | storm | 0 |
| 2025-05-01 | hail | 0 |
| 2025-05-01 | flood rain | 0 |
| 2025-06-01 | storm | 0 |
| 2025-06-01 | hail | 0 |
| 2025-06-01 | flood rain | 0 |
| 2025-07-01 | storm | 0 |
| 2025-07-01 | hail | 0 |
| 2025-07-01 | flood rain | 0 |
| 2025-08-01 | storm | 0 |
| 2025-08-01 | hail | 0 |
| 2025-08-01 | flood rain | 0 |
| 2025-09-01 | storm | 0 |
| 2025-09-01 | hail | 0 |
| 2025-09-01 | flood rain | 0 |
| 2025-10-01 | storm | 0 |
| 2025-10-01 | hail | 0 |
| 2025-10-01 | flood rain | 0 |
| 2025-11-01 | storm | 0 |
| 2025-11-01 | hail | 0 |
| 2025-11-01 | flood rain | 0 |
| 2025-12-01 | storm | 1 |
| 2025-12-01 | hail | 0 |
| 2025-12-01 | flood rain | 0 |
| 2026-01-01 | storm | 0 |
| 2026-01-01 | hail | 1 |
| 2026-01-01 | flood rain | 0 |
| 2026-02-01 | storm | 0 |
| 2026-02-01 | hail | 0 |
| 2026-02-01 | flood rain | 0 |
| 2026-03-01 | storm | 1 |
| 2026-03-01 | hail | 0 |
| 2026-03-01 | flood rain | 0 |
Figure 47. Summarize within: Storm and hail footprints over time 88
| period | series | value |
|---|---|---|
| 2023-01-01 | storm | 1 |
| 2023-01-01 | hail | 0 |
| 2023-01-01 | flood rain | 0 |
| 2023-02-01 | storm | 0 |
| 2023-02-01 | hail | 0 |
| 2023-02-01 | flood rain | 0 |
| 2023-03-01 | storm | 0 |
| 2023-03-01 | hail | 0 |
| 2023-03-01 | flood rain | 0 |
| 2023-04-01 | storm | 0 |
| 2023-04-01 | hail | 0 |
| 2023-04-01 | flood rain | 0 |
| 2023-05-01 | storm | 0 |
| 2023-05-01 | hail | 0 |
| 2023-05-01 | flood rain | 0 |
| 2023-06-01 | storm | 0 |
| 2023-06-01 | hail | 0 |
| 2023-06-01 | flood rain | 0 |
| 2023-07-01 | storm | 0 |
| 2023-07-01 | hail | 0 |
| 2023-07-01 | flood rain | 0 |
| 2023-08-01 | storm | 0 |
| 2023-08-01 | hail | 0 |
| 2023-08-01 | flood rain | 0 |
| 2023-09-01 | storm | 0 |
| 2023-09-01 | hail | 0 |
| 2023-09-01 | flood rain | 0 |
| 2023-10-01 | storm | 0 |
| 2023-10-01 | hail | 1 |
| 2023-10-01 | flood rain | 0 |
| 2023-11-01 | storm | 0 |
| 2023-11-01 | hail | 0 |
| 2023-11-01 | flood rain | 0 |
| 2023-12-01 | storm | 0 |
| 2023-12-01 | hail | 0 |
| 2023-12-01 | flood rain | 0 |
| 2024-01-01 | storm | 0 |
| 2024-01-01 | hail | 0 |
| 2024-01-01 | flood rain | 0 |
| 2024-02-01 | storm | 0 |
| 2024-02-01 | hail | 0 |
| 2024-02-01 | flood rain | 0 |
| 2024-03-01 | storm | 1 |
| 2024-03-01 | hail | 0 |
| 2024-03-01 | flood rain | 0 |
| 2024-04-01 | storm | 0 |
| 2024-04-01 | hail | 0 |
| 2024-04-01 | flood rain | 0 |
| 2024-05-01 | storm | 0 |
| 2024-05-01 | hail | 0 |
| 2024-05-01 | flood rain | 0 |
| 2024-06-01 | storm | 0 |
| 2024-06-01 | hail | 0 |
| 2024-06-01 | flood rain | 0 |
| 2024-07-01 | storm | 0 |
| 2024-07-01 | hail | 0 |
| 2024-07-01 | flood rain | 0 |
| 2024-08-01 | storm | 0 |
| 2024-08-01 | hail | 0 |
| 2024-08-01 | flood rain | 0 |
| 2024-09-01 | storm | 0 |
| 2024-09-01 | hail | 0 |
| 2024-09-01 | flood rain | 0 |
| 2024-10-01 | storm | 0 |
| 2024-10-01 | hail | 0 |
| 2024-10-01 | flood rain | 0 |
| 2024-11-01 | storm | 0 |
| 2024-11-01 | hail | 1 |
| 2024-11-01 | flood rain | 0 |
| 2024-12-01 | storm | 0 |
| 2024-12-01 | hail | 0 |
| 2024-12-01 | flood rain | 0 |
| 2025-01-01 | storm | 0 |
| 2025-01-01 | hail | 0 |
| 2025-01-01 | flood rain | 0 |
| 2025-02-01 | storm | 0 |
| 2025-02-01 | hail | 0 |
| 2025-02-01 | flood rain | 1 |
| 2025-03-01 | storm | 0 |
| 2025-03-01 | hail | 0 |
| 2025-03-01 | flood rain | 0 |
| 2025-04-01 | storm | 0 |
| 2025-04-01 | hail | 0 |
| 2025-04-01 | flood rain | 0 |
| 2025-05-01 | storm | 0 |
| 2025-05-01 | hail | 0 |
| 2025-05-01 | flood rain | 0 |
| 2025-06-01 | storm | 0 |
| 2025-06-01 | hail | 0 |
| 2025-06-01 | flood rain | 0 |
| 2025-07-01 | storm | 0 |
| 2025-07-01 | hail | 0 |
| 2025-07-01 | flood rain | 0 |
| 2025-08-01 | storm | 0 |
| 2025-08-01 | hail | 0 |
| 2025-08-01 | flood rain | 0 |
| 2025-09-01 | storm | 0 |
| 2025-09-01 | hail | 0 |
| 2025-09-01 | flood rain | 0 |
| 2025-10-01 | storm | 0 |
| 2025-10-01 | hail | 0 |
| 2025-10-01 | flood rain | 0 |
| 2025-11-01 | storm | 0 |
| 2025-11-01 | hail | 0 |
| 2025-11-01 | flood rain | 0 |
| 2025-12-01 | storm | 1 |
| 2025-12-01 | hail | 0 |
| 2025-12-01 | flood rain | 0 |
| 2026-01-01 | storm | 0 |
| 2026-01-01 | hail | 1 |
| 2026-01-01 | flood rain | 0 |
| 2026-02-01 | storm | 0 |
| 2026-02-01 | hail | 0 |
| 2026-02-01 | flood rain | 0 |
| 2026-03-01 | storm | 1 |
| 2026-03-01 | hail | 0 |
| 2026-03-01 | flood rain | 0 |
GeoBit Large Spatial Model. Findings are labeled Evidenced (computed by a tool), Inferred (a reading or reasoning) or Unverified (no evidence yet).