26 industries, one sample project each
Each sample sits at a real place with synthetic data: ten or more datasets a customer in that industry would upload, and the question it would ask. Start was pressed on each in describe mode with the local model. Open one to see the maps, charts and cited report its run exported.
What each export holds. 26 samples (Public safety, Insurance, Retail, Logistics, Electricity utility, Water utility, Telecom, Mining, Oil and gas pipelines, Agriculture, Forestry and wildfire, Real estate and urban planning, Transportation safety, Public health, Conservation, Water resources, Renewable energy, Corporate security and travel risk, Disaster response, Ports and maritime operations, Field operations terrain, Tourism and events, Education, Construction, Banking, Smart city sensors) were exported with every map and chart image. The other 0 exports hold the cited report and the chart specs: their charts are drawn here from those specs, and their map images were not exported, so none are shown.
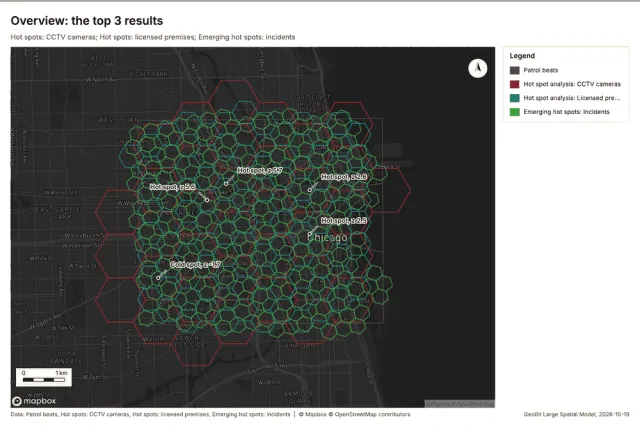 Maps, charts and report
Public safety
Where and when do incidents cluster, which beats are getting worse, and where should patrols go?
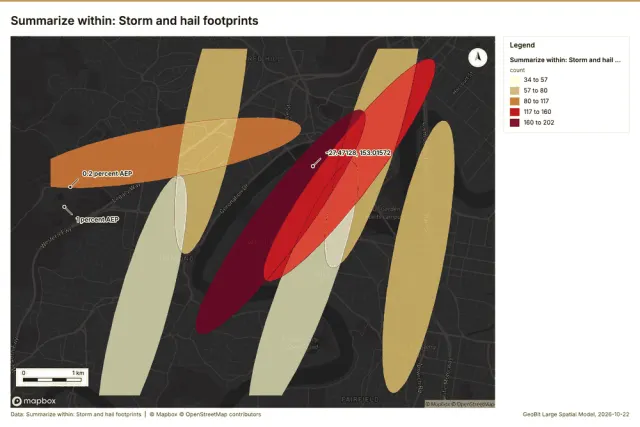 Maps, charts and report
Insurance
How much insured value sits within each flood zone, where are properties and claims concentrated, and how did claims change over time?
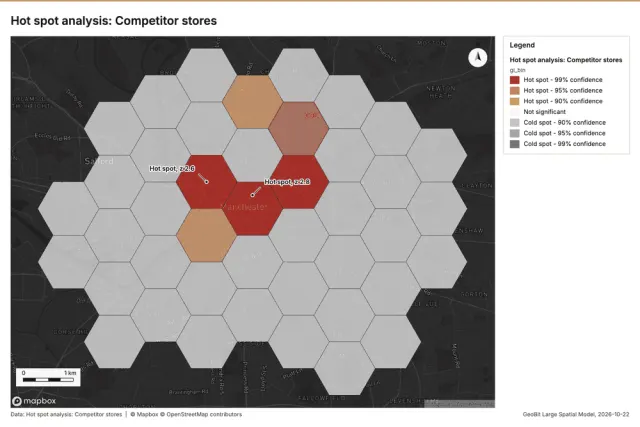 Maps, charts and report
Retail
Where do our customers concentrate and cluster, how does demand change over time, and which neighborhoods and trade areas hold the most customers?
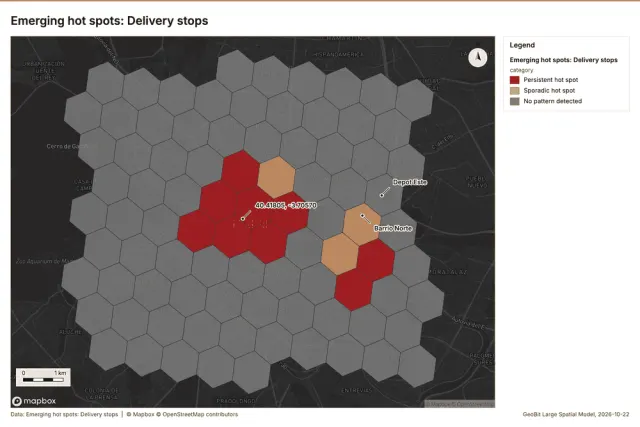 Maps, charts and report
Logistics
Where and when do delivery delays build up, and which zones and routes are getting worse over time?
 Maps, charts and report
Electricity utility
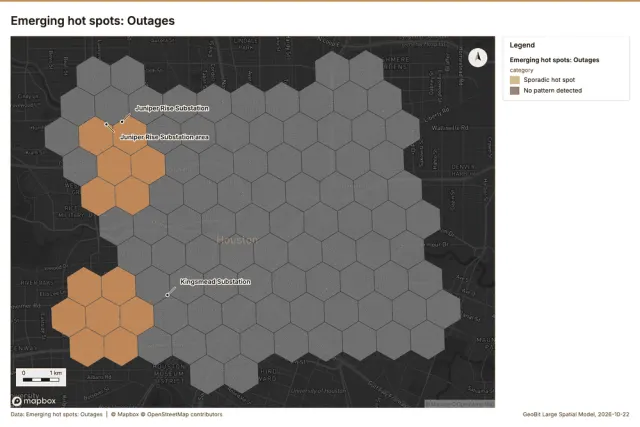
Where are outages concentrated, how do they change over time through storm season, and which service areas are least reliable?
 Maps, charts and report
Water utility
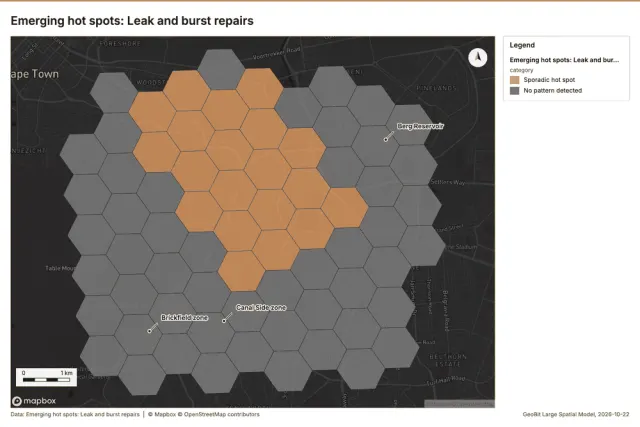
Where do leaks and bursts concentrate, how do they change over time, and which pressure zones lose the most water?
 Maps, charts and report
Telecom
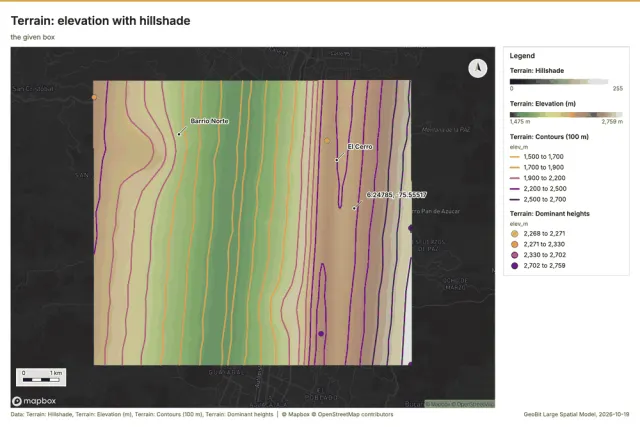
Where do calls drop, what can each tower see over the terrain (viewshed), and where are the coverage gaps?
 Maps, charts and report
Mining
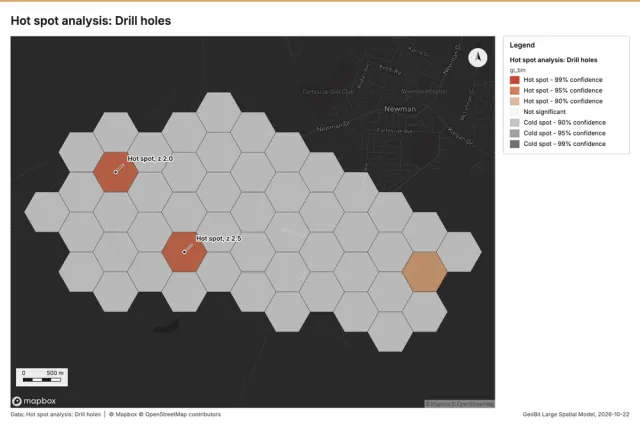
Where are the pit walls steep and moving over time, how does slope and terrain vary across the mine, and where do monitoring readings cluster?
 Maps, charts and report
Oil and gas pipelines
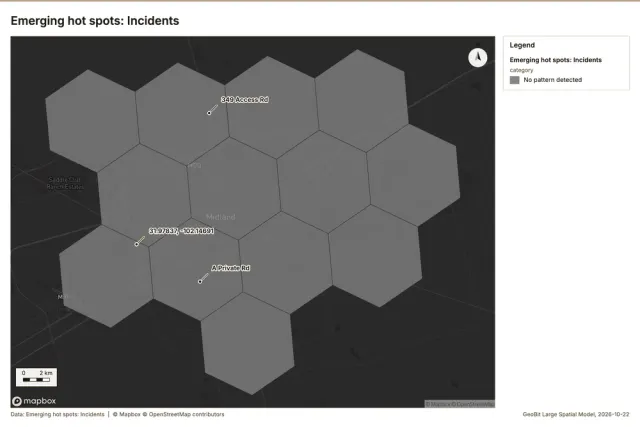
Where along the lines do anomalies and incidents concentrate, how have they changed over time, and which segments are near high consequence areas?
 Maps, charts and report
Agriculture
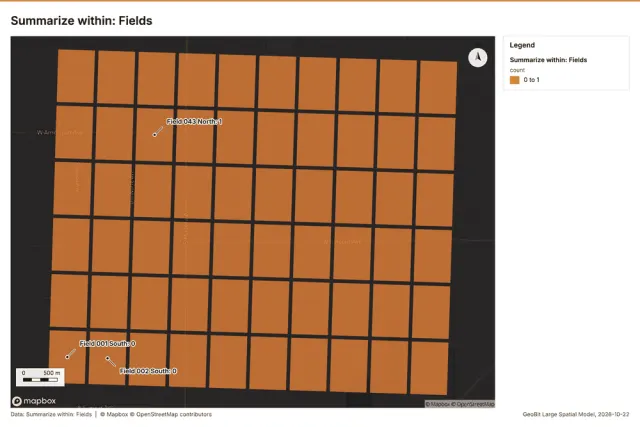
Which fields lost vegetation between the April and August imagery (NDVI change), where is soil quality poor, and how do yields compare per field?
 Maps, charts and report
Forestry and wildfire
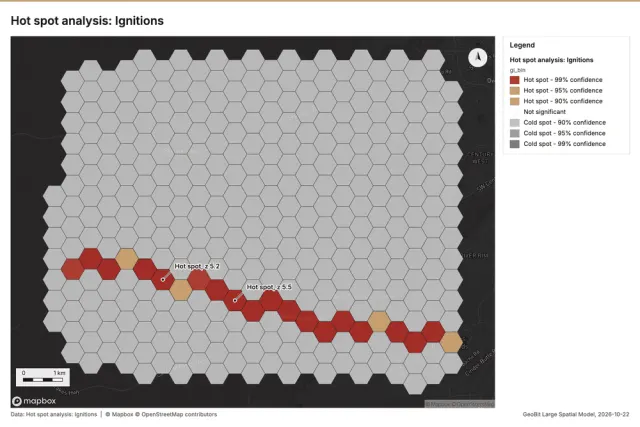
Where do ignitions cluster over time, how does terrain and slope shape fire risk, and which fuel units overlap recent fires?
 Maps, charts and report
Real estate and urban planning
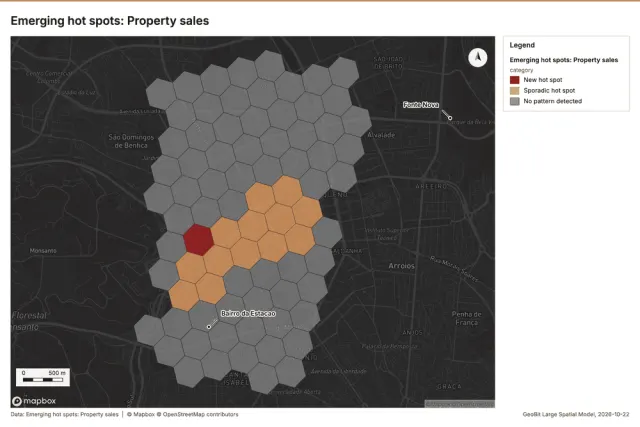
Where are sale prices rising fastest over time, how do parcels compare across zoning, and where is the terrain too steep (slope) to build?
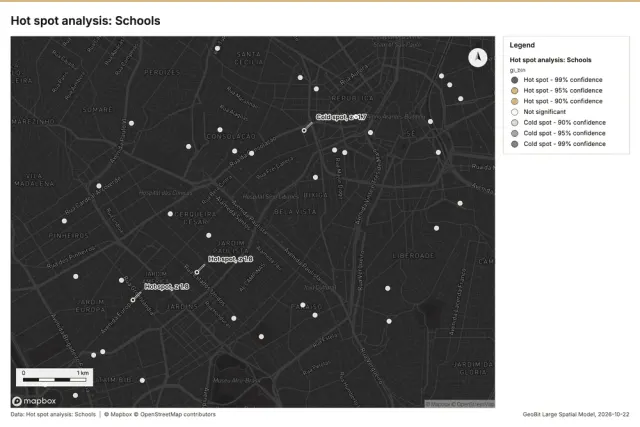 Maps, charts and report
Transportation safety
Where and when do serious crashes cluster, which segments are getting worse over time, and are cameras near the crash hot spots?
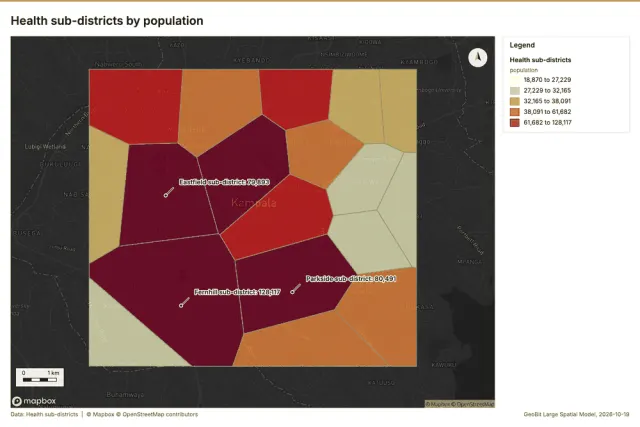 Maps, charts and report
Public health
Where and when are cases rising, which districts have the highest rates, and which areas lack access to a clinic?
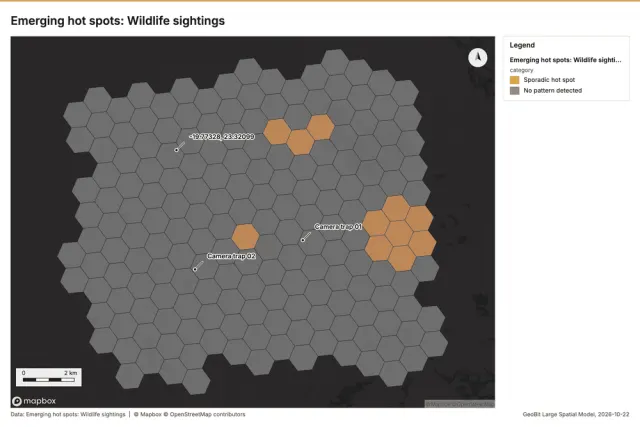 Maps, charts and report
Conservation
Where do key species concentrate and how has that changed over time, and where did habitat change inside the protected areas?
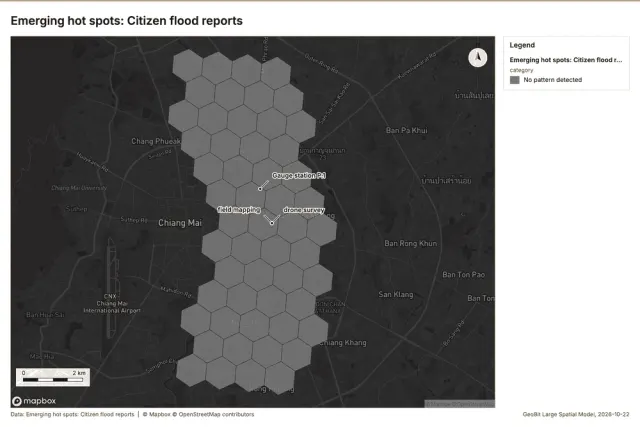 Maps, charts and report
Water resources
Which sub-catchments drain to the flooded areas (watershed), where do flood reports concentrate, and how do river levels rise over time?
 Maps, charts and report
Renewable energy
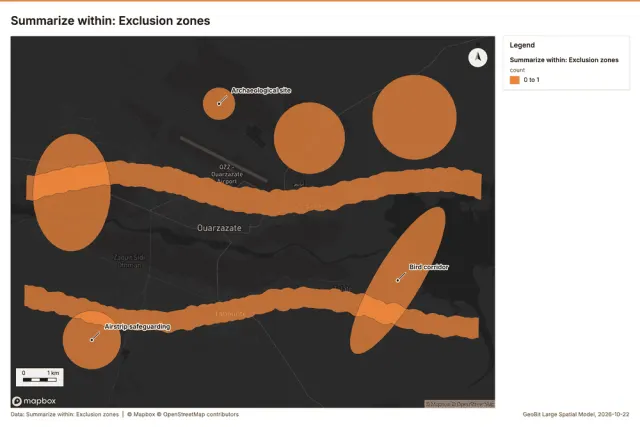
Which candidate sites have gentle south-facing terrain (slope and aspect), stay clear of exclusions, and are near the grid?
 Maps, charts and report
Corporate security and travel risk
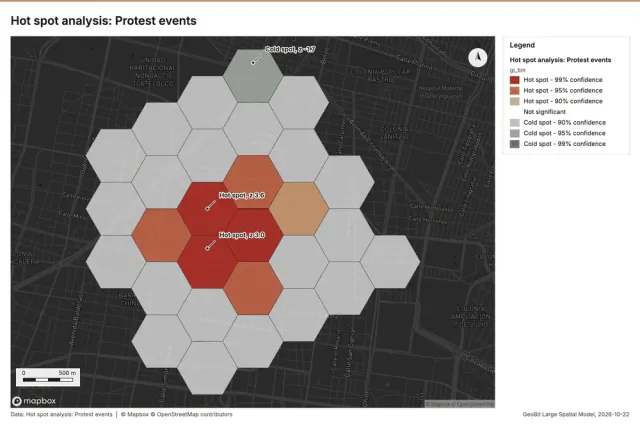
Which sites and routes are near recent incidents, where and when do incidents cluster, and what do the briefings say about each area?
 Maps, charts and report
Disaster response
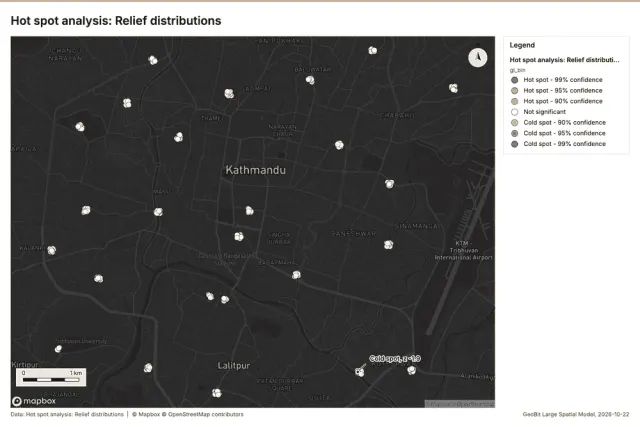
Where is damage worst and clustered, how did the assessments progress over time, and which wards have the most displaced people?
 Maps, charts and report
Ports and maritime operations
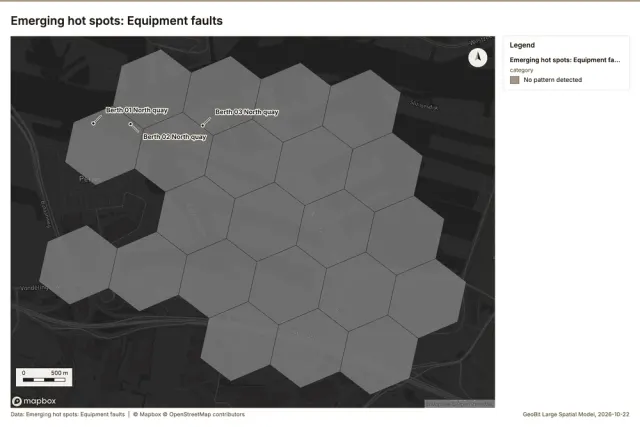
Where in the yard do truck turn times build up, at which hours and days (over time), and how busy is each berth?
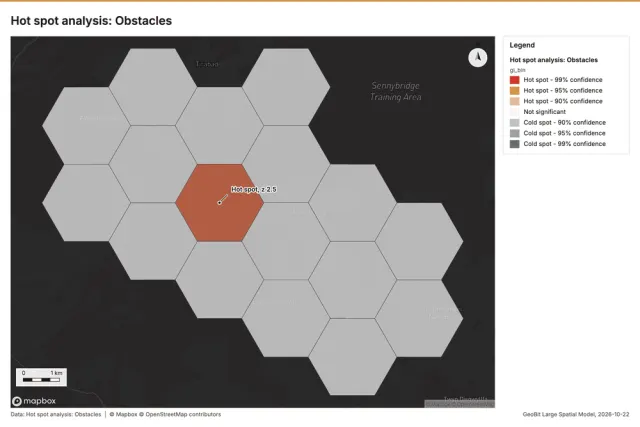 Maps, charts and report
Field operations terrain
What can each observation post see (viewshed), where is the terrain too steep (slope) for vehicles, and where do patrol reports cluster?
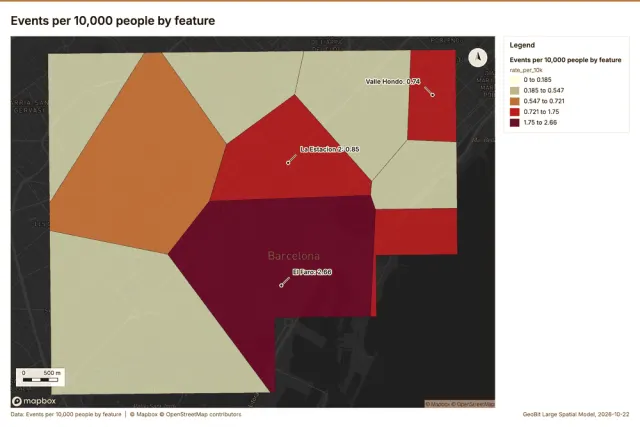 Maps, charts and report
Tourism and events
When and where are crowds heaviest over time around the venues, and where do hotels and visitors concentrate by district?
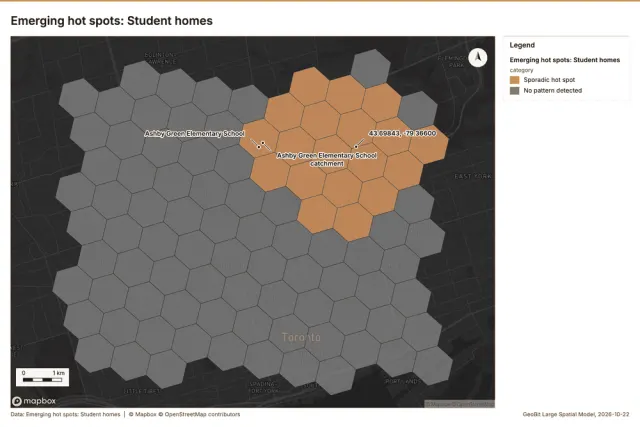 Maps, charts and report
Education
Which schools are over capacity, where do students live relative to their school (distance), and where is enrollment growing over time?
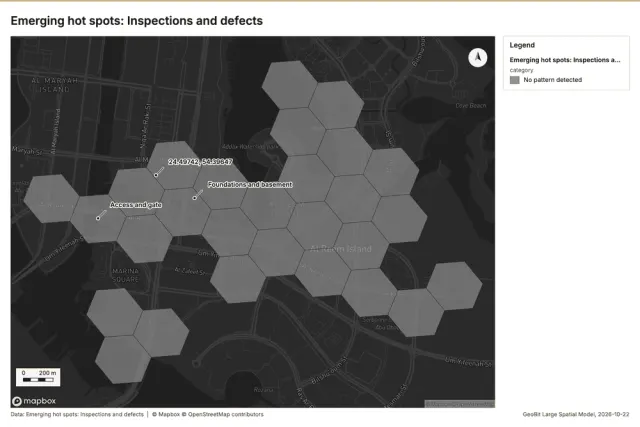 Maps, charts and report
Construction
What changed on site between the March and September imagery, where are defects concentrated, and how does the terrain (slope) vary across the work zones?
 Maps, charts and report
Banking
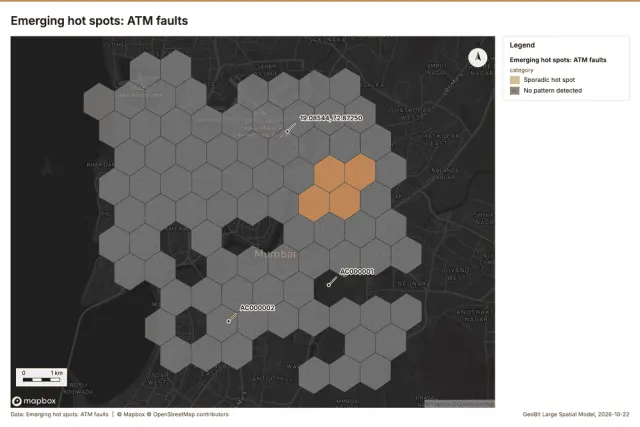
Where are new customers coming from over time, which areas are underserved (coverage gap) by branches and ATMs, and how do areas compare?
 Maps, charts and report
Smart city sensors
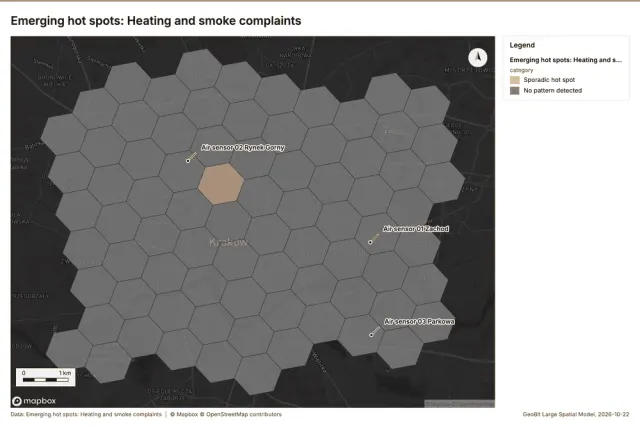
When and where does air quality get worst over time, which districts have the most complaints, and how near are sensors to busy roads?
Exports at a glance
What each sample's run made and what its export holds. Totals over 26 runs: 587 output layers, 581 maps, 741 charts and 1,372 findings; 581 map images and 741 chart images were exported, and 0 charts as specs.
| Industry | Place | Datasets | Map images | Charts | Report | Findings |
|---|---|---|---|---|---|---|
| Public safety | Chicago, Illinois, United States | 12 | 24 of 24 | 41 of 41 images | PDF, Word, Markdown | 104 |
| Insurance | Brisbane, Queensland, Australia | 12 | 19 of 19 | 28 of 28 images | PDF, Word, Markdown | 33 |
| Retail | Manchester, England, United Kingdom | 11 | 20 of 20 | 23 of 23 images | PDF, Word, Markdown | 35 |
| Logistics | Madrid, Spain | 10 | 22 of 22 | 28 of 28 images | PDF, Word, Markdown | 47 |
| Electricity utility | Houston, Texas, United States | 10 | 20 of 20 | 29 of 29 images | PDF, Word, Markdown | 41 |
| Water utility | Cape Town, Western Cape, South Africa | 10 | 20 of 20 | 28 of 28 images | PDF, Word, Markdown | 39 |
| Telecom | Medellin, Antioquia, Colombia | 10 | 74 of 74 | 76 of 76 images | PDF, Word, Markdown | 202 |
| Mining | Newman, Pilbara, Western Australia | 11 | 21 of 21 | 23 of 23 images | PDF, Word, Markdown | 42 |
| Oil and gas pipelines | Midland, Texas, United States | 10 | 20 of 20 | 28 of 28 images | PDF, Word, Markdown | 37 |
| Agriculture | Fresno County, California, United States | 11 | 22 of 22 | 24 of 24 images | PDF, Word, Markdown | 48 |
| Forestry and wildfire | Bend, Oregon, United States | 11 | 17 of 17 | 26 of 26 images | PDF, Word, Markdown | 44 |
| Real estate and urban planning | Lisbon, Portugal | 11 | 21 of 21 | 27 of 27 images | PDF, Word, Markdown | 44 |
| Transportation safety | Sao Paulo, Brazil | 11 | 18 of 18 | 26 of 26 images | PDF, Word, Markdown | 36 |
| Public health | Kampala, Uganda | 10 | 26 of 26 | 39 of 39 images | PDF, Word, Markdown | 111 |
| Conservation | Okavango Delta near Maun, Botswana | 11 | 25 of 25 | 26 of 26 images | PDF, Word, Markdown | 54 |
| Water resources | Chiang Mai, Thailand | 11 | 16 of 16 | 19 of 19 images | PDF, Word, Markdown | 39 |
| Renewable energy | Ouarzazate, Draa-Tafilalet, Morocco | 12 | 14 of 14 | 18 of 18 images | PDF, Word, Markdown | 36 |
| Corporate security and travel risk | Mexico City, Mexico | 12 | 23 of 23 | 28 of 28 images | PDF, Word, Markdown | 45 |
| Disaster response | Kathmandu, Nepal | 10 | 20 of 20 | 27 of 27 images | PDF, Word, Markdown | 39 |
| Ports and maritime operations | Rotterdam, South Holland, Netherlands | 11 | 20 of 20 | 28 of 28 images | PDF, Word, Markdown | 39 |
| Field operations terrain | Sennybridge, Brecon Beacons, Wales, United Kingdom | 11 | 20 of 20 | 24 of 24 images | PDF, Word, Markdown | 42 |
| Tourism and events | Barcelona, Catalonia, Spain | 12 | 12 of 12 | 18 of 18 images | PDF, Word, Markdown | 29 |
| Education | Toronto, Ontario, Canada | 10 | 23 of 23 | 32 of 32 images | PDF, Word, Markdown | 46 |
| Construction | Al Reem Island, Abu Dhabi, United Arab Emirates | 12 | 24 of 24 | 24 of 24 images | PDF, Word, Markdown | 66 |
| Banking | Mumbai, Maharashtra, India | 11 | 20 of 20 | 24 of 24 images | PDF, Word, Markdown | 37 |
| Smart city sensors | Krakow, Lesser Poland, Poland | 11 | 20 of 20 | 27 of 27 images | PDF, Word, Markdown | 37 |