Sample: Smart city sensors, Krakow: report
Project: Sample: Smart city sensors, Krakow
Goal: Describe the project Sample: Smart city sensors, Krakow: run the analyses that tell the most about its data, draw every result, and write a cited report.
Run: 036a3e58-f6a2-4c67-bf86-aaa45b6b5e6f (running, 11 agent run(s))
Generated: 2026-10-18T06:32:42Z, version 1
Model cost: USD 0.0000 over 0 model call(s)
Data used
| Data | Kind | Rows | Time span | Summary | Source |
|---|---|---|---|---|---|
| Districts | vector, Polygon | 12 | 12 polygon (area) features; 'population' 15,889 to 73,746 (mean 3.707e+04); 'coal_heated_homes' 264 to 6,760 (mean 2035); named by 'name' (e.g. Polnoc, Poludnie, Wschod); total area 48.03 km2; extent 19.8885,50.0372 to 20.0014,50.0922. Areas (Districts) with population to compare and map. | 98 | |
| Air quality sensors | vector, Point | 18 | 18 point features; 'model' has 2 values (top: optical PM 9, reference station 9); 'height_m' 3 to 6 (mean 4.5); named by 'name' (e.g. Air sensor 01 Zachod, Air sensor 02 Rynek Gorny, Air sensor 03 Parkowa); extent 19.8942,50.0421 to 19.9952,50.0874. Point locations of Air quality sensors by model. | 99 | |
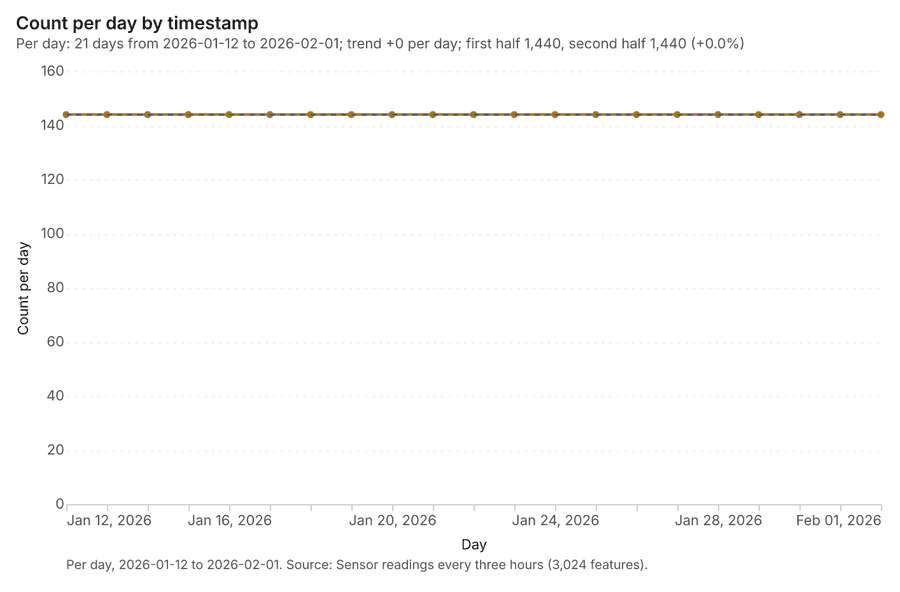
| Sensor readings every three hours | table | 3,024 | 2026-01-12 to 2026-02-01 | Table of 3,024 rows and 7 columns without geometry; dated by 'timestamp' from 2026-01-12 to 2026-02-01; 'pm25_ugm3' 17.6 to 211 (mean 52.75); 'pm10_ugm3' 23 to 326.5 (mean 76.56); 'no2_ugm3' 15 to 55 (mean 34.97). A table of Sensor readings every three hours without locations. | 2 |
| Major roads | vector, LineString | 20 | 20 line features; 'aadt' 8,775 to 60,655 (mean 2.965e+04); 'heavy_pct' 3.4 to 13.8 (mean 7.705); named by 'name' (e.g. ulica Dluga, ulica Ogrodowa, aleja Lipowa); total length 121.1 km; extent 19.8899,50.0380 to 20.0004,50.0913. Lines (Major roads) such as routes or networks. | 100 | |
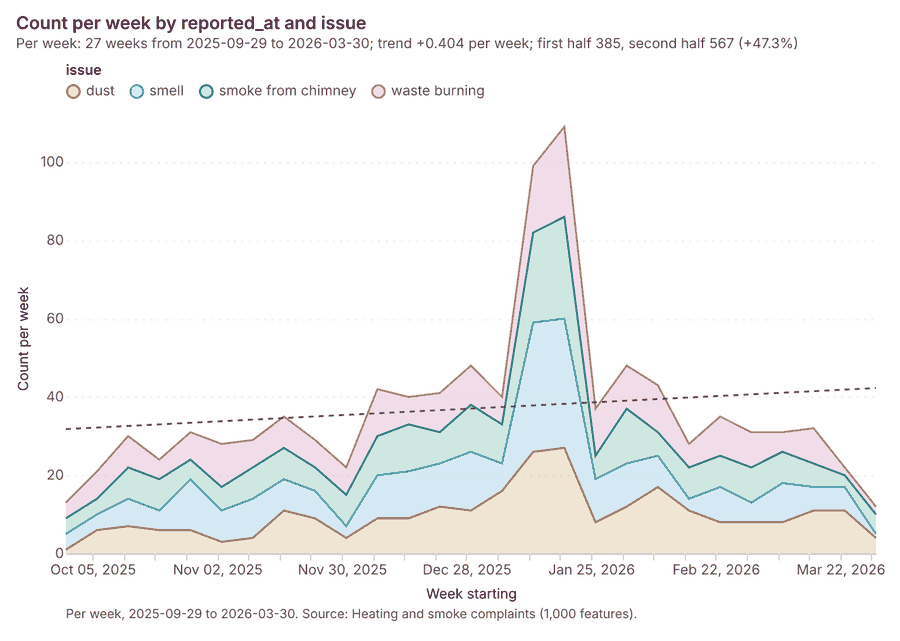
| Heating and smoke complaints | vector, Point | 1,000 | 2025-10-01 to 2026-03-31 | 1,000 point features; dated by 'reported_at' from 2025-10-01 to 2026-03-31; 'issue' has 4 values (top: dust 265, smell 261, smoke from chimney 239); 'channel' has 3 values (top: web 349, phone 326, app 325); extent 19.8915,50.0381 to 20.0005,50.0913. Dated point events by issue: where and when Heating and smoke complaints happen. | 3 |
| Traffic counters | vector, Point | 20 | 20 point features; 'lanes' 2 to 4 (mean 3.2); extent 19.8905,50.0388 to 19.9989,50.0888. Point locations of Traffic counters. | 101 | |
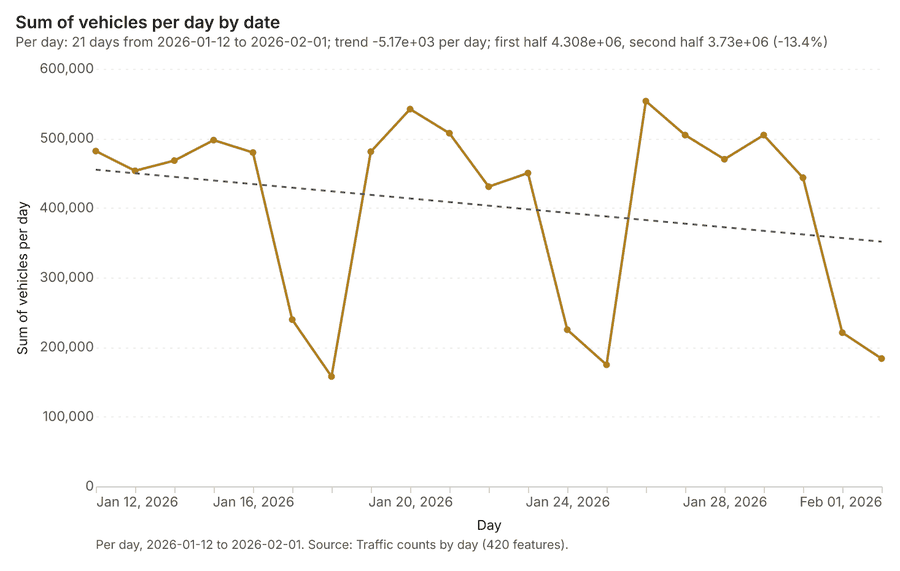
| Traffic counts by day | table | 420 | 2026-01-12 to 2026-02-01 | Table of 420 rows and 4 columns without geometry; dated by 'date' from 2026-01-12 to 2026-02-01; 'vehicles' 4,398 to 46,448 (mean 2.016e+04); 'heavy_pct' 4 to 13 (mean 8.541). A table of Traffic counts by day without locations. | 4 |
| Schools | vector, Point | 50 | 50 point features; 'pupils' 154 to 890 (mean 561.8); named by 'name' (e.g. Szkola 1, Szkola 2, Szkola 3); extent 19.8911,50.0385 to 19.9994,50.0908. Point locations of Schools. | 102 | |
| Green areas | vector, Polygon | 15 | 15 polygon (area) features; 'trees' 160 to 869 (mean 446.5); named by 'name' (e.g. Park Poludnie, Park Wschod, Park Zachod); total area 0.3318 km2; extent 19.8943,50.0418 to 19.9722,50.0881. Areas (Green areas) with trees to compare and map. | 103 | |
| Smog alert areas | vector, Polygon | 5 | 2026-01-16 to 2026-01-25 | 5 polygon (area) features; dated by 'date' from 2026-01-16 to 2026-01-25; 'level' has 2 values (top: level 3 3, level 2 2); 'free_transit' has 1 values (top: True 5); total area 49.02 km2; extent 19.8966,50.0587 to 19.9482,50.0915. Areas (Smog alert areas) to compare and map. | 5 |
| Air quality bulletin | document | 1-page md document 'Air quality bulletin, January 2026'; language en; mentions 3 place(s): Poludnie (1), Air sensor 02 Rynek Gorny (1), Air sensor 06 Poludnie (1). A document about Poludnie, Air sensor 02 Rynek Gorny, Air sensor 06 Poludnie. | 104 | ||
| Sample: Smart city sensors, Krakow | record | 105 | |||
| Emerging hot spots: Heating and smoke complaints | layer, Polygon | 79 | 106 | ||
| Repeat and near repeat classification: Heating and smoke complaints | layer, Point | 1,000 | 107 | ||
| Summarize within: Smog alert areas | layer, Polygon | 5 | 108 | ||
| Summarize within: Smog alert areas | layer, Polygon | 5 | 109 | ||
| Hot spot analysis: Schools | layer, Polygon | 18 | 110 | ||
| Hot spot analysis: Heating and smoke complaints | layer, Polygon | 208 | 111 | ||
| Calculate density: Schools | layer, Polygon | 98 | 112 | ||
| Calculate density: Traffic counters | layer, Polygon | 208 | 113 | ||
| Calculate density: Heating and smoke complaints | layer, Polygon | 1,379 | 114 | ||
| Find point clusters: Schools | layer, Point | 50 | 115 | ||
| Find point clusters: cluster hulls | layer, Polygon | 7 | 116 | ||
| Find point clusters: Traffic counters | layer, Point | 20 | 117 | ||
| Find point clusters: cluster hulls | layer, Polygon | 1 | 118 | ||
| Find point clusters: Air quality sensors | layer, Point | 18 | 119 | ||
| Find point clusters: cluster hulls | layer, Polygon | 1 | 120 | ||
| Find outliers: Districts | layer, Polygon | 12 | 121 | ||
| Find outliers: Green areas | layer, Polygon | 15 | 122 | ||
| Summarize within: Smog alert areas | layer, Polygon | 5 | 123 |
Timeline
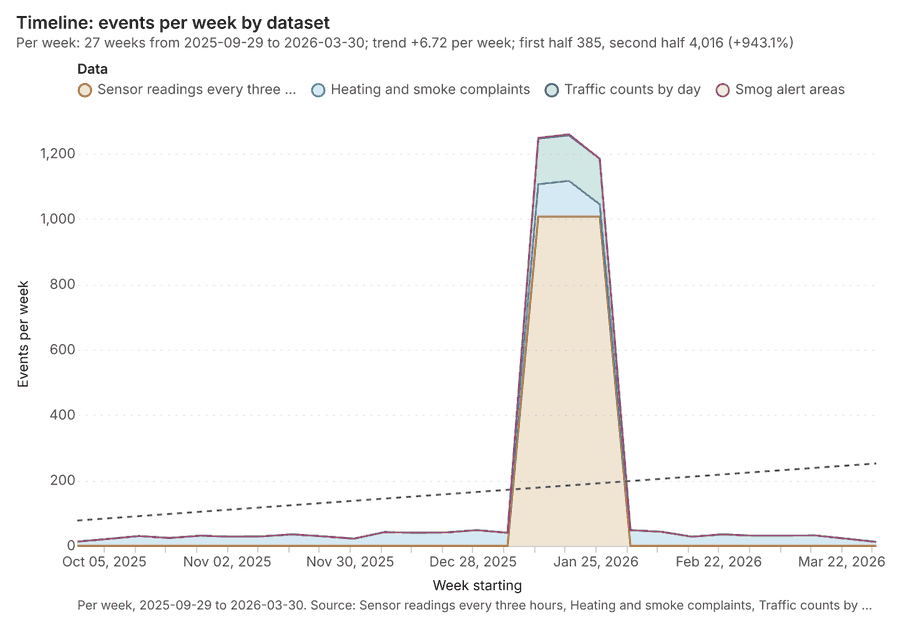
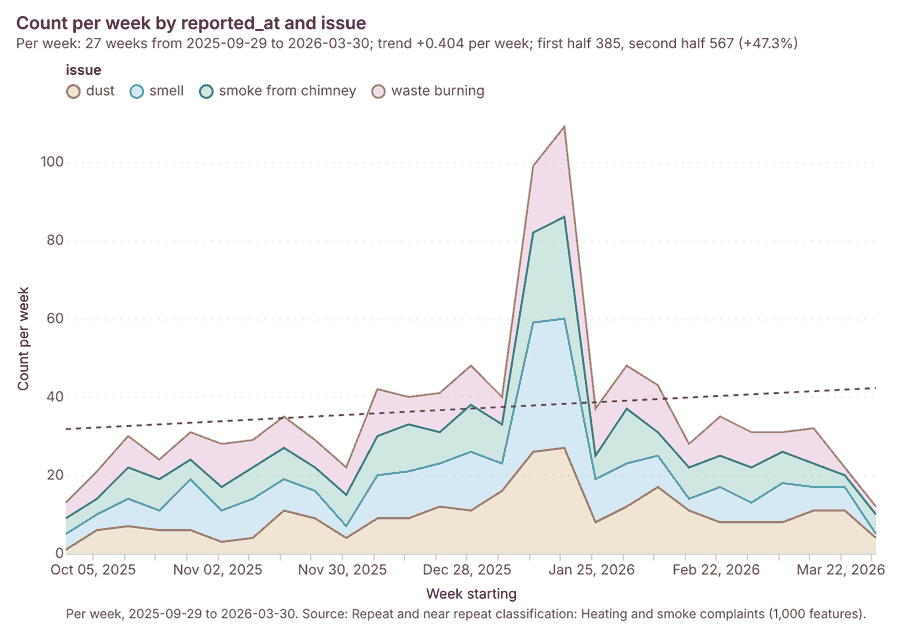
The timeline counts 4,449 dated events in Sensor readings every three hours, Heating and smoke complaints, Traffic counts by day and 1 more per week, from week of 2025-09-29 to week of 2026-03-30 12345. By dataset: Sensor readings every three hours 3,024; Heating and smoke complaints 1,000; Traffic counts by day 420; Smog alert areas 5 1. The trend is +6.72 events per week; the second half of the weeks has 4,016 against 385 in the first (+943.1%) 1.
Busiest weeks
- week of 2026-01-19: 1,260 events 1
- week of 2026-01-12: 1,249 events 1
- week of 2026-01-26: 1,185 events 1
Quietest weeks
Space time hot spots
What this analysis is. Emerging hot spots: Where hot spots are new, consecutive, intensifying, persistent, diminishing, sporadic, oscillating or historical over time 6. In ArcGIS it is Emerging Hot Spot Analysis or Create Space Time Cube 6.
Why it was run on this data. Heating and smoke complaints carry dates in 'reported_at': emerging hot spot analysis finds new, intensifying and fading hot spots per week 7.
What it found. Space time hot spots on Heating and smoke complaints: Emerging hot spots: 1 layer saved: Emerging hot spots: Heating and smoke complaints (79 features) 89. It reported result, count 79; result, elapsed ms 13; result, resolution 8; result, features used 1,000; result, time neighbors 0; billing, cost 0.15 8.
| Result | Value |
|---|---|
| result, count | 79 |
| result, elapsed ms | 13 |
| result, resolution | 8 |
| result, features used | 1,000 |
| result, time neighbors | 0 |
| billing, cost | 0.15 |
| billing, list price | 0.15 |
| billing, upstream cost | 0 |
Findings
- Evidenced: Space time hot spots on Heating and smoke complaints: Emerging hot spots: 1 layer saved: Emerging hot spots: Heating and smoke complaints (79 features) 89.
- Evidenced: It reported result, count 79; result, elapsed ms 13; result, resolution 8; result, features used 1,000; result, time neighbors 0; billing, cost 0.15 8.
A model draft was discarded because a sentence did not cite a source of this section.
Tool gp_space_time_hot_spots; parameters {"project": "941056ab-e59e-43ce-98fd-5b3678626f78", "features": {"layer": "Heating and smoke complaints (872e2359)"}, "interval": "week", "bin_shape": "h3", "resolution": 8, "time_field": "reported_at"}
Near repeat
What this analysis is. Repeat and near repeat classification: Classify incidents as originators, repeats (same place) or near repeats within a distance and time window, with a Knox test table 10. In ArcGIS it is Repeat and Near Repeat Classification or Near Repeat Calculator 10.
Why it was run on this data. Near repeat analysis tests whether Heating and smoke complaints close in space also follow each other within 18 days 11.
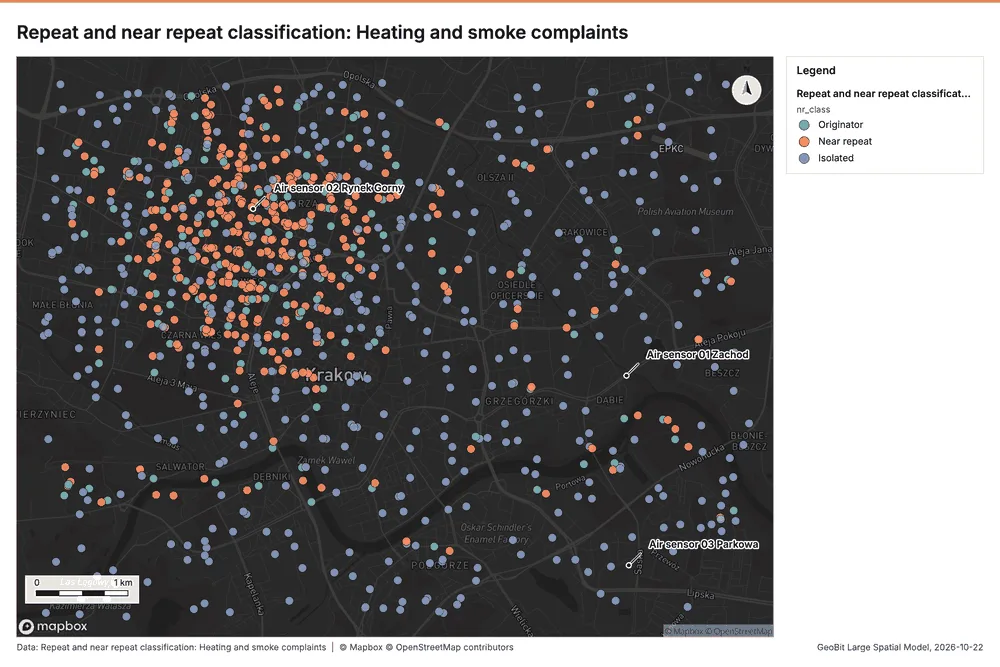
What it found. Near repeat on Heating and smoke complaints: Repeat and near repeat classification: 1 layer saved: Repeat and near repeat classification: Heating and smoke complaints (1000 features) 912. It reported result, days 18; result, count 1,000; result, chains 118; result, distance m 200; result, elapsed ms 21; result, pairs linked 557 12.
| Result | Value |
|---|---|
| result, days | 18 |
| result, count | 1,000 |
| result, chains | 118 |
| result, distance m | 200 |
| result, elapsed ms | 21 |
| result, pairs linked | 557 |
| billing, cost | 0.08 |
| billing, list price | 0.08 |
| billing, upstream cost | 0 |
Findings
- Evidenced: Near repeat on Heating and smoke complaints: Repeat and near repeat classification: 1 layer saved: Repeat and near repeat classification: Heating and smoke complaints (1000 features) 912.
- Evidenced: It reported result, days 18; result, count 1,000; result, chains 118; result, distance m 200; result, elapsed ms 21; result, pairs linked 557 12.
Tool gp_near_repeat; parameters {"days": 18, "project": "941056ab-e59e-43ce-98fd-5b3678626f78", "features": {"layer": "Heating and smoke complaints (872e2359)"}, "distance_m": 200.0, "time_field": "reported_at"}
Summarize within
What this analysis is. Summarize within: Count and aggregate the features inside each polygon (or bin), proportionally for lines and polygons 13. In ArcGIS it is Summarize Within or Aggregate Points; in QGIS, native:countpointsinpolygon or native:sumlinelengths 13.
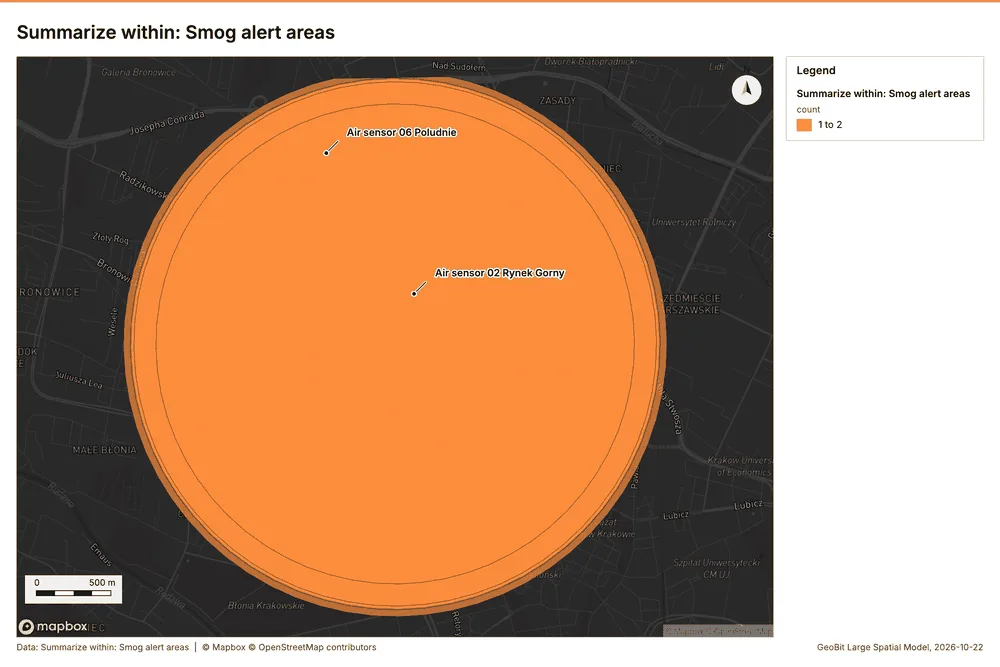
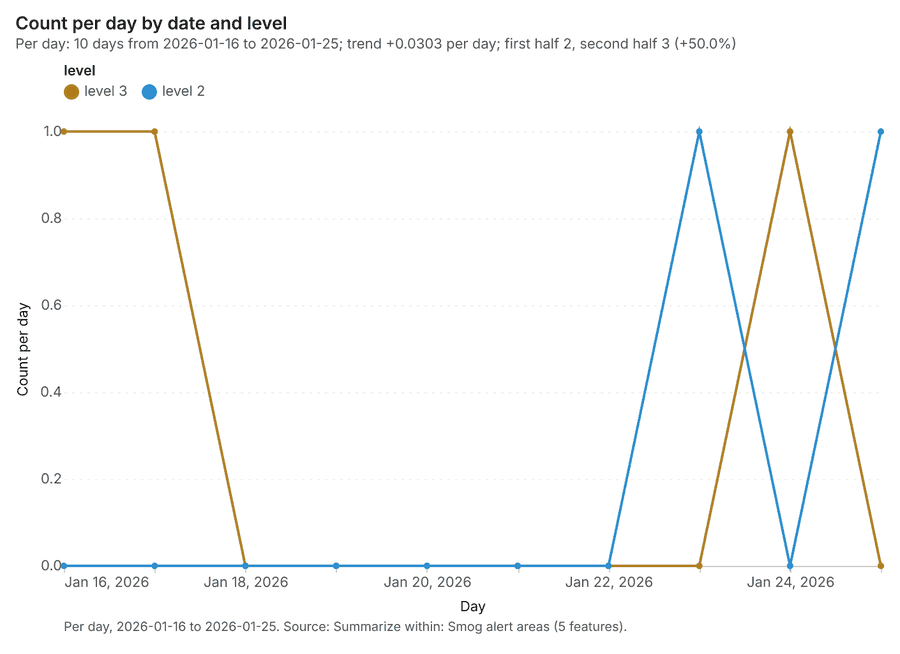
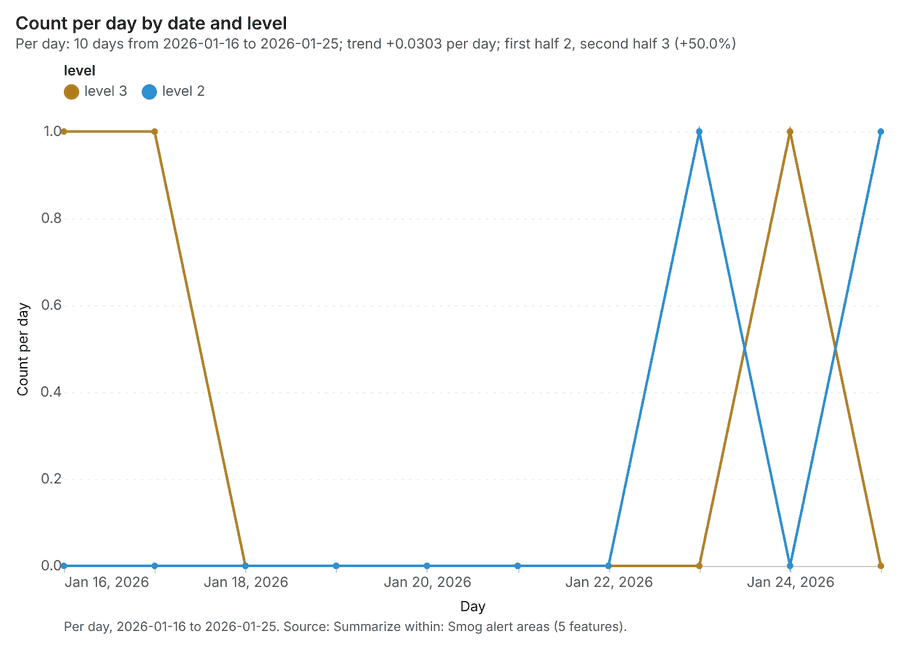
Why it was run on this data. Count Schools inside each feature of Smog alert areas; the counts map as a choropleth (natural breaks, sequential colors) 14.
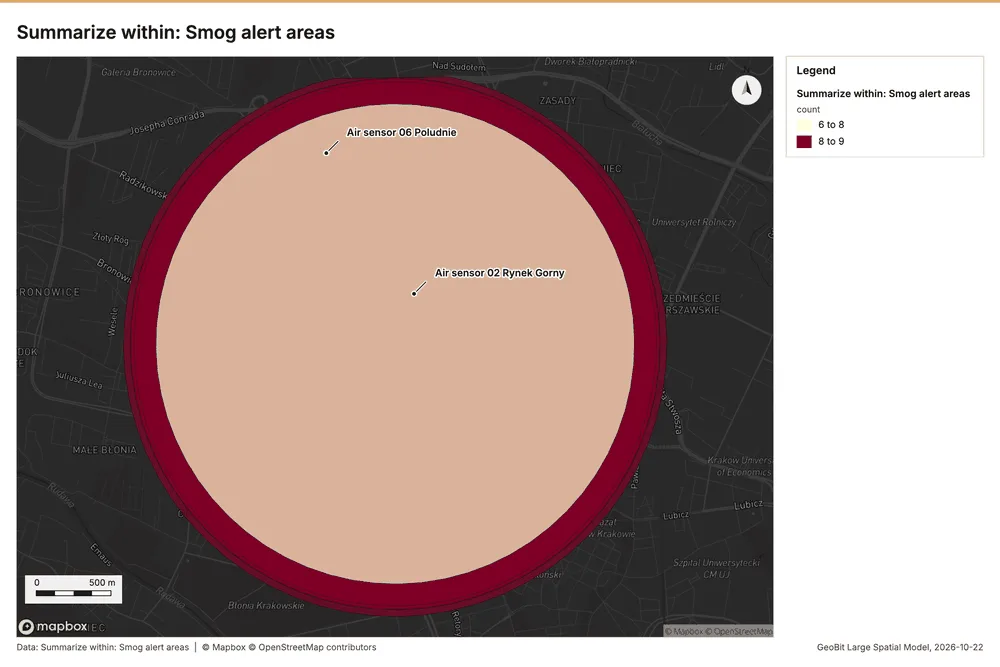
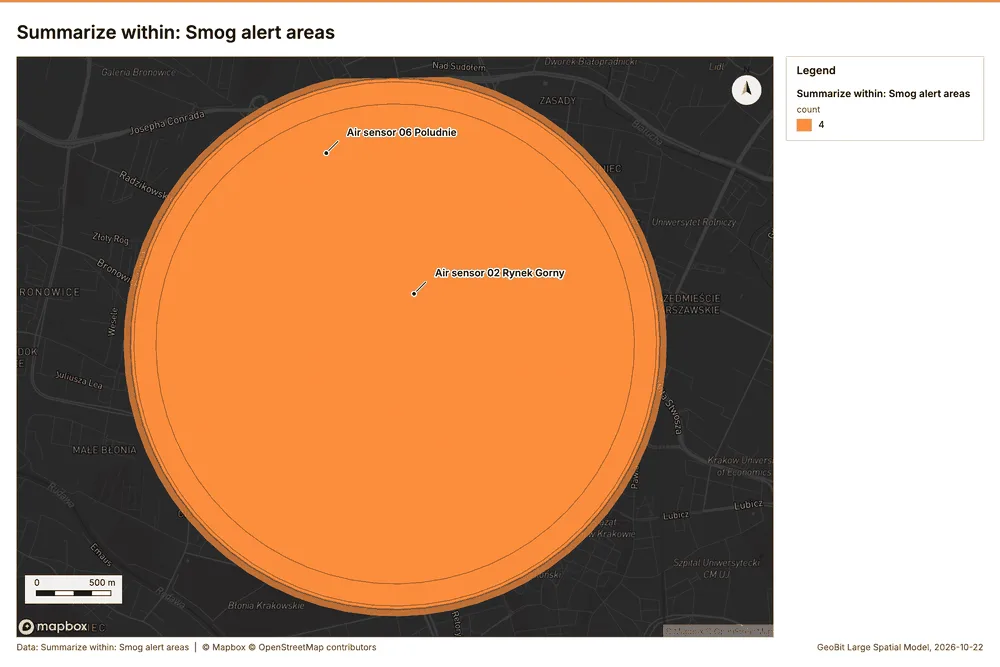
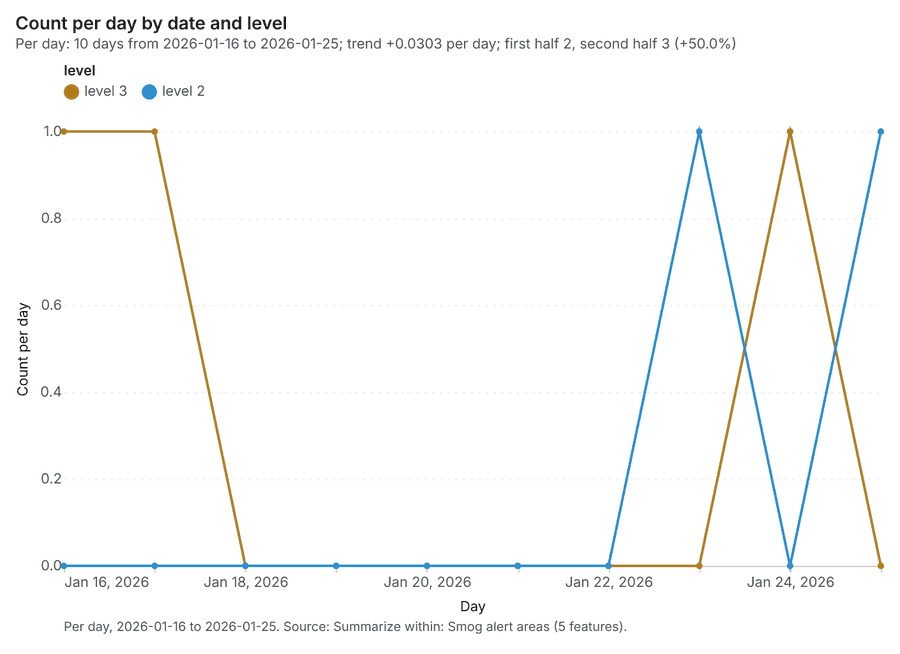
What it found. Summarize within on Schools, Smog alert areas: Summarize within: 1 layer saved: Summarize within: Smog alert areas (5 features) 151617. It reported result, count 5; result, elapsed ms 1; billing, cost 0.01112; billing, list price 0.01112; billing, upstream cost 0 15.
| Result | Value |
|---|---|
| result, count | 5 |
| result, elapsed ms | 1 |
| billing, cost | 0.01112 |
| billing, list price | 0.01112 |
| billing, upstream cost | 0 |
Findings
- Evidenced: Summarize within on Schools, Smog alert areas: Summarize within: 1 layer saved: Summarize within: Smog alert areas (5 features) 151617.
- Evidenced: It reported result, count 5; result, elapsed ms 1; billing, cost 0.01112; billing, list price 0.01112; billing, upstream cost 0 15.
Tool gp_summarize_within; parameters {"stats": [{"stat": "sum", "field": "pupils"}], "project": "941056ab-e59e-43ce-98fd-5b3678626f78", "features": {"layer": "Schools (04161d9b)"}, "polygons": {"layer": "Smog alert areas (cb491d16)"}}
Summarize within
What this analysis is. Summarize within: Count and aggregate the features inside each polygon (or bin), proportionally for lines and polygons 13. In ArcGIS it is Summarize Within or Aggregate Points; in QGIS, native:countpointsinpolygon or native:sumlinelengths 13.
Why it was run on this data. Count Schools inside each feature of Smog alert areas; the counts map as a choropleth (natural breaks, sequential colors) 14.
What it found. The process involved using the gp_summarize_within tool 18 to summarize data using smog alert areas 17 and traffic counters 19.
| Result | Value |
|---|---|
| result, count | 5 |
| result, elapsed ms | 0 |
| billing, cost | 0.01052 |
| billing, list price | 0.01052 |
| billing, upstream cost | 0 |
Findings
- Evidenced: Summarize within on Traffic counters, Smog alert areas: Summarize within: 1 layer saved: Summarize within: Smog alert areas (5 features) 171819.
- Evidenced: It reported result, count 5; result, elapsed ms 0; billing, cost 0.01052; billing, list price 0.01052; billing, upstream cost 0 18.
Tool gp_summarize_within; parameters {"stats": [{"stat": "sum", "field": "lanes"}], "project": "941056ab-e59e-43ce-98fd-5b3678626f78", "features": {"layer": "Traffic counters (2beeba9d)"}, "polygons": {"layer": "Smog alert areas (cb491d16)"}}
Hot spots
What this analysis is. Hot spot analysis: Getis-Ord Gi* hot and cold spots with z-scores, p-values and confidence bins 20. In ArcGIS it is Find Hot Spots or Hot Spot Analysis (Getis-Ord Gi*); in QGIS, qgis:hotspot (plugin) 20.
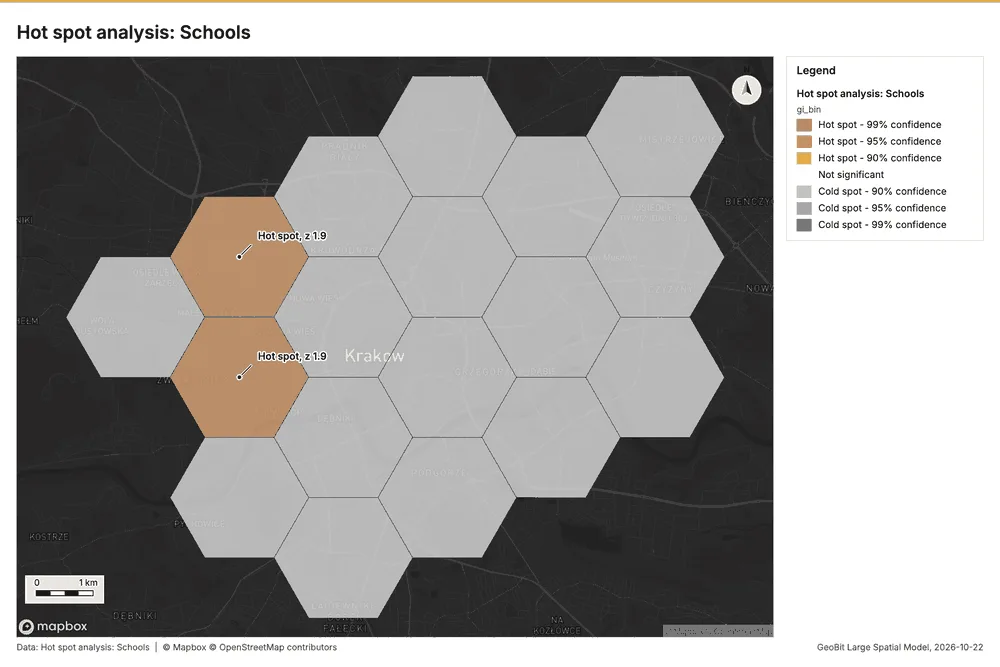
Why it was run on this data. 50 points: Getis-Ord Gi* tests whether the concentrations in Schools are statistically significant 21.
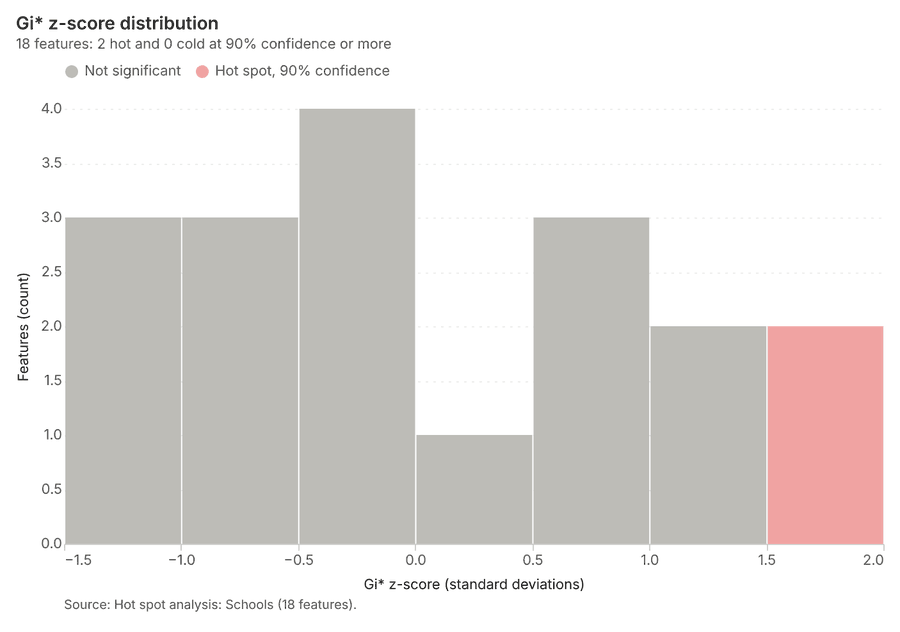
What it found. Hot spot analysis was run using the Schools layer as input 16, saving 1 layer with 18 features 22.
| Result | Value |
|---|---|
| result, bins | 18 |
| result, count | 18 |
| result, elapsed ms | 4 |
| result, cell size m | 2,000 |
| result, incidents used | 50 |
| result, distance band m | 2,000 |
| billing, cost | 0.051 |
| billing, list price | 0.051 |
| billing, upstream cost | 0 |
Findings
- Evidenced: Hot spots on Schools: Hot spot analysis: 1 layer saved: Hot spot analysis: Schools (18 features) 1622.
- Evidenced: It reported result, bins 18; result, count 18; result, elapsed ms 4; result, cell size m 2,000; result, incidents used 50; result, distance band m 2,000 22.
Tool gp_hot_spots; parameters {"project": "941056ab-e59e-43ce-98fd-5b3678626f78", "features": {"layer": "Schools (04161d9b)"}, "aggregation": "hexagon", "cell_size_m": 2000.0, "distance_band_m": 2000.0}
Hot spots
What this analysis is. Hot spot analysis: Getis-Ord Gi* hot and cold spots with z-scores, p-values and confidence bins 20. In ArcGIS it is Find Hot Spots or Hot Spot Analysis (Getis-Ord Gi*); in QGIS, qgis:hotspot (plugin) 20.
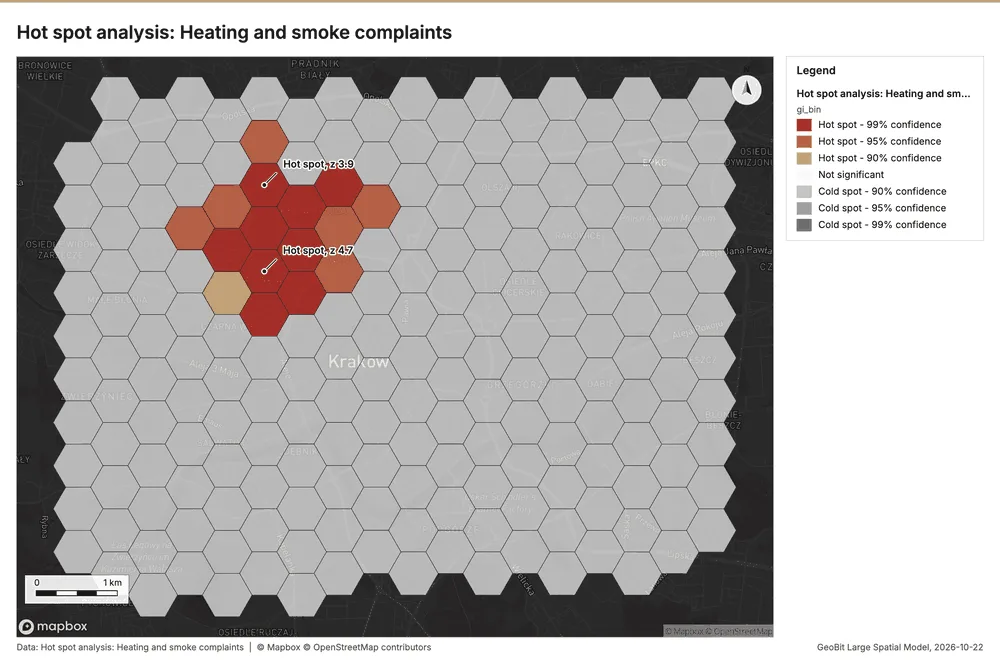
Why it was run on this data. 1000 points: Getis-Ord Gi* tests whether the concentrations in Heating and smoke complaints are statistically significant 23.
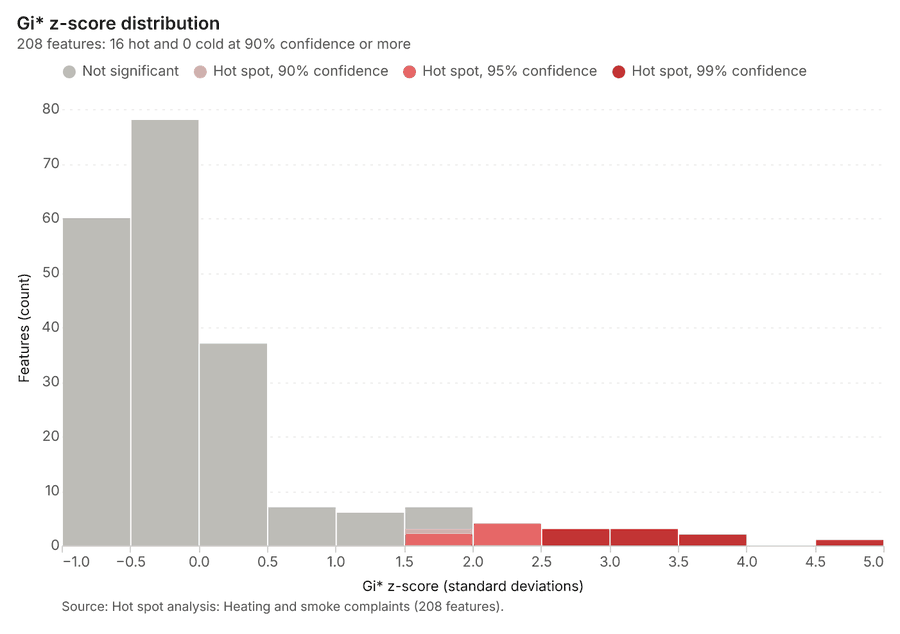
What it found. The hot spot analysis was performed using the Heating and smoke complaints layer 9. This process saved one layer titled Hot spot analysis: Heating and smoke complaints, containing 208 features 24. The analysis utilized 1,000 incidents and generated 208 results 24.
| Result | Value |
|---|---|
| result, bins | 208 |
| result, count | 208 |
| result, elapsed ms | 12 |
| result, cell size m | 500 |
| result, incidents used | 1,000 |
| result, distance band m | 500 |
| billing, cost | 0.07 |
| billing, list price | 0.07 |
| billing, upstream cost | 0 |
Findings
- Evidenced: Hot spots on Heating and smoke complaints: Hot spot analysis: 1 layer saved: Hot spot analysis: Heating and smoke complaints (208 features) 924.
- Evidenced: It reported result, bins 208; result, count 208; result, elapsed ms 12; result, cell size m 500; result, incidents used 1,000; result, distance band m 500 24.
Tool gp_hot_spots; parameters {"project": "941056ab-e59e-43ce-98fd-5b3678626f78", "features": {"layer": "Heating and smoke complaints (872e2359)"}, "aggregation": "hexagon", "cell_size_m": 500.0, "distance_band_m": 500.0}
Calculate density
What this analysis is. Calculate density: Kernel density per square kilometer on a grid 25. In ArcGIS it is Calculate Density or Kernel Density; in QGIS, native:heatmapkerneldensityestimation 25.
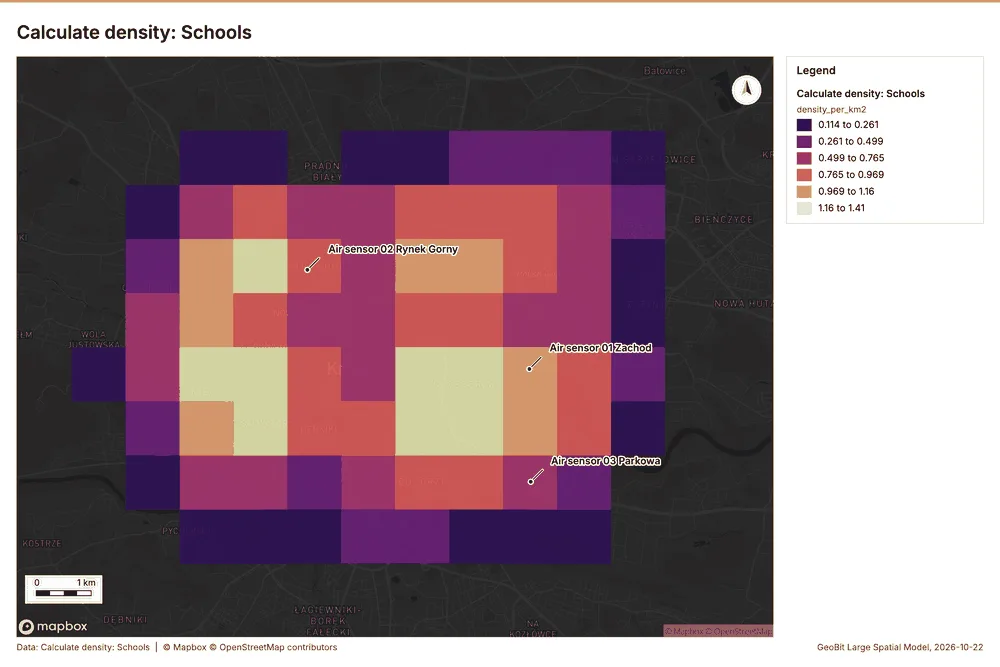
Why it was run on this data. 50 points in Schools: a density surface shows where they concentrate 26.
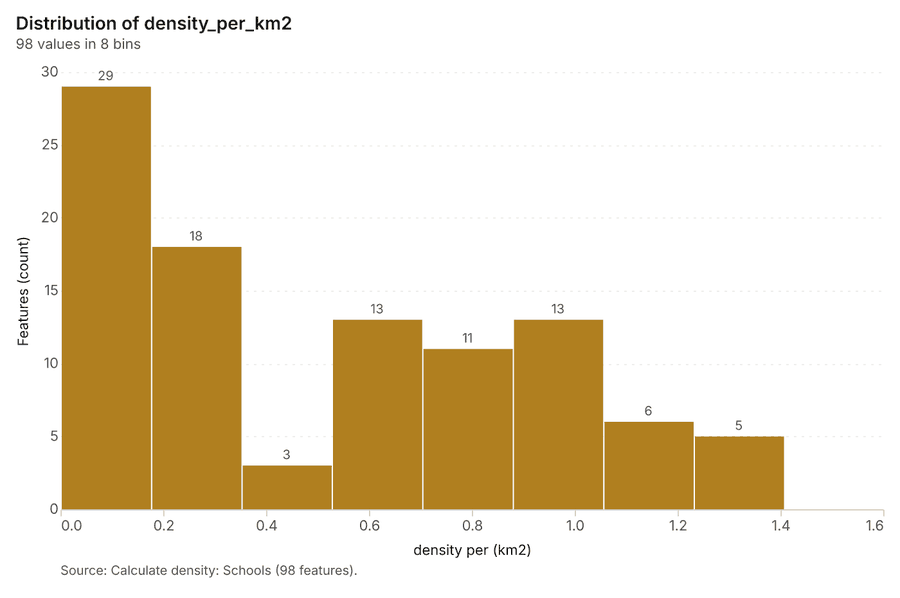
What it found. The calculation of density was performed using the Schools layer 16 and the gp_calculate_density tool 27. This process successfully analyzed 98 features 27. The maximum density detected over the area was 1.407 per km^2 27. Overall, the billing cost associated with this operation was 0.051 27.
| Result | Value |
|---|---|
| result, count | 98 |
| result, elapsed ms | 5 |
| result, bandwidth m | 2,000 |
| result, cell size m | 1,000 |
| result, excluded null | 0 |
| result, max density per km2 | 1.407 |
| billing, cost | 0.051 |
| billing, list price | 0.051 |
| billing, upstream cost | 0 |
Findings
- Evidenced: Calculate density on Schools: Calculate density: 1 layer saved: Calculate density: Schools (98 features) 1627.
- Evidenced: It reported result, count 98; result, elapsed ms 5; result, bandwidth m 2,000; result, cell size m 1,000; result, excluded null 0; result, max density per km2 1.407 27.
Tool gp_calculate_density; parameters {"kernel": "quartic", "project": "941056ab-e59e-43ce-98fd-5b3678626f78", "features": {"layer": "Schools (04161d9b)"}, "bandwidth_m": 2000.0, "cell_size_m": 1000.0}
Calculate density
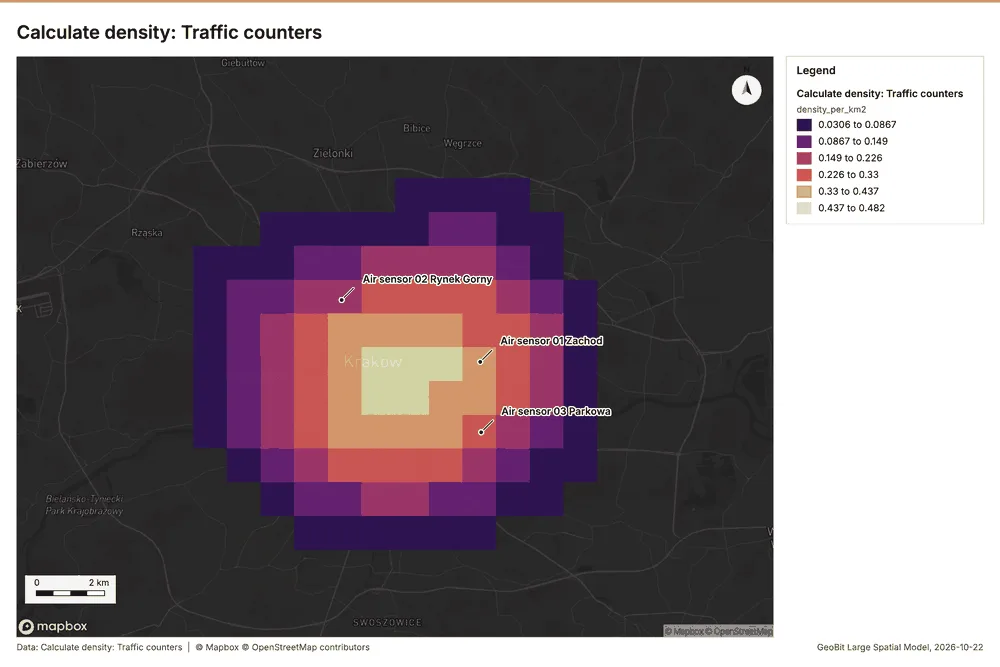
What this analysis is. Calculate density: Kernel density per square kilometer on a grid 25. In ArcGIS it is Calculate Density or Kernel Density; in QGIS, native:heatmapkerneldensityestimation 25.
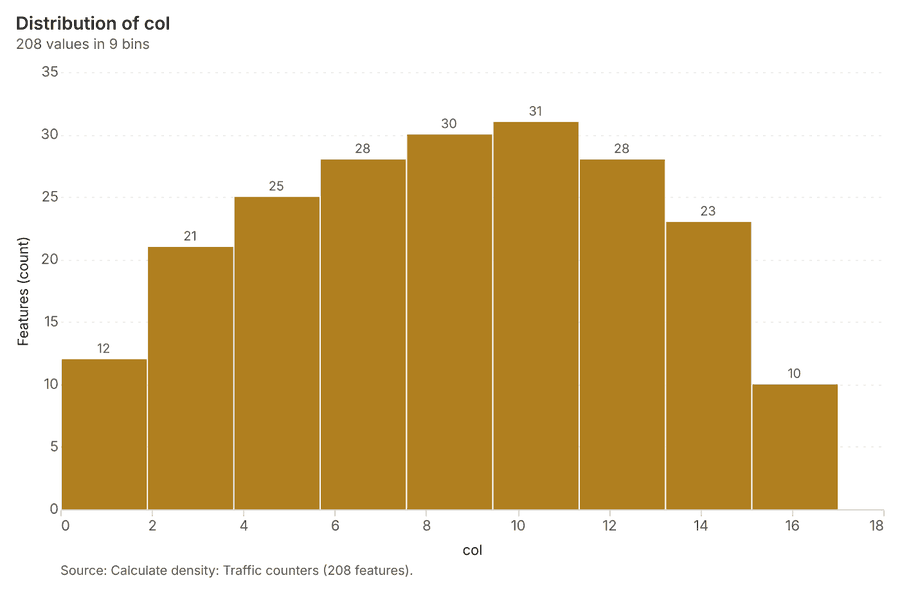
Why it was run on this data. 20 points in Traffic counters: a density surface shows where they concentrate 28.
What it found. Calculate density on Traffic counters: Calculate density: 1 layer saved: Calculate density: Traffic counters (208 features) 1929. It reported result, count 208; result, elapsed ms 6; result, bandwidth m 5,000; result, cell size m 1,000; result, excluded null 0; result, max density per km2 0.4822 29.
| Result | Value |
|---|---|
| result, count | 208 |
| result, elapsed ms | 6 |
| result, bandwidth m | 5,000 |
| result, cell size m | 1,000 |
| result, excluded null | 0 |
| result, max density per km2 | 0.4822 |
| billing, cost | 0.0504 |
| billing, list price | 0.0504 |
| billing, upstream cost | 0 |
Findings
- Evidenced: Calculate density on Traffic counters: Calculate density: 1 layer saved: Calculate density: Traffic counters (208 features) 1929.
- Evidenced: It reported result, count 208; result, elapsed ms 6; result, bandwidth m 5,000; result, cell size m 1,000; result, excluded null 0; result, max density per km2 0.4822 29.
Tool gp_calculate_density; parameters {"kernel": "quartic", "project": "941056ab-e59e-43ce-98fd-5b3678626f78", "features": {"layer": "Traffic counters (2beeba9d)"}, "bandwidth_m": 5000.0, "cell_size_m": 1000.0}
Calculate density
What this analysis is. Calculate density: Kernel density per square kilometer on a grid 25. In ArcGIS it is Calculate Density or Kernel Density; in QGIS, native:heatmapkerneldensityestimation 25.
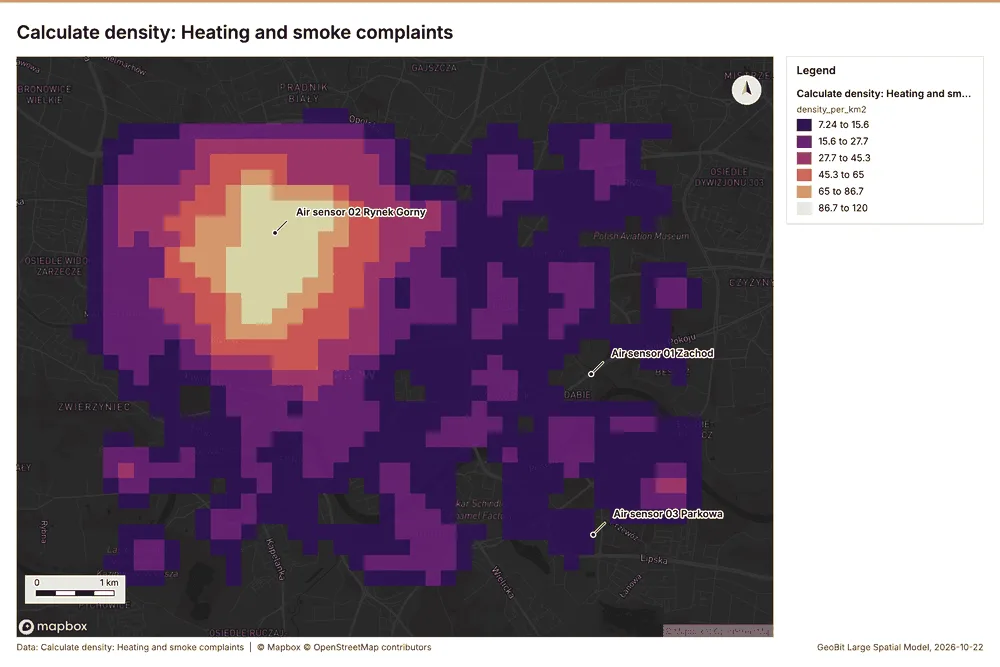
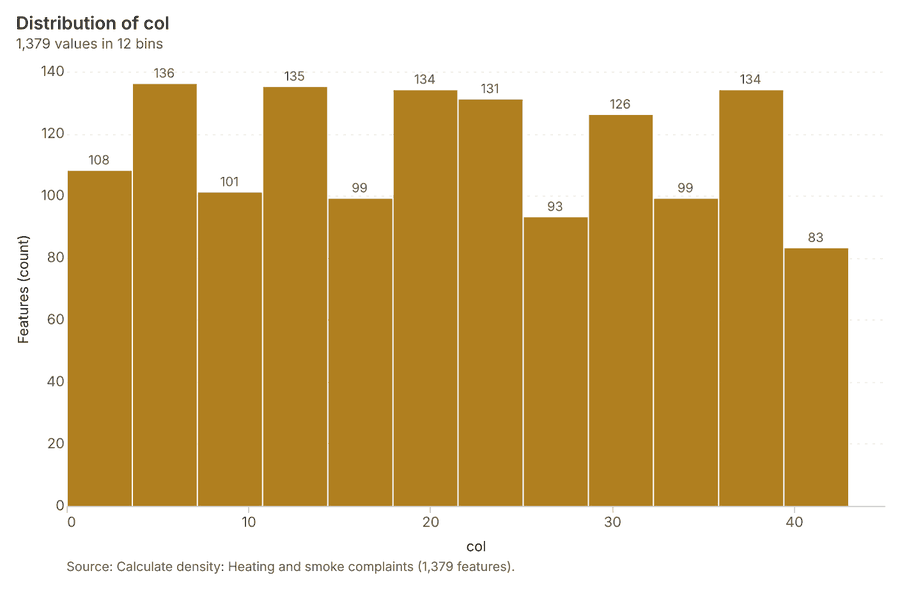
Why it was run on this data. 1000 points in Heating and smoke complaints: a density surface shows where they concentrate 30.
What it found. The calculation of density for heating and smoke complaints generated 1,379 features 31. This operation had a resulting elapsed time of 41 ms 31. Key metrics provided include a cell size of 200 m and an excluded null count of 0 31. The maximum density recorded was 120.2 per km2 31.
| Result | Value |
|---|---|
| result, count | 1,379 |
| result, elapsed ms | 41 |
| result, bandwidth m | 500 |
| result, cell size m | 200 |
| result, excluded null | 0 |
| result, max density per km2 | 120.2 |
| billing, cost | 0.07 |
| billing, list price | 0.07 |
| billing, upstream cost | 0 |
Findings
- Evidenced: Calculate density on Heating and smoke complaints: Calculate density: 1 layer saved: Calculate density: Heating and smoke complaints (1379 features) 931.
- Evidenced: It reported result, count 1,379; result, elapsed ms 41; result, bandwidth m 500; result, cell size m 200; result, excluded null 0; result, max density per km2 120.2 31.
Tool gp_calculate_density; parameters {"kernel": "quartic", "project": "941056ab-e59e-43ce-98fd-5b3678626f78", "features": {"layer": "Heating and smoke complaints (872e2359)"}, "bandwidth_m": 500.0, "cell_size_m": 200.0}
Find point clusters
What this analysis is. Find point clusters: Density-based clusters (DBSCAN, HDBSCAN or OPTICS, optionally space-time) with hulls and noise 32. In ArcGIS it is Find Point Clusters or Density-based Clustering; in QGIS, native:dbscanclustering or native:stdbscanclustering 32.
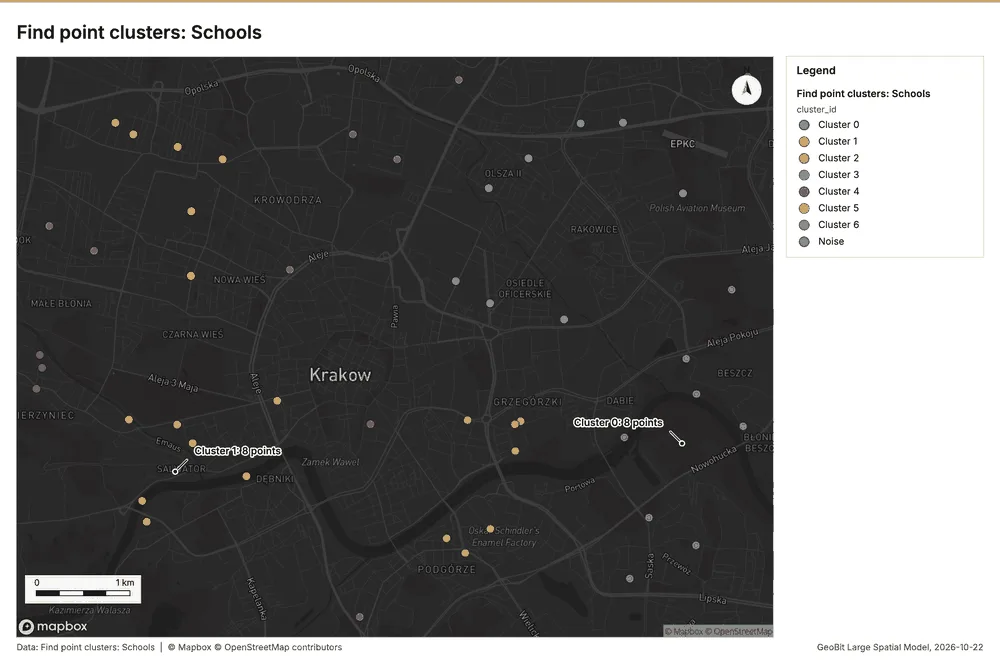
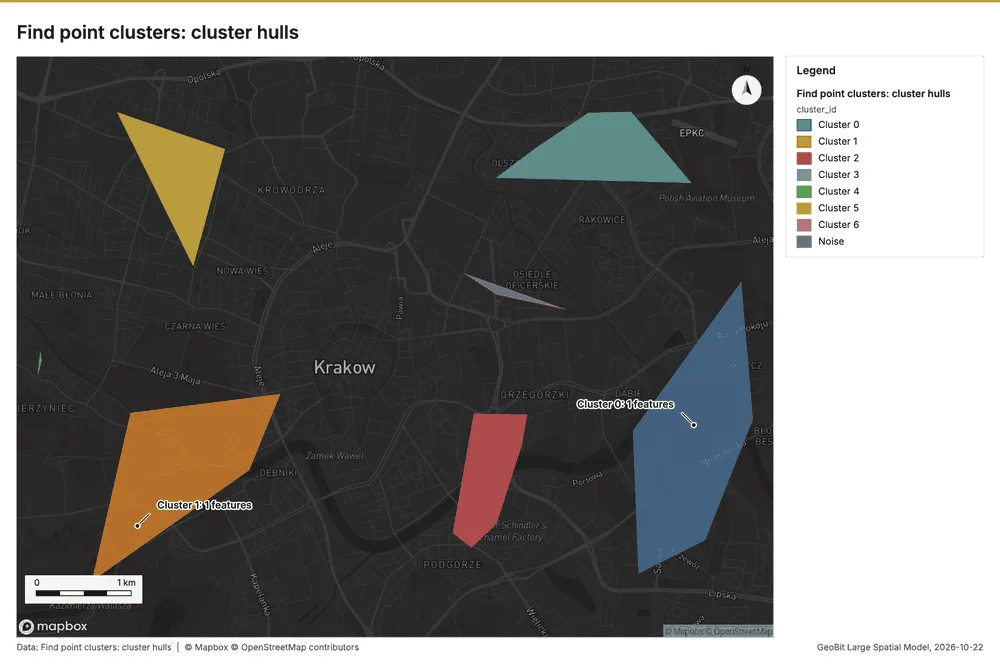
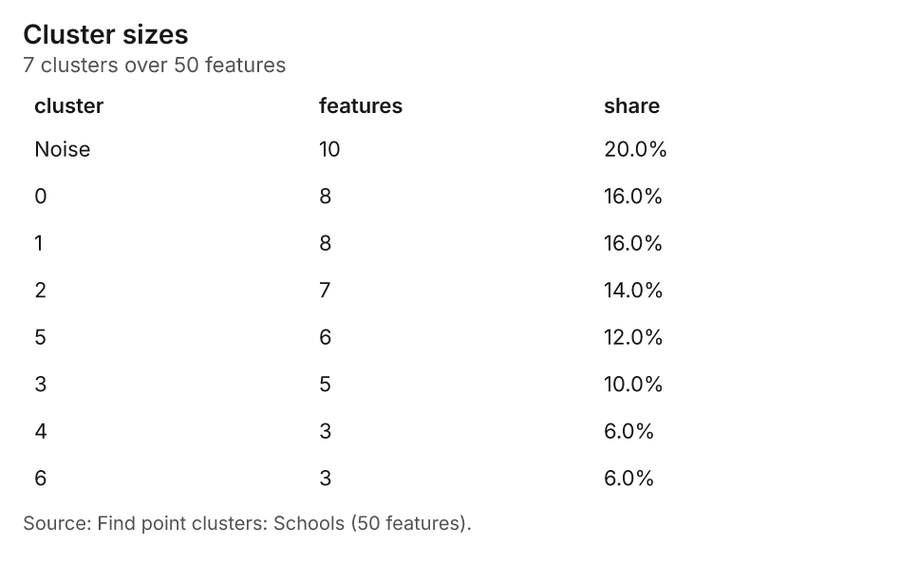
Why it was run on this data. DBSCAN finds dense groups of Schools and separates noise 33.
What it found. Find point clusters on Schools: Find point clusters: 2 layers saved: Find point clusters: Schools (50 features); Find point clusters: cluster hulls (7 features) 1634. It reported result, count 50; result, noise 10; result, distance m 1,000; result, elapsed ms 4; result, min points 3; billing, cost 0.051 34.
| Result | Value |
|---|---|
| result, count | 50 |
| result, noise | 10 |
| result, distance m | 1,000 |
| result, elapsed ms | 4 |
| result, min points | 3 |
| billing, cost | 0.051 |
| billing, list price | 0.051 |
| billing, upstream cost | 0 |
Findings
- Evidenced: Find point clusters on Schools: Find point clusters: 2 layers saved: Find point clusters: Schools (50 features); Find point clusters: cluster hulls (7 features) 1634.
- Evidenced: It reported result, count 50; result, noise 10; result, distance m 1,000; result, elapsed ms 4; result, min points 3; billing, cost 0.051 34.
Tool gp_find_point_clusters; parameters {"method": "dbscan", "project": "941056ab-e59e-43ce-98fd-5b3678626f78", "features": {"layer": "Schools (04161d9b)"}, "distance_m": 1000.0, "min_points": 3}
Find point clusters
What this analysis is. Find point clusters: Density-based clusters (DBSCAN, HDBSCAN or OPTICS, optionally space-time) with hulls and noise 32. In ArcGIS it is Find Point Clusters or Density-based Clustering; in QGIS, native:dbscanclustering or native:stdbscanclustering 32.
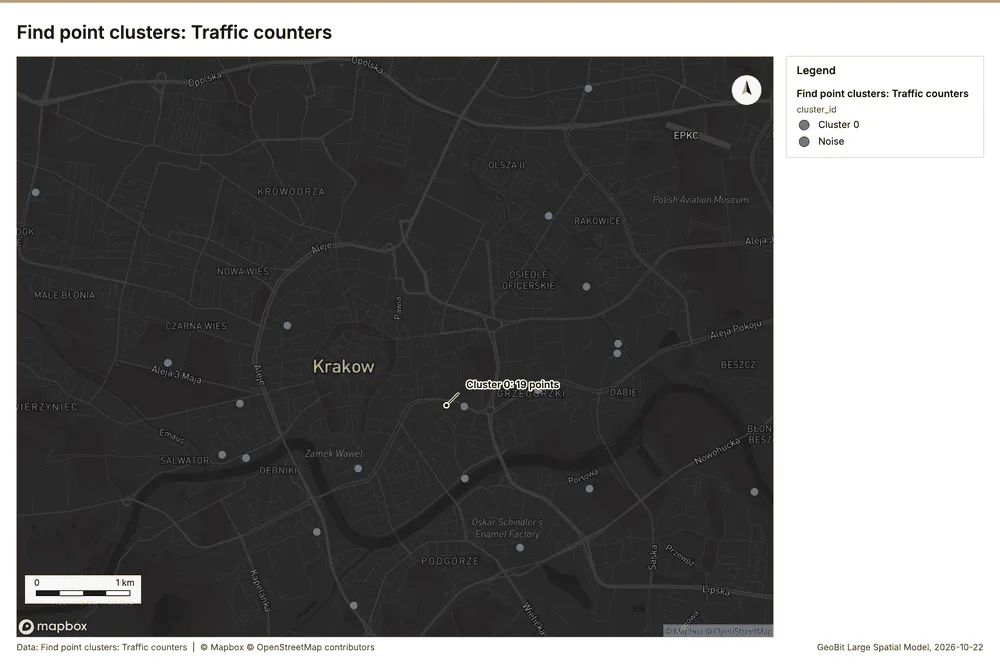
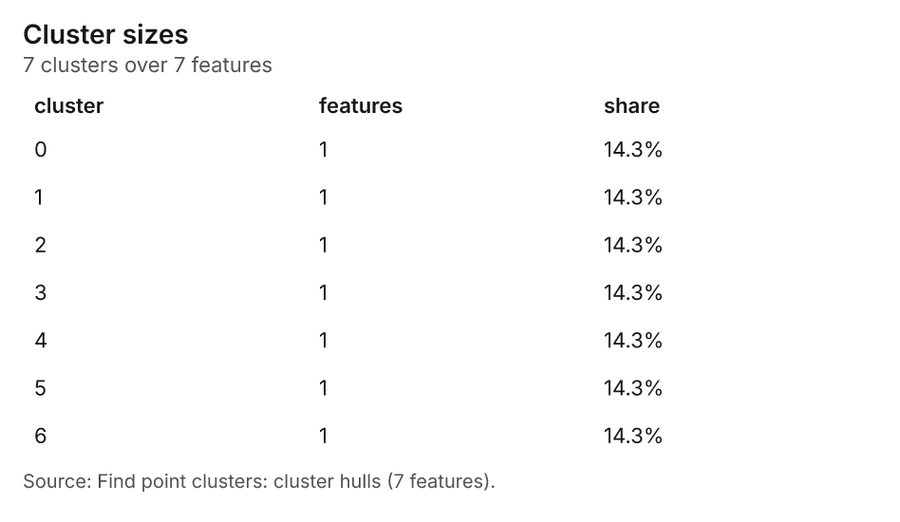
Why it was run on this data. DBSCAN finds dense groups of Traffic counters and separates noise 35.
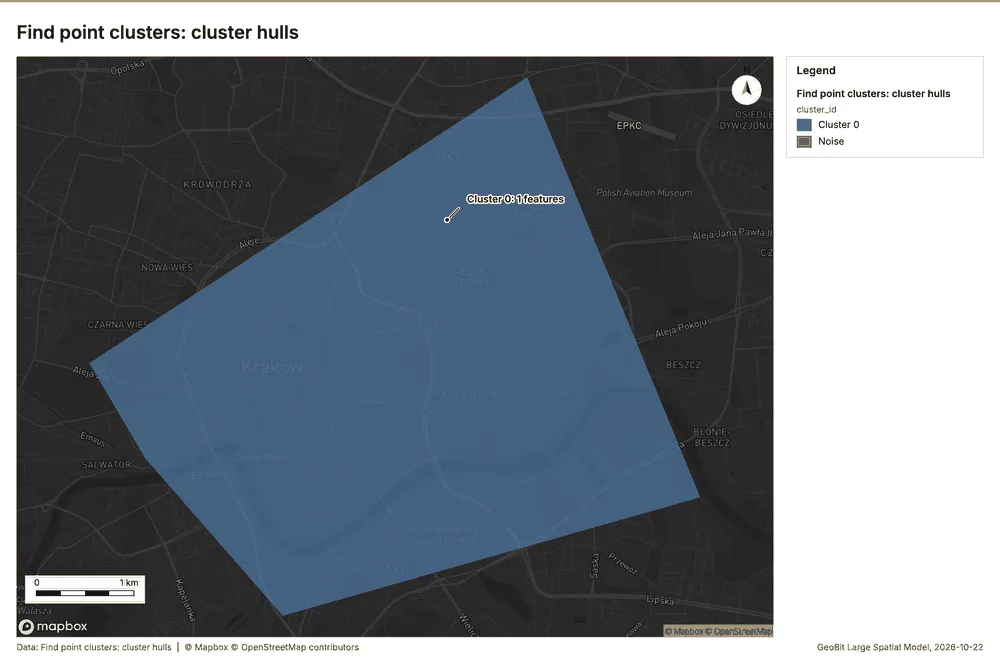
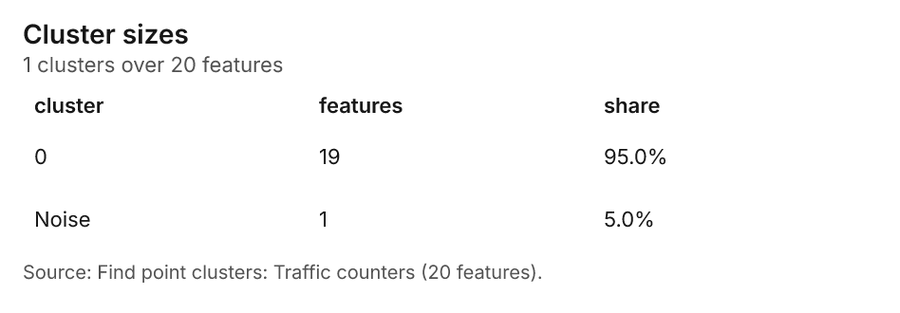
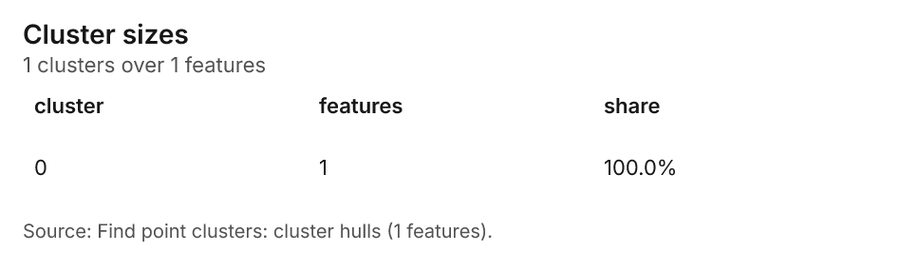
What it found. Find point clusters on Traffic counters: Find point clusters: 2 layers saved: Find point clusters: Traffic counters (20 features); Find point clusters: cluster hulls (1 feature) 1936. It reported result, count 20; result, noise 1; result, distance m 2,000; result, elapsed ms 1; result, min points 3; billing, cost 0.0504 36.
| Result | Value |
|---|---|
| result, count | 20 |
| result, noise | 1 |
| result, distance m | 2,000 |
| result, elapsed ms | 1 |
| result, min points | 3 |
| billing, cost | 0.0504 |
| billing, list price | 0.0504 |
| billing, upstream cost | 0 |
Findings
- Evidenced: Find point clusters on Traffic counters: Find point clusters: 2 layers saved: Find point clusters: Traffic counters (20 features); Find point clusters: cluster hulls (1 feature) 1936.
- Evidenced: It reported result, count 20; result, noise 1; result, distance m 2,000; result, elapsed ms 1; result, min points 3; billing, cost 0.0504 36.
A model draft was discarded because a sentence did not cite a source of this section.
Tool gp_find_point_clusters; parameters {"method": "dbscan", "project": "941056ab-e59e-43ce-98fd-5b3678626f78", "features": {"layer": "Traffic counters (2beeba9d)"}, "distance_m": 2000.0, "min_points": 3}
Find point clusters
What this analysis is. Find point clusters: Density-based clusters (DBSCAN, HDBSCAN or OPTICS, optionally space-time) with hulls and noise 32. In ArcGIS it is Find Point Clusters or Density-based Clustering; in QGIS, native:dbscanclustering or native:stdbscanclustering 32.
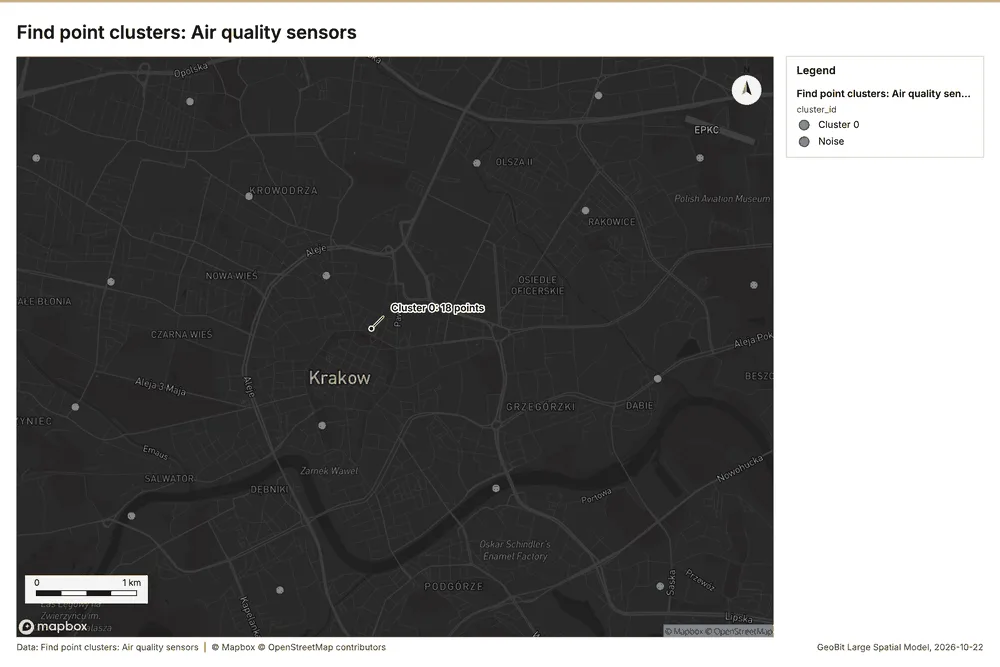
Why it was run on this data. DBSCAN finds dense groups of Air quality sensors and separates noise 37.
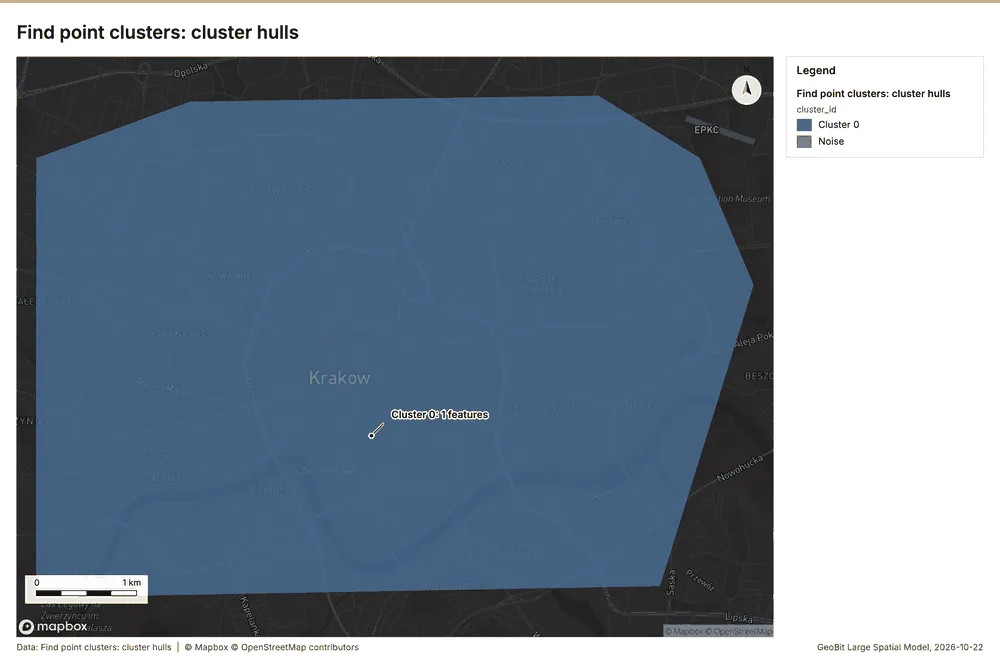
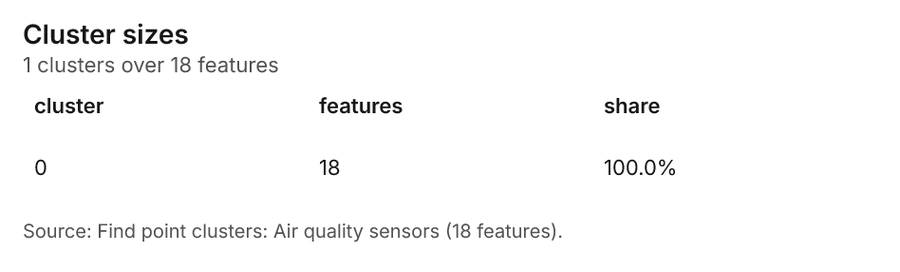
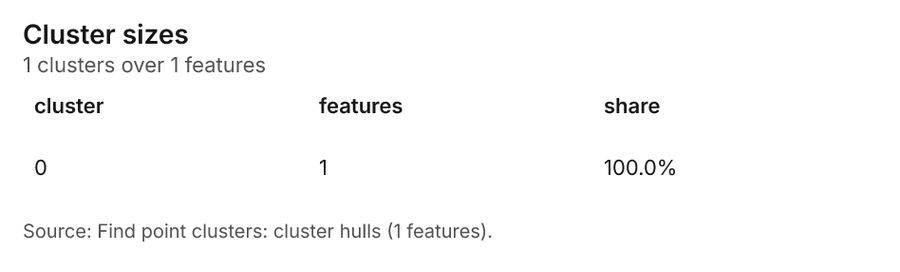
What it found. Find point clusters on Air quality sensors: Find point clusters: 2 layers saved: Find point clusters: Air quality sensors (18 features); Find point clusters: cluster hulls (1 feature) 3839. It reported result, count 18; result, noise 0; result, distance m 2,000; result, elapsed ms 1; result, min points 3; billing, cost 0.05036 38.
| Result | Value |
|---|---|
| result, count | 18 |
| result, noise | 0 |
| result, distance m | 2,000 |
| result, elapsed ms | 1 |
| result, min points | 3 |
| billing, cost | 0.05036 |
| billing, list price | 0.05036 |
| billing, upstream cost | 0 |
Findings
- Evidenced: Find point clusters on Air quality sensors: Find point clusters: 2 layers saved: Find point clusters: Air quality sensors (18 features); Find point clusters: cluster hulls (1 feature) 3839.
- Evidenced: It reported result, count 18; result, noise 0; result, distance m 2,000; result, elapsed ms 1; result, min points 3; billing, cost 0.05036 38.
Tool gp_find_point_clusters; parameters {"method": "dbscan", "project": "941056ab-e59e-43ce-98fd-5b3678626f78", "features": {"layer": "Air quality sensors (b023a603)"}, "distance_m": 2000.0, "min_points": 3}
Outliers
What this analysis is. Find outliers: Anselin local Moran’s I: HH, LL clusters and HL, LH outliers 40. In ArcGIS it is Find Outliers or Cluster and Outlier Analysis (Anselin Local Moran’s I) 40.
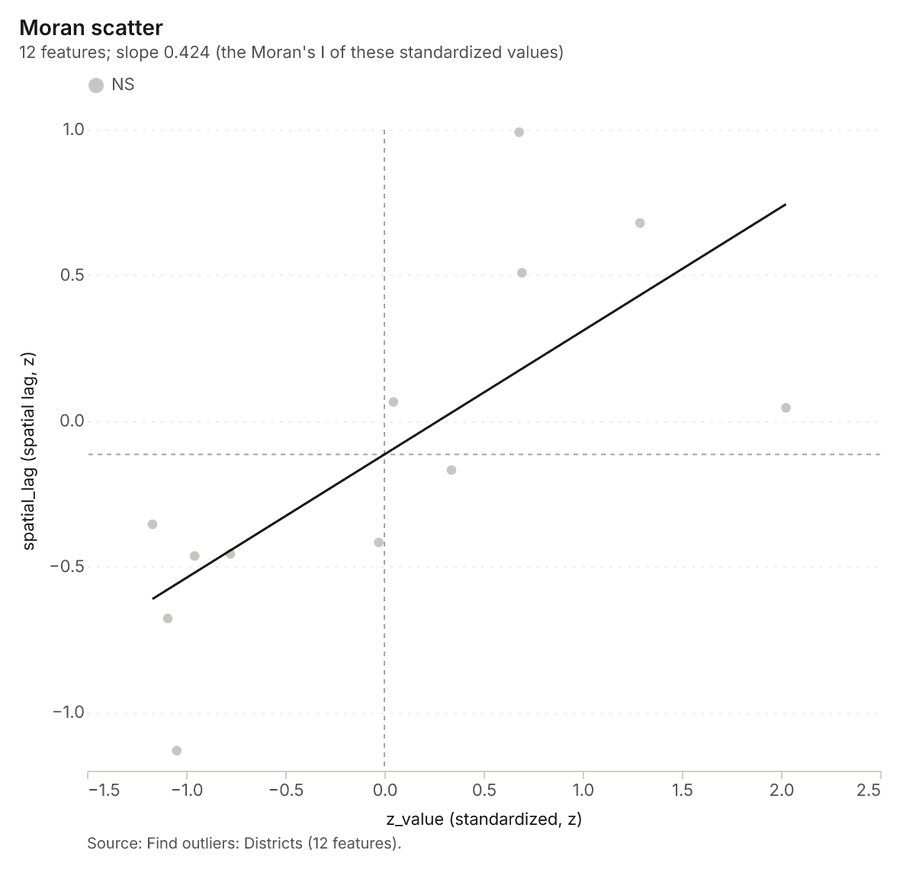
Why it was run on this data. Local Moran's I maps clusters and outliers of 'population' 41.
What it found. The outlier analysis utilized the Districts layer as input 43. The process successfully located 12 features within the Districts dataset 42.
| Result | Value |
|---|---|
| result, count | 12 |
| result, elapsed ms | 4 |
| result, permutations | 199 |
| result, excluded null | 0 |
| result, distance band m | 2,269 |
| billing, cost | 0.05036 |
| billing, list price | 0.05036 |
| billing, upstream cost | 0 |
Findings
- Evidenced: Outliers on Districts: Find outliers: 1 layer saved: Find outliers: Districts (12 features) 4243.
- Evidenced: It reported result, count 12; result, elapsed ms 4; result, permutations 199; result, excluded null 0; result, distance band m 2,269; billing, cost 0.05036 42.
Tool gp_outliers; parameters {"field": "population", "project": "941056ab-e59e-43ce-98fd-5b3678626f78", "features": {"layer": "Districts (cf8657b3)"}, "aggregation": "hexagon"}
Outliers
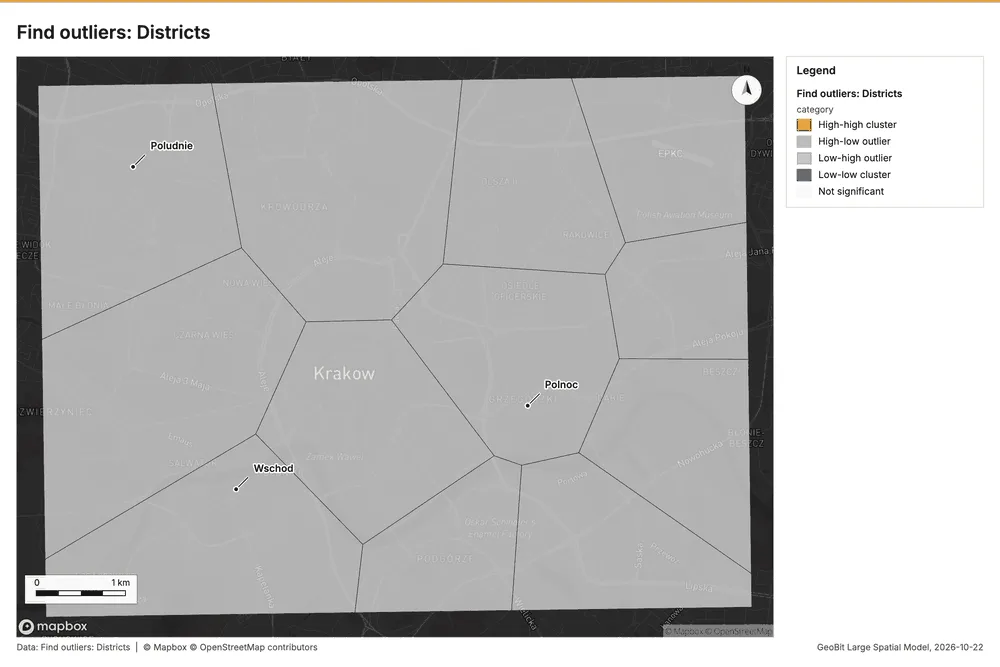
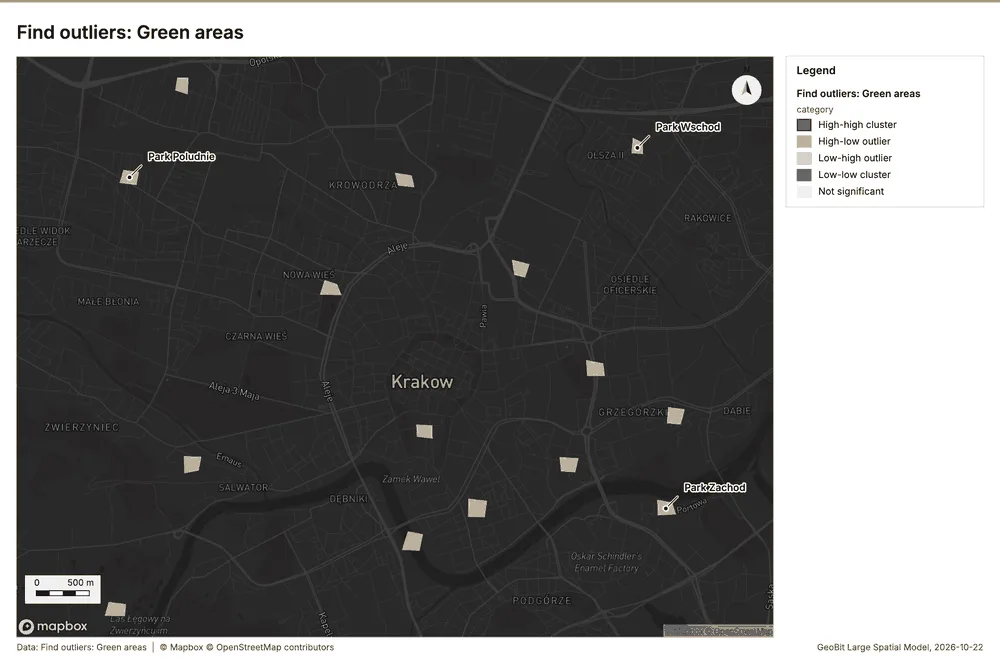
What this analysis is. Find outliers: Anselin local Moran’s I: HH, LL clusters and HL, LH outliers 40. In ArcGIS it is Find Outliers or Cluster and Outlier Analysis (Anselin Local Moran’s I) 40.
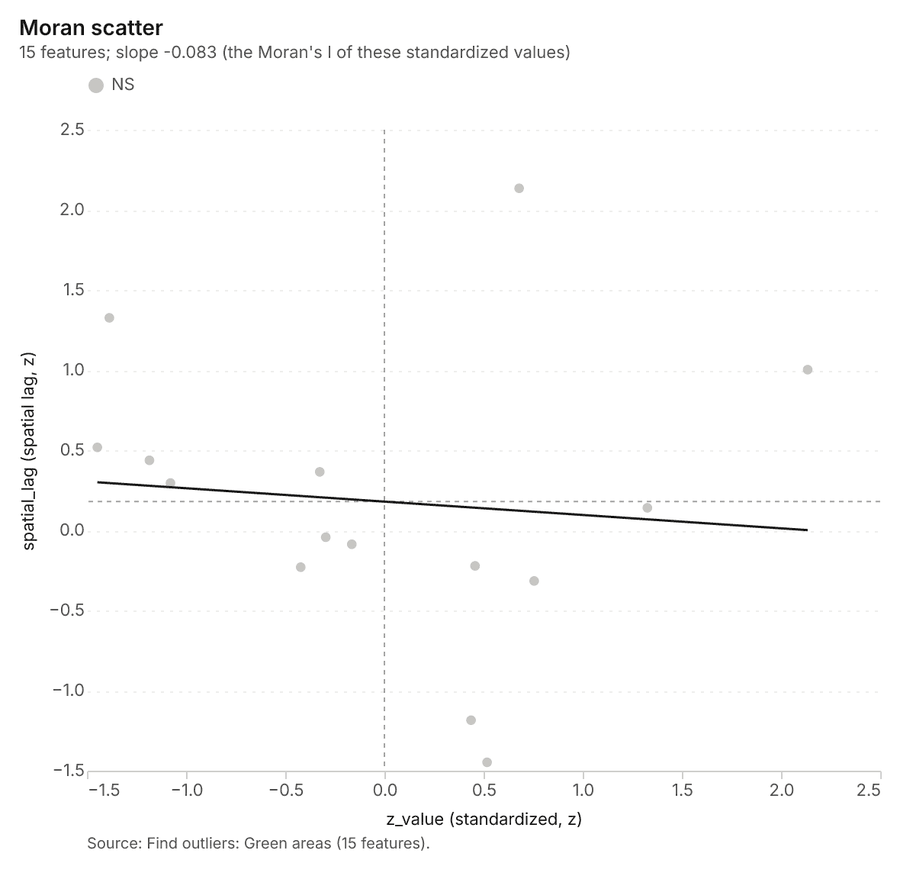
Why it was run on this data. Local Moran's I maps clusters and outliers of 'trees' 44.
What it found. Outliers on Green areas: Find outliers: 1 layer saved: Find outliers: Green areas (15 features) 4546. It reported result, count 15; result, elapsed ms 2; result, permutations 199; result, excluded null 0; result, distance band m 1,632; billing, cost 0.05045 45.
| Result | Value |
|---|---|
| result, count | 15 |
| result, elapsed ms | 2 |
| result, permutations | 199 |
| result, excluded null | 0 |
| result, distance band m | 1,632 |
| billing, cost | 0.05045 |
| billing, list price | 0.05045 |
| billing, upstream cost | 0 |
Findings
- Evidenced: Outliers on Green areas: Find outliers: 1 layer saved: Find outliers: Green areas (15 features) 4546.
- Evidenced: It reported result, count 15; result, elapsed ms 2; result, permutations 199; result, excluded null 0; result, distance band m 1,632; billing, cost 0.05045 45.
Tool gp_outliers; parameters {"field": "trees", "project": "941056ab-e59e-43ce-98fd-5b3678626f78", "features": {"layer": "Green areas (3858215c)"}, "aggregation": "hexagon"}
Spatial autocorrelation
What this analysis is. Spatial autocorrelation: Global Moran’s I: is the pattern clustered, dispersed or random 47. In ArcGIS it is Spatial Autocorrelation (Global Moran’s I) 47.
Why it was run on this data. Global Moran's I says whether similar values of 'population' sit next to each other 48.
What it found. Spatial autocorrelation on Districts: Spatial autocorrelation: done; no map output 4349. It reported result, n 12; result, p value 0.04188; result, z score 2.035; result, morans i 0.3603; result, variance 0.04918; result, elapsed ms 1 49.
| Result | Value |
|---|---|
| result, n | 12 |
| result, p value | 0.04188 |
| result, z score | 2.035 |
| result, morans i | 0.3603 |
| result, variance | 0.04918 |
| result, elapsed ms | 1 |
| result, expected i | -0.09091 |
| result, excluded null | 0 |
| result, distance band m | 2,269 |
| result, p value normality | 0.03746 |
| result, z score normality | 2.081 |
| result, variance normality | 0.04703 |
| billing, cost | 0.02 |
| billing, list price | 0.02 |
| billing, upstream cost | 0 |
Findings
- Evidenced: Spatial autocorrelation on Districts: Spatial autocorrelation: done; no map output 4349.
- Evidenced: It reported result, n 12; result, p value 0.04188; result, z score 2.035; result, morans i 0.3603; result, variance 0.04918; result, elapsed ms 1 49.
Tool gp_spatial_autocorrelation; parameters {"field": "population", "project": "941056ab-e59e-43ce-98fd-5b3678626f78", "features": {"layer": "Districts (cf8657b3)"}}
Summarize within
What this analysis is. Summarize within: Count and aggregate the features inside each polygon (or bin), proportionally for lines and polygons 13. In ArcGIS it is Summarize Within or Aggregate Points; in QGIS, native:countpointsinpolygon or native:sumlinelengths 13.
Why it was run on this data. Count Air quality sensors inside each feature of Smog alert areas by model; the counts map as a choropleth (natural breaks, sequential colors) 50.
What it found. Summarize within on Air quality sensors, Smog alert areas: Summarize within: 1 layer saved: Summarize within: Smog alert areas (5 features) 173951. It reported result, count 5; result, elapsed ms 1; billing, cost 0.01048; billing, list price 0.01048; billing, upstream cost 0 51.
| Result | Value |
|---|---|
| result, count | 5 |
| result, elapsed ms | 1 |
| billing, cost | 0.01048 |
| billing, list price | 0.01048 |
| billing, upstream cost | 0 |
Findings
- Evidenced: Summarize within on Air quality sensors, Smog alert areas: Summarize within: 1 layer saved: Summarize within: Smog alert areas (5 features) 173951.
- Evidenced: It reported result, count 5; result, elapsed ms 1; billing, cost 0.01048; billing, list price 0.01048; billing, upstream cost 0 51.
Tool gp_summarize_within; parameters {"stats": [{"stat": "sum", "field": "height_m"}], "project": "941056ab-e59e-43ce-98fd-5b3678626f78", "features": {"layer": "Air quality sensors (b023a603)"}, "group_by": "model", "polygons": {"layer": "Smog alert areas (cb491d16)"}}
Maps and charts
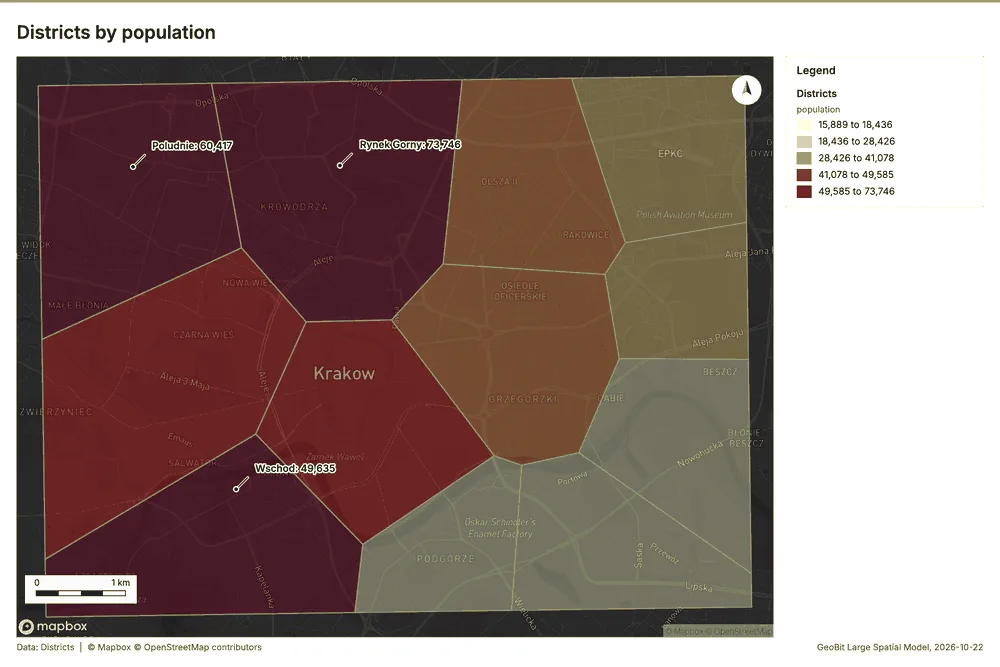
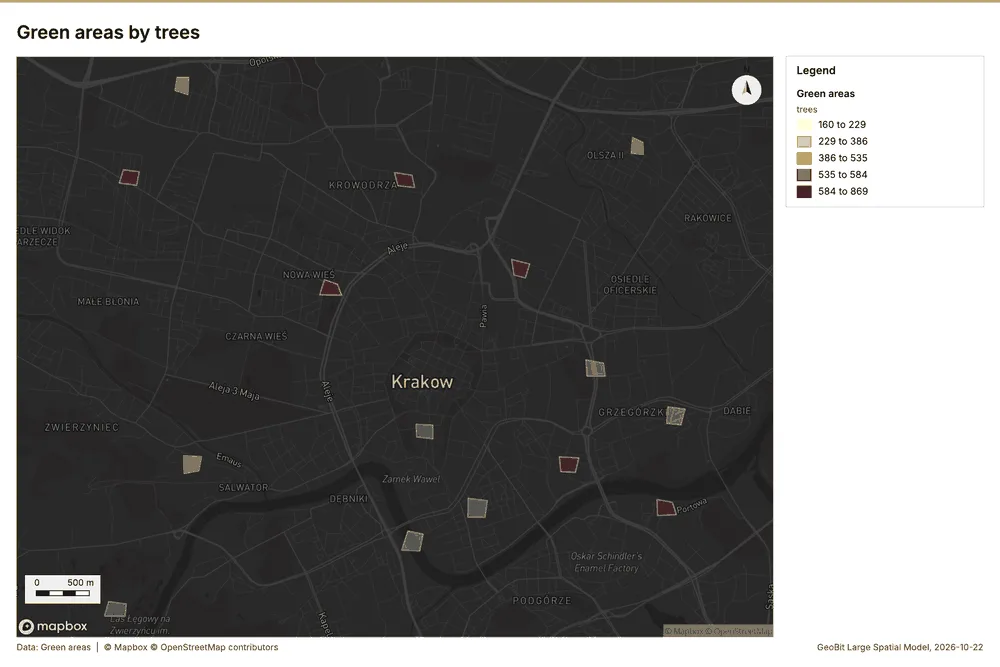
The run also made 20 map image(s) 5253545556575859606162636465666768697071 and 26 chart(s) 7273747576777879808182838485868788899091929394959697.
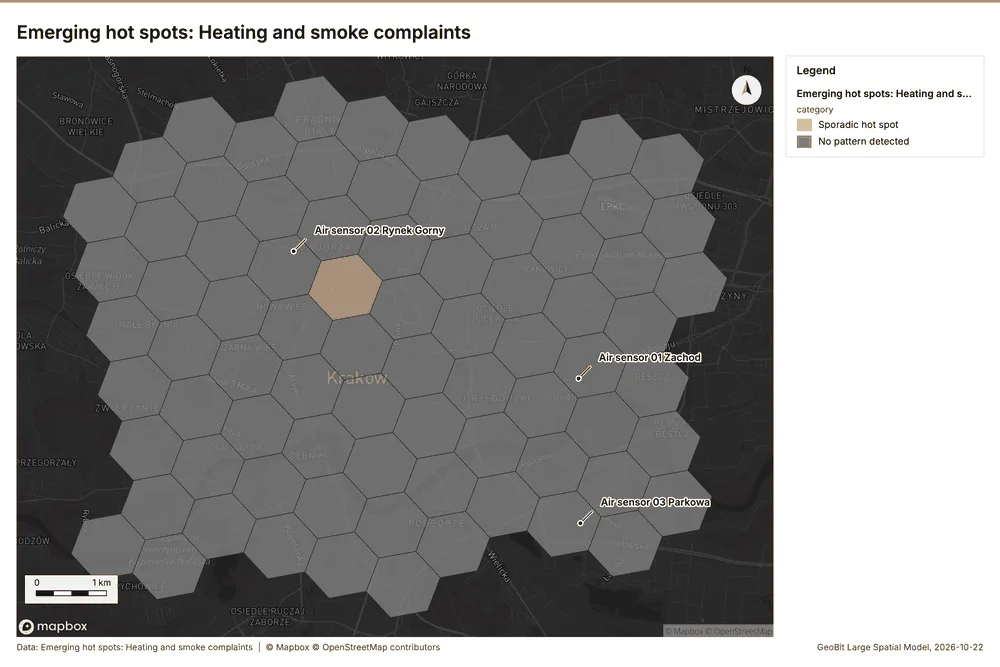
What the map shows. The map displays the analysis of "Heating and smoke complaints" across a grid of cells, according to the provided legend. The overwhelming majority of the mapped area is coloured grey, indicating that "No pattern detected" was found in most locations. There is a small cluster of adjacent hexagonal cells near the center of the map that are coloured orange, signifying a "Sporadic hot spot." These few sporadic hot spots are tightly grouped together in a specific area, standing out against the wide expanse of areas showing no discernible pattern. 52
Inferred: read from the image by gemma4:e4b, not evidence.
Changes since the last run
This is the first report of this project.
Sources
- 1Rendering: Chart: Timeline: events per week by dataset. 108 rows id a084bcb1-4ebb-4e02-a2b5-e0989f373da4
- 2Dataset: Sensor readings every three hours. table, 3024 rows id 0d15a1c1-4e15-46ed-8bc1-8aa3d29ccbcd
- 3Dataset: Heating and smoke complaints. vector, 1000 rows id f4580557-af68-44bb-8bac-c0ee2ee81164
- 4Dataset: Traffic counts by day. table, 420 rows id 4dddb911-3782-4522-b33f-66a0810f4308
- 5Dataset: Smog alert areas. vector, 5 rows id 1797fddc-1ecb-4d65-bb9d-8c24fbce0b84
- 6Catalog: Emerging hot spots (operation catalog, gp_space_time_hot_spots). Where hot spots are new, consecutive, intensifying, persistent, diminishing, sporadic, oscillating or historical over time. ArcGIS: Emerging Hot Spot Analysis, Create Space Time Cube. id gp_space_time_hot_spots
- 7Plan: Space time hot spots of Heating and smoke complaints (the Start plan's candidate c_d98590d93cd6). Heating and smoke complaints carry dates in 'reported_at': emerging hot spot analysis finds new, intensifying and fading hot spots per week. id 73000d9f-3676-479d-bf5e-7209c2669a39:c_d98590d93cd6
- 8Tool result: gp_space_time_hot_spots, step 0. Emerging hot spots: 1 layer saved: Emerging hot spots: Heating and smoke complaints (79 features). id e2bffa10-d83f-4078-a978-5b42d657bad7:0
- 9Layer: Heating and smoke complaints. 1,000 features id 872e2359-4c4f-4b1c-a353-f558b419ae1b
- 10Catalog: Repeat and near repeat classification (operation catalog, gp_near_repeat). Classify incidents as originators, repeats (same place) or near repeats within a distance and time window, with a Knox test table. ArcGIS: Repeat and Near Repeat Classification, Near Repeat Calculator. id gp_near_repeat
- 11Plan: Near repeat of Heating and smoke complaints (the Start plan's candidate c_ba6e8fc6e4b1). Near repeat analysis tests whether Heating and smoke complaints close in space also follow each other within 18 days. id 73000d9f-3676-479d-bf5e-7209c2669a39:c_ba6e8fc6e4b1
- 12Tool result: gp_near_repeat, step 1. Repeat and near repeat classification: 1 layer saved: Repeat and near repeat classification: Heating and smoke complaints (1000 features). id e2bffa10-d83f-4078-a978-5b42d657bad7:1
- 13Catalog: Summarize within (operation catalog, gp_summarize_within). Count and aggregate the features inside each polygon (or bin), proportionally for lines and polygons. ArcGIS: Summarize Within, Aggregate Points. QGIS: native:countpointsinpolygon, native:sumlinelengths. id gp_summarize_within
- 14Plan: Schools per feature of Smog alert areas (the Start plan's candidate c_fe1717bec4eb). Count Schools inside each feature of Smog alert areas; the counts map as a choropleth (natural breaks, sequential colors). id 73000d9f-3676-479d-bf5e-7209c2669a39:c_fe1717bec4eb
- 15Tool result: gp_summarize_within, step 0. Summarize within: 1 layer saved: Summarize within: Smog alert areas (5 features). id 11b23637-45df-4d60-b9d3-92ec6e1a9142:0
- 16Layer: Schools. 50 features id 04161d9b-b772-49f5-b451-f05a72c11340
- 17Layer: Smog alert areas. 5 features id cb491d16-8d66-4ca9-8a0c-b0cca331df73
- 18Tool result: gp_summarize_within, step 1. Summarize within: 1 layer saved: Summarize within: Smog alert areas (5 features). id 11b23637-45df-4d60-b9d3-92ec6e1a9142:1
- 19Layer: Traffic counters. 20 features id 2beeba9d-323f-4f1e-919a-5e066c70311f
- 20Catalog: Hot spot analysis (operation catalog, gp_hot_spots). Getis-Ord Gi* hot and cold spots with z-scores, p-values and confidence bins. ArcGIS: Find Hot Spots, Hot Spot Analysis (Getis-Ord Gi*). QGIS: qgis:hotspot (plugin). id gp_hot_spots
- 21Plan: Hot spots of Schools (the Start plan's candidate c_b9bfdeef42df). 50 points: Getis-Ord Gi* tests whether the concentrations in Schools are statistically significant. id 73000d9f-3676-479d-bf5e-7209c2669a39:c_b9bfdeef42df
- 22Tool result: gp_hot_spots, step 0. Hot spot analysis: 1 layer saved: Hot spot analysis: Schools (18 features). id ce105be5-3779-4e96-a7f2-284b760484a5:0
- 23Plan: Hot spots of Heating and smoke complaints (the Start plan's candidate c_8ba28202f6a2). 1000 points: Getis-Ord Gi* tests whether the concentrations in Heating and smoke complaints are statistically significant. id 73000d9f-3676-479d-bf5e-7209c2669a39:c_8ba28202f6a2
- 24Tool result: gp_hot_spots, step 1. Hot spot analysis: 1 layer saved: Hot spot analysis: Heating and smoke complaints (208 features). id ce105be5-3779-4e96-a7f2-284b760484a5:1
- 25Catalog: Calculate density (operation catalog, gp_calculate_density). Kernel density per square kilometer on a grid. ArcGIS: Calculate Density, Kernel Density. QGIS: native:heatmapkerneldensityestimation. id gp_calculate_density
- 26Plan: Kernel density of Schools (the Start plan's candidate c_b5b20e7ef97c). 50 points in Schools: a density surface shows where they concentrate. id 73000d9f-3676-479d-bf5e-7209c2669a39:c_b5b20e7ef97c
- 27Tool result: gp_calculate_density, step 0. Calculate density: 1 layer saved: Calculate density: Schools (98 features). id f7011d1b-ef58-4060-8cda-1a0a0ec3fb50:0
- 28Plan: Kernel density of Traffic counters (the Start plan's candidate c_5380a4ae623b). 20 points in Traffic counters: a density surface shows where they concentrate. id 73000d9f-3676-479d-bf5e-7209c2669a39:c_5380a4ae623b
- 29Tool result: gp_calculate_density, step 1. Calculate density: 1 layer saved: Calculate density: Traffic counters (208 features). id f7011d1b-ef58-4060-8cda-1a0a0ec3fb50:1
- 30Plan: Kernel density of Heating and smoke complaints (the Start plan's candidate c_0cb7c2c39d34). 1000 points in Heating and smoke complaints: a density surface shows where they concentrate. id 73000d9f-3676-479d-bf5e-7209c2669a39:c_0cb7c2c39d34
- 31Tool result: gp_calculate_density, step 2. Calculate density: 1 layer saved: Calculate density: Heating and smoke complaints (1379 features). id f7011d1b-ef58-4060-8cda-1a0a0ec3fb50:2
- 32Catalog: Find point clusters (operation catalog, gp_find_point_clusters). Density-based clusters (DBSCAN, HDBSCAN or OPTICS, optionally space-time) with hulls and noise. ArcGIS: Find Point Clusters, Density-based Clustering. QGIS: native:dbscanclustering, native:stdbscanclustering. id gp_find_point_clusters
- 33Plan: Cluster points of Schools (the Start plan's candidate c_9dae65ce7c51). DBSCAN finds dense groups of Schools and separates noise. id 73000d9f-3676-479d-bf5e-7209c2669a39:c_9dae65ce7c51
- 34Tool result: gp_find_point_clusters, step 0. Find point clusters: 2 layers saved: Find point clusters: Schools (50 features); Find point clusters: cluster hulls (7 features). id 17da64d0-c62f-4bc1-b36b-a20be986149f:0
- 35Plan: Cluster points of Traffic counters (the Start plan's candidate c_5a43af034293). DBSCAN finds dense groups of Traffic counters and separates noise. id 73000d9f-3676-479d-bf5e-7209c2669a39:c_5a43af034293
- 36Tool result: gp_find_point_clusters, step 1. Find point clusters: 2 layers saved: Find point clusters: Traffic counters (20 features); Find point clusters: cluster hulls (1 feature). id 17da64d0-c62f-4bc1-b36b-a20be986149f:1
- 37Plan: Cluster points of Air quality sensors (the Start plan's candidate c_82728615a157). DBSCAN finds dense groups of Air quality sensors and separates noise. id 73000d9f-3676-479d-bf5e-7209c2669a39:c_82728615a157
- 38Tool result: gp_find_point_clusters, step 2. Find point clusters: 2 layers saved: Find point clusters: Air quality sensors (18 features); Find point clusters: cluster hulls (1 feature). id 17da64d0-c62f-4bc1-b36b-a20be986149f:2
- 39Layer: Air quality sensors. 18 features id b023a603-7600-43b0-b1a5-263889cc78ec
- 40Catalog: Find outliers (operation catalog, gp_outliers). Anselin local Moran’s I: HH, LL clusters and HL, LH outliers. ArcGIS: Find Outliers, Cluster and Outlier Analysis (Anselin Local Moran’s I). id gp_outliers
- 41Plan: Local morans i of Districts (the Start plan's candidate c_4dc818ee3a6e). Local Moran's I maps clusters and outliers of 'population'. id 73000d9f-3676-479d-bf5e-7209c2669a39:c_4dc818ee3a6e
- 42Tool result: gp_outliers, step 0. Find outliers: 1 layer saved: Find outliers: Districts (12 features). id d6fde80f-96aa-463a-8668-577f95febf04:0
- 43Layer: Districts. 12 features id cf8657b3-2d43-4636-9390-17763a61ba4a
- 44Plan: Local morans i of Green areas (the Start plan's candidate c_ade852c64875). Local Moran's I maps clusters and outliers of 'trees'. id 73000d9f-3676-479d-bf5e-7209c2669a39:c_ade852c64875
- 45Tool result: gp_outliers, step 1. Find outliers: 1 layer saved: Find outliers: Green areas (15 features). id d6fde80f-96aa-463a-8668-577f95febf04:1
- 46Layer: Green areas. 15 features id 3858215c-dede-4b5d-bb9d-c7026b082281
- 47Catalog: Spatial autocorrelation (operation catalog, gp_spatial_autocorrelation). Global Moran’s I: is the pattern clustered, dispersed or random. ArcGIS: Spatial Autocorrelation (Global Moran’s I). id gp_spatial_autocorrelation
- 48Plan: Global morans i of Districts (the Start plan's candidate c_e7dbd09fdbfe). Global Moran's I says whether similar values of 'population' sit next to each other. id 73000d9f-3676-479d-bf5e-7209c2669a39:c_e7dbd09fdbfe
- 49Tool result: gp_spatial_autocorrelation, step 2. Spatial autocorrelation: done; no map output. id d6fde80f-96aa-463a-8668-577f95febf04:2
- 50Plan: Air quality sensors per feature of Smog alert areas (the Start plan's candidate c_9e70122240f8). Count Air quality sensors inside each feature of Smog alert areas by model; the counts map as a choropleth (natural breaks, sequential colors). id 73000d9f-3676-479d-bf5e-7209c2669a39:c_9e70122240f8
- 51Tool result: gp_summarize_within, step 0. Summarize within: 1 layer saved: Summarize within: Smog alert areas (5 features). id 9293aa84-ac7f-4f7b-98ff-5dd6fd0e80c3:0
- 52Rendering: Map: Emerging hot spots: Heating and smoke complaints id ef0fba2c-3dab-44c8-8d1b-37950e2aa09f
- 53Rendering: Map: Repeat and near repeat classification: Heating and smoke complaints id 93441096-27ae-4f30-aade-125dce56048f
- 54Rendering: Map: Summarize within: Smog alert areas id 407df334-25e6-42fe-8c40-03ead11b55fc
- 55Rendering: Map: Summarize within: Smog alert areas id 0034d9c7-6324-47a3-b594-1d24ebb1c534
- 56Rendering: Map: Hot spot analysis: Schools id fad1fd90-84ae-4c56-a7c8-c19968f56251
- 57Rendering: Map: Hot spot analysis: Heating and smoke complaints id e8903c1c-1976-4634-a49a-1eca16d457d8
- 58Rendering: Map: Calculate density: Schools id dd937085-125b-4245-b19d-4df13795ffac
- 59Rendering: Map: Calculate density: Traffic counters id e20a9973-68d1-4830-bbb5-9a780d6a9a33
- 60Rendering: Map: Calculate density: Heating and smoke complaints id 0160d7fb-b98e-47f4-ba56-8e97beecdc89
- 61Rendering: Map: Find point clusters: Schools id 2fe195f1-b867-4da5-80ca-f8476d6adc87
- 62Rendering: Map: Find point clusters: cluster hulls id 0419d3be-d8f9-490f-b1f7-42948c5a9737
- 63Rendering: Map: Find point clusters: Traffic counters id 0b85a9fc-34fd-43cb-84f9-2f5ffe2f143c
- 64Rendering: Map: Find point clusters: cluster hulls id d057adbc-5e7a-4438-8d07-3b943401c523
- 65Rendering: Map: Find point clusters: Air quality sensors id 2cb83ca5-0098-4a79-9790-1e43bfdf1db5
- 66Rendering: Map: Find point clusters: cluster hulls id a67a4f33-5986-463c-bc2c-acd3018fea50
- 67Rendering: Map: Districts by population id 2e54a251-6a26-402f-86e8-e6d15cab3ac3
- 68Rendering: Map: Green areas by trees id 7404178c-fa56-4278-a94d-180735127ec9
- 69Rendering: Map: Find outliers: Districts id 65c0124e-203f-4f91-873c-12b4b6960ae4
- 70Rendering: Map: Find outliers: Green areas id dc1a86e3-09d6-402a-a3b2-c3fdd0d3eab5
- 71Rendering: Map: Summarize within: Smog alert areas id a4d875cc-962b-4e3c-b64e-dd57deee34ed
- 72Rendering: Chart: Sensor readings every three hours over time (timestamp). 21 rows id 8be9f734-9fc2-4614-9c16-f319eb5bc297
- 73Rendering: Chart: Heating and smoke complaints over time (reported_at). 108 rows id bafb9708-0830-42a8-9dce-37a4690fb945
- 74Rendering: Chart: Traffic counts by day over time (date). 21 rows id 71f35ff8-083c-4035-b705-ccab22f7bdf8
- 75Rendering: Chart: Smog alert areas over time (date). 20 rows id 4033fc71-23c1-4ffa-ae99-ae32670ffd03
- 76Rendering: Chart: Emerging hot spots: Heating and smoke complaints. 8 rows id 988b5149-df22-4996-bf31-ac55354d51c4
- 77Rendering: Chart: Repeat and near repeat classification: Heating and smoke complaints. 108 rows id f41c1c14-81d1-4349-8443-09a4f4ba9eb6
- 78Rendering: Chart: Summarize within: Smog alert areas. 20 rows id 9227b7e1-e625-47f7-80b5-495de4ab4e0a
- 79Rendering: Chart: Summarize within: Smog alert areas. 20 rows id a7c52833-f238-4226-b84c-fb152e2c2eb1
- 80Rendering: Chart: Hot spot analysis: Schools. 7 rows id e9ad8aa0-adb4-490e-928f-6b45446a7f1f
- 81Rendering: Chart: Hot spot analysis: Heating and smoke complaints. 13 rows id d96b848c-1ca5-4e56-a8a0-bd5c1a5ae7d0
- 82Rendering: Chart: Calculate density: Schools. 8 rows id 063ac921-93d3-4e7d-ab62-58eb4e9b60e6
- 83Rendering: Chart: Calculate density: Traffic counters. 9 rows id 43c8bec3-da9f-4830-912a-49013656b2a0
- 84Rendering: Chart: Calculate density: Heating and smoke complaints. 12 rows id 55617b3d-063a-4f9c-a0dc-71b273d1c5c5
- 85Rendering: Chart: Find point clusters: Schools. 8 rows id 6776d720-700c-42c8-803c-ba17f7028e7e
- 86Rendering: Chart: Find point clusters: cluster hulls. 7 rows id 9bde57a2-00d0-4bd3-a720-f74fb52e323e
- 87Rendering: Chart: Find point clusters: Traffic counters. 2 rows id 7ca9a164-4408-4af2-8a82-d20106e3d63e
- 88Rendering: Chart: Find point clusters: cluster hulls. 1 rows id 468903ad-2588-4bd9-b8d4-6010b36560ca
- 89Rendering: Chart: Find point clusters: Air quality sensors. 1 rows id 781b4a70-d6e9-4e64-931e-192b47d86fd1
- 90Rendering: Chart: Find point clusters: cluster hulls. 1 rows id 138b31d8-fc4f-44f8-8117-aecb9b369d31
- 91Rendering: Chart: Find outliers: Districts. 12 rows id f6661716-8904-4181-817e-f4d3e782e217
- 92Rendering: Chart: Find outliers: Green areas. 15 rows id b3b4d6ea-4b5e-4cac-8fd3-fcda036bee5c
- 93Rendering: Chart: Summarize within: Smog alert areas. 20 rows id 1ceece26-9477-4f54-9fa4-1e2dbc1f96a5
- 94Rendering: Chart: Summarize within: Smog alert areas over time. 20 rows id 76c45baf-feca-4a2f-a3a8-a4aa1cb03271
- 95Rendering: Chart: Summarize within: Smog alert areas over time. 20 rows id fc1e8aa9-d730-49fa-9bbb-bbeacedfb972
- 96Rendering: Chart: Summarize within: Smog alert areas over time. 20 rows id f7309174-c972-4de9-853f-0c6929414c1f
- 97Rendering: Chart: Repeat and near repeat classification: Heating and smoke complaints over time. 108 rows id 5a51d5a0-e784-4a44-a4b6-258ad1f1e695
- 98Dataset: Districts. vector, 12 rows id 26db6cdc-8ed6-4018-8216-57b31d6b7b10
- 99Dataset: Air quality sensors. vector, 18 rows id 6baceea7-d2af-4370-8edd-b762c4503296
- 100Dataset: Major roads. vector, 20 rows id c02faba8-cbb0-4f5c-9b60-817e3cfb35fe
- 101Dataset: Traffic counters. vector, 20 rows id 3b29eef8-b3c6-476c-b293-75939220204d
- 102Dataset: Schools. vector, 50 rows id 30a2dc6f-9417-4701-b099-bcebc56bd124
- 103Dataset: Green areas. vector, 15 rows id 32303dbc-77ff-4931-9a5d-9590fbeb6497
- 104Dataset: Air quality bulletin. document, ? rows id acc3c65d-3cae-42d7-af0f-109b23544f46
- 105Record: Sample: Smart city sensors, Krakow id 941056ab-e59e-43ce-98fd-5b3678626f78
- 106Layer: Emerging hot spots: Heating and smoke complaints. 79 features id bf5f1710-3502-403a-8d6a-ffe2e546b9eb
- 107Layer: Repeat and near repeat classification: Heating and smoke complaints. 1,000 features id bb01a925-2b04-4941-9f49-710b9a99b0eb
- 108Layer: Summarize within: Smog alert areas. 5 features id acc65faa-4c2f-47ce-af45-9d9d172f8270
- 109Layer: Summarize within: Smog alert areas. 5 features id fd04402f-45d7-49e4-91f3-b84e26f37bd8
- 110Layer: Hot spot analysis: Schools. 18 features id 5228d4e7-3d39-443c-85cd-530e92371dbe
- 111Layer: Hot spot analysis: Heating and smoke complaints. 208 features id 16bc96b6-9c4f-4c62-b6e2-da0018f9338c
- 112Layer: Calculate density: Schools. 98 features id 1263d766-433f-4232-a64f-4c671f510b22
- 113Layer: Calculate density: Traffic counters. 208 features id bcbc8c7e-77b3-4bfb-882d-bad64d25f7f1
- 114Layer: Calculate density: Heating and smoke complaints. 1,379 features id 54d2c3ab-0779-4796-8ab6-f64429e25aa9
- 115Layer: Find point clusters: Schools. 50 features id cfc15b6a-1b6a-49f0-babb-0f62493f7ae8
- 116Layer: Find point clusters: cluster hulls. 7 features id ecce6173-f6a4-413b-95e9-b66d9b514f36
- 117Layer: Find point clusters: Traffic counters. 20 features id 5b1bb98f-a7b6-4e1d-9746-34bd0adff1d8
- 118Layer: Find point clusters: cluster hulls. 1 features id c5d42204-a8ab-452e-b226-45831682926b
- 119Layer: Find point clusters: Air quality sensors. 18 features id c7b1b5b6-45ea-4c4b-89fb-057b73041330
- 120Layer: Find point clusters: cluster hulls. 1 features id 77120389-d522-4f77-b502-a63eafc89c5d
- 121Layer: Find outliers: Districts. 12 features id cf03dea3-3fc9-4ee1-beb8-43ec21f5da69
- 122Layer: Find outliers: Green areas. 15 features id 3e0dd3e3-729e-40f0-80b8-2477238ce9d7
- 123Layer: Summarize within: Smog alert areas. 5 features id af0ec067-f4d0-4dfb-be36-930e255a6ef8
Appendix: the data behind the chartsShow
Figure 1. Timeline: events per week by dataset 1
| period | series | value |
|---|---|---|
| 2025-09-29 | Sensor readings every three hours | 0 |
| 2025-09-29 | Heating and smoke complaints | 13 |
| 2025-09-29 | Traffic counts by day | 0 |
| 2025-09-29 | Smog alert areas | 0 |
| 2025-10-06 | Sensor readings every three hours | 0 |
| 2025-10-06 | Heating and smoke complaints | 21 |
| 2025-10-06 | Traffic counts by day | 0 |
| 2025-10-06 | Smog alert areas | 0 |
| 2025-10-13 | Sensor readings every three hours | 0 |
| 2025-10-13 | Heating and smoke complaints | 30 |
| 2025-10-13 | Traffic counts by day | 0 |
| 2025-10-13 | Smog alert areas | 0 |
| 2025-10-20 | Sensor readings every three hours | 0 |
| 2025-10-20 | Heating and smoke complaints | 24 |
| 2025-10-20 | Traffic counts by day | 0 |
| 2025-10-20 | Smog alert areas | 0 |
| 2025-10-27 | Sensor readings every three hours | 0 |
| 2025-10-27 | Heating and smoke complaints | 31 |
| 2025-10-27 | Traffic counts by day | 0 |
| 2025-10-27 | Smog alert areas | 0 |
| 2025-11-03 | Sensor readings every three hours | 0 |
| 2025-11-03 | Heating and smoke complaints | 28 |
| 2025-11-03 | Traffic counts by day | 0 |
| 2025-11-03 | Smog alert areas | 0 |
| 2025-11-10 | Sensor readings every three hours | 0 |
| 2025-11-10 | Heating and smoke complaints | 29 |
| 2025-11-10 | Traffic counts by day | 0 |
| 2025-11-10 | Smog alert areas | 0 |
| 2025-11-17 | Sensor readings every three hours | 0 |
| 2025-11-17 | Heating and smoke complaints | 35 |
| 2025-11-17 | Traffic counts by day | 0 |
| 2025-11-17 | Smog alert areas | 0 |
| 2025-11-24 | Sensor readings every three hours | 0 |
| 2025-11-24 | Heating and smoke complaints | 29 |
| 2025-11-24 | Traffic counts by day | 0 |
| 2025-11-24 | Smog alert areas | 0 |
| 2025-12-01 | Sensor readings every three hours | 0 |
| 2025-12-01 | Heating and smoke complaints | 22 |
| 2025-12-01 | Traffic counts by day | 0 |
| 2025-12-01 | Smog alert areas | 0 |
| 2025-12-08 | Sensor readings every three hours | 0 |
| 2025-12-08 | Heating and smoke complaints | 42 |
| 2025-12-08 | Traffic counts by day | 0 |
| 2025-12-08 | Smog alert areas | 0 |
| 2025-12-15 | Sensor readings every three hours | 0 |
| 2025-12-15 | Heating and smoke complaints | 40 |
| 2025-12-15 | Traffic counts by day | 0 |
| 2025-12-15 | Smog alert areas | 0 |
| 2025-12-22 | Sensor readings every three hours | 0 |
| 2025-12-22 | Heating and smoke complaints | 41 |
| 2025-12-22 | Traffic counts by day | 0 |
| 2025-12-22 | Smog alert areas | 0 |
| 2025-12-29 | Sensor readings every three hours | 0 |
| 2025-12-29 | Heating and smoke complaints | 48 |
| 2025-12-29 | Traffic counts by day | 0 |
| 2025-12-29 | Smog alert areas | 0 |
| 2026-01-05 | Sensor readings every three hours | 0 |
| 2026-01-05 | Heating and smoke complaints | 40 |
| 2026-01-05 | Traffic counts by day | 0 |
| 2026-01-05 | Smog alert areas | 0 |
| 2026-01-12 | Sensor readings every three hours | 1,008 |
| 2026-01-12 | Heating and smoke complaints | 99 |
| 2026-01-12 | Traffic counts by day | 140 |
| 2026-01-12 | Smog alert areas | 2 |
| 2026-01-19 | Sensor readings every three hours | 1,008 |
| 2026-01-19 | Heating and smoke complaints | 109 |
| 2026-01-19 | Traffic counts by day | 140 |
| 2026-01-19 | Smog alert areas | 3 |
| 2026-01-26 | Sensor readings every three hours | 1,008 |
| 2026-01-26 | Heating and smoke complaints | 37 |
| 2026-01-26 | Traffic counts by day | 140 |
| 2026-01-26 | Smog alert areas | 0 |
| 2026-02-02 | Sensor readings every three hours | 0 |
| 2026-02-02 | Heating and smoke complaints | 48 |
| 2026-02-02 | Traffic counts by day | 0 |
| 2026-02-02 | Smog alert areas | 0 |
| 2026-02-09 | Sensor readings every three hours | 0 |
| 2026-02-09 | Heating and smoke complaints | 43 |
| 2026-02-09 | Traffic counts by day | 0 |
| 2026-02-09 | Smog alert areas | 0 |
| 2026-02-16 | Sensor readings every three hours | 0 |
| 2026-02-16 | Heating and smoke complaints | 28 |
| 2026-02-16 | Traffic counts by day | 0 |
| 2026-02-16 | Smog alert areas | 0 |
| 2026-02-23 | Sensor readings every three hours | 0 |
| 2026-02-23 | Heating and smoke complaints | 35 |
| 2026-02-23 | Traffic counts by day | 0 |
| 2026-02-23 | Smog alert areas | 0 |
| 2026-03-02 | Sensor readings every three hours | 0 |
| 2026-03-02 | Heating and smoke complaints | 31 |
| 2026-03-02 | Traffic counts by day | 0 |
| 2026-03-02 | Smog alert areas | 0 |
| 2026-03-09 | Sensor readings every three hours | 0 |
| 2026-03-09 | Heating and smoke complaints | 31 |
| 2026-03-09 | Traffic counts by day | 0 |
| 2026-03-09 | Smog alert areas | 0 |
| 2026-03-16 | Sensor readings every three hours | 0 |
| 2026-03-16 | Heating and smoke complaints | 32 |
| 2026-03-16 | Traffic counts by day | 0 |
| 2026-03-16 | Smog alert areas | 0 |
| 2026-03-23 | Sensor readings every three hours | 0 |
| 2026-03-23 | Heating and smoke complaints | 22 |
| 2026-03-23 | Traffic counts by day | 0 |
| 2026-03-23 | Smog alert areas | 0 |
| 2026-03-30 | Sensor readings every three hours | 0 |
| 2026-03-30 | Heating and smoke complaints | 12 |
| 2026-03-30 | Traffic counts by day | 0 |
| 2026-03-30 | Smog alert areas | 0 |
Figure 22. Sensor readings every three hours over time (timestamp) 72
| period | value |
|---|---|
| 2026-01-12 | 144 |
| 2026-01-13 | 144 |
| 2026-01-14 | 144 |
| 2026-01-15 | 144 |
| 2026-01-16 | 144 |
| 2026-01-17 | 144 |
| 2026-01-18 | 144 |
| 2026-01-19 | 144 |
| 2026-01-20 | 144 |
| 2026-01-21 | 144 |
| 2026-01-22 | 144 |
| 2026-01-23 | 144 |
| 2026-01-24 | 144 |
| 2026-01-25 | 144 |
| 2026-01-26 | 144 |
| 2026-01-27 | 144 |
| 2026-01-28 | 144 |
| 2026-01-29 | 144 |
| 2026-01-30 | 144 |
| 2026-01-31 | 144 |
| 2026-02-01 | 144 |
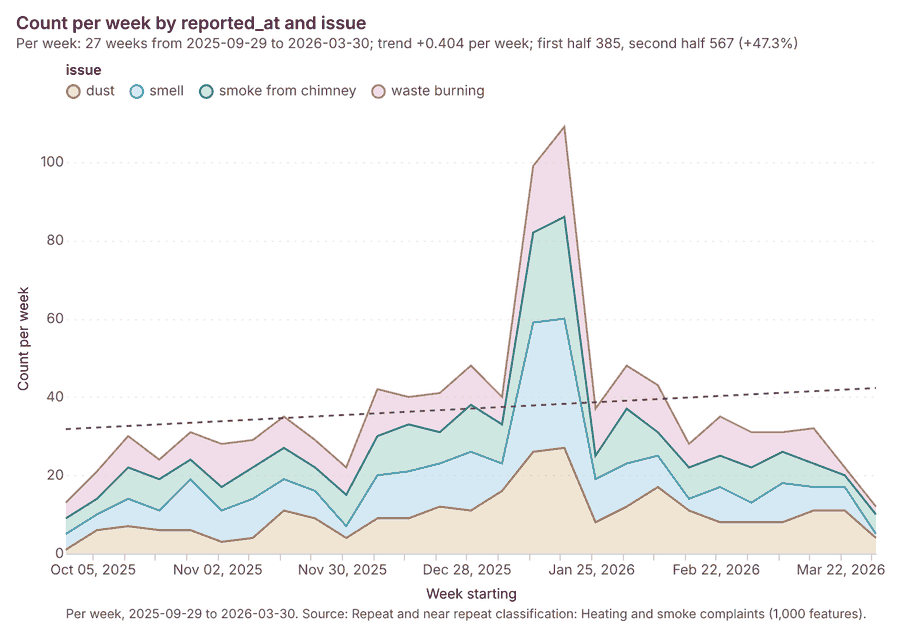
Figure 23. Heating and smoke complaints over time (reported_at) 73
| period | series | value |
|---|---|---|
| 2025-09-29 | dust | 1 |
| 2025-09-29 | smell | 4 |
| 2025-09-29 | smoke from chimney | 4 |
| 2025-09-29 | waste burning | 4 |
| 2025-10-06 | dust | 6 |
| 2025-10-06 | smell | 4 |
| 2025-10-06 | smoke from chimney | 4 |
| 2025-10-06 | waste burning | 7 |
| 2025-10-13 | dust | 7 |
| 2025-10-13 | smell | 7 |
| 2025-10-13 | smoke from chimney | 8 |
| 2025-10-13 | waste burning | 8 |
| 2025-10-20 | dust | 6 |
| 2025-10-20 | smell | 5 |
| 2025-10-20 | smoke from chimney | 8 |
| 2025-10-20 | waste burning | 5 |
| 2025-10-27 | dust | 6 |
| 2025-10-27 | smell | 13 |
| 2025-10-27 | smoke from chimney | 5 |
| 2025-10-27 | waste burning | 7 |
| 2025-11-03 | dust | 3 |
| 2025-11-03 | smell | 8 |
| 2025-11-03 | smoke from chimney | 6 |
| 2025-11-03 | waste burning | 11 |
| 2025-11-10 | dust | 4 |
| 2025-11-10 | smell | 10 |
| 2025-11-10 | smoke from chimney | 8 |
| 2025-11-10 | waste burning | 7 |
| 2025-11-17 | dust | 11 |
| 2025-11-17 | smell | 8 |
| 2025-11-17 | smoke from chimney | 8 |
| 2025-11-17 | waste burning | 8 |
| 2025-11-24 | dust | 9 |
| 2025-11-24 | smell | 7 |
| 2025-11-24 | smoke from chimney | 6 |
| 2025-11-24 | waste burning | 7 |
| 2025-12-01 | dust | 4 |
| 2025-12-01 | smell | 3 |
| 2025-12-01 | smoke from chimney | 8 |
| 2025-12-01 | waste burning | 7 |
| 2025-12-08 | dust | 9 |
| 2025-12-08 | smell | 11 |
| 2025-12-08 | smoke from chimney | 10 |
| 2025-12-08 | waste burning | 12 |
| 2025-12-15 | dust | 9 |
| 2025-12-15 | smell | 12 |
| 2025-12-15 | smoke from chimney | 12 |
| 2025-12-15 | waste burning | 7 |
| 2025-12-22 | dust | 12 |
| 2025-12-22 | smell | 11 |
| 2025-12-22 | smoke from chimney | 8 |
| 2025-12-22 | waste burning | 10 |
| 2025-12-29 | dust | 11 |
| 2025-12-29 | smell | 15 |
| 2025-12-29 | smoke from chimney | 12 |
| 2025-12-29 | waste burning | 10 |
| 2026-01-05 | dust | 16 |
| 2026-01-05 | smell | 7 |
| 2026-01-05 | smoke from chimney | 10 |
| 2026-01-05 | waste burning | 7 |
| 2026-01-12 | dust | 26 |
| 2026-01-12 | smell | 33 |
| 2026-01-12 | smoke from chimney | 23 |
| 2026-01-12 | waste burning | 17 |
| 2026-01-19 | dust | 27 |
| 2026-01-19 | smell | 33 |
| 2026-01-19 | smoke from chimney | 26 |
| 2026-01-19 | waste burning | 23 |
| 2026-01-26 | dust | 8 |
| 2026-01-26 | smell | 11 |
| 2026-01-26 | smoke from chimney | 6 |
| 2026-01-26 | waste burning | 12 |
| 2026-02-02 | dust | 12 |
| 2026-02-02 | smell | 11 |
| 2026-02-02 | smoke from chimney | 14 |
| 2026-02-02 | waste burning | 11 |
| 2026-02-09 | dust | 17 |
| 2026-02-09 | smell | 8 |
| 2026-02-09 | smoke from chimney | 6 |
| 2026-02-09 | waste burning | 12 |
| 2026-02-16 | dust | 11 |
| 2026-02-16 | smell | 3 |
| 2026-02-16 | smoke from chimney | 8 |
| 2026-02-16 | waste burning | 6 |
| 2026-02-23 | dust | 8 |
| 2026-02-23 | smell | 9 |
| 2026-02-23 | smoke from chimney | 8 |
| 2026-02-23 | waste burning | 10 |
| 2026-03-02 | dust | 8 |
| 2026-03-02 | smell | 5 |
| 2026-03-02 | smoke from chimney | 9 |
| 2026-03-02 | waste burning | 9 |
| 2026-03-09 | dust | 8 |
| 2026-03-09 | smell | 10 |
| 2026-03-09 | smoke from chimney | 8 |
| 2026-03-09 | waste burning | 5 |
| 2026-03-16 | dust | 11 |
| 2026-03-16 | smell | 6 |
| 2026-03-16 | smoke from chimney | 6 |
| 2026-03-16 | waste burning | 9 |
| 2026-03-23 | dust | 11 |
| 2026-03-23 | smell | 6 |
| 2026-03-23 | smoke from chimney | 3 |
| 2026-03-23 | waste burning | 2 |
| 2026-03-30 | dust | 4 |
| 2026-03-30 | smell | 1 |
| 2026-03-30 | smoke from chimney | 5 |
| 2026-03-30 | waste burning | 2 |
Figure 24. Traffic counts by day over time (date) 74
| period | value |
|---|---|
| 2026-01-12 | 4.817e+05 |
| 2026-01-13 | 4.534e+05 |
| 2026-01-14 | 4.68e+05 |
| 2026-01-15 | 4.975e+05 |
| 2026-01-16 | 4.796e+05 |
| 2026-01-17 | 2.394e+05 |
| 2026-01-18 | 1.577e+05 |
| 2026-01-19 | 4.808e+05 |
| 2026-01-20 | 5.42e+05 |
| 2026-01-21 | 5.074e+05 |
| 2026-01-22 | 4.305e+05 |
| 2026-01-23 | 4.501e+05 |
| 2026-01-24 | 2.25e+05 |
| 2026-01-25 | 1.746e+05 |
| 2026-01-26 | 5.535e+05 |
| 2026-01-27 | 5.047e+05 |
| 2026-01-28 | 4.7e+05 |
| 2026-01-29 | 5.047e+05 |
| 2026-01-30 | 4.434e+05 |
| 2026-01-31 | 2.208e+05 |
| 2026-02-01 | 1.835e+05 |
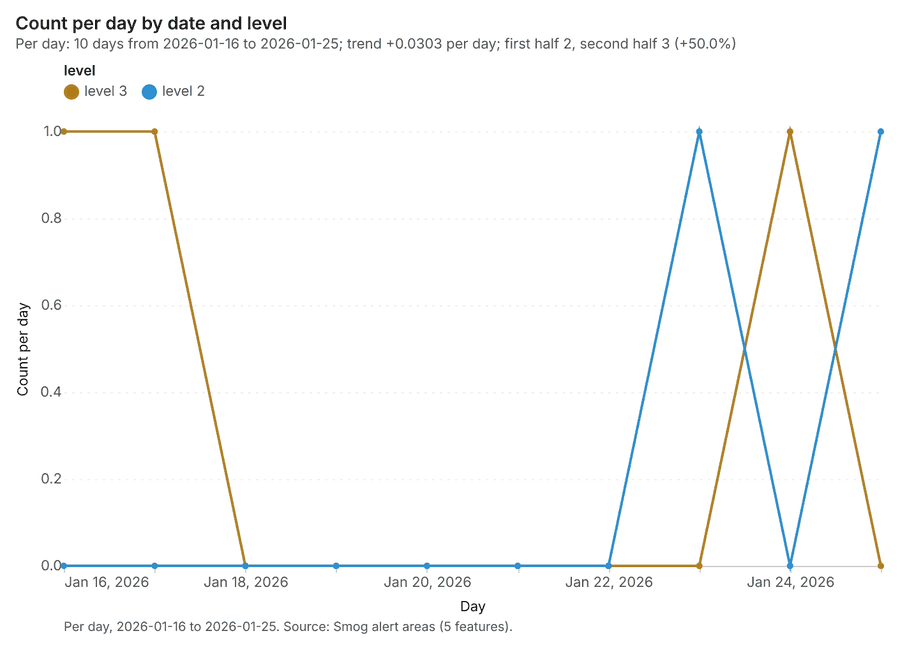
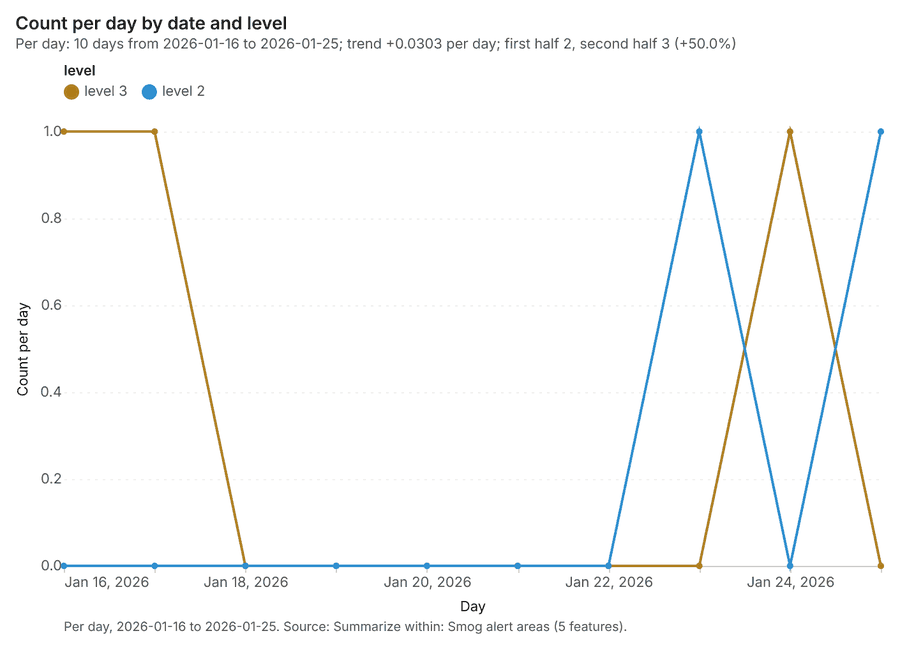
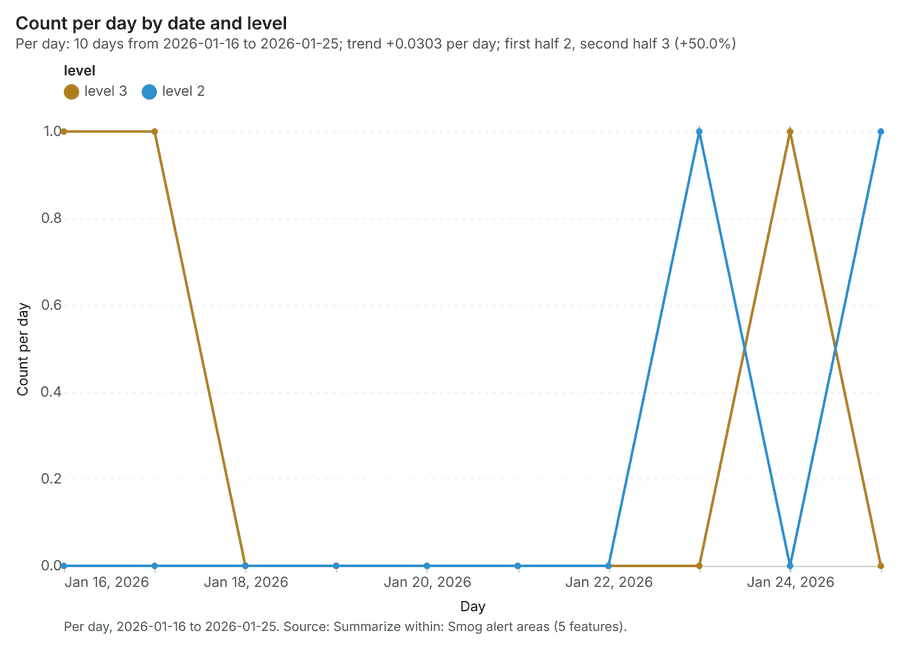
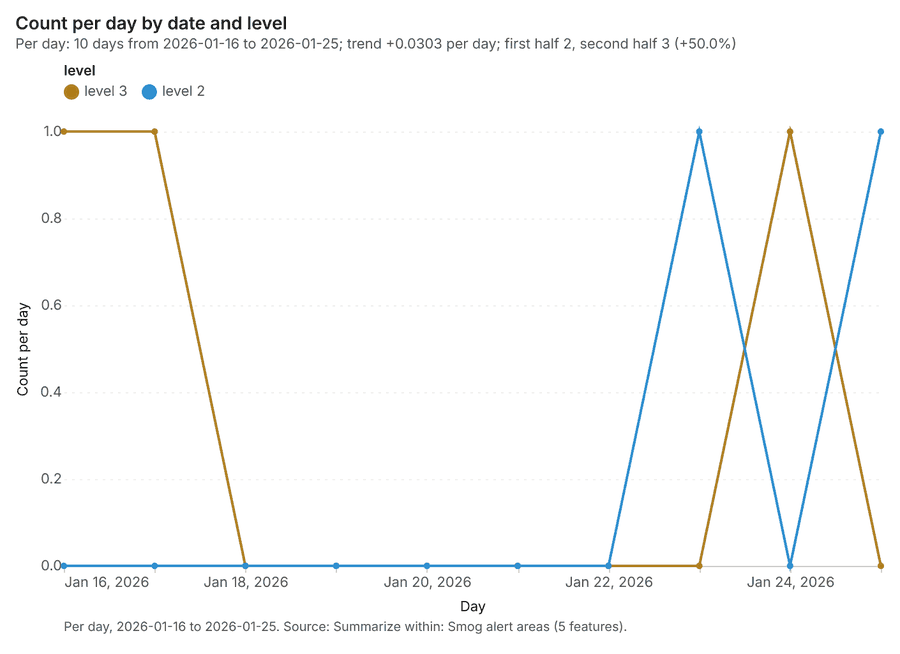
Figure 25. Smog alert areas over time (date) 75
| period | series | value |
|---|---|---|
| 2026-01-16 | level 3 | 1 |
| 2026-01-16 | level 2 | 0 |
| 2026-01-17 | level 3 | 1 |
| 2026-01-17 | level 2 | 0 |
| 2026-01-18 | level 3 | 0 |
| 2026-01-18 | level 2 | 0 |
| 2026-01-19 | level 3 | 0 |
| 2026-01-19 | level 2 | 0 |
| 2026-01-20 | level 3 | 0 |
| 2026-01-20 | level 2 | 0 |
| 2026-01-21 | level 3 | 0 |
| 2026-01-21 | level 2 | 0 |
| 2026-01-22 | level 3 | 0 |
| 2026-01-22 | level 2 | 0 |
| 2026-01-23 | level 3 | 0 |
| 2026-01-23 | level 2 | 1 |
| 2026-01-24 | level 3 | 1 |
| 2026-01-24 | level 2 | 0 |
| 2026-01-25 | level 3 | 0 |
| 2026-01-25 | level 2 | 1 |
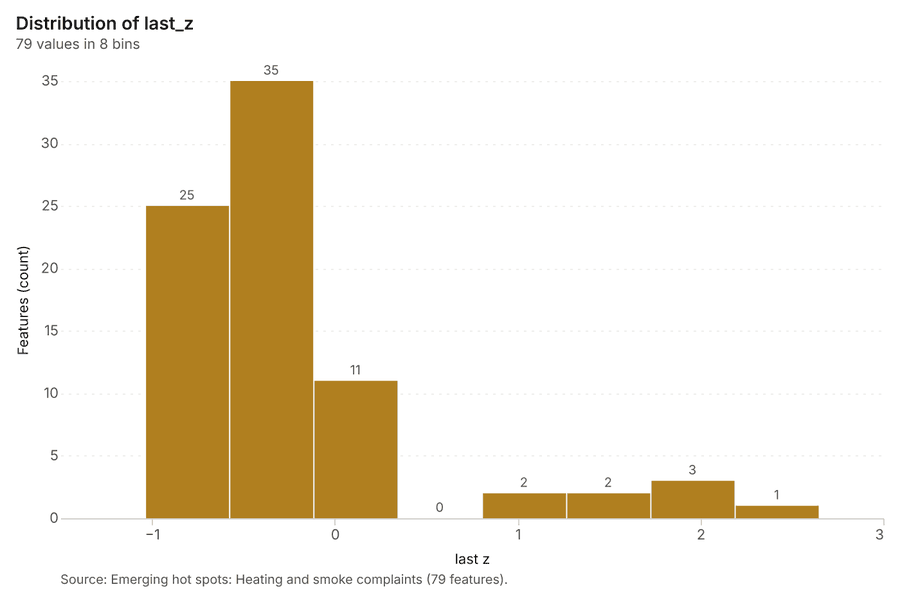
Figure 26. Emerging hot spots: Heating and smoke complaints 76
| bin_start | bin_end | count |
|---|---|---|
| -1.039 | -0.5783 | 25 |
| -0.5783 | -0.1175 | 35 |
| -0.1175 | 0.3432 | 11 |
| 0.3432 | 0.804 | 0 |
| 0.804 | 1.265 | 2 |
| 1.265 | 1.726 | 2 |
| 1.726 | 2.186 | 3 |
| 2.186 | 2.647 | 1 |
Figure 27. Repeat and near repeat classification: Heating and smoke complaints 77
| period | series | value |
|---|---|---|
| 2025-09-29 | dust | 1 |
| 2025-09-29 | smell | 4 |
| 2025-09-29 | smoke from chimney | 4 |
| 2025-09-29 | waste burning | 4 |
| 2025-10-06 | dust | 6 |
| 2025-10-06 | smell | 4 |
| 2025-10-06 | smoke from chimney | 4 |
| 2025-10-06 | waste burning | 7 |
| 2025-10-13 | dust | 7 |
| 2025-10-13 | smell | 7 |
| 2025-10-13 | smoke from chimney | 8 |
| 2025-10-13 | waste burning | 8 |
| 2025-10-20 | dust | 6 |
| 2025-10-20 | smell | 5 |
| 2025-10-20 | smoke from chimney | 8 |
| 2025-10-20 | waste burning | 5 |
| 2025-10-27 | dust | 6 |
| 2025-10-27 | smell | 13 |
| 2025-10-27 | smoke from chimney | 5 |
| 2025-10-27 | waste burning | 7 |
| 2025-11-03 | dust | 3 |
| 2025-11-03 | smell | 8 |
| 2025-11-03 | smoke from chimney | 6 |
| 2025-11-03 | waste burning | 11 |
| 2025-11-10 | dust | 4 |
| 2025-11-10 | smell | 10 |
| 2025-11-10 | smoke from chimney | 8 |
| 2025-11-10 | waste burning | 7 |
| 2025-11-17 | dust | 11 |
| 2025-11-17 | smell | 8 |
| 2025-11-17 | smoke from chimney | 8 |
| 2025-11-17 | waste burning | 8 |
| 2025-11-24 | dust | 9 |
| 2025-11-24 | smell | 7 |
| 2025-11-24 | smoke from chimney | 6 |
| 2025-11-24 | waste burning | 7 |
| 2025-12-01 | dust | 4 |
| 2025-12-01 | smell | 3 |
| 2025-12-01 | smoke from chimney | 8 |
| 2025-12-01 | waste burning | 7 |
| 2025-12-08 | dust | 9 |
| 2025-12-08 | smell | 11 |
| 2025-12-08 | smoke from chimney | 10 |
| 2025-12-08 | waste burning | 12 |
| 2025-12-15 | dust | 9 |
| 2025-12-15 | smell | 12 |
| 2025-12-15 | smoke from chimney | 12 |
| 2025-12-15 | waste burning | 7 |
| 2025-12-22 | dust | 12 |
| 2025-12-22 | smell | 11 |
| 2025-12-22 | smoke from chimney | 8 |
| 2025-12-22 | waste burning | 10 |
| 2025-12-29 | dust | 11 |
| 2025-12-29 | smell | 15 |
| 2025-12-29 | smoke from chimney | 12 |
| 2025-12-29 | waste burning | 10 |
| 2026-01-05 | dust | 16 |
| 2026-01-05 | smell | 7 |
| 2026-01-05 | smoke from chimney | 10 |
| 2026-01-05 | waste burning | 7 |
| 2026-01-12 | dust | 26 |
| 2026-01-12 | smell | 33 |
| 2026-01-12 | smoke from chimney | 23 |
| 2026-01-12 | waste burning | 17 |
| 2026-01-19 | dust | 27 |
| 2026-01-19 | smell | 33 |
| 2026-01-19 | smoke from chimney | 26 |
| 2026-01-19 | waste burning | 23 |
| 2026-01-26 | dust | 8 |
| 2026-01-26 | smell | 11 |
| 2026-01-26 | smoke from chimney | 6 |
| 2026-01-26 | waste burning | 12 |
| 2026-02-02 | dust | 12 |
| 2026-02-02 | smell | 11 |
| 2026-02-02 | smoke from chimney | 14 |
| 2026-02-02 | waste burning | 11 |
| 2026-02-09 | dust | 17 |
| 2026-02-09 | smell | 8 |
| 2026-02-09 | smoke from chimney | 6 |
| 2026-02-09 | waste burning | 12 |
| 2026-02-16 | dust | 11 |
| 2026-02-16 | smell | 3 |
| 2026-02-16 | smoke from chimney | 8 |
| 2026-02-16 | waste burning | 6 |
| 2026-02-23 | dust | 8 |
| 2026-02-23 | smell | 9 |
| 2026-02-23 | smoke from chimney | 8 |
| 2026-02-23 | waste burning | 10 |
| 2026-03-02 | dust | 8 |
| 2026-03-02 | smell | 5 |
| 2026-03-02 | smoke from chimney | 9 |
| 2026-03-02 | waste burning | 9 |
| 2026-03-09 | dust | 8 |
| 2026-03-09 | smell | 10 |
| 2026-03-09 | smoke from chimney | 8 |
| 2026-03-09 | waste burning | 5 |
| 2026-03-16 | dust | 11 |
| 2026-03-16 | smell | 6 |
| 2026-03-16 | smoke from chimney | 6 |
| 2026-03-16 | waste burning | 9 |
| 2026-03-23 | dust | 11 |
| 2026-03-23 | smell | 6 |
| 2026-03-23 | smoke from chimney | 3 |
| 2026-03-23 | waste burning | 2 |
| 2026-03-30 | dust | 4 |
| 2026-03-30 | smell | 1 |
| 2026-03-30 | smoke from chimney | 5 |
| 2026-03-30 | waste burning | 2 |
Figure 28. Summarize within: Smog alert areas 78
| period | series | value |
|---|---|---|
| 2026-01-16 | level 3 | 1 |
| 2026-01-16 | level 2 | 0 |
| 2026-01-17 | level 3 | 1 |
| 2026-01-17 | level 2 | 0 |
| 2026-01-18 | level 3 | 0 |
| 2026-01-18 | level 2 | 0 |
| 2026-01-19 | level 3 | 0 |
| 2026-01-19 | level 2 | 0 |
| 2026-01-20 | level 3 | 0 |
| 2026-01-20 | level 2 | 0 |
| 2026-01-21 | level 3 | 0 |
| 2026-01-21 | level 2 | 0 |
| 2026-01-22 | level 3 | 0 |
| 2026-01-22 | level 2 | 0 |
| 2026-01-23 | level 3 | 0 |
| 2026-01-23 | level 2 | 1 |
| 2026-01-24 | level 3 | 1 |
| 2026-01-24 | level 2 | 0 |
| 2026-01-25 | level 3 | 0 |
| 2026-01-25 | level 2 | 1 |
Figure 29. Summarize within: Smog alert areas 79
| period | series | value |
|---|---|---|
| 2026-01-16 | level 3 | 1 |
| 2026-01-16 | level 2 | 0 |
| 2026-01-17 | level 3 | 1 |
| 2026-01-17 | level 2 | 0 |
| 2026-01-18 | level 3 | 0 |
| 2026-01-18 | level 2 | 0 |
| 2026-01-19 | level 3 | 0 |
| 2026-01-19 | level 2 | 0 |
| 2026-01-20 | level 3 | 0 |
| 2026-01-20 | level 2 | 0 |
| 2026-01-21 | level 3 | 0 |
| 2026-01-21 | level 2 | 0 |
| 2026-01-22 | level 3 | 0 |
| 2026-01-22 | level 2 | 0 |
| 2026-01-23 | level 3 | 0 |
| 2026-01-23 | level 2 | 1 |
| 2026-01-24 | level 3 | 1 |
| 2026-01-24 | level 2 | 0 |
| 2026-01-25 | level 3 | 0 |
| 2026-01-25 | level 2 | 1 |
Figure 30. Hot spot analysis: Schools 80
| bin_start | bin_end | band | band_label | count |
|---|---|---|---|---|
| -1.5 | -1 | not_significant | Not significant | 3 |
| -1 | -0.5 | not_significant | Not significant | 3 |
| -0.5 | 0 | not_significant | Not significant | 4 |
| 0 | 0.5 | not_significant | Not significant | 1 |
| 0.5 | 1 | not_significant | Not significant | 3 |
| 1 | 1.5 | not_significant | Not significant | 2 |
| 1.5 | 2 | hot_90 | Hot spot, 90% confidence | 2 |
Figure 31. Hot spot analysis: Heating and smoke complaints 81
| bin_start | bin_end | band | band_label | count |
|---|---|---|---|---|
| -1 | -0.5 | not_significant | Not significant | 60 |
| -0.5 | 0 | not_significant | Not significant | 78 |
| 0 | 0.5 | not_significant | Not significant | 37 |
| 0.5 | 1 | not_significant | Not significant | 7 |
| 1 | 1.5 | not_significant | Not significant | 6 |
| 1.5 | 2 | hot_90 | Hot spot, 90% confidence | 1 |
| 1.5 | 2 | hot_95 | Hot spot, 95% confidence | 2 |
| 1.5 | 2 | not_significant | Not significant | 4 |
| 2 | 2.5 | hot_95 | Hot spot, 95% confidence | 4 |
| 2.5 | 3 | hot_99 | Hot spot, 99% confidence | 3 |
| 3 | 3.5 | hot_99 | Hot spot, 99% confidence | 3 |
| 3.5 | 4 | hot_99 | Hot spot, 99% confidence | 2 |
| 4.5 | 5 | hot_99 | Hot spot, 99% confidence | 1 |
Figure 32. Calculate density: Schools 82
| bin_start | bin_end | count |
|---|---|---|
| 1.017e-05 | 0.1759 | 29 |
| 0.1759 | 0.3518 | 18 |
| 0.3518 | 0.5276 | 3 |
| 0.5276 | 0.7035 | 13 |
| 0.7035 | 0.8794 | 11 |
| 0.8794 | 1.055 | 13 |
| 1.055 | 1.231 | 6 |
| 1.231 | 1.407 | 5 |
Figure 33. Calculate density: Traffic counters 83
| bin_start | bin_end | count |
|---|---|---|
| 0 | 1.889 | 12 |
| 1.889 | 3.778 | 21 |
| 3.778 | 5.667 | 25 |
| 5.667 | 7.556 | 28 |
| 7.556 | 9.444 | 30 |
| 9.444 | 11.33 | 31 |
| 11.33 | 13.22 | 28 |
| 13.22 | 15.11 | 23 |
| 15.11 | 17 | 10 |
Figure 34. Calculate density: Heating and smoke complaints 84
| bin_start | bin_end | count |
|---|---|---|
| 0 | 3.583 | 108 |
| 3.583 | 7.167 | 136 |
| 7.167 | 10.75 | 101 |
| 10.75 | 14.33 | 135 |
| 14.33 | 17.92 | 99 |
| 17.92 | 21.5 | 134 |
| 21.5 | 25.08 | 131 |
| 25.08 | 28.67 | 93 |
| 28.67 | 32.25 | 126 |
| 32.25 | 35.83 | 99 |
| 35.83 | 39.42 | 134 |
| 39.42 | 43 | 83 |
Figure 35. Find point clusters: Schools 85
| cluster | features | fraction | share |
|---|---|---|---|
| Noise | 10 | 0.2 | 20.0% |
| 0 | 8 | 0.16 | 16.0% |
| 1 | 8 | 0.16 | 16.0% |
| 2 | 7 | 0.14 | 14.0% |
| 5 | 6 | 0.12 | 12.0% |
| 3 | 5 | 0.1 | 10.0% |
| 4 | 3 | 0.06 | 6.0% |
| 6 | 3 | 0.06 | 6.0% |
Figure 36. Find point clusters: cluster hulls 86
| cluster | features | fraction | share |
|---|---|---|---|
| 0 | 1 | 0.1429 | 14.3% |
| 1 | 1 | 0.1429 | 14.3% |
| 2 | 1 | 0.1429 | 14.3% |
| 3 | 1 | 0.1429 | 14.3% |
| 4 | 1 | 0.1429 | 14.3% |
| 5 | 1 | 0.1429 | 14.3% |
| 6 | 1 | 0.1429 | 14.3% |
Figure 37. Find point clusters: Traffic counters 87
| cluster | features | fraction | share |
|---|---|---|---|
| 0 | 19 | 0.95 | 95.0% |
| Noise | 1 | 0.05 | 5.0% |
Figure 38. Find point clusters: cluster hulls 88
| cluster | features | fraction | share |
|---|---|---|---|
| 0 | 1 | 1 | 100.0% |
Figure 39. Find point clusters: Air quality sensors 89
| cluster | features | fraction | share |
|---|---|---|---|
| 0 | 18 | 1 | 100.0% |
Figure 40. Find point clusters: cluster hulls 90
| cluster | features | fraction | share |
|---|---|---|---|
| 0 | 1 | 1 | 100.0% |
Figure 41. Find outliers: Districts 91
| value | lag | type |
|---|---|---|
| -0.0284 | -0.4164 | NS |
| 1.289 | 0.6798 | NS |
| 0.6937 | 0.509 | NS |
| -1.093 | -0.6775 | NS |
| 0.0455 | 0.0657 | NS |
| -1.17 | -0.3544 | NS |
| 2.025 | 0.0455 | NS |
| -1.047 | -1.131 | NS |
| 0.3383 | -0.1681 | NS |
| -0.7767 | -0.4557 | NS |
| 0.6798 | 0.9914 | NS |
| -0.9569 | -0.463 | NS |
Figure 42. Find outliers: Green areas 92
| value | lag | type |
|---|---|---|
| 0.5177 | -1.448 | NS |
| -1.387 | 1.326 | NS |
| 0.7551 | -0.3159 | NS |
| -0.1644 | -0.0869 | NS |
| -1.079 | 0.2954 | NS |
| -0.422 | -0.23 | NS |
| 2.134 | 1.003 | NS |
| 0.4369 | -1.185 | NS |
| 1.326 | 0.1405 | NS |
| 0.4571 | -0.222 | NS |
| -1.448 | 0.5177 | NS |
| -1.185 | 0.4369 | NS |
| -0.2957 | -0.0431 | NS |
| 0.6794 | 2.134 | NS |
| -0.326 | 0.3649 | NS |
Figure 43. Summarize within: Smog alert areas 93
| period | series | value |
|---|---|---|
| 2026-01-16 | level 3 | 1 |
| 2026-01-16 | level 2 | 0 |
| 2026-01-17 | level 3 | 1 |
| 2026-01-17 | level 2 | 0 |
| 2026-01-18 | level 3 | 0 |
| 2026-01-18 | level 2 | 0 |
| 2026-01-19 | level 3 | 0 |
| 2026-01-19 | level 2 | 0 |
| 2026-01-20 | level 3 | 0 |
| 2026-01-20 | level 2 | 0 |
| 2026-01-21 | level 3 | 0 |
| 2026-01-21 | level 2 | 0 |
| 2026-01-22 | level 3 | 0 |
| 2026-01-22 | level 2 | 0 |
| 2026-01-23 | level 3 | 0 |
| 2026-01-23 | level 2 | 1 |
| 2026-01-24 | level 3 | 1 |
| 2026-01-24 | level 2 | 0 |
| 2026-01-25 | level 3 | 0 |
| 2026-01-25 | level 2 | 1 |
Figure 44. Summarize within: Smog alert areas over time 94
| period | series | value |
|---|---|---|
| 2026-01-16 | level 3 | 1 |
| 2026-01-16 | level 2 | 0 |
| 2026-01-17 | level 3 | 1 |
| 2026-01-17 | level 2 | 0 |
| 2026-01-18 | level 3 | 0 |
| 2026-01-18 | level 2 | 0 |
| 2026-01-19 | level 3 | 0 |
| 2026-01-19 | level 2 | 0 |
| 2026-01-20 | level 3 | 0 |
| 2026-01-20 | level 2 | 0 |
| 2026-01-21 | level 3 | 0 |
| 2026-01-21 | level 2 | 0 |
| 2026-01-22 | level 3 | 0 |
| 2026-01-22 | level 2 | 0 |
| 2026-01-23 | level 3 | 0 |
| 2026-01-23 | level 2 | 1 |
| 2026-01-24 | level 3 | 1 |
| 2026-01-24 | level 2 | 0 |
| 2026-01-25 | level 3 | 0 |
| 2026-01-25 | level 2 | 1 |
Figure 45. Summarize within: Smog alert areas over time 95
| period | series | value |
|---|---|---|
| 2026-01-16 | level 3 | 1 |
| 2026-01-16 | level 2 | 0 |
| 2026-01-17 | level 3 | 1 |
| 2026-01-17 | level 2 | 0 |
| 2026-01-18 | level 3 | 0 |
| 2026-01-18 | level 2 | 0 |
| 2026-01-19 | level 3 | 0 |
| 2026-01-19 | level 2 | 0 |
| 2026-01-20 | level 3 | 0 |
| 2026-01-20 | level 2 | 0 |
| 2026-01-21 | level 3 | 0 |
| 2026-01-21 | level 2 | 0 |
| 2026-01-22 | level 3 | 0 |
| 2026-01-22 | level 2 | 0 |
| 2026-01-23 | level 3 | 0 |
| 2026-01-23 | level 2 | 1 |
| 2026-01-24 | level 3 | 1 |
| 2026-01-24 | level 2 | 0 |
| 2026-01-25 | level 3 | 0 |
| 2026-01-25 | level 2 | 1 |
Figure 46. Summarize within: Smog alert areas over time 96
| period | series | value |
|---|---|---|
| 2026-01-16 | level 3 | 1 |
| 2026-01-16 | level 2 | 0 |
| 2026-01-17 | level 3 | 1 |
| 2026-01-17 | level 2 | 0 |
| 2026-01-18 | level 3 | 0 |
| 2026-01-18 | level 2 | 0 |
| 2026-01-19 | level 3 | 0 |
| 2026-01-19 | level 2 | 0 |
| 2026-01-20 | level 3 | 0 |
| 2026-01-20 | level 2 | 0 |
| 2026-01-21 | level 3 | 0 |
| 2026-01-21 | level 2 | 0 |
| 2026-01-22 | level 3 | 0 |
| 2026-01-22 | level 2 | 0 |
| 2026-01-23 | level 3 | 0 |
| 2026-01-23 | level 2 | 1 |
| 2026-01-24 | level 3 | 1 |
| 2026-01-24 | level 2 | 0 |
| 2026-01-25 | level 3 | 0 |
| 2026-01-25 | level 2 | 1 |
Figure 47. Repeat and near repeat classification: Heating and smoke complaints over time 97
| period | series | value |
|---|---|---|
| 2025-09-29 | dust | 1 |
| 2025-09-29 | smell | 4 |
| 2025-09-29 | smoke from chimney | 4 |
| 2025-09-29 | waste burning | 4 |
| 2025-10-06 | dust | 6 |
| 2025-10-06 | smell | 4 |
| 2025-10-06 | smoke from chimney | 4 |
| 2025-10-06 | waste burning | 7 |
| 2025-10-13 | dust | 7 |
| 2025-10-13 | smell | 7 |
| 2025-10-13 | smoke from chimney | 8 |
| 2025-10-13 | waste burning | 8 |
| 2025-10-20 | dust | 6 |
| 2025-10-20 | smell | 5 |
| 2025-10-20 | smoke from chimney | 8 |
| 2025-10-20 | waste burning | 5 |
| 2025-10-27 | dust | 6 |
| 2025-10-27 | smell | 13 |
| 2025-10-27 | smoke from chimney | 5 |
| 2025-10-27 | waste burning | 7 |
| 2025-11-03 | dust | 3 |
| 2025-11-03 | smell | 8 |
| 2025-11-03 | smoke from chimney | 6 |
| 2025-11-03 | waste burning | 11 |
| 2025-11-10 | dust | 4 |
| 2025-11-10 | smell | 10 |
| 2025-11-10 | smoke from chimney | 8 |
| 2025-11-10 | waste burning | 7 |
| 2025-11-17 | dust | 11 |
| 2025-11-17 | smell | 8 |
| 2025-11-17 | smoke from chimney | 8 |
| 2025-11-17 | waste burning | 8 |
| 2025-11-24 | dust | 9 |
| 2025-11-24 | smell | 7 |
| 2025-11-24 | smoke from chimney | 6 |
| 2025-11-24 | waste burning | 7 |
| 2025-12-01 | dust | 4 |
| 2025-12-01 | smell | 3 |
| 2025-12-01 | smoke from chimney | 8 |
| 2025-12-01 | waste burning | 7 |
| 2025-12-08 | dust | 9 |
| 2025-12-08 | smell | 11 |
| 2025-12-08 | smoke from chimney | 10 |
| 2025-12-08 | waste burning | 12 |
| 2025-12-15 | dust | 9 |
| 2025-12-15 | smell | 12 |
| 2025-12-15 | smoke from chimney | 12 |
| 2025-12-15 | waste burning | 7 |
| 2025-12-22 | dust | 12 |
| 2025-12-22 | smell | 11 |
| 2025-12-22 | smoke from chimney | 8 |
| 2025-12-22 | waste burning | 10 |
| 2025-12-29 | dust | 11 |
| 2025-12-29 | smell | 15 |
| 2025-12-29 | smoke from chimney | 12 |
| 2025-12-29 | waste burning | 10 |
| 2026-01-05 | dust | 16 |
| 2026-01-05 | smell | 7 |
| 2026-01-05 | smoke from chimney | 10 |
| 2026-01-05 | waste burning | 7 |
| 2026-01-12 | dust | 26 |
| 2026-01-12 | smell | 33 |
| 2026-01-12 | smoke from chimney | 23 |
| 2026-01-12 | waste burning | 17 |
| 2026-01-19 | dust | 27 |
| 2026-01-19 | smell | 33 |
| 2026-01-19 | smoke from chimney | 26 |
| 2026-01-19 | waste burning | 23 |
| 2026-01-26 | dust | 8 |
| 2026-01-26 | smell | 11 |
| 2026-01-26 | smoke from chimney | 6 |
| 2026-01-26 | waste burning | 12 |
| 2026-02-02 | dust | 12 |
| 2026-02-02 | smell | 11 |
| 2026-02-02 | smoke from chimney | 14 |
| 2026-02-02 | waste burning | 11 |
| 2026-02-09 | dust | 17 |
| 2026-02-09 | smell | 8 |
| 2026-02-09 | smoke from chimney | 6 |
| 2026-02-09 | waste burning | 12 |
| 2026-02-16 | dust | 11 |
| 2026-02-16 | smell | 3 |
| 2026-02-16 | smoke from chimney | 8 |
| 2026-02-16 | waste burning | 6 |
| 2026-02-23 | dust | 8 |
| 2026-02-23 | smell | 9 |
| 2026-02-23 | smoke from chimney | 8 |
| 2026-02-23 | waste burning | 10 |
| 2026-03-02 | dust | 8 |
| 2026-03-02 | smell | 5 |
| 2026-03-02 | smoke from chimney | 9 |
| 2026-03-02 | waste burning | 9 |
| 2026-03-09 | dust | 8 |
| 2026-03-09 | smell | 10 |
| 2026-03-09 | smoke from chimney | 8 |
| 2026-03-09 | waste burning | 5 |
| 2026-03-16 | dust | 11 |
| 2026-03-16 | smell | 6 |
| 2026-03-16 | smoke from chimney | 6 |
| 2026-03-16 | waste burning | 9 |
| 2026-03-23 | dust | 11 |
| 2026-03-23 | smell | 6 |
| 2026-03-23 | smoke from chimney | 3 |
| 2026-03-23 | waste burning | 2 |
| 2026-03-30 | dust | 4 |
| 2026-03-30 | smell | 1 |
| 2026-03-30 | smoke from chimney | 5 |
| 2026-03-30 | waste burning | 2 |
GeoBit Large Spatial Model. Findings are labeled Evidenced (computed by a tool), Inferred (a reading or reasoning) or Unverified (no evidence yet).