Sample: Education, Toronto: report
Project: Sample: Education, Toronto
Goal: Describe the project Sample: Education, Toronto: run the analyses that tell the most about its data, draw every result, and write a cited report.
Run: 95849996-3ab1-4ed0-9250-b76a5d0b816f (running, 11 agent run(s))
Generated: 2026-10-18T06:06:03Z, version 1
Model cost: USD 0.0000 over 0 model call(s)
Data used
| Data | Kind | Rows | Time span | Summary | Source |
|---|---|---|---|---|---|
| Schools | vector, Point | 45 | 45 point features; 'level' has 3 values (top: elementary 30, middle 8, secondary 7); 'capacity' 350 to 1,597 (mean 663.3); 'enrolment' 266 to 1,355 (mean 603); 'built_year' 1,918 to 2,019 (mean 1965); named by 'name' (e.g. Southgate Elementary School, Eastfield Elementary School, Westbrook Elementary School); extent -79.4521,43.6511 to -79.3505,43.7074. Point locations of Schools by level. | 109 | |
| School catchments | vector, Polygon | 45 | 45 polygon (area) features; 'children_5_17' 924 to 5,561 (mean 2113); named by 'name' (e.g. Southgate Elementary School catchment, Eastfield Elementary School catchment, Westbrook Elementary School catchment); total area 63.02 km2; extent -79.4566,43.6477 to -79.3433,43.7123. Areas (School catchments) with children_5_17 to compare and map. | 110 | |
| Student homes | vector, Point | 2,500 | 2023-08-01 to 2026-09-30 | 2,500 point features; dated by 'enrolled_on' from 2023-08-01 to 2026-09-30; 'transport' has 4 values (top: walk 1125, bus 740, car 497); 'grade' 0 to 12 (mean 6.081); 'distance_km' 0.01 to 1.35 (mean 0.4847); named by 'student_ref' (e.g. ST00001, ST00002, ST00003); extent -79.4552,43.6481 to -79.3453,43.7112. Dated point events by transport: where and when Student homes happen. | 2 |
| Bus stops | vector, Point | 80 | 80 point features; 'school_run' has 2 values (top: True 45, False 35); 'routes' 1 to 4 (mean 2.425); extent -79.4545,43.6514 to -79.3453,43.7096. Point locations of Bus stops by school_run. | 111 | |
| Childcare centers | vector, Point | 60 | 60 point features; 'spaces' 22 to 118 (mean 75.68); 'waitlist' 0 to 79 (mean 43.85); extent -79.4542,43.6525 to -79.3469,43.7106. Point locations of Childcare centers. | 112 | |
| Housing developments | vector, Point | 40 | 2023-03-01 to 2027-11-01 | 40 point features; dated by 'completion_month' from 2023-03-01 to 2027-11-01; 'units' 53 to 629 (mean 243.4); 'family_units_pct' 11 to 59 (mean 33.98); extent -79.4441,43.6566 to -79.3486,43.7079. Dated point events: where and when Housing developments happen. | 3 |
| Major roads | vector, LineString | 22 | 22 line features; 'lanes' 4 to 4 (mean 4); named by 'name' (e.g. Bloor Nova Street, Dundas Nova Street, Front Street); total length 133.7 km; extent -79.4555,43.6484 to -79.3453,43.7111. Lines (Major roads) such as routes or networks. | 113 | |
| Enrollment by school and year | table | 270 | 2021-09-01 to 2026-09-01 | Table of 270 rows and 6 columns without geometry; dated by 'school_year' from 2021-09-01 to 2026-09-01; 'enrolment' 266 to 1,389 (mean 593.7); 'capacity' 350 to 1,597 (mean 663.3); 'utilization_pct' 72 to 134.5 (mean 90.88). A table of Enrollment by school and year without locations. | 4 |
| Staffing | table | 45 | Table of 45 rows and 4 columns without geometry; 'teachers' 12 to 61 (mean 26.89); 'support_staff' 2 to 14 (mean 8.267); 'portables' 0 to 8 (mean 0.8667). A table of Staffing without locations. | 114 | |
| School capacity review | document | 1-page md document 'School capacity review 2026'; language en; mentions 4 place(s): Maple Cross Elementary School (1), Parkside Middle School (1), Wren Park Elementary School (1), 43.69843, -79.36600 (1). A document about Maple Cross Elementary School, Parkside Middle School, Wren Park Elementary School. | 115 | ||
| Sample: Education, Toronto | record | 116 | |||
| Emerging hot spots: Student homes | layer, Polygon | 96 | 117 | ||
| Emerging hot spots: Housing developments | layer, Polygon | 22 | 118 | ||
| Repeat and near repeat classification: Student homes | layer, Point | 2,500 | 119 | ||
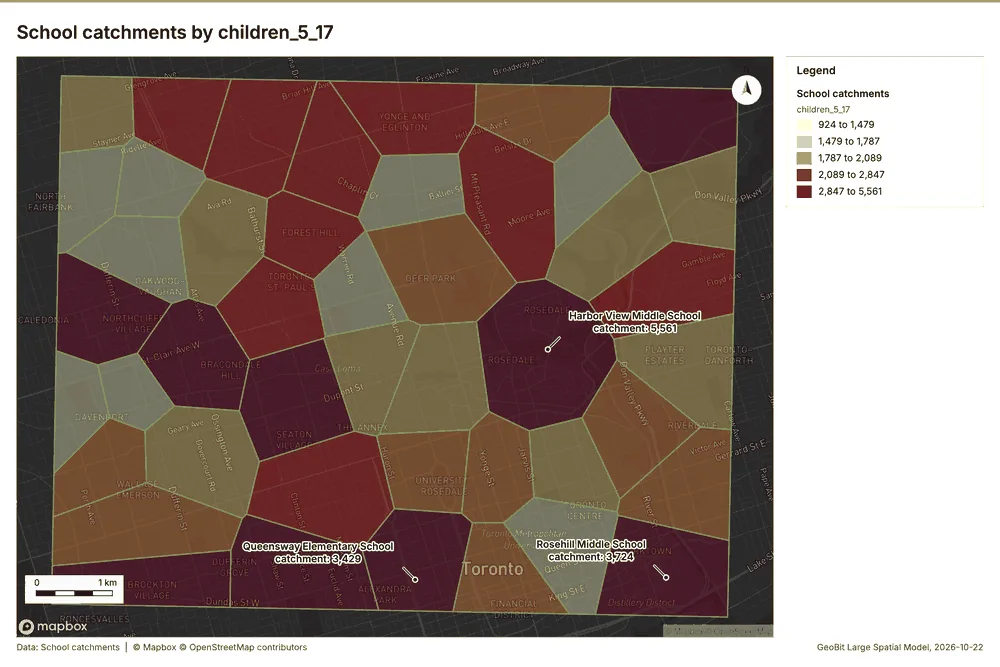
| Summarize within: School catchments | layer, Polygon | 45 | 120 | ||
| Summarize within: School catchments | layer, Polygon | 45 | 121 | ||
| Summarize within: School catchments | layer, Polygon | 45 | 122 | ||
| Hot spot analysis: Student homes | layer, Polygon | 281 | 123 | ||
| Hot spot analysis: Childcare centers | layer, Polygon | 20 | 124 | ||
| Hot spot analysis: Housing developments | layer, Point | 40 | 125 | ||
| Calculate density: Student homes | layer, Polygon | 1,838 | 126 | ||
| Calculate density: Childcare centers | layer, Polygon | 112 | 127 | ||
| Calculate density: Housing developments | layer, Polygon | 80 | 128 | ||
| Find point clusters: Student homes | layer, Point | 2,500 | 129 | ||
| Find point clusters: cluster hulls | layer, Polygon | 1 | 130 | ||
| Find point clusters: Childcare centers | layer, Point | 60 | 131 | ||
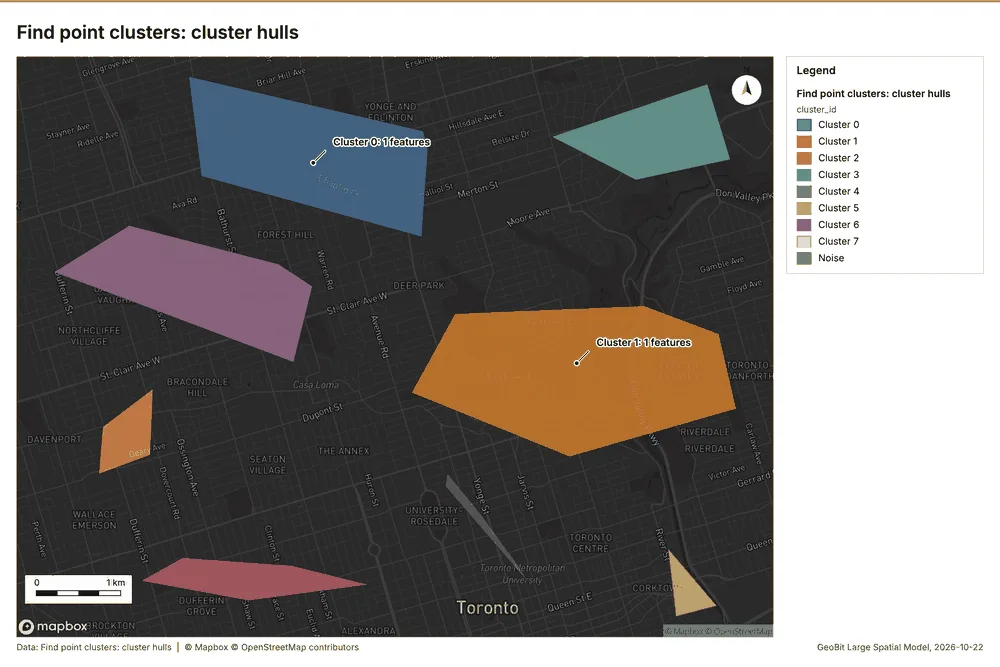
| Find point clusters: cluster hulls | layer, Polygon | 8 | 132 | ||
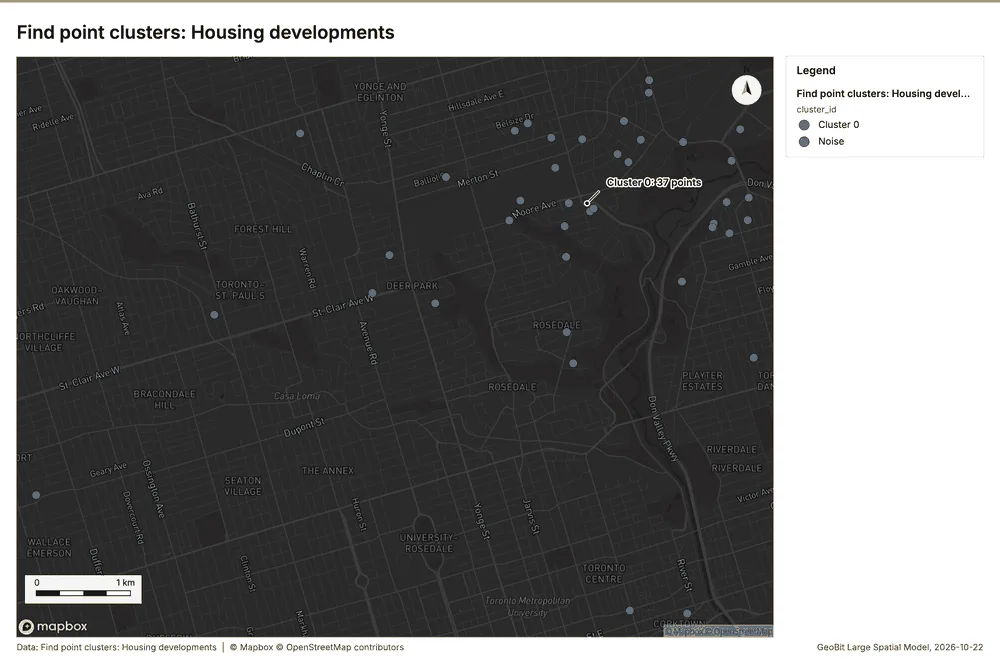
| Find point clusters: Housing developments | layer, Point | 40 | 133 | ||
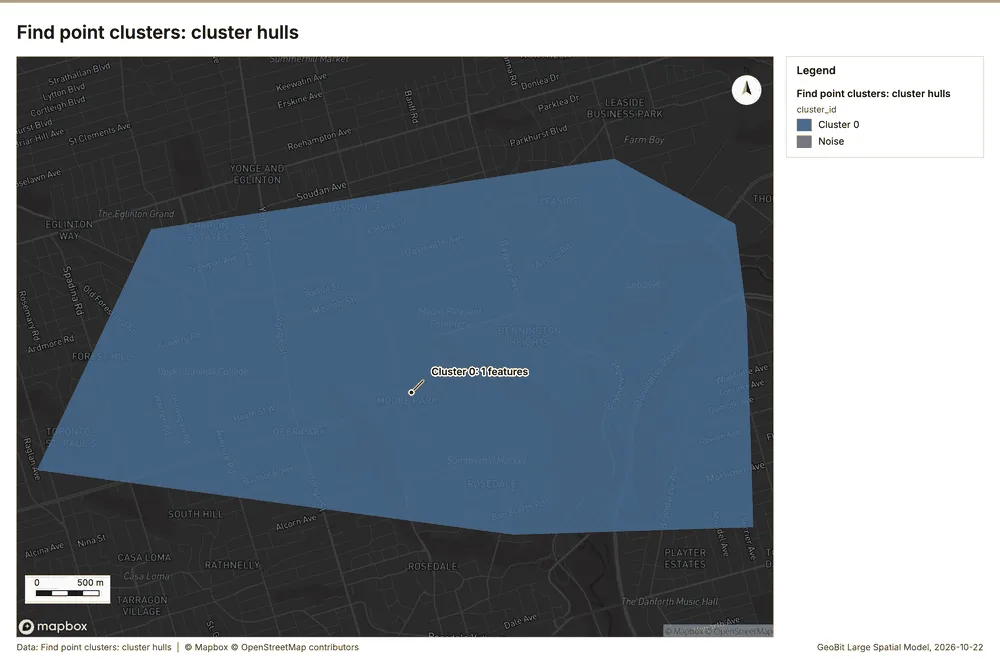
| Find point clusters: cluster hulls | layer, Polygon | 1 | 134 | ||
| Find outliers: School catchments | layer, Polygon | 45 | 135 | ||
| Find nearest: Student homes | layer, Point | 2,500 | 136 | ||
| Find nearest: Student homes | layer, Point | 2,500 | 137 | ||
| Find nearest: Student homes | layer, Point | 2,251 | 138 |
Timeline
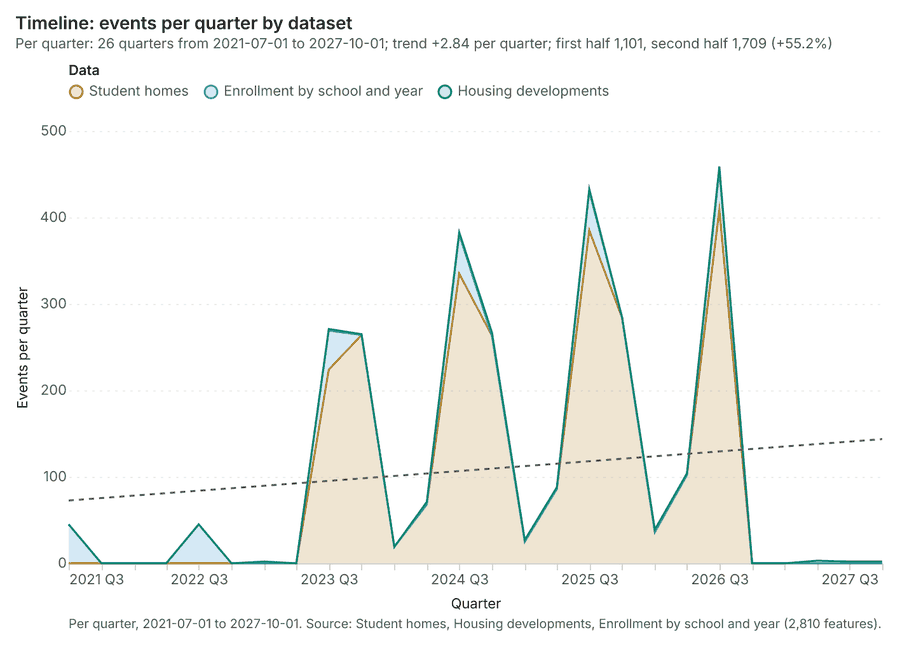
The timeline counts 2,810 dated events in Student homes, Housing developments, Enrollment by school and year per quarter, from Q3 2021 to Q4 2027 1234. By dataset: Student homes 2,500; Enrollment by school and year 270; Housing developments 40 1. The trend is +2.84 events per quarter; the second half of the quarters has 1,709 against 1,101 in the first (+55.2%) 1. 7 of the 26 quarters had no events 1.
Busiest quarters
Quietest quarters with events
Space time hot spots
What this analysis is. Emerging hot spots: Where hot spots are new, consecutive, intensifying, persistent, diminishing, sporadic, oscillating or historical over time 5. In ArcGIS it is Emerging Hot Spot Analysis or Create Space Time Cube 5.
Why it was run on this data. Student homes carry dates in 'enrolled_on': emerging hot spot analysis finds new, intensifying and fading hot spots per month 6.
What it found. The analysis generated 96 features for the "Emerging hot spots: Student homes" layer 7.
| Result | Value |
|---|---|
| result, count | 96 |
| result, elapsed ms | 19 |
| result, resolution | 8 |
| result, features used | 2,500 |
| result, time neighbors | 0 |
| billing, cost | 0.225 |
| billing, list price | 0.225 |
| billing, upstream cost | 0 |
Findings
- Evidenced: Space time hot spots on Student homes: Emerging hot spots: 1 layer saved: Emerging hot spots: Student homes (96 features) 78.
- Evidenced: It reported result, count 96; result, elapsed ms 19; result, resolution 8; result, features used 2,500; result, time neighbors 0; billing, cost 0.225 7.
Tool gp_space_time_hot_spots; parameters {"project": "89129455-9e05-4edb-9cc1-dcfb440cc5ba", "features": {"layer": "Student homes (05789208)"}, "interval": "month", "bin_shape": "h3", "resolution": 8, "time_field": "enrolled_on"}
Space time hot spots
What this analysis is. Emerging hot spots: Where hot spots are new, consecutive, intensifying, persistent, diminishing, sporadic, oscillating or historical over time 5. In ArcGIS it is Emerging Hot Spot Analysis or Create Space Time Cube 5.
Why it was run on this data. Housing developments carry dates in 'completion_month': emerging hot spot analysis finds new, intensifying and fading hot spots per month 9.
What it found. The analysis processed the Housing developments layer 11, resulting in an Emerging hot spots layer containing 22 features 10.
| Result | Value |
|---|---|
| result, count | 22 |
| result, elapsed ms | 4 |
| result, resolution | 7 |
| result, features used | 40 |
| result, time neighbors | 0 |
| billing, cost | 0.102 |
| billing, list price | 0.102 |
| billing, upstream cost | 0 |
Findings
- Evidenced: Space time hot spots on Housing developments: Emerging hot spots: 1 layer saved: Emerging hot spots: Housing developments (22 features) 1011.
- Evidenced: It reported result, count 22; result, elapsed ms 4; result, resolution 7; result, features used 40; result, time neighbors 0; billing, cost 0.102 10.
Tool gp_space_time_hot_spots; parameters {"agg": "sum", "project": "89129455-9e05-4edb-9cc1-dcfb440cc5ba", "features": {"layer": "Housing developments (afc1332b)"}, "interval": "month", "bin_shape": "h3", "resolution": 7, "time_field": "completion_month", "value_field": "units"}
Near repeat
What this analysis is. Repeat and near repeat classification: Classify incidents as originators, repeats (same place) or near repeats within a distance and time window, with a Knox test table 12. In ArcGIS it is Repeat and Near Repeat Classification or Near Repeat Calculator 12.
Why it was run on this data. Near repeat analysis tests whether Student homes close in space also follow each other within 30 days 13.
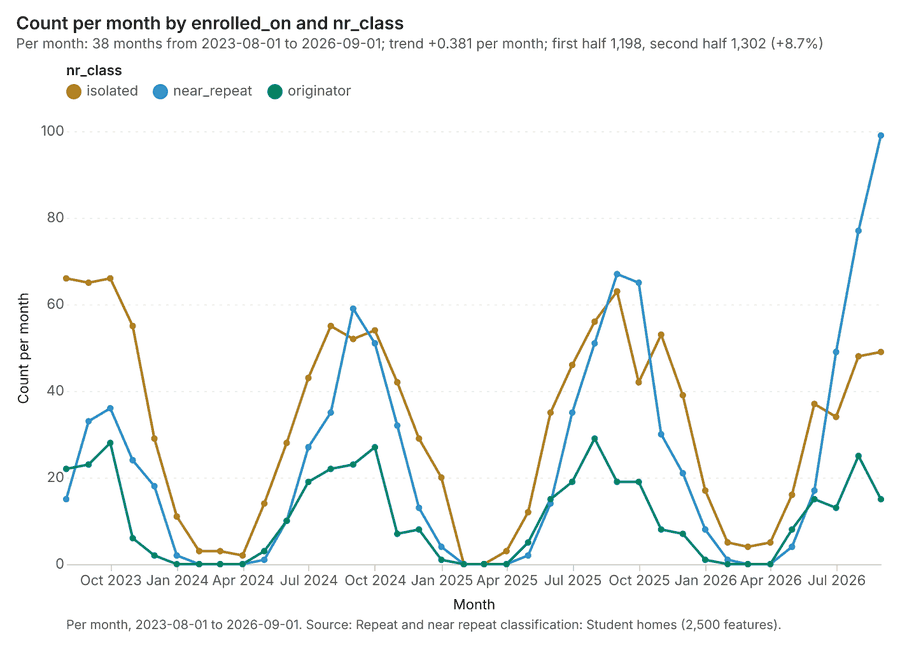
What it found. Near repeat on Student homes: Repeat and near repeat classification: 1 layer saved: Repeat and near repeat classification: Student homes (2500 features) 814. It reported result, days 30; result, count 2,500; result, chains 284; result, distance m 200; result, elapsed ms 61; result, pairs linked 1,594 14.
| Result | Value |
|---|---|
| result, days | 30 |
| result, count | 2,500 |
| result, chains | 284 |
| result, distance m | 200 |
| result, elapsed ms | 61 |
| result, pairs linked | 1,594 |
| billing, cost | 0.125 |
| billing, list price | 0.125 |
| billing, upstream cost | 0 |
Findings
- Evidenced: Near repeat on Student homes: Repeat and near repeat classification: 1 layer saved: Repeat and near repeat classification: Student homes (2500 features) 814.
- Evidenced: It reported result, days 30; result, count 2,500; result, chains 284; result, distance m 200; result, elapsed ms 61; result, pairs linked 1,594 14.
Tool gp_near_repeat; parameters {"days": 30, "project": "89129455-9e05-4edb-9cc1-dcfb440cc5ba", "features": {"layer": "Student homes (05789208)"}, "distance_m": 200.0, "time_field": "enrolled_on"}
Summarize within
What this analysis is. Summarize within: Count and aggregate the features inside each polygon (or bin), proportionally for lines and polygons 15. In ArcGIS it is Summarize Within or Aggregate Points; in QGIS, native:countpointsinpolygon or native:sumlinelengths 15.
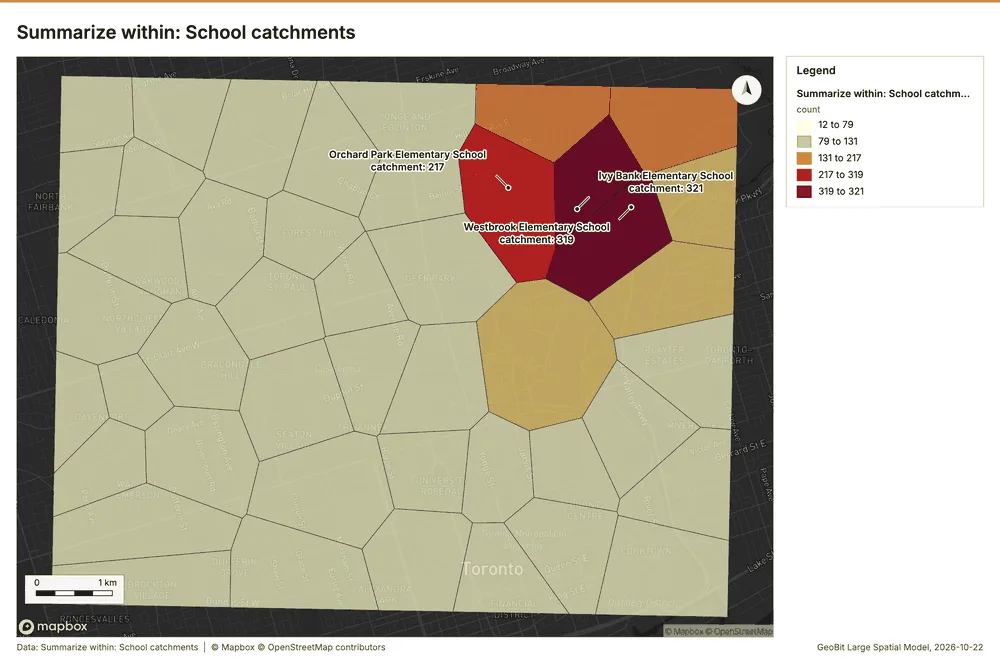
Why it was run on this data. Count Student homes inside each feature of School catchments by transport; the counts map as a choropleth (natural breaks, sequential colors) 16.
What it found. Summarize within on Student homes, School catchments: Summarize within: 1 layer saved: Summarize within: School catchments (45 features) 81718. It reported result, count 45; result, elapsed ms 6; billing, cost 0.06092; billing, list price 0.06092; billing, upstream cost 0 17.
| Result | Value |
|---|---|
| result, count | 45 |
| result, elapsed ms | 6 |
| billing, cost | 0.06092 |
| billing, list price | 0.06092 |
| billing, upstream cost | 0 |
Findings
- Evidenced: Summarize within on Student homes, School catchments: Summarize within: 1 layer saved: Summarize within: School catchments (45 features) 81718.
- Evidenced: It reported result, count 45; result, elapsed ms 6; billing, cost 0.06092; billing, list price 0.06092; billing, upstream cost 0 17.
Tool gp_summarize_within; parameters {"stats": [{"stat": "sum", "field": "grade"}], "project": "89129455-9e05-4edb-9cc1-dcfb440cc5ba", "features": {"layer": "Student homes (05789208)"}, "group_by": "transport", "polygons": {"layer": "School catchments (534622c6)"}}
Summarize within
What this analysis is. Summarize within: Count and aggregate the features inside each polygon (or bin), proportionally for lines and polygons 15. In ArcGIS it is Summarize Within or Aggregate Points; in QGIS, native:countpointsinpolygon or native:sumlinelengths 15.
Why it was run on this data. Count Student homes inside each feature of School catchments by transport; the counts map as a choropleth (natural breaks, sequential colors) 16.
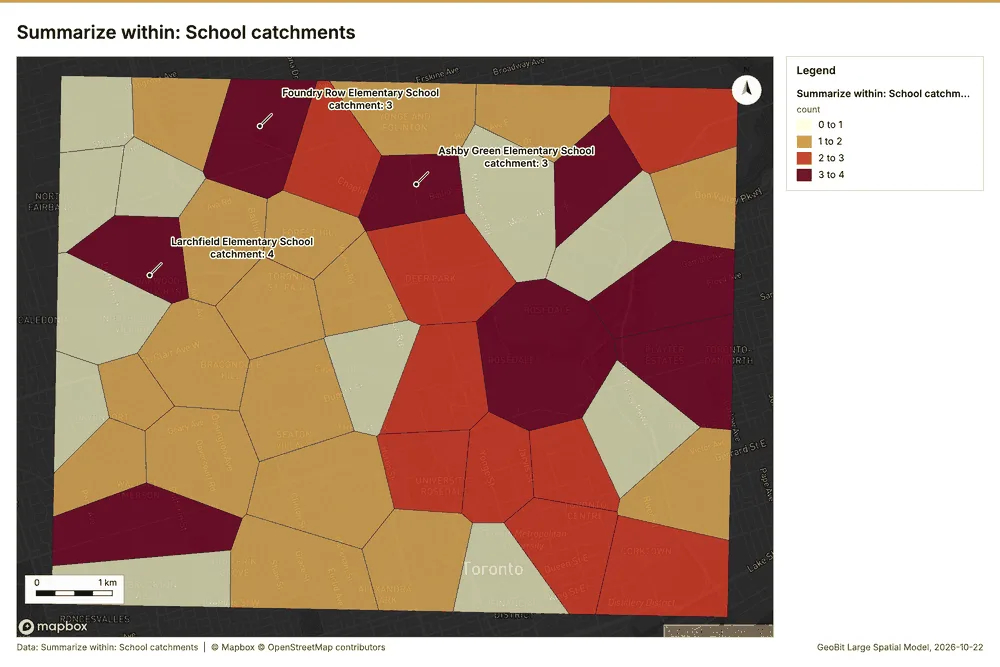
What it found. Summarize within on Childcare centers, School catchments: Summarize within: 1 layer saved: Summarize within: School catchments (45 features) 181920. It reported result, count 45; result, elapsed ms 1; billing, cost 0.01212; billing, list price 0.01212; billing, upstream cost 0 19.
| Result | Value |
|---|---|
| result, count | 45 |
| result, elapsed ms | 1 |
| billing, cost | 0.01212 |
| billing, list price | 0.01212 |
| billing, upstream cost | 0 |
Findings
- Evidenced: Summarize within on Childcare centers, School catchments: Summarize within: 1 layer saved: Summarize within: School catchments (45 features) 181920.
- Evidenced: It reported result, count 45; result, elapsed ms 1; billing, cost 0.01212; billing, list price 0.01212; billing, upstream cost 0 19.
Tool gp_summarize_within; parameters {"stats": [{"stat": "sum", "field": "spaces"}], "project": "89129455-9e05-4edb-9cc1-dcfb440cc5ba", "features": {"layer": "Childcare centers (9489916f)"}, "polygons": {"layer": "School catchments (534622c6)"}}
Summarize within
What this analysis is. Summarize within: Count and aggregate the features inside each polygon (or bin), proportionally for lines and polygons 15. In ArcGIS it is Summarize Within or Aggregate Points; in QGIS, native:countpointsinpolygon or native:sumlinelengths 15.
Why it was run on this data. Count Student homes inside each feature of School catchments by transport; the counts map as a choropleth (natural breaks, sequential colors) 16.
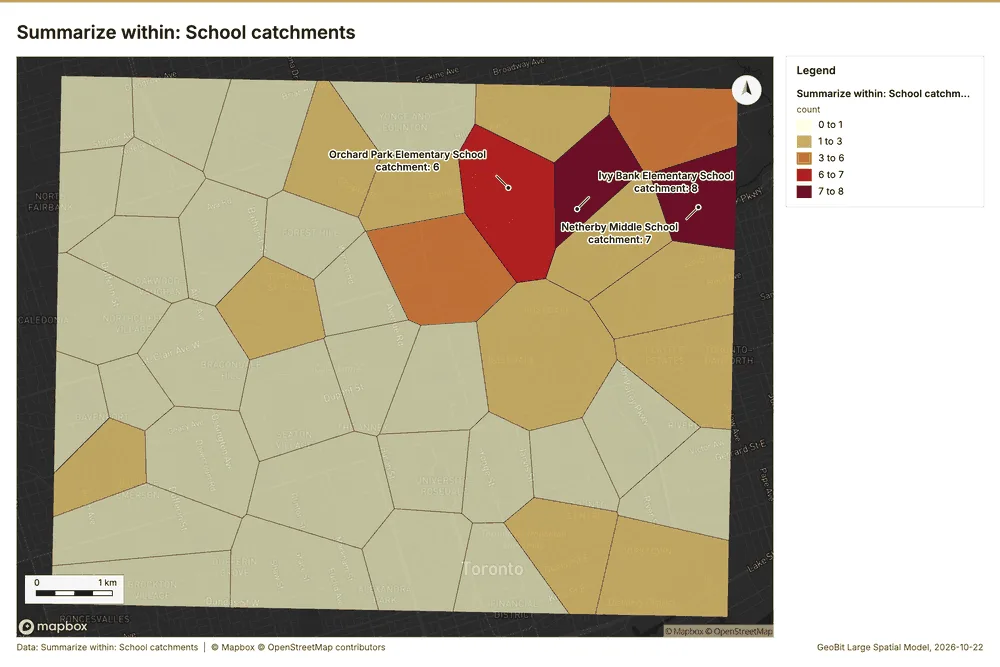
What it found. Summarize within on Housing developments, School catchments: Summarize within: 1 layer saved: Summarize within: School catchments (45 features) 111821. It reported result, count 45; result, elapsed ms 1; billing, cost 0.01172; billing, list price 0.01172; billing, upstream cost 0 21.
| Result | Value |
|---|---|
| result, count | 45 |
| result, elapsed ms | 1 |
| billing, cost | 0.01172 |
| billing, list price | 0.01172 |
| billing, upstream cost | 0 |
Findings
- Evidenced: Summarize within on Housing developments, School catchments: Summarize within: 1 layer saved: Summarize within: School catchments (45 features) 111821.
- Evidenced: It reported result, count 45; result, elapsed ms 1; billing, cost 0.01172; billing, list price 0.01172; billing, upstream cost 0 21.
Tool gp_summarize_within; parameters {"stats": [{"stat": "sum", "field": "units"}], "project": "89129455-9e05-4edb-9cc1-dcfb440cc5ba", "features": {"layer": "Housing developments (afc1332b)"}, "polygons": {"layer": "School catchments (534622c6)"}}
Hot spots
What this analysis is. Hot spot analysis: Getis-Ord Gi* hot and cold spots with z-scores, p-values and confidence bins 22. In ArcGIS it is Find Hot Spots or Hot Spot Analysis (Getis-Ord Gi*); in QGIS, qgis:hotspot (plugin) 22.
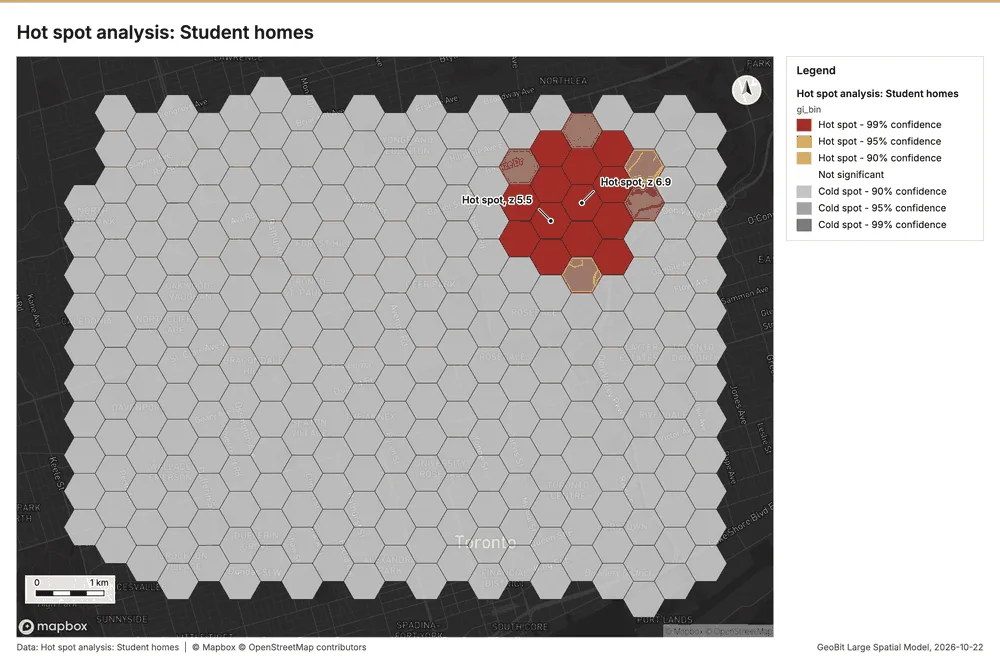
Why it was run on this data. 2500 points: Getis-Ord Gi* tests whether the concentrations in Student homes are statistically significant 23.
What it found. Hot spots on Student homes: Hot spot analysis: 1 layer saved: Hot spot analysis: Student homes (281 features) 824. It reported result, bins 281; result, count 281; result, elapsed ms 23; result, cell size m 500; result, incidents used 2,500; result, distance band m 500 24.
| Result | Value |
|---|---|
| result, bins | 281 |
| result, count | 281 |
| result, elapsed ms | 23 |
| result, cell size m | 500 |
| result, incidents used | 2,500 |
| result, distance band m | 500 |
| billing, cost | 0.1 |
| billing, list price | 0.1 |
| billing, upstream cost | 0 |
Findings
- Evidenced: Hot spots on Student homes: Hot spot analysis: 1 layer saved: Hot spot analysis: Student homes (281 features) 824.
- Evidenced: It reported result, bins 281; result, count 281; result, elapsed ms 23; result, cell size m 500; result, incidents used 2,500; result, distance band m 500 24.
A model draft was discarded because a sentence did not cite a source of this section.
Tool gp_hot_spots; parameters {"project": "89129455-9e05-4edb-9cc1-dcfb440cc5ba", "features": {"layer": "Student homes (05789208)"}, "aggregation": "hexagon", "cell_size_m": 500.0, "distance_band_m": 500.0}
Hot spots
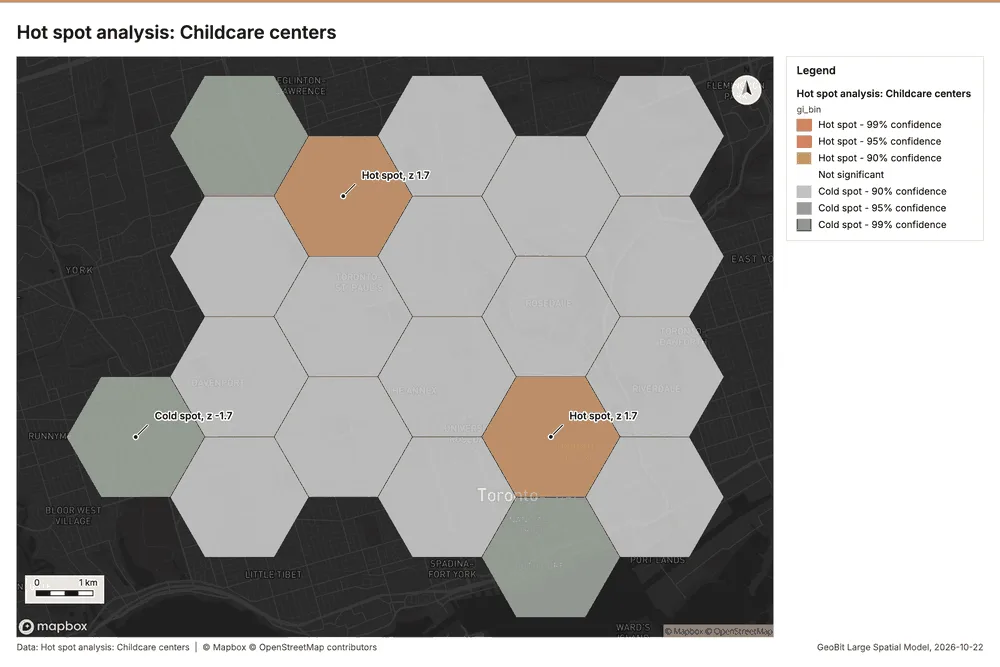
What this analysis is. Hot spot analysis: Getis-Ord Gi* hot and cold spots with z-scores, p-values and confidence bins 22. In ArcGIS it is Find Hot Spots or Hot Spot Analysis (Getis-Ord Gi*); in QGIS, qgis:hotspot (plugin) 22.
Why it was run on this data. 60 points: Getis-Ord Gi* tests whether the concentrations in Childcare centers are statistically significant 25.
What it found. Hot spots on Childcare centers: Hot spot analysis: 1 layer saved: Hot spot analysis: Childcare centers (20 features) 2026. It reported result, bins 20; result, count 20; result, elapsed ms 2; result, cell size m 2,000; result, incidents used 60; result, distance band m 2,000 26.
| Result | Value |
|---|---|
| result, bins | 20 |
| result, count | 20 |
| result, elapsed ms | 2 |
| result, cell size m | 2,000 |
| result, incidents used | 60 |
| result, distance band m | 2,000 |
| billing, cost | 0.0512 |
| billing, list price | 0.0512 |
| billing, upstream cost | 0 |
Findings
- Evidenced: Hot spots on Childcare centers: Hot spot analysis: 1 layer saved: Hot spot analysis: Childcare centers (20 features) 2026.
- Evidenced: It reported result, bins 20; result, count 20; result, elapsed ms 2; result, cell size m 2,000; result, incidents used 60; result, distance band m 2,000 26.
Tool gp_hot_spots; parameters {"project": "89129455-9e05-4edb-9cc1-dcfb440cc5ba", "features": {"layer": "Childcare centers (9489916f)"}, "aggregation": "hexagon", "cell_size_m": 2000.0, "distance_band_m": 2000.0}
Hot spots
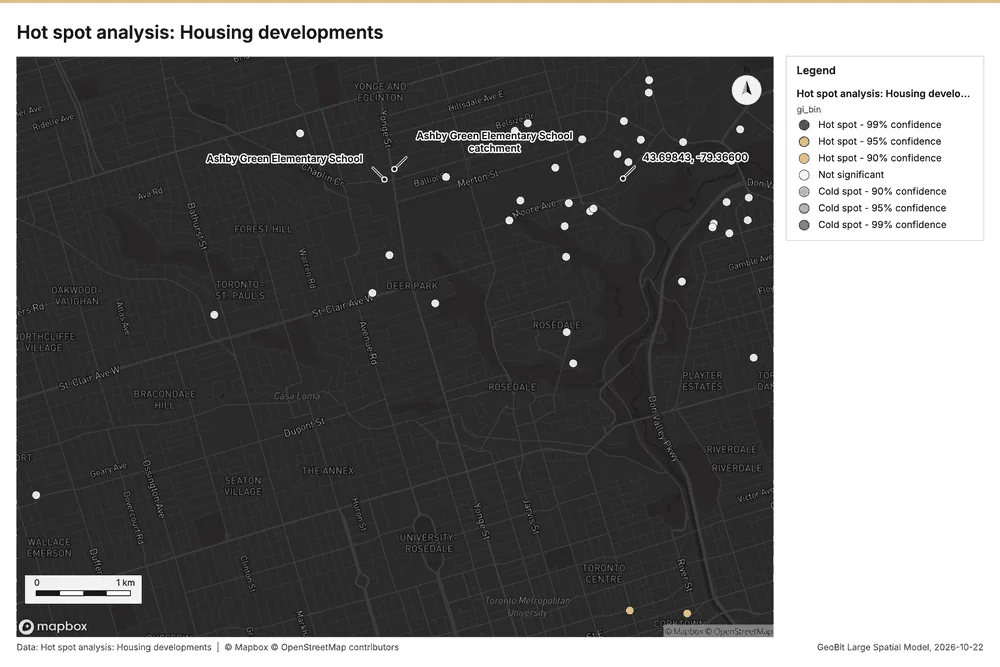
What this analysis is. Hot spot analysis: Getis-Ord Gi* hot and cold spots with z-scores, p-values and confidence bins 22. In ArcGIS it is Find Hot Spots or Hot Spot Analysis (Getis-Ord Gi*); in QGIS, qgis:hotspot (plugin) 22.
Why it was run on this data. 40 points: Getis-Ord Gi* tests whether the concentrations in Housing developments are statistically significant 27.
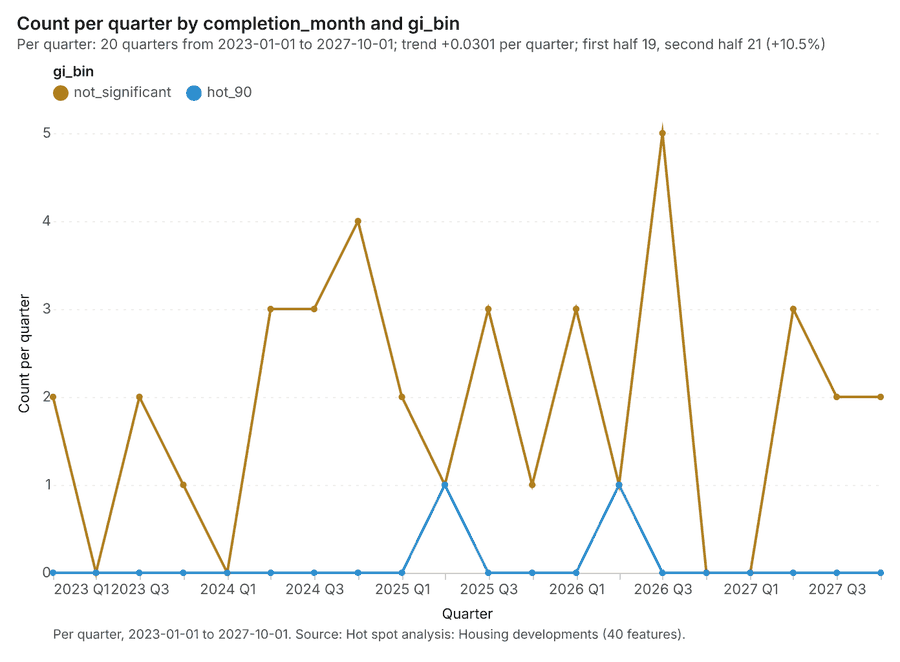
What it found. The hot spot analysis was performed using the Housing developments layer 11 and saved one layer, "Hot spot analysis: Housing developments," containing 40 features 28. This execution step resulted in an elapsed time of 1 ms 28. The analysis also generated a result set with 0 excluded null values 28, and total billing costs for the process amounted to 0.0508 28.
| Result | Value |
|---|---|
| result, count | 40 |
| result, elapsed ms | 1 |
| result, excluded null | 0 |
| result, distance band m | 2,000 |
| billing, cost | 0.0508 |
| billing, list price | 0.0508 |
| billing, upstream cost | 0 |
Findings
- Evidenced: Hot spots on Housing developments: Hot spot analysis: 1 layer saved: Hot spot analysis: Housing developments (40 features) 1128.
- Evidenced: It reported result, count 40; result, elapsed ms 1; result, excluded null 0; result, distance band m 2,000; billing, cost 0.0508; billing, list price 0.0508 28.
Tool gp_hot_spots; parameters {"field": "units", "project": "89129455-9e05-4edb-9cc1-dcfb440cc5ba", "features": {"layer": "Housing developments (afc1332b)"}, "aggregation": "hexagon", "cell_size_m": 2000.0, "distance_band_m": 2000.0}
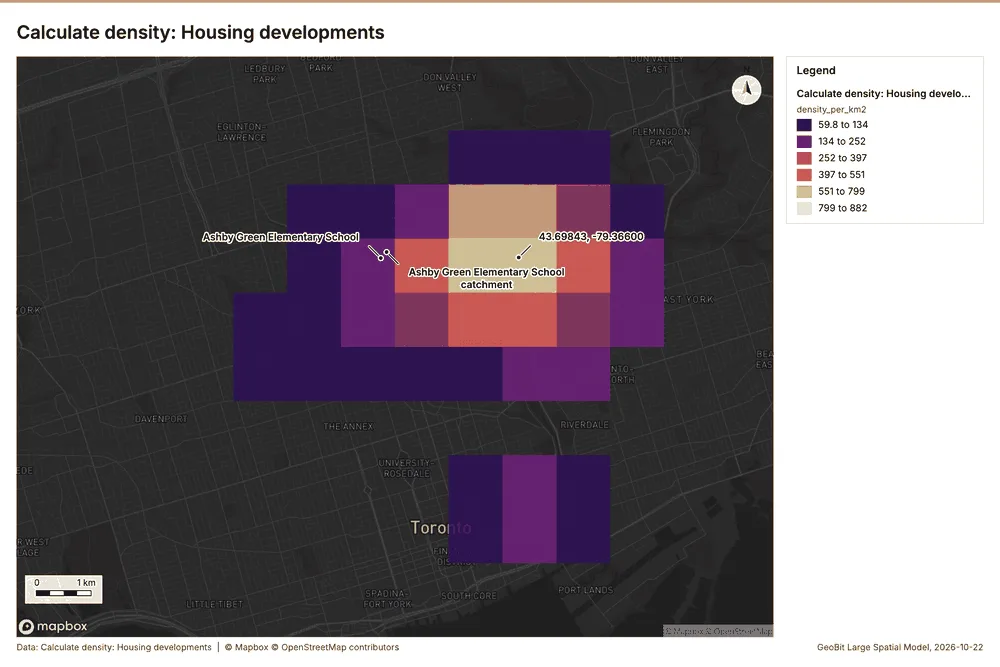
Calculate density
What this analysis is. Calculate density: Kernel density per square kilometer on a grid 29. In ArcGIS it is Calculate Density or Kernel Density; in QGIS, native:heatmapkerneldensityestimation 29.
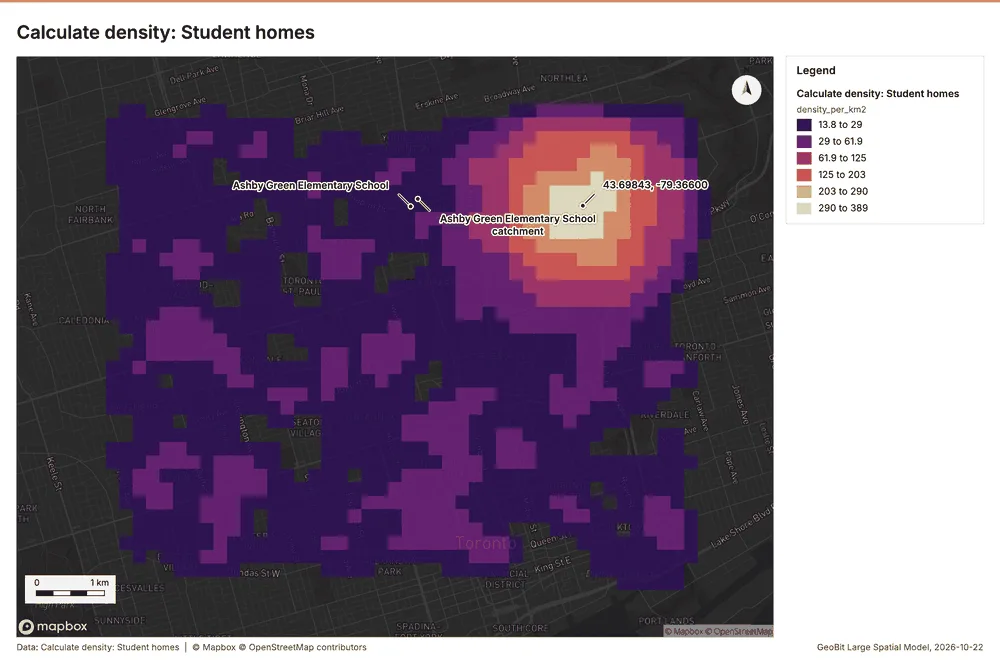
Why it was run on this data. 2500 points in Student homes: a density surface shows where they concentrate 30.
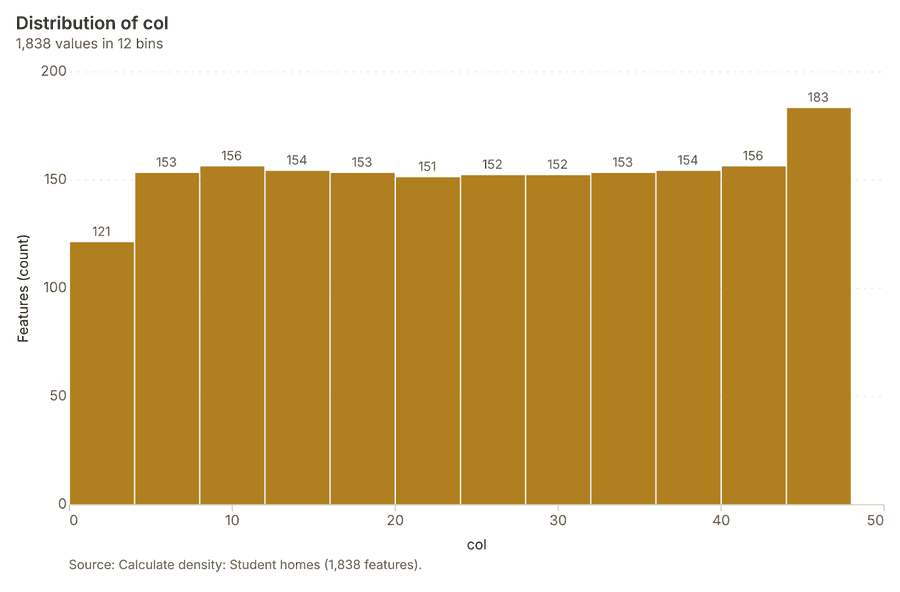
What it found. The density calculation was performed using the Student homes dataset 31. This process analyzed 1,838 features and reported a maximum density per km2 of 388.8 31.
| Result | Value |
|---|---|
| result, count | 1,838 |
| result, elapsed ms | 59 |
| result, bandwidth m | 500 |
| result, cell size m | 200 |
| result, excluded null | 0 |
| result, max density per km2 | 388.8 |
| billing, cost | 0.1 |
| billing, list price | 0.1 |
| billing, upstream cost | 0 |
Findings
- Evidenced: Calculate density on Student homes: Calculate density: 1 layer saved: Calculate density: Student homes (1838 features) 831.
- Evidenced: It reported result, count 1,838; result, elapsed ms 59; result, bandwidth m 500; result, cell size m 200; result, excluded null 0; result, max density per km2 388.8 31.
Tool gp_calculate_density; parameters {"kernel": "quartic", "project": "89129455-9e05-4edb-9cc1-dcfb440cc5ba", "features": {"layer": "Student homes (05789208)"}, "bandwidth_m": 500.0, "cell_size_m": 200.0}
Calculate density
What this analysis is. Calculate density: Kernel density per square kilometer on a grid 29. In ArcGIS it is Calculate Density or Kernel Density; in QGIS, native:heatmapkerneldensityestimation 29.
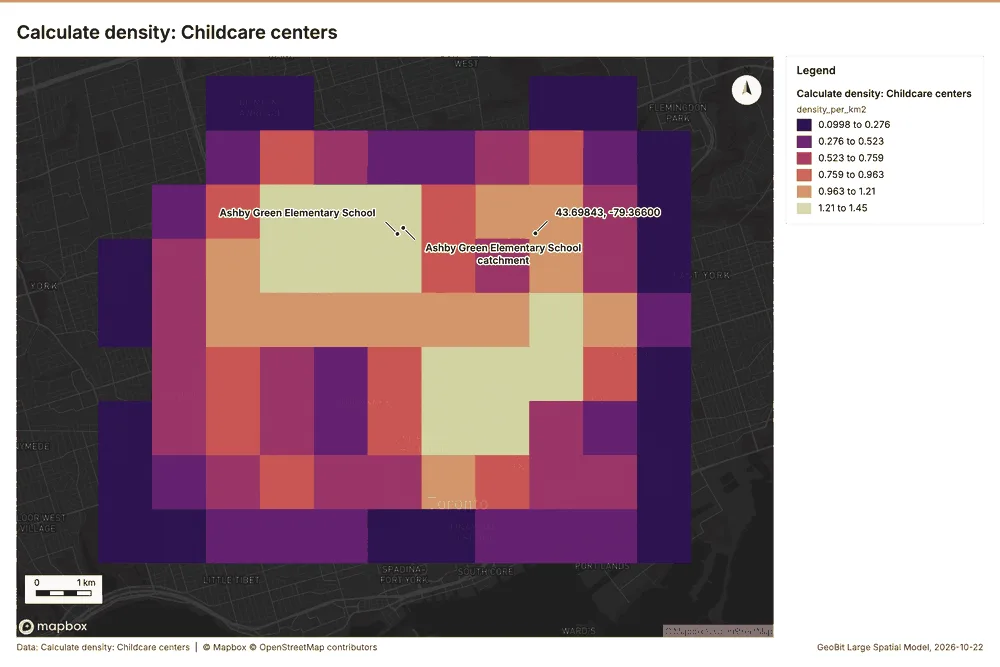
Why it was run on this data. 60 points in Childcare centers: a density surface shows where they concentrate 32.
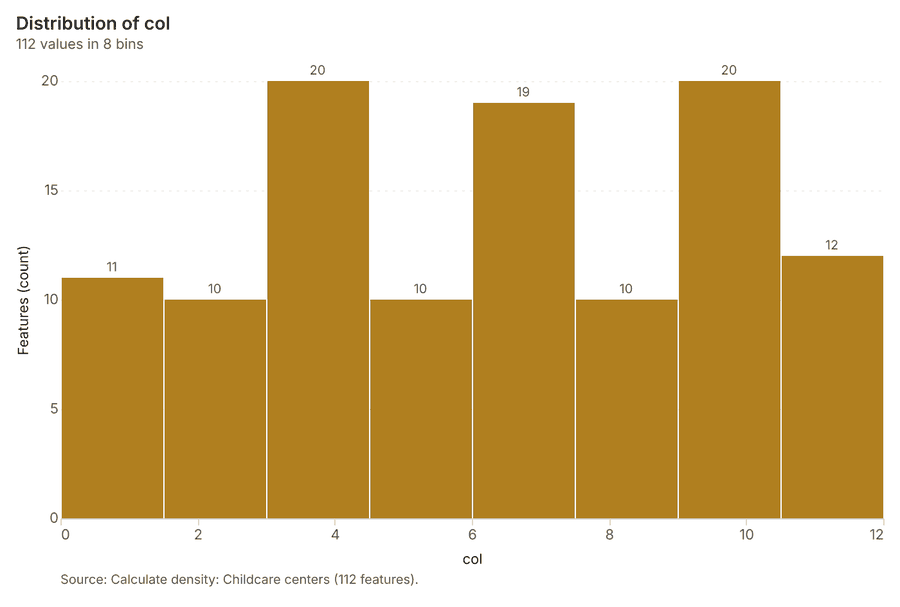
What it found. Calculate density on Childcare centers: Calculate density: 1 layer saved: Calculate density: Childcare centers (112 features) 2033. It reported result, count 112; result, elapsed ms 3; result, bandwidth m 2,000; result, cell size m 1,000; result, excluded null 0; result, max density per km2 1.453 33.
| Result | Value |
|---|---|
| result, count | 112 |
| result, elapsed ms | 3 |
| result, bandwidth m | 2,000 |
| result, cell size m | 1,000 |
| result, excluded null | 0 |
| result, max density per km2 | 1.453 |
| billing, cost | 0.0512 |
| billing, list price | 0.0512 |
| billing, upstream cost | 0 |
Findings
- Evidenced: Calculate density on Childcare centers: Calculate density: 1 layer saved: Calculate density: Childcare centers (112 features) 2033.
- Evidenced: It reported result, count 112; result, elapsed ms 3; result, bandwidth m 2,000; result, cell size m 1,000; result, excluded null 0; result, max density per km2 1.453 33.
Tool gp_calculate_density; parameters {"kernel": "quartic", "project": "89129455-9e05-4edb-9cc1-dcfb440cc5ba", "features": {"layer": "Childcare centers (9489916f)"}, "bandwidth_m": 2000.0, "cell_size_m": 1000.0}
Calculate density
What this analysis is. Calculate density: Kernel density per square kilometer on a grid 29. In ArcGIS it is Calculate Density or Kernel Density; in QGIS, native:heatmapkerneldensityestimation 29.
Why it was run on this data. 40 points in Housing developments: a density surface shows where they concentrate 34.
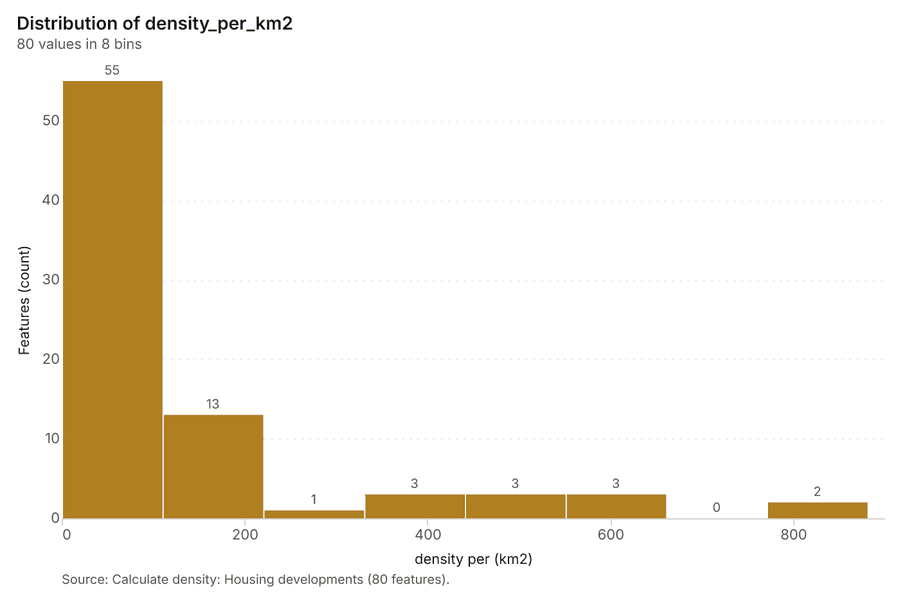
What it found. Calculate density on Housing developments: Calculate density: 1 layer saved: Calculate density: Housing developments (80 features) 1135. It reported result, count 80; result, elapsed ms 3; result, bandwidth m 2,000; result, cell size m 1,000; result, excluded null 0; result, max density per km2 881.6 35.
| Result | Value |
|---|---|
| result, count | 80 |
| result, elapsed ms | 3 |
| result, bandwidth m | 2,000 |
| result, cell size m | 1,000 |
| result, excluded null | 0 |
| result, max density per km2 | 881.6 |
| billing, cost | 0.0508 |
| billing, list price | 0.0508 |
| billing, upstream cost | 0 |
Findings
- Evidenced: Calculate density on Housing developments: Calculate density: 1 layer saved: Calculate density: Housing developments (80 features) 1135.
- Evidenced: It reported result, count 80; result, elapsed ms 3; result, bandwidth m 2,000; result, cell size m 1,000; result, excluded null 0; result, max density per km2 881.6 35.
Tool gp_calculate_density; parameters {"kernel": "quartic", "project": "89129455-9e05-4edb-9cc1-dcfb440cc5ba", "features": {"layer": "Housing developments (afc1332b)"}, "bandwidth_m": 2000.0, "cell_size_m": 1000.0, "weight_field": "units"}
Find point clusters
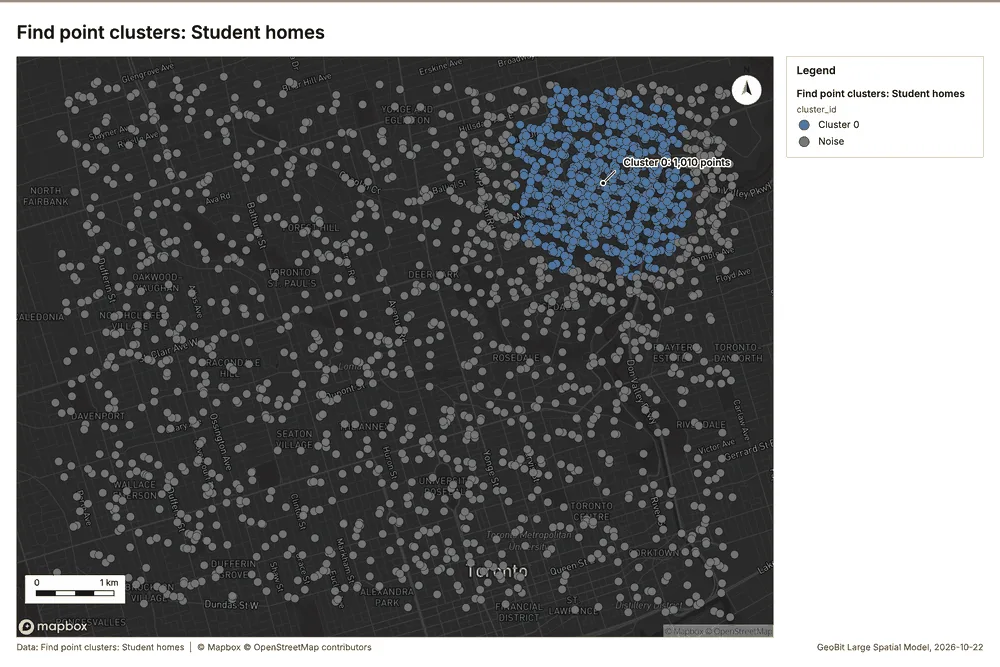
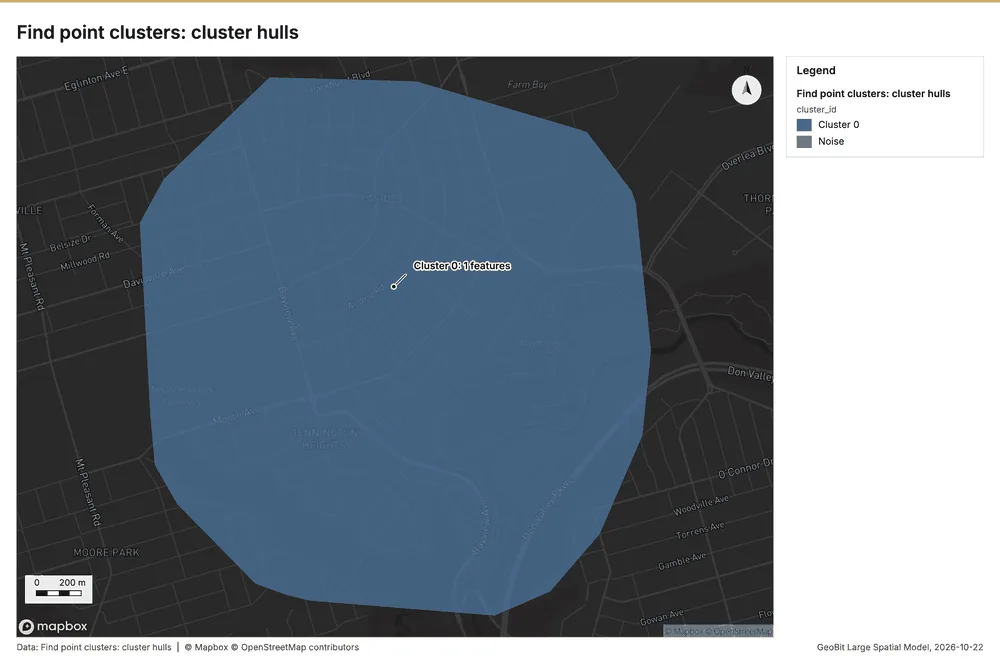
What this analysis is. Find point clusters: Density-based clusters (DBSCAN, HDBSCAN or OPTICS, optionally space-time) with hulls and noise 36. In ArcGIS it is Find Point Clusters or Density-based Clustering; in QGIS, native:dbscanclustering or native:stdbscanclustering 36.
Why it was run on this data. DBSCAN finds dense groups of Student homes and separates noise 37.
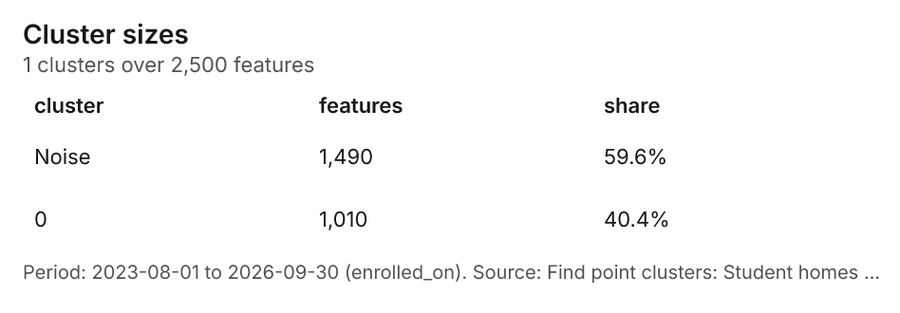
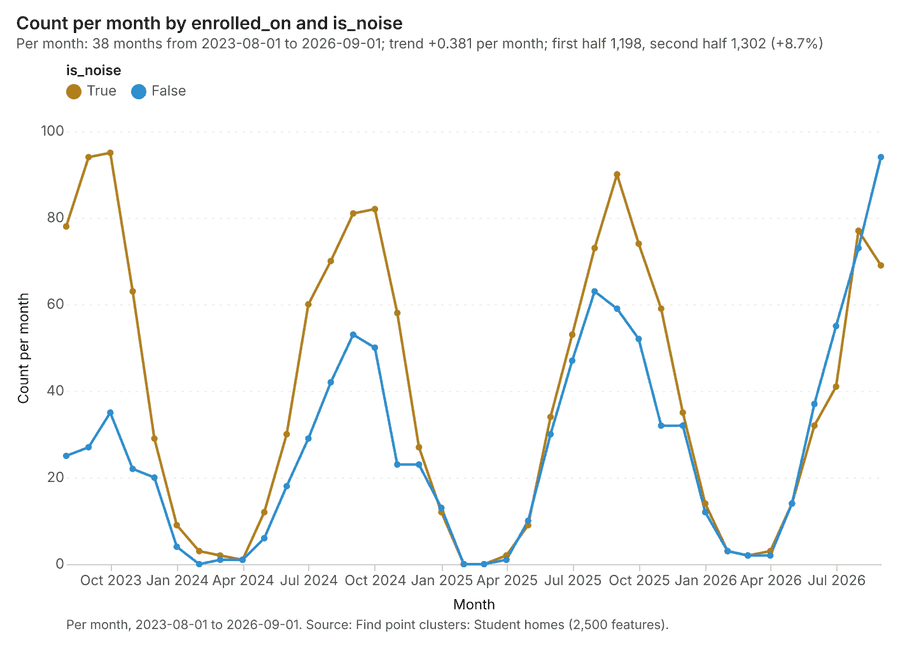
What it found. Find point clusters on Student homes: Find point clusters: 2 layers saved: Find point clusters: Student homes (2500 features); Find point clusters: cluster hulls (1 feature) 838. It reported result, count 2,500; result, noise 1,490; result, distance m 200; result, elapsed ms 32; result, min points 20; billing, cost 0.1 38.
| Result | Value |
|---|---|
| result, count | 2,500 |
| result, noise | 1,490 |
| result, distance m | 200 |
| result, elapsed ms | 32 |
| result, min points | 20 |
| billing, cost | 0.1 |
| billing, list price | 0.1 |
| billing, upstream cost | 0 |
Findings
- Evidenced: Find point clusters on Student homes: Find point clusters: 2 layers saved: Find point clusters: Student homes (2500 features); Find point clusters: cluster hulls (1 feature) 838.
- Evidenced: It reported result, count 2,500; result, noise 1,490; result, distance m 200; result, elapsed ms 32; result, min points 20; billing, cost 0.1 38.
A model draft was discarded because a sentence did not cite a source of this section.
Tool gp_find_point_clusters; parameters {"method": "dbscan", "project": "89129455-9e05-4edb-9cc1-dcfb440cc5ba", "features": {"layer": "Student homes (05789208)"}, "distance_m": 200.0, "min_points": 20}
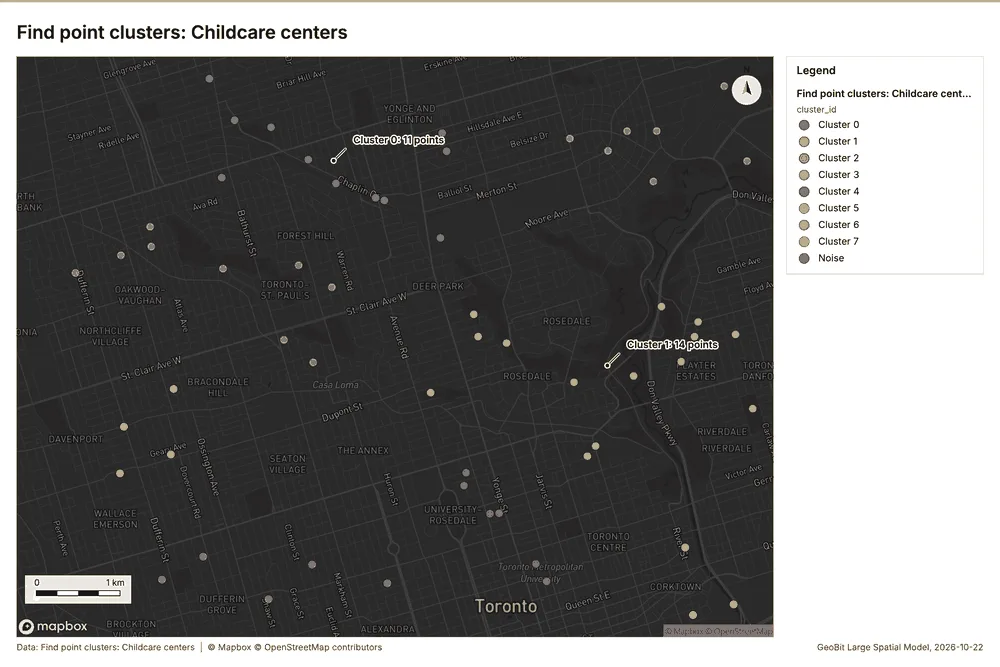
Find point clusters
What this analysis is. Find point clusters: Density-based clusters (DBSCAN, HDBSCAN or OPTICS, optionally space-time) with hulls and noise 36. In ArcGIS it is Find Point Clusters or Density-based Clustering; in QGIS, native:dbscanclustering or native:stdbscanclustering 36.
Why it was run on this data. DBSCAN finds dense groups of Childcare centers and separates noise 39.
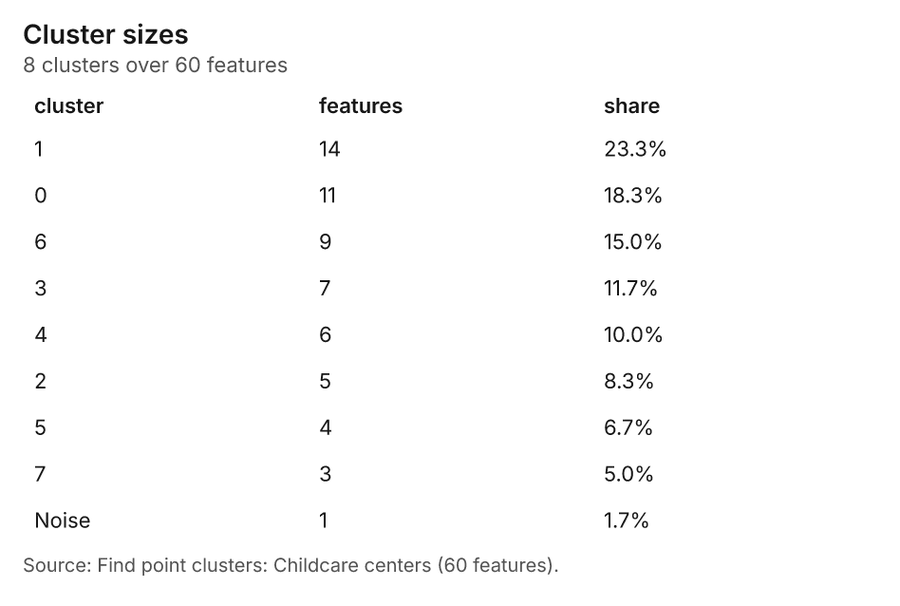
What it found. Find point clusters on Childcare centers: Find point clusters: 2 layers saved: Find point clusters: Childcare centers (60 features); Find point clusters: cluster hulls (8 features) 2040. It reported result, count 60; result, noise 1; result, distance m 1,000; result, elapsed ms 3; result, min points 3; billing, cost 0.0512 40.
| Result | Value |
|---|---|
| result, count | 60 |
| result, noise | 1 |
| result, distance m | 1,000 |
| result, elapsed ms | 3 |
| result, min points | 3 |
| billing, cost | 0.0512 |
| billing, list price | 0.0512 |
| billing, upstream cost | 0 |
Findings
- Evidenced: Find point clusters on Childcare centers: Find point clusters: 2 layers saved: Find point clusters: Childcare centers (60 features); Find point clusters: cluster hulls (8 features) 2040.
- Evidenced: It reported result, count 60; result, noise 1; result, distance m 1,000; result, elapsed ms 3; result, min points 3; billing, cost 0.0512 40.
Tool gp_find_point_clusters; parameters {"method": "dbscan", "project": "89129455-9e05-4edb-9cc1-dcfb440cc5ba", "features": {"layer": "Childcare centers (9489916f)"}, "distance_m": 1000.0, "min_points": 3}
Find point clusters
What this analysis is. Find point clusters: Density-based clusters (DBSCAN, HDBSCAN or OPTICS, optionally space-time) with hulls and noise 36. In ArcGIS it is Find Point Clusters or Density-based Clustering; in QGIS, native:dbscanclustering or native:stdbscanclustering 36.
Why it was run on this data. DBSCAN finds dense groups of Housing developments and separates noise 41.
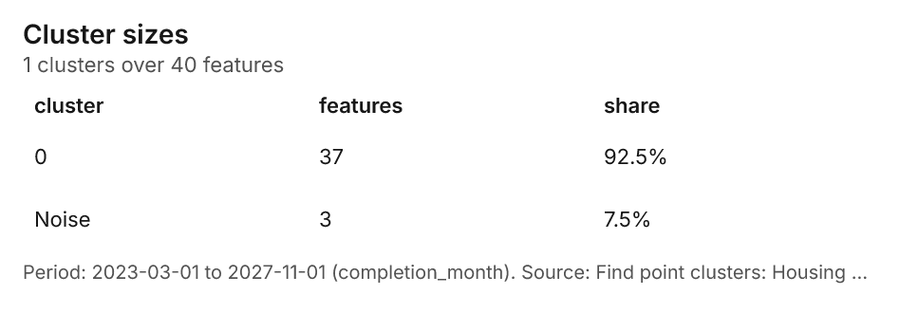
What it found. Find point clusters on Housing developments: Find point clusters: 2 layers saved: Find point clusters: Housing developments (40 features); Find point clusters: cluster hulls (1 feature) 1142. It reported result, count 40; result, noise 3; result, distance m 2,000; result, elapsed ms 1; result, min points 3; billing, cost 0.0508 42.
| Result | Value |
|---|---|
| result, count | 40 |
| result, noise | 3 |
| result, distance m | 2,000 |
| result, elapsed ms | 1 |
| result, min points | 3 |
| billing, cost | 0.0508 |
| billing, list price | 0.0508 |
| billing, upstream cost | 0 |
Findings
- Evidenced: Find point clusters on Housing developments: Find point clusters: 2 layers saved: Find point clusters: Housing developments (40 features); Find point clusters: cluster hulls (1 feature) 1142.
- Evidenced: It reported result, count 40; result, noise 3; result, distance m 2,000; result, elapsed ms 1; result, min points 3; billing, cost 0.0508 42.
Tool gp_find_point_clusters; parameters {"method": "dbscan", "project": "89129455-9e05-4edb-9cc1-dcfb440cc5ba", "features": {"layer": "Housing developments (afc1332b)"}, "distance_m": 2000.0, "min_points": 3}
Outliers
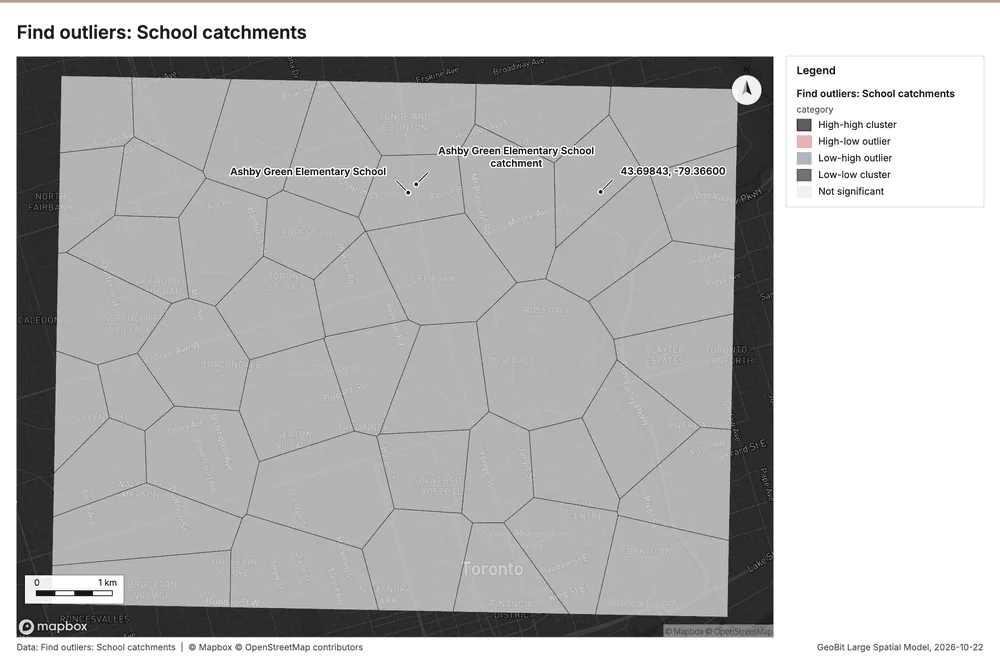
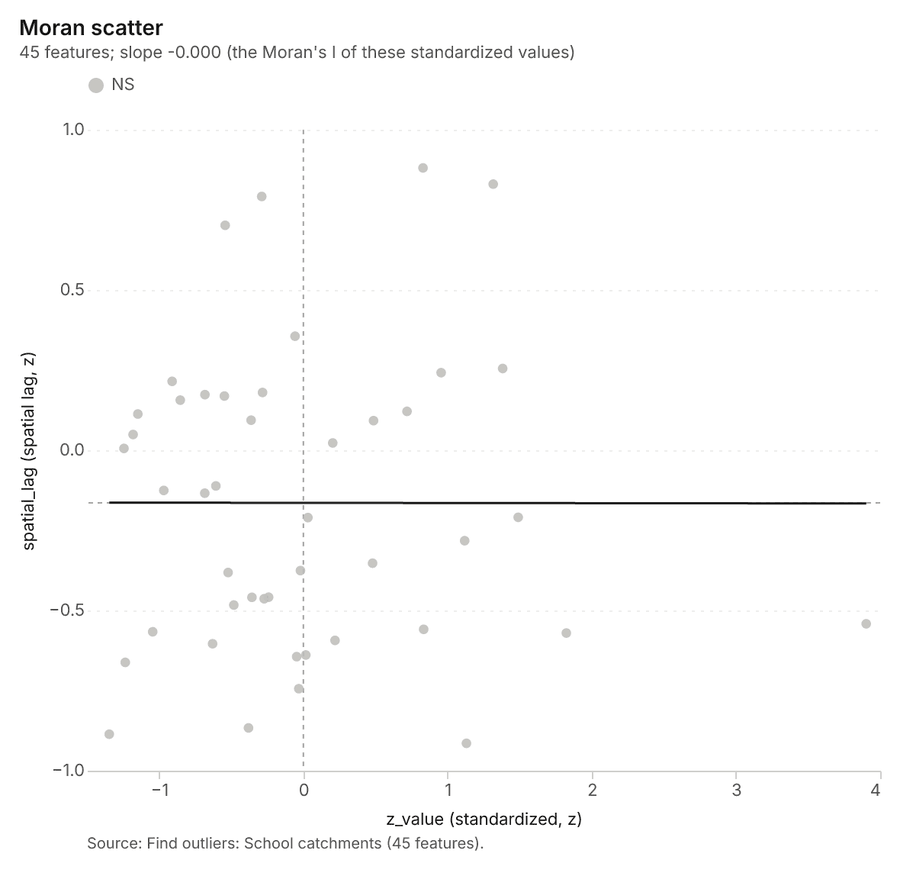
What this analysis is. Find outliers: Anselin local Moran’s I: HH, LL clusters and HL, LH outliers 43. In ArcGIS it is Find Outliers or Cluster and Outlier Analysis (Anselin Local Moran’s I) 43.
Why it was run on this data. Local Moran's I maps clusters and outliers of 'children_5_17' 44.
What it found. The gp_outliers tool was executed using the School catchments layer 18. The process generated 45 results 45, completing with an elapsed time of 4 ms 45. Furthermore, the analysis utilized 199 permutations 45 and established a distance band of 1,430 m 45.
| Result | Value |
|---|---|
| result, count | 45 |
| result, elapsed ms | 4 |
| result, permutations | 199 |
| result, excluded null | 0 |
| result, distance band m | 1,430 |
| billing, cost | 0.05135 |
| billing, list price | 0.05135 |
| billing, upstream cost | 0 |
Findings
- Evidenced: Outliers on School catchments: Find outliers: 1 layer saved: Find outliers: School catchments (45 features) 1845.
- Evidenced: It reported result, count 45; result, elapsed ms 4; result, permutations 199; result, excluded null 0; result, distance band m 1,430; billing, cost 0.05135 45.
Tool gp_outliers; parameters {"field": "children_5_17", "project": "89129455-9e05-4edb-9cc1-dcfb440cc5ba", "features": {"layer": "School catchments (534622c6)"}, "aggregation": "hexagon"}
Spatial autocorrelation
What this analysis is. Spatial autocorrelation: Global Moran’s I: is the pattern clustered, dispersed or random 46. In ArcGIS it is Spatial Autocorrelation (Global Moran’s I) 46.
Why it was run on this data. Global Moran's I says whether similar values of 'children_5_17' sit next to each other 47.
What it found. Spatial autocorrelation on School catchments: Spatial autocorrelation: done; no map output 1848. It reported result, n 45; result, p value 0.4896; result, z score 0.6909; result, morans i 0.05071; result, variance 0.0113; result, elapsed ms 2 48.
| Result | Value |
|---|---|
| result, n | 45 |
| result, p value | 0.4896 |
| result, z score | 0.6909 |
| result, morans i | 0.05071 |
| result, variance | 0.0113 |
| result, elapsed ms | 2 |
| result, expected i | -0.02273 |
| result, excluded null | 0 |
| result, distance band m | 1,430 |
| result, p value normality | 0.5075 |
| result, z score normality | 0.6627 |
| result, variance normality | 0.01228 |
| billing, cost | 0.02 |
| billing, list price | 0.02 |
| billing, upstream cost | 0 |
Findings
- Evidenced: Spatial autocorrelation on School catchments: Spatial autocorrelation: done; no map output 1848.
- Evidenced: It reported result, n 45; result, p value 0.4896; result, z score 0.6909; result, morans i 0.05071; result, variance 0.0113; result, elapsed ms 2 48.
Tool gp_spatial_autocorrelation; parameters {"field": "children_5_17", "project": "89129455-9e05-4edb-9cc1-dcfb440cc5ba", "features": {"layer": "School catchments (534622c6)"}}
Find nearest
What this analysis is. Find nearest: The k nearest features for each input, with geodesic distance and bearing 49. In ArcGIS it is Find Nearest or Near; in QGIS, native:joinbynearest or native:nearestneighbouranalysis 49.
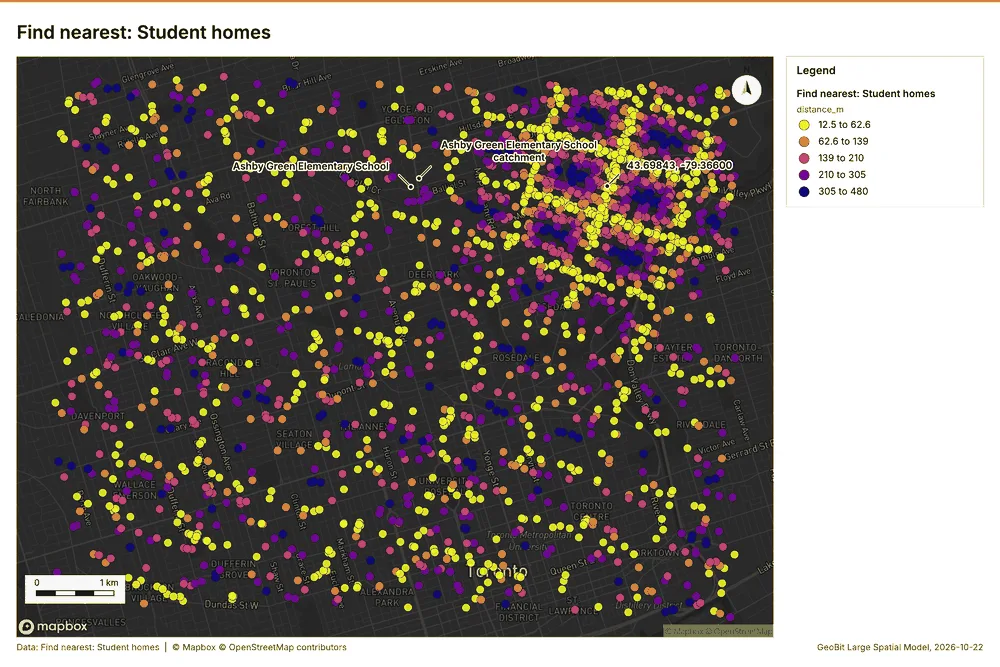
Why it was run on this data. The nearest of Major roads to each of Student homes, with distances 50.
What it found. Find nearest on Major roads, Student homes: Find nearest: 1 layer saved: Find nearest: Student homes (2500 features) 85152. It reported result, count 2,500; result, elapsed ms 1,073; billing, cost 0.06044; billing, list price 0.06044; billing, upstream cost 0 51.
| Result | Value |
|---|---|
| result, count | 2,500 |
| result, elapsed ms | 1,073 |
| billing, cost | 0.06044 |
| billing, list price | 0.06044 |
| billing, upstream cost | 0 |
Findings
- Evidenced: Find nearest on Major roads, Student homes: Find nearest: 1 layer saved: Find nearest: Student homes (2500 features) 85152.
- Evidenced: It reported result, count 2,500; result, elapsed ms 1,073; billing, cost 0.06044; billing, list price 0.06044; billing, upstream cost 0 51.
Tool gp_find_nearest; parameters {"k": 1, "to": {"layer": "Major roads (f801bcde)"}, "from": {"layer": "Student homes (05789208)"}, "project": "89129455-9e05-4edb-9cc1-dcfb440cc5ba", "max_distance_m": 2000.0}
Find nearest
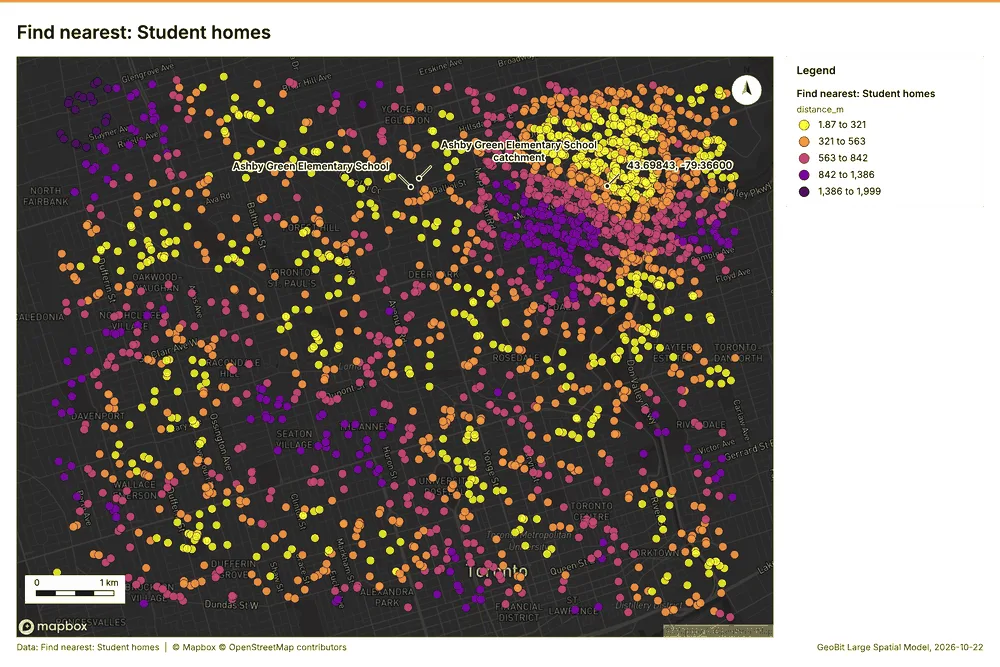
What this analysis is. Find nearest: The k nearest features for each input, with geodesic distance and bearing 49. In ArcGIS it is Find Nearest or Near; in QGIS, native:joinbynearest or native:nearestneighbouranalysis 49.
Why it was run on this data. The nearest of Major roads to each of Student homes, with distances 50.
What it found. Find nearest on Childcare centers, Student homes: Find nearest: 1 layer saved: Find nearest: Student homes (2500 features) 82053. It reported result, count 2,500; result, elapsed ms 129; billing, cost 0.0612; billing, list price 0.0612; billing, upstream cost 0 53.
| Result | Value |
|---|---|
| result, count | 2,500 |
| result, elapsed ms | 129 |
| billing, cost | 0.0612 |
| billing, list price | 0.0612 |
| billing, upstream cost | 0 |
Findings
- Evidenced: Find nearest on Childcare centers, Student homes: Find nearest: 1 layer saved: Find nearest: Student homes (2500 features) 82053.
- Evidenced: It reported result, count 2,500; result, elapsed ms 129; billing, cost 0.0612; billing, list price 0.0612; billing, upstream cost 0 53.
Tool gp_find_nearest; parameters {"k": 1, "to": {"layer": "Childcare centers (9489916f)"}, "from": {"layer": "Student homes (05789208)"}, "project": "89129455-9e05-4edb-9cc1-dcfb440cc5ba", "max_distance_m": 2000.0}
Find nearest
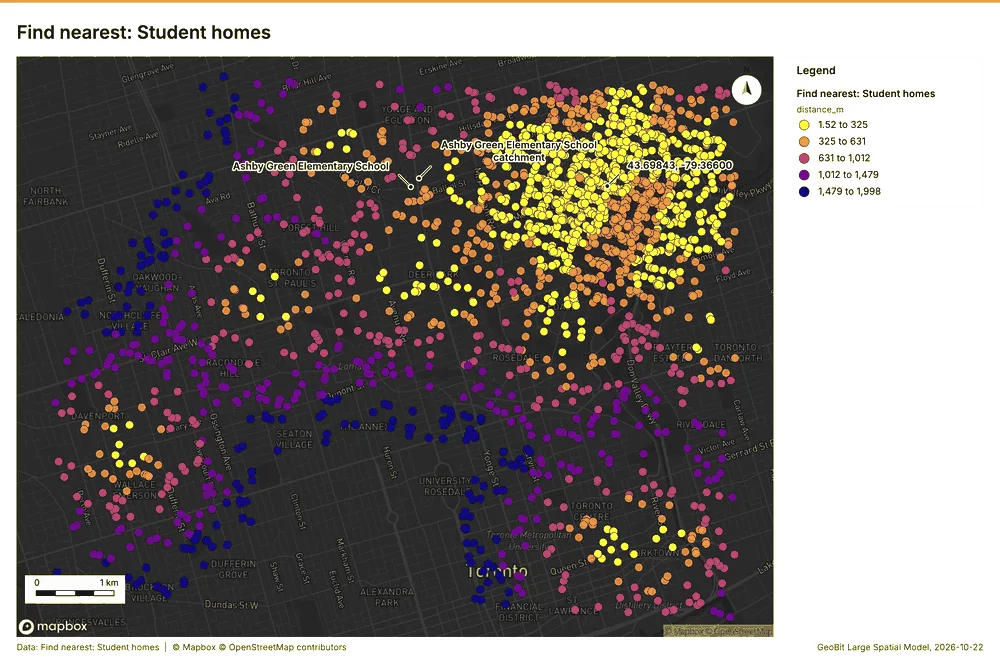
What this analysis is. Find nearest: The k nearest features for each input, with geodesic distance and bearing 49. In ArcGIS it is Find Nearest or Near; in QGIS, native:joinbynearest or native:nearestneighbouranalysis 49.
Why it was run on this data. The nearest of Major roads to each of Student homes, with distances 50.
What it found. The gp_find_nearest tool was utilized with Housing developments 11 and Student homes 8 as inputs 54. The operation successfully generated 2,251 results 54. Specific performance metrics showed the elapsed time was 118 ms 54. Furthermore, the recorded billing cost for this process was 0.0608 54.
| Result | Value |
|---|---|
| result, count | 2,251 |
| result, elapsed ms | 118 |
| billing, cost | 0.0608 |
| billing, list price | 0.0608 |
| billing, upstream cost | 0 |
Findings
- Evidenced: Find nearest on Housing developments, Student homes: Find nearest: 1 layer saved: Find nearest: Student homes (2251 features) 81154.
- Evidenced: It reported result, count 2,251; result, elapsed ms 118; billing, cost 0.0608; billing, list price 0.0608; billing, upstream cost 0 54.
Tool gp_find_nearest; parameters {"k": 1, "to": {"layer": "Housing developments (afc1332b)"}, "from": {"layer": "Student homes (05789208)"}, "project": "89129455-9e05-4edb-9cc1-dcfb440cc5ba", "max_distance_m": 2000.0}
Maps and charts
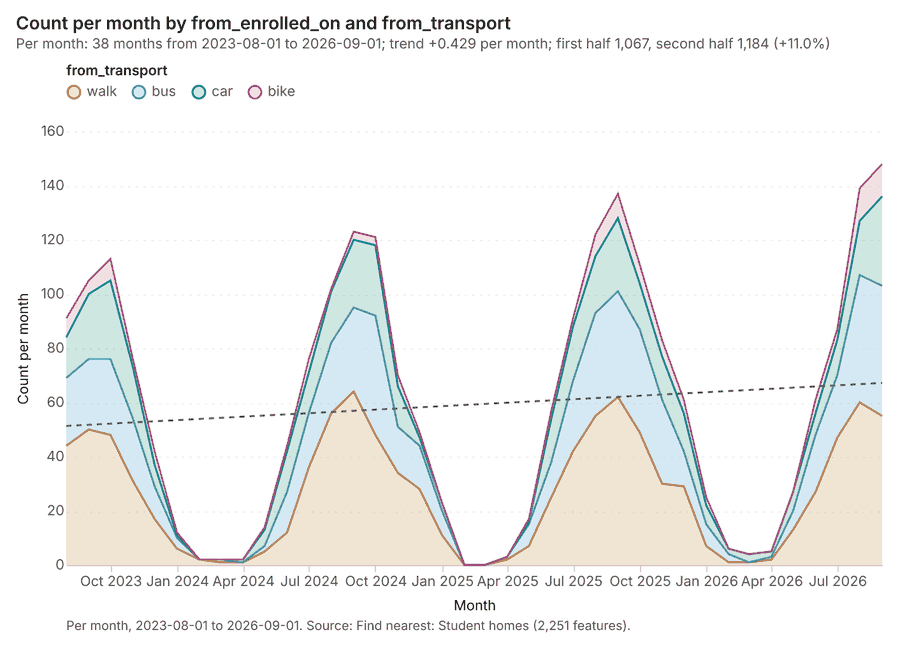
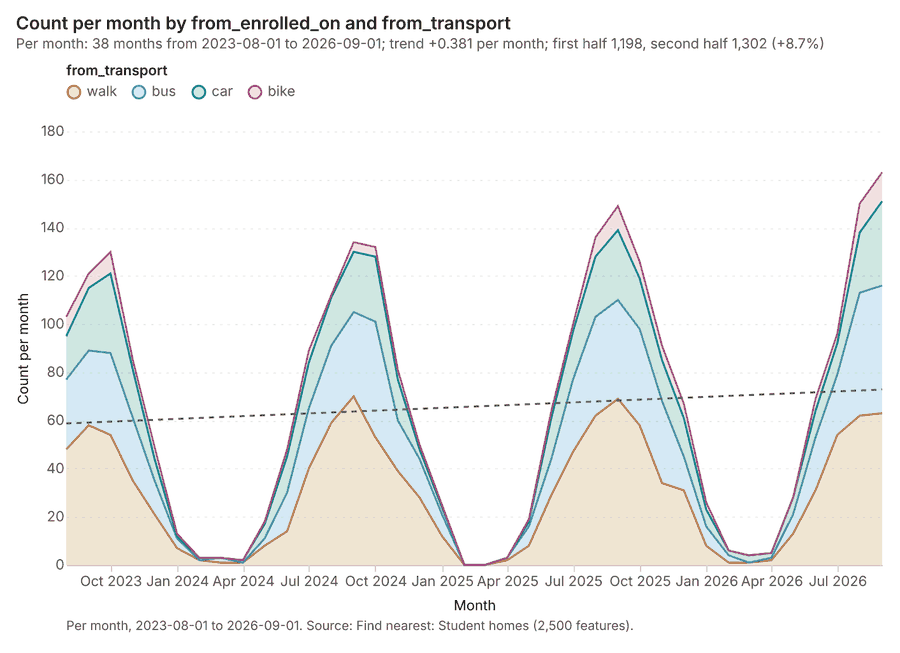
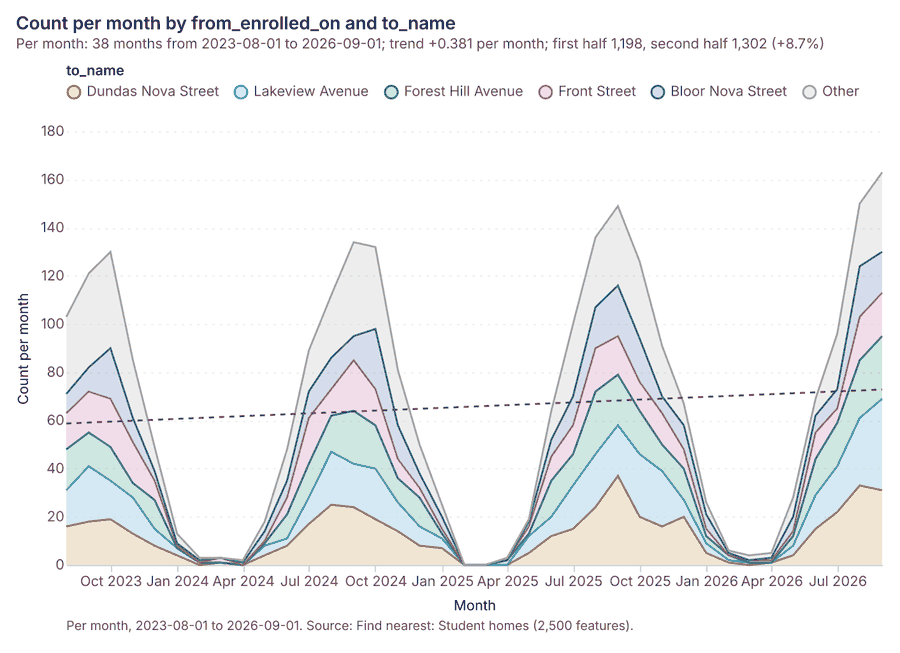
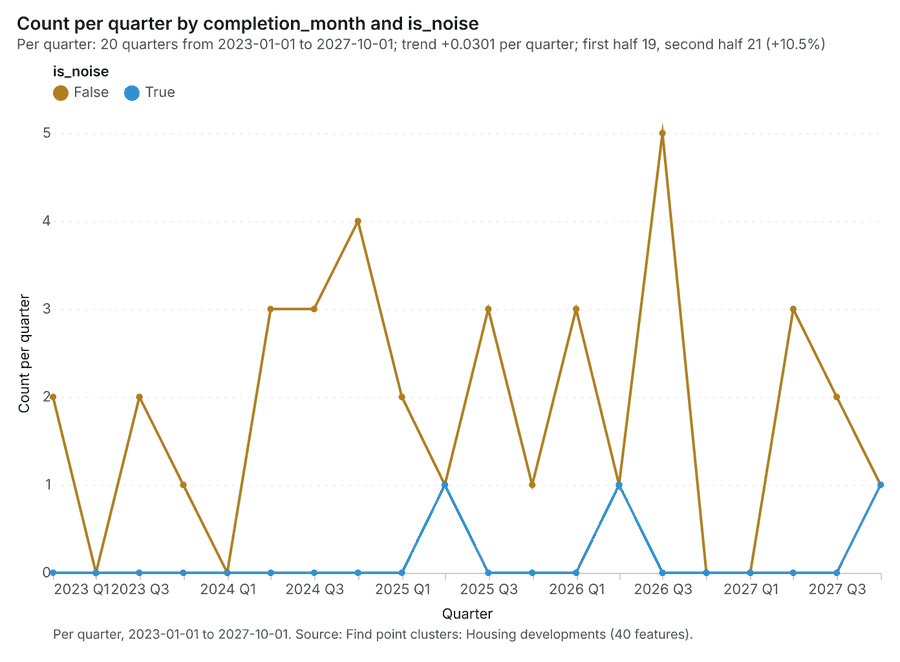
The run also made 23 map image(s) 5556575859606162636465666768697071727374757677 and 31 chart(s) 78798081828384858687888990919293949596979899100101102103104105106107108.
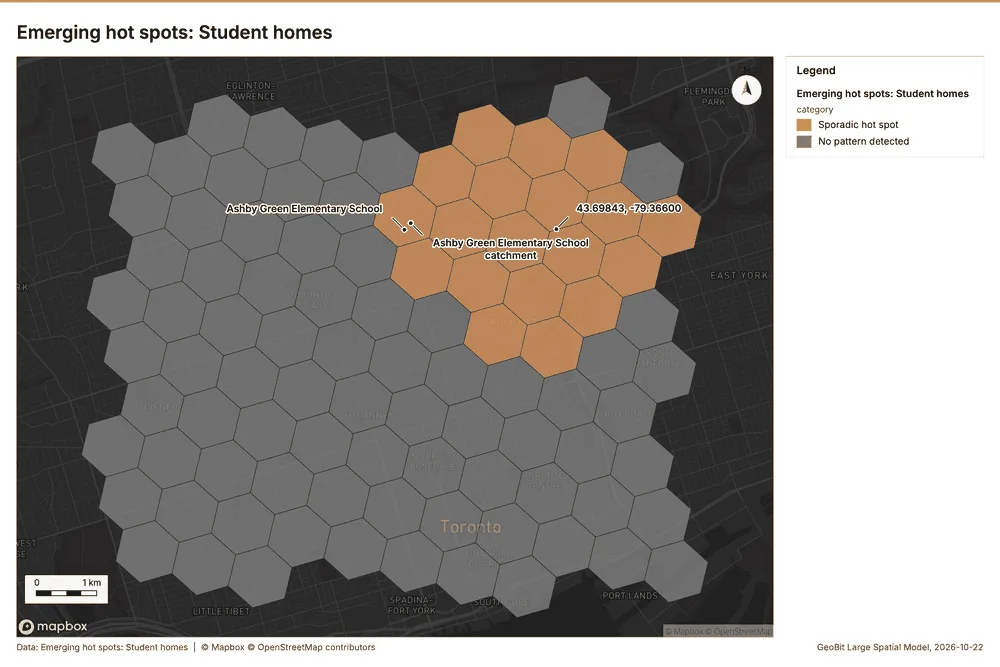
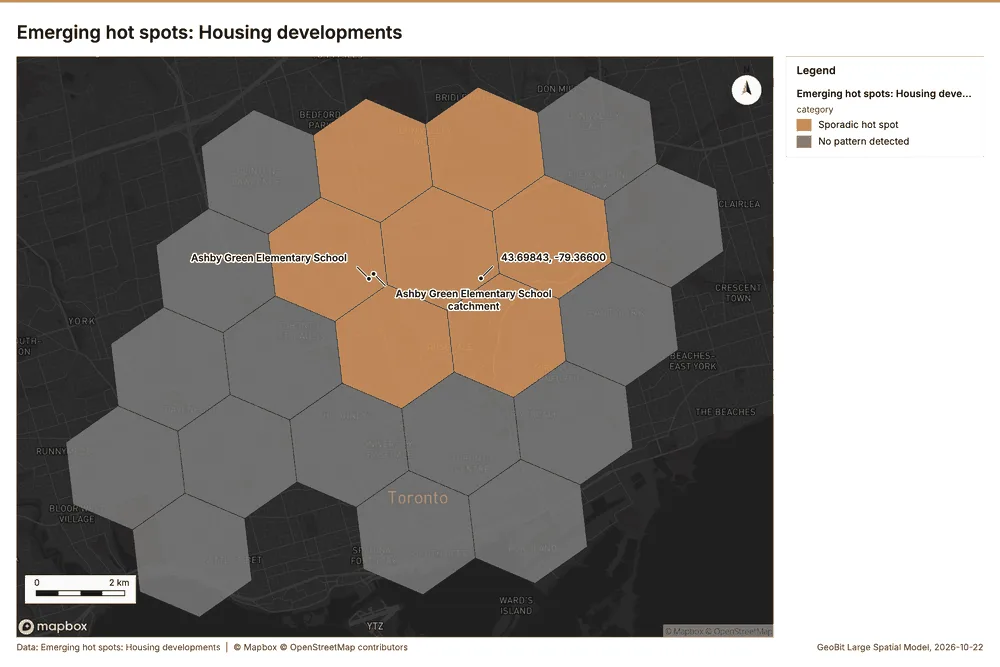
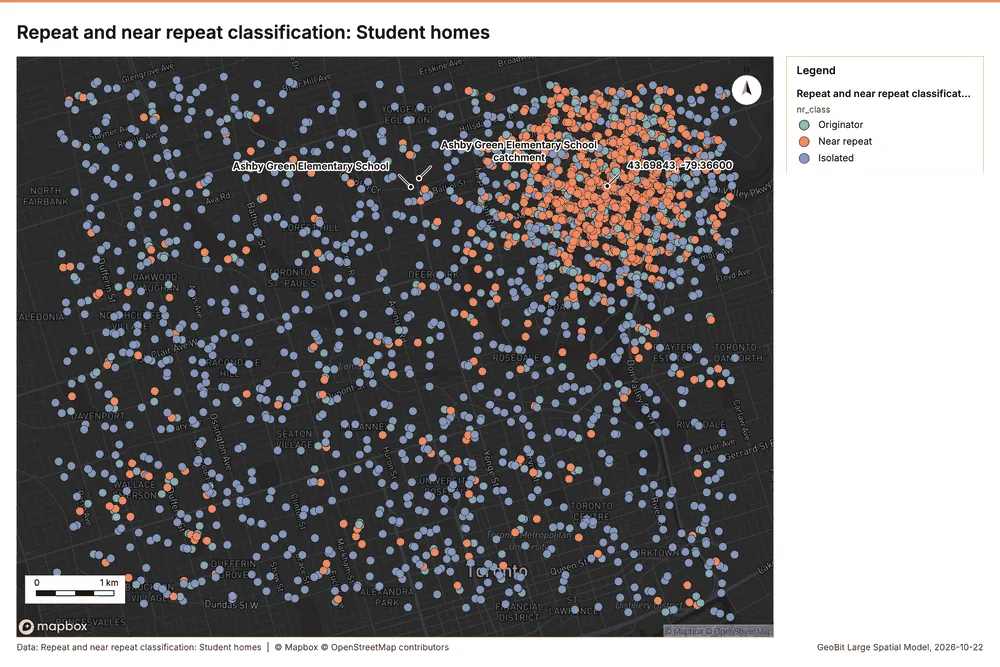
What the map shows. The map displays the emerging hot spots for student homes across a grid area. A distinct, concentrated cluster of "Sporadic hot spot" areas, colored orange, is visible in the upper-central portion of the map. The majority of the geographical area is colored gray, corresponding to 55
Inferred: read from the image by gemma4:e4b, not evidence.
Changes since the last run
This is the first report of this project.
Sources
- 1Rendering: Chart: Timeline: events per quarter by dataset. 78 rows id 79388dbd-a74a-40df-b300-c9c05078ac9c
- 2Dataset: Student homes. vector, 2500 rows id 28ef32ad-fdbf-4e64-879d-ef97c69d99c8
- 3Dataset: Housing developments. vector, 40 rows id 9073798d-0507-463a-99b0-0f74516b77ea
- 4Dataset: Enrollment by school and year. table, 270 rows id af8cf345-1c02-4892-beda-cb8f239c4cd1
- 5Catalog: Emerging hot spots (operation catalog, gp_space_time_hot_spots). Where hot spots are new, consecutive, intensifying, persistent, diminishing, sporadic, oscillating or historical over time. ArcGIS: Emerging Hot Spot Analysis, Create Space Time Cube. id gp_space_time_hot_spots
- 6Plan: Space time hot spots of Student homes (the Start plan's candidate c_7f1ecb93fe03). Student homes carry dates in 'enrolled_on': emerging hot spot analysis finds new, intensifying and fading hot spots per month. id da4c2c71-fa66-4f6d-b51a-fc46626d4137:c_7f1ecb93fe03
- 7Tool result: gp_space_time_hot_spots, step 0. Emerging hot spots: 1 layer saved: Emerging hot spots: Student homes (96 features). id 9aff1884-9259-4a26-929a-88629da03a75:0
- 8Layer: Student homes. 2,500 features id 05789208-552f-4f37-be96-0e77b9279a4e
- 9Plan: Space time hot spots of Housing developments (the Start plan's candidate c_e422a5866706). Housing developments carry dates in 'completion_month': emerging hot spot analysis finds new, intensifying and fading hot spots per month. id da4c2c71-fa66-4f6d-b51a-fc46626d4137:c_e422a5866706
- 10Tool result: gp_space_time_hot_spots, step 1. Emerging hot spots: 1 layer saved: Emerging hot spots: Housing developments (22 features). id 9aff1884-9259-4a26-929a-88629da03a75:1
- 11Layer: Housing developments. 40 features id afc1332b-5445-4ac2-9d98-ebb6b1520bd2
- 12Catalog: Repeat and near repeat classification (operation catalog, gp_near_repeat). Classify incidents as originators, repeats (same place) or near repeats within a distance and time window, with a Knox test table. ArcGIS: Repeat and Near Repeat Classification, Near Repeat Calculator. id gp_near_repeat
- 13Plan: Near repeat of Student homes (the Start plan's candidate c_a7cb51bb85b3). Near repeat analysis tests whether Student homes close in space also follow each other within 30 days. id da4c2c71-fa66-4f6d-b51a-fc46626d4137:c_a7cb51bb85b3
- 14Tool result: gp_near_repeat, step 2. Repeat and near repeat classification: 1 layer saved: Repeat and near repeat classification: Student homes (2500 features). id 9aff1884-9259-4a26-929a-88629da03a75:2
- 15Catalog: Summarize within (operation catalog, gp_summarize_within). Count and aggregate the features inside each polygon (or bin), proportionally for lines and polygons. ArcGIS: Summarize Within, Aggregate Points. QGIS: native:countpointsinpolygon, native:sumlinelengths. id gp_summarize_within
- 16Plan: Student homes per feature of School catchments (the Start plan's candidate c_525cc89e9df7). Count Student homes inside each feature of School catchments by transport; the counts map as a choropleth (natural breaks, sequential colors). id da4c2c71-fa66-4f6d-b51a-fc46626d4137:c_525cc89e9df7
- 17Tool result: gp_summarize_within, step 0. Summarize within: 1 layer saved: Summarize within: School catchments (45 features). id 0c3a09c9-8654-4d86-b171-2c58372abb46:0
- 18Layer: School catchments. 45 features id 534622c6-56d8-4348-94c9-c424e61a442d
- 19Tool result: gp_summarize_within, step 1. Summarize within: 1 layer saved: Summarize within: School catchments (45 features). id 0c3a09c9-8654-4d86-b171-2c58372abb46:1
- 20Layer: Childcare centers. 60 features id 9489916f-d13f-4283-b308-ff5bcae62a0d
- 21Tool result: gp_summarize_within, step 2. Summarize within: 1 layer saved: Summarize within: School catchments (45 features). id 0c3a09c9-8654-4d86-b171-2c58372abb46:2
- 22Catalog: Hot spot analysis (operation catalog, gp_hot_spots). Getis-Ord Gi* hot and cold spots with z-scores, p-values and confidence bins. ArcGIS: Find Hot Spots, Hot Spot Analysis (Getis-Ord Gi*). QGIS: qgis:hotspot (plugin). id gp_hot_spots
- 23Plan: Hot spots of Student homes (the Start plan's candidate c_7a39d826a935). 2500 points: Getis-Ord Gi* tests whether the concentrations in Student homes are statistically significant. id da4c2c71-fa66-4f6d-b51a-fc46626d4137:c_7a39d826a935
- 24Tool result: gp_hot_spots, step 0. Hot spot analysis: 1 layer saved: Hot spot analysis: Student homes (281 features). id 9c081bf6-6d02-4b46-93ef-d4823a0030c1:0
- 25Plan: Hot spots of Childcare centers (the Start plan's candidate c_0bdc4dd83b93). 60 points: Getis-Ord Gi* tests whether the concentrations in Childcare centers are statistically significant. id da4c2c71-fa66-4f6d-b51a-fc46626d4137:c_0bdc4dd83b93
- 26Tool result: gp_hot_spots, step 1. Hot spot analysis: 1 layer saved: Hot spot analysis: Childcare centers (20 features). id 9c081bf6-6d02-4b46-93ef-d4823a0030c1:1
- 27Plan: Hot spots of Housing developments (the Start plan's candidate c_6f57933191fe). 40 points: Getis-Ord Gi* tests whether the concentrations in Housing developments are statistically significant. id da4c2c71-fa66-4f6d-b51a-fc46626d4137:c_6f57933191fe
- 28Tool result: gp_hot_spots, step 2. Hot spot analysis: 1 layer saved: Hot spot analysis: Housing developments (40 features). id 9c081bf6-6d02-4b46-93ef-d4823a0030c1:2
- 29Catalog: Calculate density (operation catalog, gp_calculate_density). Kernel density per square kilometer on a grid. ArcGIS: Calculate Density, Kernel Density. QGIS: native:heatmapkerneldensityestimation. id gp_calculate_density
- 30Plan: Kernel density of Student homes (the Start plan's candidate c_4c71448e6d05). 2500 points in Student homes: a density surface shows where they concentrate. id da4c2c71-fa66-4f6d-b51a-fc46626d4137:c_4c71448e6d05
- 31Tool result: gp_calculate_density, step 0. Calculate density: 1 layer saved: Calculate density: Student homes (1838 features). id a4a004d3-3ba6-400d-932e-b8110651d1ff:0
- 32Plan: Kernel density of Childcare centers (the Start plan's candidate c_069e6a20b03a). 60 points in Childcare centers: a density surface shows where they concentrate. id da4c2c71-fa66-4f6d-b51a-fc46626d4137:c_069e6a20b03a
- 33Tool result: gp_calculate_density, step 1. Calculate density: 1 layer saved: Calculate density: Childcare centers (112 features). id a4a004d3-3ba6-400d-932e-b8110651d1ff:1
- 34Plan: Kernel density of Housing developments (the Start plan's candidate c_441f3db47c68). 40 points in Housing developments: a density surface shows where they concentrate. id da4c2c71-fa66-4f6d-b51a-fc46626d4137:c_441f3db47c68
- 35Tool result: gp_calculate_density, step 2. Calculate density: 1 layer saved: Calculate density: Housing developments (80 features). id a4a004d3-3ba6-400d-932e-b8110651d1ff:2
- 36Catalog: Find point clusters (operation catalog, gp_find_point_clusters). Density-based clusters (DBSCAN, HDBSCAN or OPTICS, optionally space-time) with hulls and noise. ArcGIS: Find Point Clusters, Density-based Clustering. QGIS: native:dbscanclustering, native:stdbscanclustering. id gp_find_point_clusters
- 37Plan: Cluster points of Student homes (the Start plan's candidate c_e4e6b0b009c4). DBSCAN finds dense groups of Student homes and separates noise. id da4c2c71-fa66-4f6d-b51a-fc46626d4137:c_e4e6b0b009c4
- 38Tool result: gp_find_point_clusters, step 0. Find point clusters: 2 layers saved: Find point clusters: Student homes (2500 features); Find point clusters: cluster hulls (1 feature). id d27977c5-a8cd-4f40-9af6-797ca9424ec9:0
- 39Plan: Cluster points of Childcare centers (the Start plan's candidate c_43ed026ce5e0). DBSCAN finds dense groups of Childcare centers and separates noise. id da4c2c71-fa66-4f6d-b51a-fc46626d4137:c_43ed026ce5e0
- 40Tool result: gp_find_point_clusters, step 1. Find point clusters: 2 layers saved: Find point clusters: Childcare centers (60 features); Find point clusters: cluster hulls (8 features). id d27977c5-a8cd-4f40-9af6-797ca9424ec9:1
- 41Plan: Cluster points of Housing developments (the Start plan's candidate c_ac70f2a99d9b). DBSCAN finds dense groups of Housing developments and separates noise. id da4c2c71-fa66-4f6d-b51a-fc46626d4137:c_ac70f2a99d9b
- 42Tool result: gp_find_point_clusters, step 2. Find point clusters: 2 layers saved: Find point clusters: Housing developments (40 features); Find point clusters: cluster hulls (1 feature). id d27977c5-a8cd-4f40-9af6-797ca9424ec9:2
- 43Catalog: Find outliers (operation catalog, gp_outliers). Anselin local Moran’s I: HH, LL clusters and HL, LH outliers. ArcGIS: Find Outliers, Cluster and Outlier Analysis (Anselin Local Moran’s I). id gp_outliers
- 44Plan: Local morans i of School catchments (the Start plan's candidate c_98e5a5704b62). Local Moran's I maps clusters and outliers of 'children_5_17'. id da4c2c71-fa66-4f6d-b51a-fc46626d4137:c_98e5a5704b62
- 45Tool result: gp_outliers, step 0. Find outliers: 1 layer saved: Find outliers: School catchments (45 features). id 2d7fd4ea-3928-4276-820c-93cbaa5d8370:0
- 46Catalog: Spatial autocorrelation (operation catalog, gp_spatial_autocorrelation). Global Moran’s I: is the pattern clustered, dispersed or random. ArcGIS: Spatial Autocorrelation (Global Moran’s I). id gp_spatial_autocorrelation
- 47Plan: Global morans i of School catchments (the Start plan's candidate c_62c90091b007). Global Moran's I says whether similar values of 'children_5_17' sit next to each other. id da4c2c71-fa66-4f6d-b51a-fc46626d4137:c_62c90091b007
- 48Tool result: gp_spatial_autocorrelation, step 1. Spatial autocorrelation: done; no map output. id 2d7fd4ea-3928-4276-820c-93cbaa5d8370:1
- 49Catalog: Find nearest (operation catalog, gp_find_nearest). The k nearest features for each input, with geodesic distance and bearing. ArcGIS: Find Nearest, Near, Generate Near Table. QGIS: native:joinbynearest, native:nearestneighbouranalysis. id gp_find_nearest
- 50Plan: Find nearest of Student homes and Major roads (the Start plan's candidate c_b5e7bf8242db). The nearest of Major roads to each of Student homes, with distances. id da4c2c71-fa66-4f6d-b51a-fc46626d4137:c_b5e7bf8242db
- 51Tool result: gp_find_nearest, step 0. Find nearest: 1 layer saved: Find nearest: Student homes (2500 features). id 96f791ed-0415-4640-9ce5-4a248513b9be:0
- 52Layer: Major roads. 22 features id f801bcde-56b2-4e61-ba19-14d0273cc0a8
- 53Tool result: gp_find_nearest, step 1. Find nearest: 1 layer saved: Find nearest: Student homes (2500 features). id 96f791ed-0415-4640-9ce5-4a248513b9be:1
- 54Tool result: gp_find_nearest, step 2. Find nearest: 1 layer saved: Find nearest: Student homes (2251 features). id 96f791ed-0415-4640-9ce5-4a248513b9be:2
- 55Rendering: Map: Emerging hot spots: Student homes id 99865f9e-61ae-4a54-8e71-4f24fa9e045e
- 56Rendering: Map: Emerging hot spots: Housing developments id c6a807f2-4f43-4cf7-bbdd-0d94e82be22b
- 57Rendering: Map: Repeat and near repeat classification: Student homes id f7b40372-ed14-4b51-9886-d46e8380e886
- 58Rendering: Map: Summarize within: School catchments id 16071de3-2db4-4d2a-9f22-069707921f74
- 59Rendering: Map: Summarize within: School catchments id 6880f2c7-fb2a-402c-b96c-562b236be148
- 60Rendering: Map: Summarize within: School catchments id 7370b20e-f371-4cfd-b692-ca80e8c8b321
- 61Rendering: Map: Hot spot analysis: Student homes id 81a795ec-10a3-41fe-8418-bb2735586194
- 62Rendering: Map: Hot spot analysis: Childcare centers id d79041bc-d5c3-40bc-9a8b-1efee804ea40
- 63Rendering: Map: Hot spot analysis: Housing developments id 53ecf3c1-e4a9-4b9b-9614-b876299daf76
- 64Rendering: Map: Calculate density: Student homes id bfebe2b5-1bfa-44c5-b02d-d31e232f58c2
- 65Rendering: Map: Calculate density: Childcare centers id 4d64bc05-4b18-466d-9916-7cbaaba82672
- 66Rendering: Map: Calculate density: Housing developments id 9939a26d-3d46-4228-a88e-6276ccbbfce9
- 67Rendering: Map: Find point clusters: Student homes id 61cf32ac-295f-43d1-b073-76ae493477dd
- 68Rendering: Map: Find point clusters: cluster hulls id a6559fb3-821b-4fe4-ba92-a09934cf2f3c
- 69Rendering: Map: Find point clusters: Childcare centers id ece220ce-fe57-4bdc-a842-471ae4c94bed
- 70Rendering: Map: Find point clusters: cluster hulls id f519a030-b3a6-484c-93cf-8681144e4a8b
- 71Rendering: Map: Find point clusters: Housing developments id d14109fd-c380-468c-85e3-d7337bbf109e
- 72Rendering: Map: Find point clusters: cluster hulls id 078cb00b-7d37-4f3e-a204-57bd1a525b99
- 73Rendering: Map: School catchments by children_5_17 id a27302ad-817f-4696-a735-0a3a66fbb8ef
- 74Rendering: Map: Find outliers: School catchments id da831d0f-f5f9-4acb-b0cd-29083c443756
- 75Rendering: Map: Find nearest: Student homes id 40e2475f-79fa-4fc0-b95d-0920bd10ac82
- 76Rendering: Map: Find nearest: Student homes id 70ebd047-6948-4216-9cf9-75b35e49c830
- 77Rendering: Map: Find nearest: Student homes id 5b49f3b5-9a72-4fd4-96f3-f2c2703027ab
- 78Rendering: Chart: Schools over time (built_year). 7 rows id 880207dc-7868-40f4-b250-d08848fe4f7c
- 79Rendering: Chart: Housing developments over time (completion_month). 20 rows id ee6bae39-81ad-4908-93f3-48e4b8dab2f3
- 80Rendering: Chart: Enrollment by school and year over time (school_year). 21 rows id 3c99d290-2ab6-4f32-bf72-5e28a47a0305
- 81Rendering: Chart: Emerging hot spots: Student homes. 8 rows id c2759717-bd77-4ab7-80f2-0ff5624d1d0d
- 82Rendering: Chart: Emerging hot spots: Housing developments. 6 rows id 9da321f7-d9db-457c-b398-aadc13a51b1d
- 83Rendering: Chart: Repeat and near repeat classification: Student homes. 20 rows id e9d40fe4-2dcb-4274-a637-c4492395395e
- 84Rendering: Chart: Summarize within: School catchments. 7 rows id ed117d61-c2b8-4711-8e6b-6162a4f09bdd
- 85Rendering: Chart: Summarize within: School catchments. 7 rows id 538dd834-8935-4acf-aa77-c6b3e48cbffe
- 86Rendering: Chart: Summarize within: School catchments. 5 rows id eb2e00b9-1335-4b02-9b76-1e583e9b01a0
- 87Rendering: Chart: Hot spot analysis: Student homes. 15 rows id 12fec60a-bec0-4c49-8e09-a74a94fa49f5
- 88Rendering: Chart: Hot spot analysis: Childcare centers. 7 rows id 40554f68-7964-4f45-a1ac-19d17066ae79
- 89Rendering: Chart: Hot spot analysis: Housing developments. 8 rows id 01cab3a4-6f58-49af-8dd9-3f246085fc6b
- 90Rendering: Chart: Calculate density: Student homes. 12 rows id e75022eb-77cc-4f13-ae4e-64fa1d81fa6d
- 91Rendering: Chart: Calculate density: Childcare centers. 8 rows id 6c204cf8-7a68-44be-80f5-4f7cde56072e
- 92Rendering: Chart: Calculate density: Housing developments. 8 rows id ca34157f-9a27-457d-81e1-29b86f4f275e
- 93Rendering: Chart: Find point clusters: Student homes. 2 rows id e0334377-b051-4859-a2cd-6fbb987551b4
- 94Rendering: Chart: Find point clusters: cluster hulls. 1 rows id ef7a2223-1d85-448d-b093-0c2513affca5
- 95Rendering: Chart: Find point clusters: Childcare centers. 9 rows id 29ef1518-618b-4ea4-a5ee-2c96e1ec5827
- 96Rendering: Chart: Find point clusters: cluster hulls. 8 rows id 208e1927-bbe9-4755-a5ef-4f46a24d4689
- 97Rendering: Chart: Find point clusters: Housing developments. 2 rows id 40ab1fbd-7eab-4e95-ba32-5f9e4781e9d4
- 98Rendering: Chart: Find point clusters: cluster hulls. 1 rows id e4c8befa-2e05-41d0-bb8c-8fe8283edd90
- 99Rendering: Chart: Find outliers: School catchments. 45 rows id a50e1dab-42b9-4ff9-ae70-a9480fc0b696
- 100Rendering: Chart: Find nearest: Student homes. 20 rows id 4fc59395-9d71-4f81-958d-f88bf5cb6659
- 101Rendering: Chart: Find nearest: Student homes. 20 rows id 0852c0c8-a586-4261-b871-7d8105dd7e1b
- 102Rendering: Chart: Find nearest: Student homes over time. 152 rows id 75d40924-ed16-40d7-b9b0-3c4a873dd613
- 103Rendering: Chart: Find nearest: Student homes over time. 152 rows id b06f7c1c-a6b8-4ca2-8124-9b931b6d16b9
- 104Rendering: Chart: Find nearest: Student homes over time. 228 rows id 1007cf6f-af9a-4bc4-a5e5-aba4c425e396
- 105Rendering: Chart: Find point clusters: Housing developments over time. 40 rows id 96ec5cd7-6530-4341-a797-33f6a56e2fb7
- 106Rendering: Chart: Find point clusters: Student homes over time. 76 rows id 8bc71da9-95da-46d6-9855-df0cfc359e93
- 107Rendering: Chart: Hot spot analysis: Housing developments over time. 40 rows id 9cfa00e8-1d3c-4faa-95d0-f0720805090f
- 108Rendering: Chart: Repeat and near repeat classification: Student homes over time. 114 rows id b240dc06-1b76-4e65-bbc3-8914c9a85bb6
- 109Dataset: Schools. vector, 45 rows id febb26e1-84d6-4ddb-9a3f-f5e1f0b7f795
- 110Dataset: School catchments. vector, 45 rows id ad5953fb-dbca-4073-bc92-0e08c51e1651
- 111Dataset: Bus stops. vector, 80 rows id bb1e7508-4720-407c-b71c-a26b23a4f915
- 112Dataset: Childcare centers. vector, 60 rows id 4fef3ba9-e30d-4b7d-a5d6-605ce87f7d10
- 113Dataset: Major roads. vector, 22 rows id 2a9a4d23-28ed-4b9f-9748-91ea14603b7a
- 114Dataset: Staffing. table, 45 rows id afb73c89-d4b1-4d19-a074-f8a824e6cbbc
- 115Dataset: School capacity review. document, ? rows id 4d0bbaf0-8f67-45ac-b564-ab860018c60d
- 116Record: Sample: Education, Toronto id 89129455-9e05-4edb-9cc1-dcfb440cc5ba
- 117Layer: Emerging hot spots: Student homes. 96 features id 7dda31be-8b88-4be6-9357-f49b99e0ad3f
- 118Layer: Emerging hot spots: Housing developments. 22 features id 967c6193-6c0c-406a-a2c6-546a83bbbc65
- 119Layer: Repeat and near repeat classification: Student homes. 2,500 features id 4b593664-c2f4-4a80-95fe-f240335119a6
- 120Layer: Summarize within: School catchments. 45 features id d0384b31-144b-4c4f-a178-ec4c53caae50
- 121Layer: Summarize within: School catchments. 45 features id 478d8495-5caf-48d5-b6fa-eb6fb6b4293d
- 122Layer: Summarize within: School catchments. 45 features id 975d2d0e-1edb-42ad-b028-67b76335136f
- 123Layer: Hot spot analysis: Student homes. 281 features id a502e8fe-ffa2-4e21-9f58-9ec29380391f
- 124Layer: Hot spot analysis: Childcare centers. 20 features id 1b0dfd64-2343-44f2-94d6-e1605b181217
- 125Layer: Hot spot analysis: Housing developments. 40 features id e4d2879f-df41-457c-becc-2143c520d6c0
- 126Layer: Calculate density: Student homes. 1,838 features id 0a6f63b2-6a88-4993-a597-e2734a63f13a
- 127Layer: Calculate density: Childcare centers. 112 features id 9a43b28a-a83c-403a-89b3-276f72a30159
- 128Layer: Calculate density: Housing developments. 80 features id db78cd56-46ef-4a6b-8256-28f6febc19e9
- 129Layer: Find point clusters: Student homes. 2,500 features id 6619977a-546f-41cf-a5d9-f9fa92133533
- 130Layer: Find point clusters: cluster hulls. 1 features id 93e7b932-a3f4-42f8-9d0a-b4d8266c9326
- 131Layer: Find point clusters: Childcare centers. 60 features id 394eb585-c105-412b-8add-e49c4579ae41
- 132Layer: Find point clusters: cluster hulls. 8 features id eac0e935-66fc-4c67-b7eb-367618a58b3c
- 133Layer: Find point clusters: Housing developments. 40 features id e8272a5f-e728-40d3-9f70-cc41284df4b6
- 134Layer: Find point clusters: cluster hulls. 1 features id e315ede4-4e6c-4399-b511-158bba19ae68
- 135Layer: Find outliers: School catchments. 45 features id c01d8927-0a79-40f8-ac32-3d74384c6f2c
- 136Layer: Find nearest: Student homes. 2,500 features id 9df5c370-c651-40e7-be15-05353e74ecf7
- 137Layer: Find nearest: Student homes. 2,500 features id a2c749a0-1ba4-4b20-92aa-88c388a66e07
- 138Layer: Find nearest: Student homes. 2,251 features id f6524eb3-a994-493f-8273-4c78a1381cac
Appendix: the data behind the chartsShow
Figure 1. Timeline: events per quarter by dataset 1
| period | series | value |
|---|---|---|
| 2021-07-01 | Student homes | 0 |
| 2021-07-01 | Enrollment by school and year | 45 |
| 2021-07-01 | Housing developments | 0 |
| 2021-10-01 | Student homes | 0 |
| 2021-10-01 | Enrollment by school and year | 0 |
| 2021-10-01 | Housing developments | 0 |
| 2022-01-01 | Student homes | 0 |
| 2022-01-01 | Enrollment by school and year | 0 |
| 2022-01-01 | Housing developments | 0 |
| 2022-04-01 | Student homes | 0 |
| 2022-04-01 | Enrollment by school and year | 0 |
| 2022-04-01 | Housing developments | 0 |
| 2022-07-01 | Student homes | 0 |
| 2022-07-01 | Enrollment by school and year | 45 |
| 2022-07-01 | Housing developments | 0 |
| 2022-10-01 | Student homes | 0 |
| 2022-10-01 | Enrollment by school and year | 0 |
| 2022-10-01 | Housing developments | 0 |
| 2023-01-01 | Student homes | 0 |
| 2023-01-01 | Enrollment by school and year | 0 |
| 2023-01-01 | Housing developments | 2 |
| 2023-04-01 | Student homes | 0 |
| 2023-04-01 | Enrollment by school and year | 0 |
| 2023-04-01 | Housing developments | 0 |
| 2023-07-01 | Student homes | 224 |
| 2023-07-01 | Enrollment by school and year | 45 |
| 2023-07-01 | Housing developments | 2 |
| 2023-10-01 | Student homes | 264 |
| 2023-10-01 | Enrollment by school and year | 0 |
| 2023-10-01 | Housing developments | 1 |
| 2024-01-01 | Student homes | 19 |
| 2024-01-01 | Enrollment by school and year | 0 |
| 2024-01-01 | Housing developments | 0 |
| 2024-04-01 | Student homes | 68 |
| 2024-04-01 | Enrollment by school and year | 0 |
| 2024-04-01 | Housing developments | 3 |
| 2024-07-01 | Student homes | 335 |
| 2024-07-01 | Enrollment by school and year | 45 |
| 2024-07-01 | Housing developments | 3 |
| 2024-10-01 | Student homes | 263 |
| 2024-10-01 | Enrollment by school and year | 0 |
| 2024-10-01 | Housing developments | 4 |
| 2025-01-01 | Student homes | 25 |
| 2025-01-01 | Enrollment by school and year | 0 |
| 2025-01-01 | Housing developments | 2 |
| 2025-04-01 | Student homes | 86 |
| 2025-04-01 | Enrollment by school and year | 0 |
| 2025-04-01 | Housing developments | 2 |
| 2025-07-01 | Student homes | 385 |
| 2025-07-01 | Enrollment by school and year | 45 |
| 2025-07-01 | Housing developments | 3 |
| 2025-10-01 | Student homes | 284 |
| 2025-10-01 | Enrollment by school and year | 0 |
| 2025-10-01 | Housing developments | 1 |
| 2026-01-01 | Student homes | 36 |
| 2026-01-01 | Enrollment by school and year | 0 |
| 2026-01-01 | Housing developments | 3 |
| 2026-04-01 | Student homes | 102 |
| 2026-04-01 | Enrollment by school and year | 0 |
| 2026-04-01 | Housing developments | 2 |
| 2026-07-01 | Student homes | 409 |
| 2026-07-01 | Enrollment by school and year | 45 |
| 2026-07-01 | Housing developments | 5 |
| 2026-10-01 | Student homes | 0 |
| 2026-10-01 | Enrollment by school and year | 0 |
| 2026-10-01 | Housing developments | 0 |
| 2027-01-01 | Student homes | 0 |
| 2027-01-01 | Enrollment by school and year | 0 |
| 2027-01-01 | Housing developments | 0 |
| 2027-04-01 | Student homes | 0 |
| 2027-04-01 | Enrollment by school and year | 0 |
| 2027-04-01 | Housing developments | 3 |
| 2027-07-01 | Student homes | 0 |
| 2027-07-01 | Enrollment by school and year | 0 |
| 2027-07-01 | Housing developments | 2 |
| 2027-10-01 | Student homes | 0 |
| 2027-10-01 | Enrollment by school and year | 0 |
| 2027-10-01 | Housing developments | 2 |
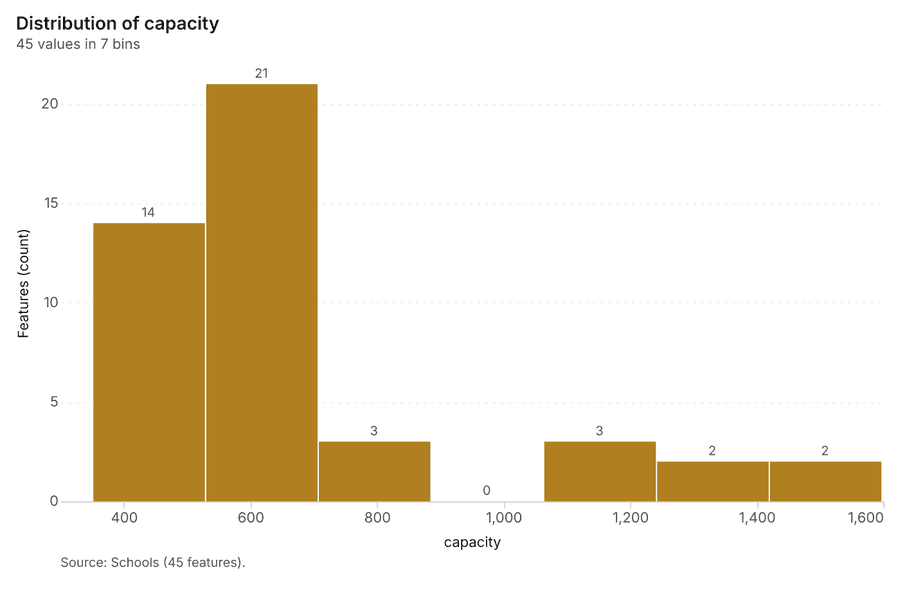
Figure 25. Schools over time (built_year) 78
| bin_start | bin_end | count |
|---|---|---|
| 350 | 528.1 | 14 |
| 528.1 | 706.3 | 21 |
| 706.3 | 884.4 | 3 |
| 884.4 | 1,063 | 0 |
| 1,063 | 1,241 | 3 |
| 1,241 | 1,419 | 2 |
| 1,419 | 1,597 | 2 |
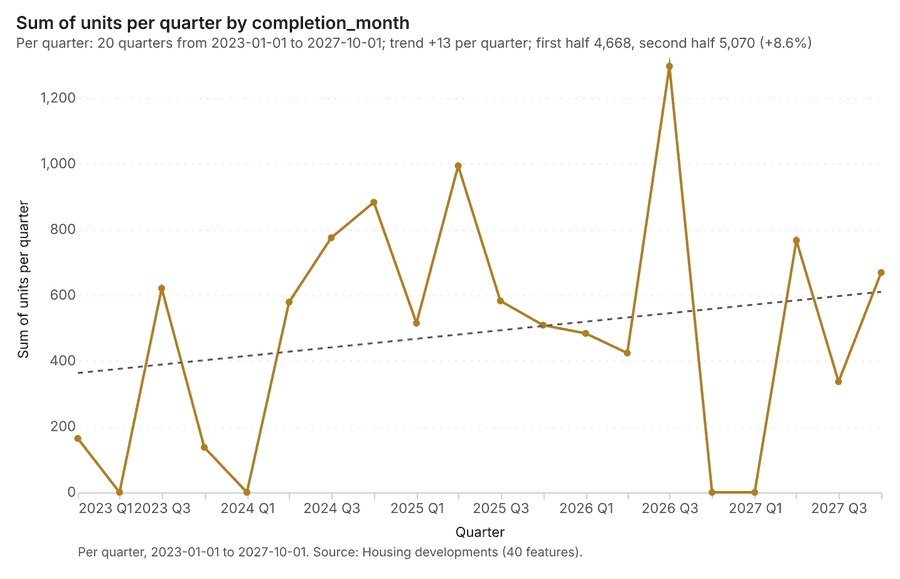
Figure 26. Housing developments over time (completion_month) 79
| period | value |
|---|---|
| 2023-01-01 | 164 |
| 2023-04-01 | 0 |
| 2023-07-01 | 621 |
| 2023-10-01 | 137 |
| 2024-01-01 | 0 |
| 2024-04-01 | 579 |
| 2024-07-01 | 775 |
| 2024-10-01 | 883 |
| 2025-01-01 | 515 |
| 2025-04-01 | 994 |
| 2025-07-01 | 583 |
| 2025-10-01 | 509 |
| 2026-01-01 | 484 |
| 2026-04-01 | 424 |
| 2026-07-01 | 1,297 |
| 2026-10-01 | 0 |
| 2027-01-01 | 0 |
| 2027-04-01 | 767 |
| 2027-07-01 | 337 |
| 2027-10-01 | 669 |
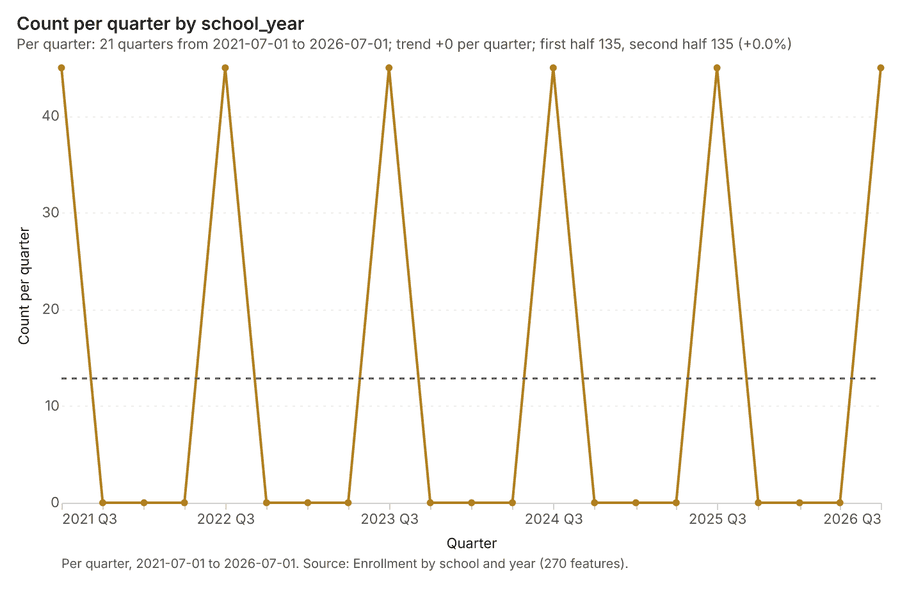
Figure 27. Enrollment by school and year over time (school_year) 80
| period | value |
|---|---|
| 2021-07-01 | 45 |
| 2021-10-01 | 0 |
| 2022-01-01 | 0 |
| 2022-04-01 | 0 |
| 2022-07-01 | 45 |
| 2022-10-01 | 0 |
| 2023-01-01 | 0 |
| 2023-04-01 | 0 |
| 2023-07-01 | 45 |
| 2023-10-01 | 0 |
| 2024-01-01 | 0 |
| 2024-04-01 | 0 |
| 2024-07-01 | 45 |
| 2024-10-01 | 0 |
| 2025-01-01 | 0 |
| 2025-04-01 | 0 |
| 2025-07-01 | 45 |
| 2025-10-01 | 0 |
| 2026-01-01 | 0 |
| 2026-04-01 | 0 |
| 2026-07-01 | 45 |
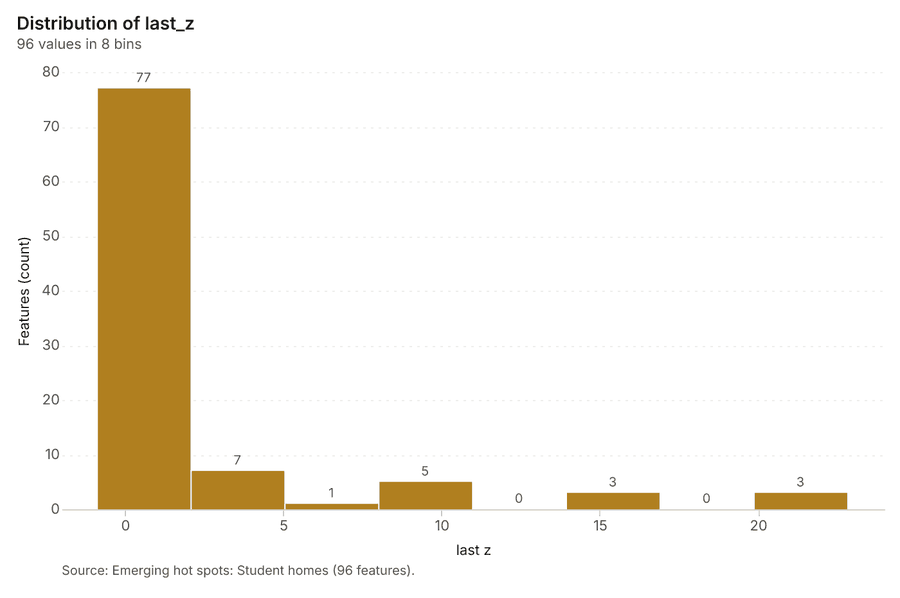
Figure 28. Emerging hot spots: Student homes 81
| bin_start | bin_end | count |
|---|---|---|
| -0.896 | 2.069 | 77 |
| 2.069 | 5.033 | 7 |
| 5.033 | 7.998 | 1 |
| 7.998 | 10.96 | 5 |
| 10.96 | 13.93 | 0 |
| 13.93 | 16.89 | 3 |
| 16.89 | 19.86 | 0 |
| 19.86 | 22.82 | 3 |
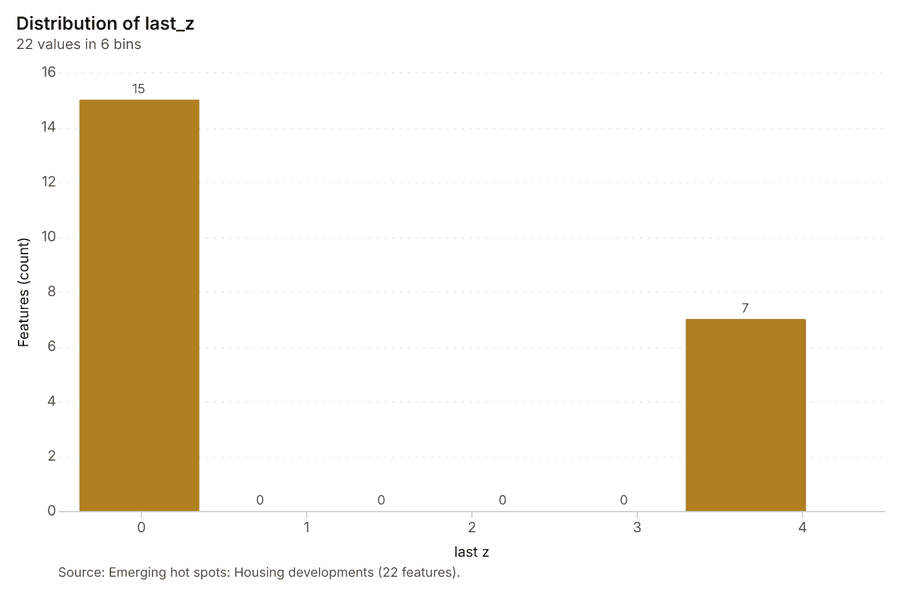
Figure 29. Emerging hot spots: Housing developments 82
| bin_start | bin_end | count |
|---|---|---|
| -0.379 | 0.3548 | 15 |
| 0.3548 | 1.089 | 0 |
| 1.089 | 1.823 | 0 |
| 1.823 | 2.556 | 0 |
| 2.556 | 3.29 | 0 |
| 3.29 | 4.024 | 7 |
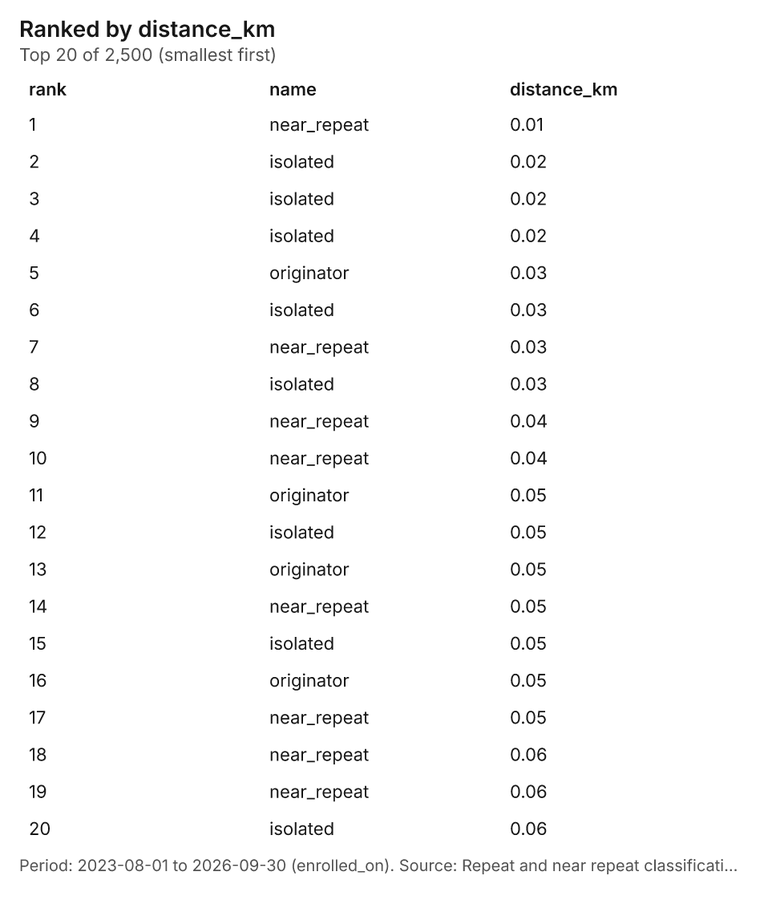
Figure 30. Repeat and near repeat classification: Student homes 83
| rank | name | distance_km |
|---|---|---|
| 1 | near_repeat | 0.01 |
| 2 | isolated | 0.02 |
| 3 | isolated | 0.02 |
| 4 | isolated | 0.02 |
| 5 | originator | 0.03 |
| 6 | isolated | 0.03 |
| 7 | near_repeat | 0.03 |
| 8 | isolated | 0.03 |
| 9 | near_repeat | 0.04 |
| 10 | near_repeat | 0.04 |
| 11 | originator | 0.05 |
| 12 | isolated | 0.05 |
| 13 | originator | 0.05 |
| 14 | near_repeat | 0.05 |
| 15 | isolated | 0.05 |
| 16 | originator | 0.05 |
| 17 | near_repeat | 0.05 |
| 18 | near_repeat | 0.06 |
| 19 | near_repeat | 0.06 |
| 20 | isolated | 0.06 |
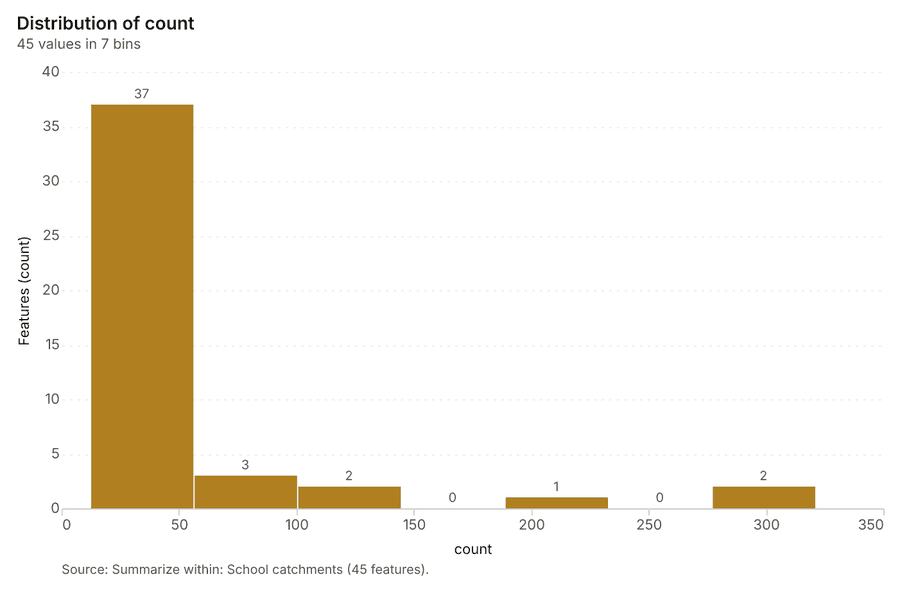
Figure 31. Summarize within: School catchments 84
| bin_start | bin_end | count |
|---|---|---|
| 12 | 56.14 | 37 |
| 56.14 | 100.3 | 3 |
| 100.3 | 144.4 | 2 |
| 144.4 | 188.6 | 0 |
| 188.6 | 232.7 | 1 |
| 232.7 | 276.9 | 0 |
| 276.9 | 321 | 2 |
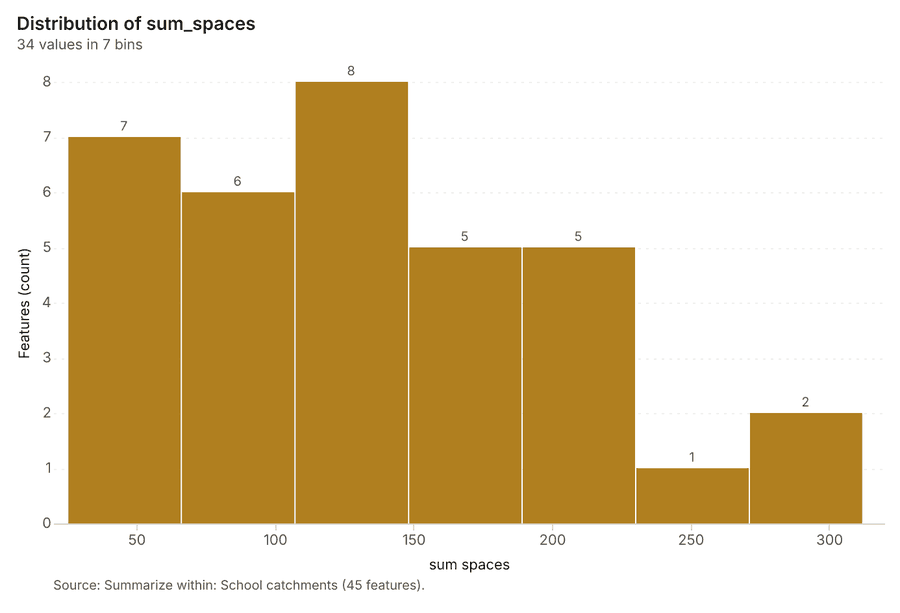
Figure 32. Summarize within: School catchments 85
| bin_start | bin_end | count |
|---|---|---|
| 25 | 66 | 7 |
| 66 | 107 | 6 |
| 107 | 148 | 8 |
| 148 | 189 | 5 |
| 189 | 230 | 5 |
| 230 | 271 | 1 |
| 271 | 312 | 2 |
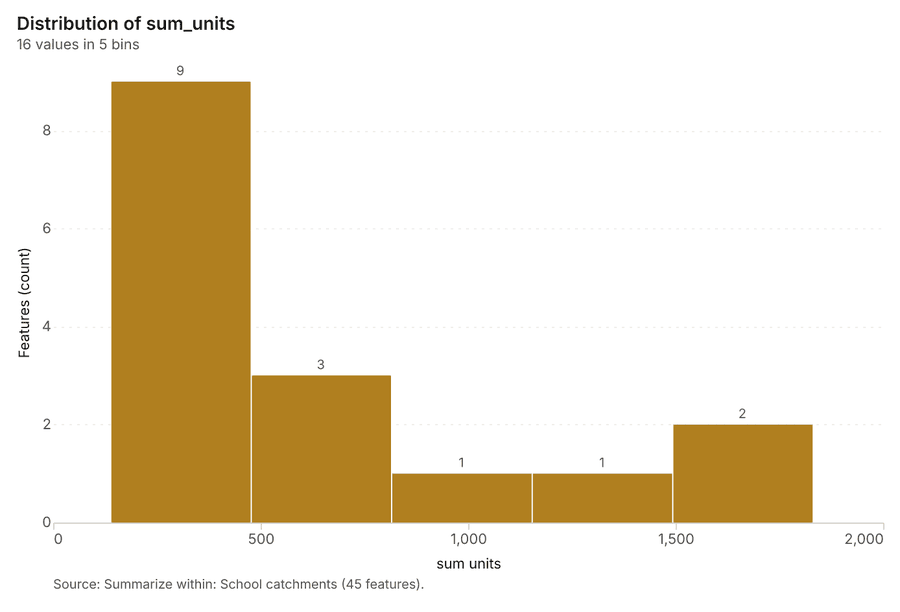
Figure 33. Summarize within: School catchments 86
| bin_start | bin_end | count |
|---|---|---|
| 137 | 475.6 | 9 |
| 475.6 | 814.2 | 3 |
| 814.2 | 1,153 | 1 |
| 1,153 | 1,491 | 1 |
| 1,491 | 1,830 | 2 |
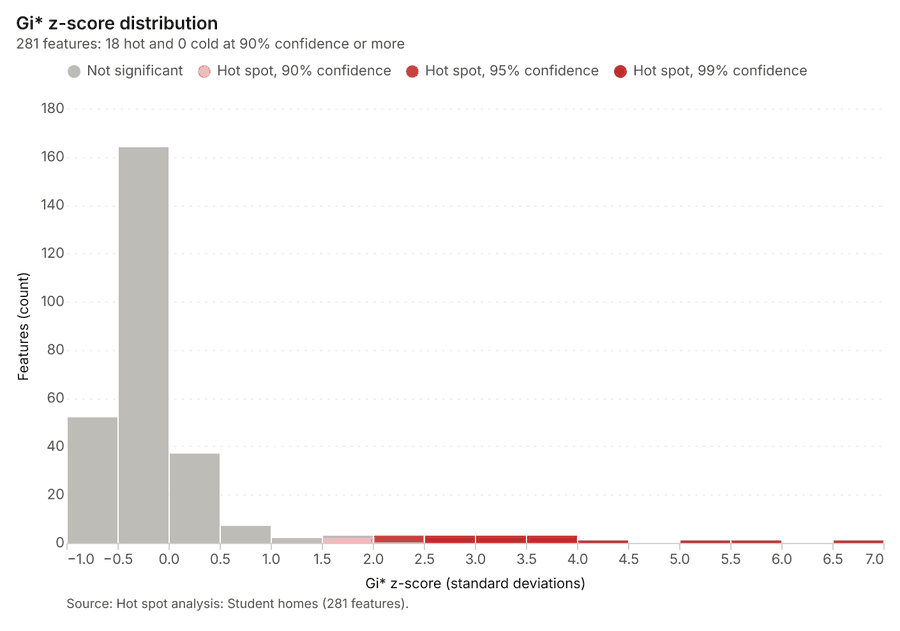
Figure 34. Hot spot analysis: Student homes 87
| bin_start | bin_end | band | band_label | count |
|---|---|---|---|---|
| -1 | -0.5 | not_significant | Not significant | 52 |
| -0.5 | 0 | not_significant | Not significant | 164 |
| 0 | 0.5 | not_significant | Not significant | 37 |
| 0.5 | 1 | not_significant | Not significant | 7 |
| 1 | 1.5 | not_significant | Not significant | 2 |
| 1.5 | 2 | hot_90 | Hot spot, 90% confidence | 2 |
| 1.5 | 2 | not_significant | Not significant | 1 |
| 2 | 2.5 | hot_95 | Hot spot, 95% confidence | 3 |
| 2.5 | 3 | hot_99 | Hot spot, 99% confidence | 3 |
| 3 | 3.5 | hot_99 | Hot spot, 99% confidence | 3 |
| 3.5 | 4 | hot_99 | Hot spot, 99% confidence | 3 |
| 4 | 4.5 | hot_99 | Hot spot, 99% confidence | 1 |
| 5 | 5.5 | hot_99 | Hot spot, 99% confidence | 1 |
| 5.5 | 6 | hot_99 | Hot spot, 99% confidence | 1 |
| 6.5 | 7 | hot_99 | Hot spot, 99% confidence | 1 |
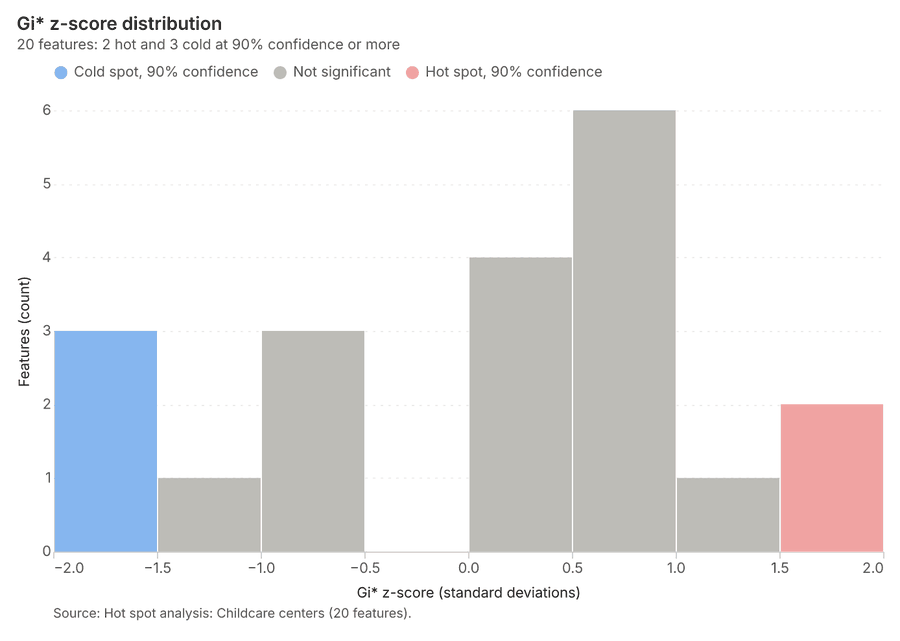
Figure 35. Hot spot analysis: Childcare centers 88
| bin_start | bin_end | band | band_label | count |
|---|---|---|---|---|
| -2 | -1.5 | cold_90 | Cold spot, 90% confidence | 3 |
| -1.5 | -1 | not_significant | Not significant | 1 |
| -1 | -0.5 | not_significant | Not significant | 3 |
| 0 | 0.5 | not_significant | Not significant | 4 |
| 0.5 | 1 | not_significant | Not significant | 6 |
| 1 | 1.5 | not_significant | Not significant | 1 |
| 1.5 | 2 | hot_90 | Hot spot, 90% confidence | 2 |
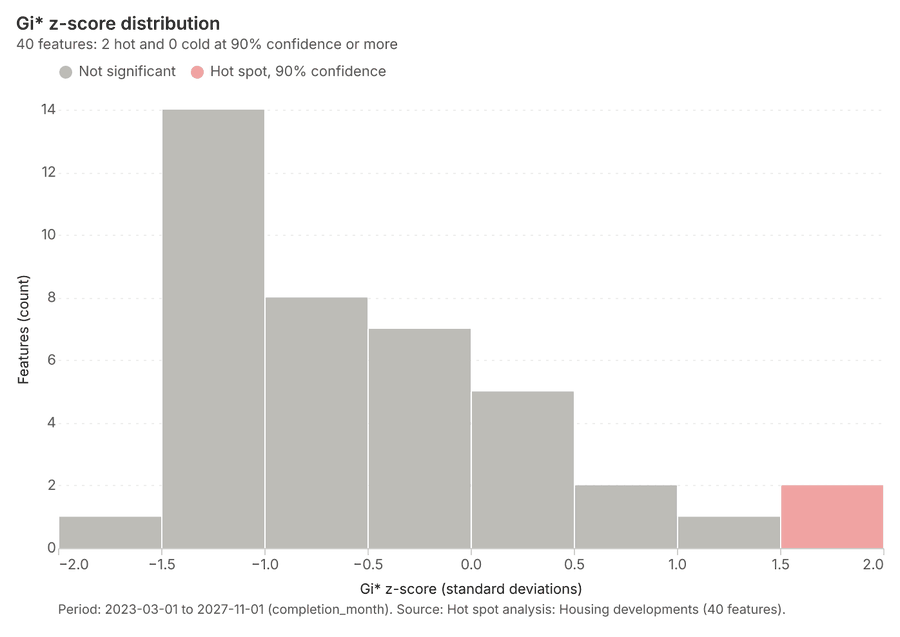
Figure 36. Hot spot analysis: Housing developments 89
| bin_start | bin_end | band | band_label | count |
|---|---|---|---|---|
| -2 | -1.5 | not_significant | Not significant | 1 |
| -1.5 | -1 | not_significant | Not significant | 14 |
| -1 | -0.5 | not_significant | Not significant | 8 |
| -0.5 | 0 | not_significant | Not significant | 7 |
| 0 | 0.5 | not_significant | Not significant | 5 |
| 0.5 | 1 | not_significant | Not significant | 2 |
| 1 | 1.5 | not_significant | Not significant | 1 |
| 1.5 | 2 | hot_90 | Hot spot, 90% confidence | 2 |
Figure 37. Calculate density: Student homes 90
| bin_start | bin_end | count |
|---|---|---|
| 0 | 4 | 121 |
| 4 | 8 | 153 |
| 8 | 12 | 156 |
| 12 | 16 | 154 |
| 16 | 20 | 153 |
| 20 | 24 | 151 |
| 24 | 28 | 152 |
| 28 | 32 | 152 |
| 32 | 36 | 153 |
| 36 | 40 | 154 |
| 40 | 44 | 156 |
| 44 | 48 | 183 |
Figure 38. Calculate density: Childcare centers 91
| bin_start | bin_end | count |
|---|---|---|
| 0 | 1.5 | 11 |
| 1.5 | 3 | 10 |
| 3 | 4.5 | 20 |
| 4.5 | 6 | 10 |
| 6 | 7.5 | 19 |
| 7.5 | 9 | 10 |
| 9 | 10.5 | 20 |
| 10.5 | 12 | 12 |
Figure 39. Calculate density: Housing developments 92
| bin_start | bin_end | count |
|---|---|---|
| 0.0577 | 110.2 | 55 |
| 110.2 | 220.4 | 13 |
| 220.4 | 330.6 | 1 |
| 330.6 | 440.8 | 3 |
| 440.8 | 551 | 3 |
| 551 | 661.2 | 3 |
| 661.2 | 771.4 | 0 |
| 771.4 | 881.6 | 2 |
Figure 40. Find point clusters: Student homes 93
| cluster | features | fraction | share |
|---|---|---|---|
| Noise | 1,490 | 0.596 | 59.6% |
| 0 | 1,010 | 0.404 | 40.4% |
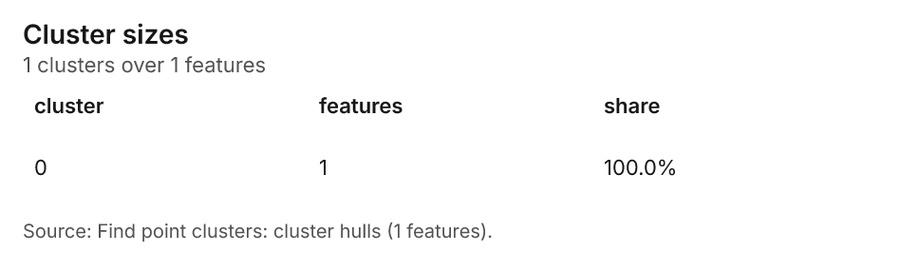
Figure 41. Find point clusters: cluster hulls 94
| cluster | features | fraction | share |
|---|---|---|---|
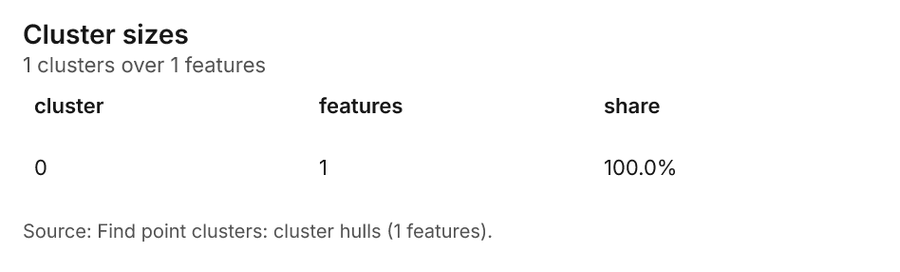
| 0 | 1 | 1 | 100.0% |
Figure 42. Find point clusters: Childcare centers 95
| cluster | features | fraction | share |
|---|---|---|---|
| 1 | 14 | 0.2333 | 23.3% |
| 0 | 11 | 0.1833 | 18.3% |
| 6 | 9 | 0.15 | 15.0% |
| 3 | 7 | 0.1167 | 11.7% |
| 4 | 6 | 0.1 | 10.0% |
| 2 | 5 | 0.08333 | 8.3% |
| 5 | 4 | 0.06667 | 6.7% |
| 7 | 3 | 0.05 | 5.0% |
| Noise | 1 | 0.01667 | 1.7% |
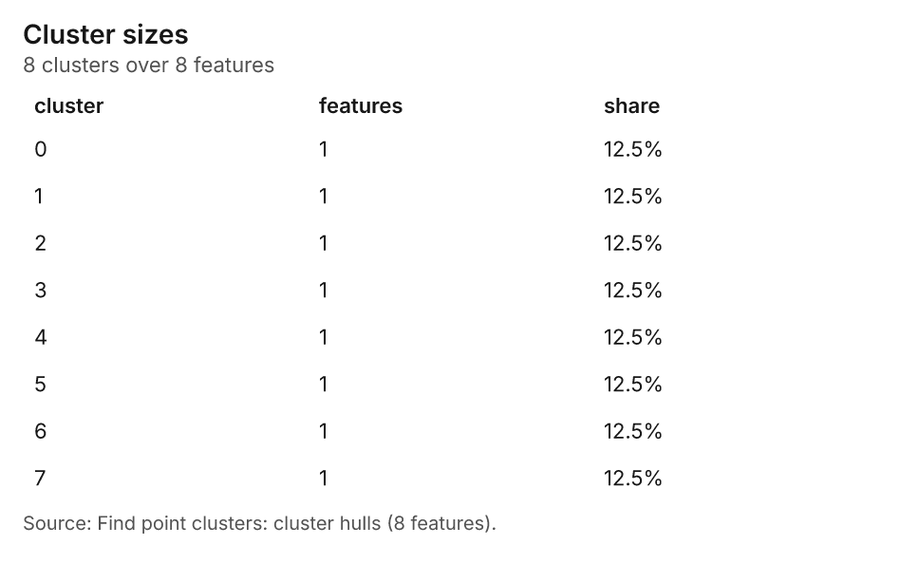
Figure 43. Find point clusters: cluster hulls 96
| cluster | features | fraction | share |
|---|---|---|---|
| 0 | 1 | 0.125 | 12.5% |
| 1 | 1 | 0.125 | 12.5% |
| 2 | 1 | 0.125 | 12.5% |
| 3 | 1 | 0.125 | 12.5% |
| 4 | 1 | 0.125 | 12.5% |
| 5 | 1 | 0.125 | 12.5% |
| 6 | 1 | 0.125 | 12.5% |
| 7 | 1 | 0.125 | 12.5% |
Figure 44. Find point clusters: Housing developments 97
| cluster | features | fraction | share |
|---|---|---|---|
| 0 | 37 | 0.925 | 92.5% |
| Noise | 3 | 0.075 | 7.5% |
Figure 45. Find point clusters: cluster hulls 98
| cluster | features | fraction | share |
|---|---|---|---|
| 0 | 1 | 1 | 100.0% |
Figure 46. Find outliers: School catchments 99
| value | lag | type |
|---|---|---|
| -0.9672 | -0.1255 | NS |
| 1.383 | 0.255 | NS |
| -0.6288 | -0.6039 | NS |
| -0.0459 | -0.6442 | NS |
| 0.7193 | 0.1212 | NS |
| 1.317 | 0.8302 | NS |
| -0.0572 | 0.3557 | NS |
| 0.0175 | -0.639 | NS |
| -0.5212 | -0.3817 | NS |
| -0.356 | -0.459 | NS |
| 0.4873 | 0.0922 | NS |
| 0.2043 | 0.0226 | NS |
| -0.9095 | 0.2148 | NS |
| -0.2881 | 0.7917 | NS |
| 0.9559 | 0.2419 | NS |
| -0.2405 | -0.4586 | NS |
| -0.6061 | -0.1115 | NS |
| -0.2824 | 0.1801 | NS |
| -1.147 | 0.1129 | NS |
| -1.243 | 0.0056 | NS |
| -1.18 | 0.049 | NS |
| -1.044 | -0.5665 | NS |
| 1.131 | -0.9146 | NS |
| -0.0311 | -0.7442 | NS |
| 0.2201 | -0.5934 | NS |
| -0.3798 | -0.8665 | NS |
| 1.49 | -0.2094 | NS |
| 1.824 | -0.5705 | NS |
| -0.0198 | -0.3756 | NS |
| 0.8348 | -0.5589 | NS |
| 0.0322 | -0.2103 | NS |
| -0.5473 | 0.169 | NS |
| -1.234 | -0.6621 | NS |
| -0.5416 | 0.7018 | NS |
| -0.4816 | -0.4831 | NS |
| -1.345 | -0.8861 | NS |
| -0.3617 | 0.0937 | NS |
| -0.8529 | 0.1562 | NS |
| -0.2711 | -0.4635 | NS |
| 3.903 | -0.5416 | NS |
| -0.6831 | -0.1341 | NS |
| 0.8302 | 0.8808 | NS |
| 1.119 | -0.2824 | NS |
| -0.682 | 0.1734 | NS |
| 0.4805 | -0.3526 | NS |
Figure 47. Find nearest: Student homes 100
| rank | name |
|---|---|
| 1 | 1 |
| 1 | 1 |
| 1 | 1 |
| 1 | 1 |
| 1 | 1 |
| 1 | 1 |
| 1 | 1 |
| 1 | 1 |
| 1 | 1 |
| 1 | 1 |
| 1 | 1 |
| 1 | 1 |
| 1 | 1 |
| 1 | 1 |
| 1 | 1 |
| 1 | 1 |
| 1 | 1 |
| 1 | 1 |
| 1 | 1 |
| 1 | 1 |
Figure 48. Find nearest: Student homes 101
| rank | name |
|---|---|
| 1 | 1 |
| 1 | 1 |
| 1 | 1 |
| 1 | 1 |
| 1 | 1 |
| 1 | 1 |
| 1 | 1 |
| 1 | 1 |
| 1 | 1 |
| 1 | 1 |
| 1 | 1 |
| 1 | 1 |
| 1 | 1 |
| 1 | 1 |
| 1 | 1 |
| 1 | 1 |
| 1 | 1 |
| 1 | 1 |
| 1 | 1 |
| 1 | 1 |
Figure 49. Find nearest: Student homes over time 102
| period | series | value |
|---|---|---|
| 2023-08-01 | walk | 44 |
| 2023-08-01 | bus | 25 |
| 2023-08-01 | car | 15 |
| 2023-08-01 | bike | 7 |
| 2023-09-01 | walk | 50 |
| 2023-09-01 | bus | 26 |
| 2023-09-01 | car | 24 |
| 2023-09-01 | bike | 5 |
| 2023-10-01 | walk | 48 |
| 2023-10-01 | bus | 28 |
| 2023-10-01 | car | 29 |
| 2023-10-01 | bike | 8 |
| 2023-11-01 | walk | 31 |
| 2023-11-01 | bus | 23 |
| 2023-11-01 | car | 19 |
| 2023-11-01 | bike | 3 |
| 2023-12-01 | walk | 17 |
| 2023-12-01 | bus | 12 |
| 2023-12-01 | car | 8 |
| 2023-12-01 | bike | 5 |
| 2024-01-01 | walk | 6 |
| 2024-01-01 | bus | 4 |
| 2024-01-01 | car | 1 |
| 2024-01-01 | bike | 1 |
| 2024-02-01 | walk | 2 |
| 2024-02-01 | bus | 0 |
| 2024-02-01 | car | 0 |
| 2024-02-01 | bike | 0 |
| 2024-03-01 | walk | 1 |
| 2024-03-01 | bus | 1 |
| 2024-03-01 | car | 0 |
| 2024-03-01 | bike | 0 |
| 2024-04-01 | walk | 1 |
| 2024-04-01 | bus | 0 |
| 2024-04-01 | car | 1 |
| 2024-04-01 | bike | 0 |
| 2024-05-01 | walk | 5 |
| 2024-05-01 | bus | 2 |
| 2024-05-01 | car | 6 |
| 2024-05-01 | bike | 1 |
| 2024-06-01 | walk | 12 |
| 2024-06-01 | bus | 15 |
| 2024-06-01 | car | 15 |
| 2024-06-01 | bike | 2 |
| 2024-07-01 | walk | 36 |
| 2024-07-01 | bus | 20 |
| 2024-07-01 | car | 15 |
| 2024-07-01 | bike | 5 |
| 2024-08-01 | walk | 56 |
| 2024-08-01 | bus | 26 |
| 2024-08-01 | car | 19 |
| 2024-08-01 | bike | 1 |
| 2024-09-01 | walk | 64 |
| 2024-09-01 | bus | 31 |
| 2024-09-01 | car | 25 |
| 2024-09-01 | bike | 3 |
| 2024-10-01 | walk | 48 |
| 2024-10-01 | bus | 44 |
| 2024-10-01 | car | 26 |
| 2024-10-01 | bike | 3 |
| 2024-11-01 | walk | 34 |
| 2024-11-01 | bus | 17 |
| 2024-11-01 | car | 15 |
| 2024-11-01 | bike | 4 |
| 2024-12-01 | walk | 28 |
| 2024-12-01 | bus | 16 |
| 2024-12-01 | car | 3 |
| 2024-12-01 | bike | 2 |
| 2025-01-01 | walk | 11 |
| 2025-01-01 | bus | 9 |
| 2025-01-01 | car | 3 |
| 2025-01-01 | bike | 0 |
| 2025-02-01 | walk | 0 |
| 2025-02-01 | bus | 0 |
| 2025-02-01 | car | 0 |
| 2025-02-01 | bike | 0 |
| 2025-03-01 | walk | 0 |
| 2025-03-01 | bus | 0 |
| 2025-03-01 | car | 0 |
| 2025-03-01 | bike | 0 |
| 2025-04-01 | walk | 2 |
| 2025-04-01 | bus | 1 |
| 2025-04-01 | car | 0 |
| 2025-04-01 | bike | 0 |
| 2025-05-01 | walk | 7 |
| 2025-05-01 | bus | 8 |
| 2025-05-01 | car | 1 |
| 2025-05-01 | bike | 1 |
| 2025-06-01 | walk | 25 |
| 2025-06-01 | bus | 13 |
| 2025-06-01 | car | 16 |
| 2025-06-01 | bike | 3 |
| 2025-07-01 | walk | 42 |
| 2025-07-01 | bus | 26 |
| 2025-07-01 | car | 20 |
| 2025-07-01 | bike | 3 |
| 2025-08-01 | walk | 55 |
| 2025-08-01 | bus | 38 |
| 2025-08-01 | car | 21 |
| 2025-08-01 | bike | 8 |
| 2025-09-01 | walk | 62 |
| 2025-09-01 | bus | 39 |
| 2025-09-01 | car | 27 |
| 2025-09-01 | bike | 9 |
| 2025-10-01 | walk | 49 |
| 2025-10-01 | bus | 38 |
| 2025-10-01 | car | 17 |
| 2025-10-01 | bike | 7 |
| 2025-11-01 | walk | 30 |
| 2025-11-01 | bus | 31 |
| 2025-11-01 | car | 16 |
| 2025-11-01 | bike | 6 |
| 2025-12-01 | walk | 29 |
| 2025-12-01 | bus | 13 |
| 2025-12-01 | car | 14 |
| 2025-12-01 | bike | 5 |
| 2026-01-01 | walk | 7 |
| 2026-01-01 | bus | 8 |
| 2026-01-01 | car | 7 |
| 2026-01-01 | bike | 3 |
| 2026-02-01 | walk | 1 |
| 2026-02-01 | bus | 3 |
| 2026-02-01 | car | 2 |
| 2026-02-01 | bike | 0 |
| 2026-03-01 | walk | 1 |
| 2026-03-01 | bus | 0 |
| 2026-03-01 | car | 3 |
| 2026-03-01 | bike | 0 |
| 2026-04-01 | walk | 2 |
| 2026-04-01 | bus | 1 |
| 2026-04-01 | car | 2 |
| 2026-04-01 | bike | 0 |
| 2026-05-01 | walk | 13 |
| 2026-05-01 | bus | 7 |
| 2026-05-01 | car | 7 |
| 2026-05-01 | bike | 0 |
| 2026-06-01 | walk | 27 |
| 2026-06-01 | bus | 21 |
| 2026-06-01 | car | 8 |
| 2026-06-01 | bike | 5 |
| 2026-07-01 | walk | 47 |
| 2026-07-01 | bus | 23 |
| 2026-07-01 | car | 13 |
| 2026-07-01 | bike | 4 |
| 2026-08-01 | walk | 60 |
| 2026-08-01 | bus | 47 |
| 2026-08-01 | car | 20 |
| 2026-08-01 | bike | 12 |
| 2026-09-01 | walk | 55 |
| 2026-09-01 | bus | 48 |
| 2026-09-01 | car | 33 |
| 2026-09-01 | bike | 12 |
Figure 50. Find nearest: Student homes over time 103
| period | series | value |
|---|---|---|
| 2023-08-01 | walk | 48 |
| 2023-08-01 | bus | 29 |
| 2023-08-01 | car | 18 |
| 2023-08-01 | bike | 8 |
| 2023-09-01 | walk | 58 |
| 2023-09-01 | bus | 31 |
| 2023-09-01 | car | 26 |
| 2023-09-01 | bike | 6 |
| 2023-10-01 | walk | 54 |
| 2023-10-01 | bus | 34 |
| 2023-10-01 | car | 33 |
| 2023-10-01 | bike | 9 |
| 2023-11-01 | walk | 35 |
| 2023-11-01 | bus | 26 |
| 2023-11-01 | car | 20 |
| 2023-11-01 | bike | 4 |
| 2023-12-01 | walk | 21 |
| 2023-12-01 | bus | 14 |
| 2023-12-01 | car | 9 |
| 2023-12-01 | bike | 5 |
| 2024-01-01 | walk | 7 |
| 2024-01-01 | bus | 4 |
| 2024-01-01 | car | 1 |
| 2024-01-01 | bike | 1 |
| 2024-02-01 | walk | 2 |
| 2024-02-01 | bus | 0 |
| 2024-02-01 | car | 1 |
| 2024-02-01 | bike | 0 |
| 2024-03-01 | walk | 1 |
| 2024-03-01 | bus | 2 |
| 2024-03-01 | car | 0 |
| 2024-03-01 | bike | 0 |
| 2024-04-01 | walk | 1 |
| 2024-04-01 | bus | 0 |
| 2024-04-01 | car | 1 |
| 2024-04-01 | bike | 0 |
| 2024-05-01 | walk | 8 |
| 2024-05-01 | bus | 3 |
| 2024-05-01 | car | 6 |
| 2024-05-01 | bike | 1 |
| 2024-06-01 | walk | 14 |
| 2024-06-01 | bus | 16 |
| 2024-06-01 | car | 15 |
| 2024-06-01 | bike | 3 |
| 2024-07-01 | walk | 40 |
| 2024-07-01 | bus | 25 |
| 2024-07-01 | car | 19 |
| 2024-07-01 | bike | 5 |
| 2024-08-01 | walk | 59 |
| 2024-08-01 | bus | 32 |
| 2024-08-01 | car | 20 |
| 2024-08-01 | bike | 1 |
| 2024-09-01 | walk | 70 |
| 2024-09-01 | bus | 35 |
| 2024-09-01 | car | 25 |
| 2024-09-01 | bike | 4 |
| 2024-10-01 | walk | 53 |
| 2024-10-01 | bus | 48 |
| 2024-10-01 | car | 27 |
| 2024-10-01 | bike | 4 |
| 2024-11-01 | walk | 39 |
| 2024-11-01 | bus | 21 |
| 2024-11-01 | car | 17 |
| 2024-11-01 | bike | 4 |
| 2024-12-01 | walk | 28 |
| 2024-12-01 | bus | 16 |
| 2024-12-01 | car | 4 |
| 2024-12-01 | bike | 2 |
| 2025-01-01 | walk | 12 |
| 2025-01-01 | bus | 9 |
| 2025-01-01 | car | 3 |
| 2025-01-01 | bike | 1 |
| 2025-02-01 | walk | 0 |
| 2025-02-01 | bus | 0 |
| 2025-02-01 | car | 0 |
| 2025-02-01 | bike | 0 |
| 2025-03-01 | walk | 0 |
| 2025-03-01 | bus | 0 |
| 2025-03-01 | car | 0 |
| 2025-03-01 | bike | 0 |
| 2025-04-01 | walk | 2 |
| 2025-04-01 | bus | 1 |
| 2025-04-01 | car | 0 |
| 2025-04-01 | bike | 0 |
| 2025-05-01 | walk | 8 |
| 2025-05-01 | bus | 8 |
| 2025-05-01 | car | 2 |
| 2025-05-01 | bike | 1 |
| 2025-06-01 | walk | 29 |
| 2025-06-01 | bus | 15 |
| 2025-06-01 | car | 17 |
| 2025-06-01 | bike | 3 |
| 2025-07-01 | walk | 47 |
| 2025-07-01 | bus | 30 |
| 2025-07-01 | car | 20 |
| 2025-07-01 | bike | 3 |
| 2025-08-01 | walk | 62 |
| 2025-08-01 | bus | 41 |
| 2025-08-01 | car | 25 |
| 2025-08-01 | bike | 8 |
| 2025-09-01 | walk | 69 |
| 2025-09-01 | bus | 41 |
| 2025-09-01 | car | 29 |
| 2025-09-01 | bike | 10 |
| 2025-10-01 | walk | 58 |
| 2025-10-01 | bus | 40 |
| 2025-10-01 | car | 21 |
| 2025-10-01 | bike | 7 |
| 2025-11-01 | walk | 34 |
| 2025-11-01 | bus | 34 |
| 2025-11-01 | car | 17 |
| 2025-11-01 | bike | 6 |
| 2025-12-01 | walk | 31 |
| 2025-12-01 | bus | 14 |
| 2025-12-01 | car | 16 |
| 2025-12-01 | bike | 6 |
| 2026-01-01 | walk | 8 |
| 2026-01-01 | bus | 8 |
| 2026-01-01 | car | 7 |
| 2026-01-01 | bike | 3 |
| 2026-02-01 | walk | 1 |
| 2026-02-01 | bus | 3 |
| 2026-02-01 | car | 2 |
| 2026-02-01 | bike | 0 |
| 2026-03-01 | walk | 1 |
| 2026-03-01 | bus | 0 |
| 2026-03-01 | car | 3 |
| 2026-03-01 | bike | 0 |
| 2026-04-01 | walk | 2 |
| 2026-04-01 | bus | 1 |
| 2026-04-01 | car | 2 |
| 2026-04-01 | bike | 0 |
| 2026-05-01 | walk | 13 |
| 2026-05-01 | bus | 8 |
| 2026-05-01 | car | 7 |
| 2026-05-01 | bike | 0 |
| 2026-06-01 | walk | 31 |
| 2026-06-01 | bus | 22 |
| 2026-06-01 | car | 11 |
| 2026-06-01 | bike | 5 |
| 2026-07-01 | walk | 54 |
| 2026-07-01 | bus | 25 |
| 2026-07-01 | car | 13 |
| 2026-07-01 | bike | 4 |
| 2026-08-01 | walk | 62 |
| 2026-08-01 | bus | 51 |
| 2026-08-01 | car | 25 |
| 2026-08-01 | bike | 12 |
| 2026-09-01 | walk | 63 |
| 2026-09-01 | bus | 53 |
| 2026-09-01 | car | 35 |
| 2026-09-01 | bike | 12 |
Figure 51. Find nearest: Student homes over time 104
| period | series | value |
|---|---|---|
| 2023-08-01 | Dundas Nova Street | 16 |
| 2023-08-01 | Lakeview Avenue | 15 |
| 2023-08-01 | Forest Hill Avenue | 17 |
| 2023-08-01 | Front Street | 15 |
| 2023-08-01 | Bloor Nova Street | 8 |
| 2023-08-01 | Other | 32 |
| 2023-09-01 | Dundas Nova Street | 18 |
| 2023-09-01 | Lakeview Avenue | 23 |
| 2023-09-01 | Forest Hill Avenue | 14 |
| 2023-09-01 | Front Street | 17 |
| 2023-09-01 | Bloor Nova Street | 10 |
| 2023-09-01 | Other | 39 |
| 2023-10-01 | Dundas Nova Street | 19 |
| 2023-10-01 | Lakeview Avenue | 16 |
| 2023-10-01 | Forest Hill Avenue | 14 |
| 2023-10-01 | Front Street | 20 |
| 2023-10-01 | Bloor Nova Street | 21 |
| 2023-10-01 | Other | 40 |
| 2023-11-01 | Dundas Nova Street | 13 |
| 2023-11-01 | Lakeview Avenue | 15 |
| 2023-11-01 | Forest Hill Avenue | 6 |
| 2023-11-01 | Front Street | 17 |
| 2023-11-01 | Bloor Nova Street | 10 |
| 2023-11-01 | Other | 24 |
| 2023-12-01 | Dundas Nova Street | 8 |
| 2023-12-01 | Lakeview Avenue | 7 |
| 2023-12-01 | Forest Hill Avenue | 12 |
| 2023-12-01 | Front Street | 8 |
| 2023-12-01 | Bloor Nova Street | 4 |
| 2023-12-01 | Other | 10 |
| 2024-01-01 | Dundas Nova Street | 4 |
| 2024-01-01 | Lakeview Avenue | 3 |
| 2024-01-01 | Forest Hill Avenue | 0 |
| 2024-01-01 | Front Street | 1 |
| 2024-01-01 | Bloor Nova Street | 1 |
| 2024-01-01 | Other | 4 |
| 2024-02-01 | Dundas Nova Street | 0 |
| 2024-02-01 | Lakeview Avenue | 1 |
| 2024-02-01 | Forest Hill Avenue | 0 |
| 2024-02-01 | Front Street | 0 |
| 2024-02-01 | Bloor Nova Street | 1 |
| 2024-02-01 | Other | 1 |
| 2024-03-01 | Dundas Nova Street | 1 |
| 2024-03-01 | Lakeview Avenue | 0 |
| 2024-03-01 | Forest Hill Avenue | 0 |
| 2024-03-01 | Front Street | 2 |
| 2024-03-01 | Bloor Nova Street | 0 |
| 2024-03-01 | Other | 0 |
| 2024-04-01 | Dundas Nova Street | 0 |
| 2024-04-01 | Lakeview Avenue | 0 |
| 2024-04-01 | Forest Hill Avenue | 0 |
| 2024-04-01 | Front Street | 0 |
| 2024-04-01 | Bloor Nova Street | 1 |
| 2024-04-01 | Other | 1 |
| 2024-05-01 | Dundas Nova Street | 4 |
| 2024-05-01 | Lakeview Avenue | 4 |
| 2024-05-01 | Forest Hill Avenue | 1 |
| 2024-05-01 | Front Street | 1 |
| 2024-05-01 | Bloor Nova Street | 4 |
| 2024-05-01 | Other | 4 |
| 2024-06-01 | Dundas Nova Street | 8 |
| 2024-06-01 | Lakeview Avenue | 3 |
| 2024-06-01 | Forest Hill Avenue | 10 |
| 2024-06-01 | Front Street | 7 |
| 2024-06-01 | Bloor Nova Street | 7 |
| 2024-06-01 | Other | 13 |
| 2024-07-01 | Dundas Nova Street | 17 |
| 2024-07-01 | Lakeview Avenue | 11 |
| 2024-07-01 | Forest Hill Avenue | 14 |
| 2024-07-01 | Front Street | 19 |
| 2024-07-01 | Bloor Nova Street | 11 |
| 2024-07-01 | Other | 17 |
| 2024-08-01 | Dundas Nova Street | 25 |
| 2024-08-01 | Lakeview Avenue | 22 |
| 2024-08-01 | Forest Hill Avenue | 15 |
| 2024-08-01 | Front Street | 11 |
| 2024-08-01 | Bloor Nova Street | 13 |
| 2024-08-01 | Other | 26 |
| 2024-09-01 | Dundas Nova Street | 24 |
| 2024-09-01 | Lakeview Avenue | 18 |
| 2024-09-01 | Forest Hill Avenue | 22 |
| 2024-09-01 | Front Street | 21 |
| 2024-09-01 | Bloor Nova Street | 10 |
| 2024-09-01 | Other | 39 |
| 2024-10-01 | Dundas Nova Street | 19 |
| 2024-10-01 | Lakeview Avenue | 21 |
| 2024-10-01 | Forest Hill Avenue | 18 |
| 2024-10-01 | Front Street | 15 |
| 2024-10-01 | Bloor Nova Street | 25 |
| 2024-10-01 | Other | 34 |
| 2024-11-01 | Dundas Nova Street | 14 |
| 2024-11-01 | Lakeview Avenue | 12 |
| 2024-11-01 | Forest Hill Avenue | 10 |
| 2024-11-01 | Front Street | 8 |
| 2024-11-01 | Bloor Nova Street | 14 |
| 2024-11-01 | Other | 23 |
| 2024-12-01 | Dundas Nova Street | 8 |
| 2024-12-01 | Lakeview Avenue | 8 |
| 2024-12-01 | Forest Hill Avenue | 12 |
| 2024-12-01 | Front Street | 4 |
| 2024-12-01 | Bloor Nova Street | 6 |
| 2024-12-01 | Other | 12 |
| 2025-01-01 | Dundas Nova Street | 7 |
| 2025-01-01 | Lakeview Avenue | 4 |
| 2025-01-01 | Forest Hill Avenue | 2 |
| 2025-01-01 | Front Street | 2 |
| 2025-01-01 | Bloor Nova Street | 5 |
| 2025-01-01 | Other | 5 |
| 2025-02-01 | Dundas Nova Street | 0 |
| 2025-02-01 | Lakeview Avenue | 0 |
| 2025-02-01 | Forest Hill Avenue | 0 |
| 2025-02-01 | Front Street | 0 |
| 2025-02-01 | Bloor Nova Street | 0 |
| 2025-02-01 | Other | 0 |
| 2025-03-01 | Dundas Nova Street | 0 |
| 2025-03-01 | Lakeview Avenue | 0 |
| 2025-03-01 | Forest Hill Avenue | 0 |
| 2025-03-01 | Front Street | 0 |
| 2025-03-01 | Bloor Nova Street | 0 |
| 2025-03-01 | Other | 0 |
| 2025-04-01 | Dundas Nova Street | 0 |
| 2025-04-01 | Lakeview Avenue | 0 |
| 2025-04-01 | Forest Hill Avenue | 2 |
| 2025-04-01 | Front Street | 0 |
| 2025-04-01 | Bloor Nova Street | 0 |
| 2025-04-01 | Other | 1 |
| 2025-05-01 | Dundas Nova Street | 5 |
| 2025-05-01 | Lakeview Avenue | 7 |
| 2025-05-01 | Forest Hill Avenue | 1 |
| 2025-05-01 | Front Street | 3 |
| 2025-05-01 | Bloor Nova Street | 2 |
| 2025-05-01 | Other | 1 |
| 2025-06-01 | Dundas Nova Street | 12 |
| 2025-06-01 | Lakeview Avenue | 8 |
| 2025-06-01 | Forest Hill Avenue | 15 |
| 2025-06-01 | Front Street | 10 |
| 2025-06-01 | Bloor Nova Street | 7 |
| 2025-06-01 | Other | 12 |
| 2025-07-01 | Dundas Nova Street | 15 |
| 2025-07-01 | Lakeview Avenue | 18 |
| 2025-07-01 | Forest Hill Avenue | 13 |
| 2025-07-01 | Front Street | 12 |
| 2025-07-01 | Bloor Nova Street | 12 |
| 2025-07-01 | Other | 30 |
| 2025-08-01 | Dundas Nova Street | 24 |
| 2025-08-01 | Lakeview Avenue | 22 |
| 2025-08-01 | Forest Hill Avenue | 26 |
| 2025-08-01 | Front Street | 18 |
| 2025-08-01 | Bloor Nova Street | 17 |
| 2025-08-01 | Other | 29 |
| 2025-09-01 | Dundas Nova Street | 37 |
| 2025-09-01 | Lakeview Avenue | 21 |
| 2025-09-01 | Forest Hill Avenue | 21 |
| 2025-09-01 | Front Street | 16 |
| 2025-09-01 | Bloor Nova Street | 21 |
| 2025-09-01 | Other | 33 |
| 2025-10-01 | Dundas Nova Street | 20 |
| 2025-10-01 | Lakeview Avenue | 26 |
| 2025-10-01 | Forest Hill Avenue | 18 |
| 2025-10-01 | Front Street | 12 |
| 2025-10-01 | Bloor Nova Street | 18 |
| 2025-10-01 | Other | 32 |
| 2025-11-01 | Dundas Nova Street | 16 |
| 2025-11-01 | Lakeview Avenue | 23 |
| 2025-11-01 | Forest Hill Avenue | 11 |
| 2025-11-01 | Front Street | 13 |
| 2025-11-01 | Bloor Nova Street | 7 |
| 2025-11-01 | Other | 21 |
| 2025-12-01 | Dundas Nova Street | 20 |
| 2025-12-01 | Lakeview Avenue | 7 |
| 2025-12-01 | Forest Hill Avenue | 13 |
| 2025-12-01 | Front Street | 8 |
| 2025-12-01 | Bloor Nova Street | 10 |
| 2025-12-01 | Other | 9 |
| 2026-01-01 | Dundas Nova Street | 5 |
| 2026-01-01 | Lakeview Avenue | 4 |
| 2026-01-01 | Forest Hill Avenue | 3 |
| 2026-01-01 | Front Street | 3 |
| 2026-01-01 | Bloor Nova Street | 6 |
| 2026-01-01 | Other | 5 |
| 2026-02-01 | Dundas Nova Street | 1 |
| 2026-02-01 | Lakeview Avenue | 1 |
| 2026-02-01 | Forest Hill Avenue | 2 |
| 2026-02-01 | Front Street | 0 |
| 2026-02-01 | Bloor Nova Street | 1 |
| 2026-02-01 | Other | 1 |
| 2026-03-01 | Dundas Nova Street | 0 |
| 2026-03-01 | Lakeview Avenue | 1 |
| 2026-03-01 | Forest Hill Avenue | 0 |
| 2026-03-01 | Front Street | 1 |
| 2026-03-01 | Bloor Nova Street | 0 |
| 2026-03-01 | Other | 2 |
| 2026-04-01 | Dundas Nova Street | 1 |
| 2026-04-01 | Lakeview Avenue | 0 |
| 2026-04-01 | Forest Hill Avenue | 0 |
| 2026-04-01 | Front Street | 1 |
| 2026-04-01 | Bloor Nova Street | 1 |
| 2026-04-01 | Other | 2 |
| 2026-05-01 | Dundas Nova Street | 4 |
| 2026-05-01 | Lakeview Avenue | 4 |
| 2026-05-01 | Forest Hill Avenue | 4 |
| 2026-05-01 | Front Street | 2 |
| 2026-05-01 | Bloor Nova Street | 6 |
| 2026-05-01 | Other | 8 |
| 2026-06-01 | Dundas Nova Street | 15 |
| 2026-06-01 | Lakeview Avenue | 14 |
| 2026-06-01 | Forest Hill Avenue | 15 |
| 2026-06-01 | Front Street | 11 |
| 2026-06-01 | Bloor Nova Street | 7 |
| 2026-06-01 | Other | 7 |
| 2026-07-01 | Dundas Nova Street | 22 |
| 2026-07-01 | Lakeview Avenue | 19 |
| 2026-07-01 | Forest Hill Avenue | 18 |
| 2026-07-01 | Front Street | 6 |
| 2026-07-01 | Bloor Nova Street | 8 |
| 2026-07-01 | Other | 23 |
| 2026-08-01 | Dundas Nova Street | 33 |
| 2026-08-01 | Lakeview Avenue | 28 |
| 2026-08-01 | Forest Hill Avenue | 24 |
| 2026-08-01 | Front Street | 18 |
| 2026-08-01 | Bloor Nova Street | 21 |
| 2026-08-01 | Other | 26 |
| 2026-09-01 | Dundas Nova Street | 31 |
| 2026-09-01 | Lakeview Avenue | 38 |
| 2026-09-01 | Forest Hill Avenue | 26 |
| 2026-09-01 | Front Street | 18 |
| 2026-09-01 | Bloor Nova Street | 17 |
| 2026-09-01 | Other | 33 |
Figure 52. Find point clusters: Housing developments over time 105
| period | series | value |
|---|---|---|
| 2023-01-01 | False | 2 |
| 2023-01-01 | True | 0 |
| 2023-04-01 | False | 0 |
| 2023-04-01 | True | 0 |
| 2023-07-01 | False | 2 |
| 2023-07-01 | True | 0 |
| 2023-10-01 | False | 1 |
| 2023-10-01 | True | 0 |
| 2024-01-01 | False | 0 |
| 2024-01-01 | True | 0 |
| 2024-04-01 | False | 3 |
| 2024-04-01 | True | 0 |
| 2024-07-01 | False | 3 |
| 2024-07-01 | True | 0 |
| 2024-10-01 | False | 4 |
| 2024-10-01 | True | 0 |
| 2025-01-01 | False | 2 |
| 2025-01-01 | True | 0 |
| 2025-04-01 | False | 1 |
| 2025-04-01 | True | 1 |
| 2025-07-01 | False | 3 |
| 2025-07-01 | True | 0 |
| 2025-10-01 | False | 1 |
| 2025-10-01 | True | 0 |
| 2026-01-01 | False | 3 |
| 2026-01-01 | True | 0 |
| 2026-04-01 | False | 1 |
| 2026-04-01 | True | 1 |
| 2026-07-01 | False | 5 |
| 2026-07-01 | True | 0 |
| 2026-10-01 | False | 0 |
| 2026-10-01 | True | 0 |
| 2027-01-01 | False | 0 |
| 2027-01-01 | True | 0 |
| 2027-04-01 | False | 3 |
| 2027-04-01 | True | 0 |
| 2027-07-01 | False | 2 |
| 2027-07-01 | True | 0 |
| 2027-10-01 | False | 1 |
| 2027-10-01 | True | 1 |
Figure 53. Find point clusters: Student homes over time 106
| period | series | value |
|---|---|---|
| 2023-08-01 | True | 78 |
| 2023-08-01 | False | 25 |
| 2023-09-01 | True | 94 |
| 2023-09-01 | False | 27 |
| 2023-10-01 | True | 95 |
| 2023-10-01 | False | 35 |
| 2023-11-01 | True | 63 |
| 2023-11-01 | False | 22 |
| 2023-12-01 | True | 29 |
| 2023-12-01 | False | 20 |
| 2024-01-01 | True | 9 |
| 2024-01-01 | False | 4 |
| 2024-02-01 | True | 3 |
| 2024-02-01 | False | 0 |
| 2024-03-01 | True | 2 |
| 2024-03-01 | False | 1 |
| 2024-04-01 | True | 1 |
| 2024-04-01 | False | 1 |
| 2024-05-01 | True | 12 |
| 2024-05-01 | False | 6 |
| 2024-06-01 | True | 30 |
| 2024-06-01 | False | 18 |
| 2024-07-01 | True | 60 |
| 2024-07-01 | False | 29 |
| 2024-08-01 | True | 70 |
| 2024-08-01 | False | 42 |
| 2024-09-01 | True | 81 |
| 2024-09-01 | False | 53 |
| 2024-10-01 | True | 82 |
| 2024-10-01 | False | 50 |
| 2024-11-01 | True | 58 |
| 2024-11-01 | False | 23 |
| 2024-12-01 | True | 27 |
| 2024-12-01 | False | 23 |
| 2025-01-01 | True | 12 |
| 2025-01-01 | False | 13 |
| 2025-02-01 | True | 0 |
| 2025-02-01 | False | 0 |
| 2025-03-01 | True | 0 |
| 2025-03-01 | False | 0 |
| 2025-04-01 | True | 2 |
| 2025-04-01 | False | 1 |
| 2025-05-01 | True | 9 |
| 2025-05-01 | False | 10 |
| 2025-06-01 | True | 34 |
| 2025-06-01 | False | 30 |
| 2025-07-01 | True | 53 |
| 2025-07-01 | False | 47 |
| 2025-08-01 | True | 73 |
| 2025-08-01 | False | 63 |
| 2025-09-01 | True | 90 |
| 2025-09-01 | False | 59 |
| 2025-10-01 | True | 74 |
| 2025-10-01 | False | 52 |
| 2025-11-01 | True | 59 |
| 2025-11-01 | False | 32 |
| 2025-12-01 | True | 35 |
| 2025-12-01 | False | 32 |
| 2026-01-01 | True | 14 |
| 2026-01-01 | False | 12 |
| 2026-02-01 | True | 3 |
| 2026-02-01 | False | 3 |
| 2026-03-01 | True | 2 |
| 2026-03-01 | False | 2 |
| 2026-04-01 | True | 3 |
| 2026-04-01 | False | 2 |
| 2026-05-01 | True | 14 |
| 2026-05-01 | False | 14 |
| 2026-06-01 | True | 32 |
| 2026-06-01 | False | 37 |
| 2026-07-01 | True | 41 |
| 2026-07-01 | False | 55 |
| 2026-08-01 | True | 77 |
| 2026-08-01 | False | 73 |
| 2026-09-01 | True | 69 |
| 2026-09-01 | False | 94 |
Figure 54. Hot spot analysis: Housing developments over time 107
| period | series | value |
|---|---|---|
| 2023-01-01 | not_significant | 2 |
| 2023-01-01 | hot_90 | 0 |
| 2023-04-01 | not_significant | 0 |
| 2023-04-01 | hot_90 | 0 |
| 2023-07-01 | not_significant | 2 |
| 2023-07-01 | hot_90 | 0 |
| 2023-10-01 | not_significant | 1 |
| 2023-10-01 | hot_90 | 0 |
| 2024-01-01 | not_significant | 0 |
| 2024-01-01 | hot_90 | 0 |
| 2024-04-01 | not_significant | 3 |
| 2024-04-01 | hot_90 | 0 |
| 2024-07-01 | not_significant | 3 |
| 2024-07-01 | hot_90 | 0 |
| 2024-10-01 | not_significant | 4 |
| 2024-10-01 | hot_90 | 0 |
| 2025-01-01 | not_significant | 2 |
| 2025-01-01 | hot_90 | 0 |
| 2025-04-01 | not_significant | 1 |
| 2025-04-01 | hot_90 | 1 |
| 2025-07-01 | not_significant | 3 |
| 2025-07-01 | hot_90 | 0 |
| 2025-10-01 | not_significant | 1 |
| 2025-10-01 | hot_90 | 0 |
| 2026-01-01 | not_significant | 3 |
| 2026-01-01 | hot_90 | 0 |
| 2026-04-01 | not_significant | 1 |
| 2026-04-01 | hot_90 | 1 |
| 2026-07-01 | not_significant | 5 |
| 2026-07-01 | hot_90 | 0 |
| 2026-10-01 | not_significant | 0 |
| 2026-10-01 | hot_90 | 0 |
| 2027-01-01 | not_significant | 0 |
| 2027-01-01 | hot_90 | 0 |
| 2027-04-01 | not_significant | 3 |
| 2027-04-01 | hot_90 | 0 |
| 2027-07-01 | not_significant | 2 |
| 2027-07-01 | hot_90 | 0 |
| 2027-10-01 | not_significant | 2 |
| 2027-10-01 | hot_90 | 0 |
Figure 55. Repeat and near repeat classification: Student homes over time 108
| period | series | value |
|---|---|---|
| 2023-08-01 | isolated | 66 |
| 2023-08-01 | near_repeat | 15 |
| 2023-08-01 | originator | 22 |
| 2023-09-01 | isolated | 65 |
| 2023-09-01 | near_repeat | 33 |
| 2023-09-01 | originator | 23 |
| 2023-10-01 | isolated | 66 |
| 2023-10-01 | near_repeat | 36 |
| 2023-10-01 | originator | 28 |
| 2023-11-01 | isolated | 55 |
| 2023-11-01 | near_repeat | 24 |
| 2023-11-01 | originator | 6 |
| 2023-12-01 | isolated | 29 |
| 2023-12-01 | near_repeat | 18 |
| 2023-12-01 | originator | 2 |
| 2024-01-01 | isolated | 11 |
| 2024-01-01 | near_repeat | 2 |
| 2024-01-01 | originator | 0 |
| 2024-02-01 | isolated | 3 |
| 2024-02-01 | near_repeat | 0 |
| 2024-02-01 | originator | 0 |
| 2024-03-01 | isolated | 3 |
| 2024-03-01 | near_repeat | 0 |
| 2024-03-01 | originator | 0 |
| 2024-04-01 | isolated | 2 |
| 2024-04-01 | near_repeat | 0 |
| 2024-04-01 | originator | 0 |
| 2024-05-01 | isolated | 14 |
| 2024-05-01 | near_repeat | 1 |
| 2024-05-01 | originator | 3 |
| 2024-06-01 | isolated | 28 |
| 2024-06-01 | near_repeat | 10 |
| 2024-06-01 | originator | 10 |
| 2024-07-01 | isolated | 43 |
| 2024-07-01 | near_repeat | 27 |
| 2024-07-01 | originator | 19 |
| 2024-08-01 | isolated | 55 |
| 2024-08-01 | near_repeat | 35 |
| 2024-08-01 | originator | 22 |
| 2024-09-01 | isolated | 52 |
| 2024-09-01 | near_repeat | 59 |
| 2024-09-01 | originator | 23 |
| 2024-10-01 | isolated | 54 |
| 2024-10-01 | near_repeat | 51 |
| 2024-10-01 | originator | 27 |
| 2024-11-01 | isolated | 42 |
| 2024-11-01 | near_repeat | 32 |
| 2024-11-01 | originator | 7 |
| 2024-12-01 | isolated | 29 |
| 2024-12-01 | near_repeat | 13 |
| 2024-12-01 | originator | 8 |
| 2025-01-01 | isolated | 20 |
| 2025-01-01 | near_repeat | 4 |
| 2025-01-01 | originator | 1 |
| 2025-02-01 | isolated | 0 |
| 2025-02-01 | near_repeat | 0 |
| 2025-02-01 | originator | 0 |
| 2025-03-01 | isolated | 0 |
| 2025-03-01 | near_repeat | 0 |
| 2025-03-01 | originator | 0 |
| 2025-04-01 | isolated | 3 |
| 2025-04-01 | near_repeat | 0 |
| 2025-04-01 | originator | 0 |
| 2025-05-01 | isolated | 12 |
| 2025-05-01 | near_repeat | 2 |
| 2025-05-01 | originator | 5 |
| 2025-06-01 | isolated | 35 |
| 2025-06-01 | near_repeat | 14 |
| 2025-06-01 | originator | 15 |
| 2025-07-01 | isolated | 46 |
| 2025-07-01 | near_repeat | 35 |
| 2025-07-01 | originator | 19 |
| 2025-08-01 | isolated | 56 |
| 2025-08-01 | near_repeat | 51 |
| 2025-08-01 | originator | 29 |
| 2025-09-01 | isolated | 63 |
| 2025-09-01 | near_repeat | 67 |
| 2025-09-01 | originator | 19 |
| 2025-10-01 | isolated | 42 |
| 2025-10-01 | near_repeat | 65 |
| 2025-10-01 | originator | 19 |
| 2025-11-01 | isolated | 53 |
| 2025-11-01 | near_repeat | 30 |
| 2025-11-01 | originator | 8 |
| 2025-12-01 | isolated | 39 |
| 2025-12-01 | near_repeat | 21 |
| 2025-12-01 | originator | 7 |
| 2026-01-01 | isolated | 17 |
| 2026-01-01 | near_repeat | 8 |
| 2026-01-01 | originator | 1 |
| 2026-02-01 | isolated | 5 |
| 2026-02-01 | near_repeat | 1 |
| 2026-02-01 | originator | 0 |
| 2026-03-01 | isolated | 4 |
| 2026-03-01 | near_repeat | 0 |
| 2026-03-01 | originator | 0 |
| 2026-04-01 | isolated | 5 |
| 2026-04-01 | near_repeat | 0 |
| 2026-04-01 | originator | 0 |
| 2026-05-01 | isolated | 16 |
| 2026-05-01 | near_repeat | 4 |
| 2026-05-01 | originator | 8 |
| 2026-06-01 | isolated | 37 |
| 2026-06-01 | near_repeat | 17 |
| 2026-06-01 | originator | 15 |
| 2026-07-01 | isolated | 34 |
| 2026-07-01 | near_repeat | 49 |
| 2026-07-01 | originator | 13 |
| 2026-08-01 | isolated | 48 |
| 2026-08-01 | near_repeat | 77 |
| 2026-08-01 | originator | 25 |
| 2026-09-01 | isolated | 49 |
| 2026-09-01 | near_repeat | 99 |
| 2026-09-01 | originator | 15 |
GeoBit Large Spatial Model. Findings are labeled Evidenced (computed by a tool), Inferred (a reading or reasoning) or Unverified (no evidence yet).