Sample: Tourism and events, Barcelona: report
Project: Sample: Tourism and events, Barcelona
Goal: Describe the project Sample: Tourism and events, Barcelona: run the analyses that tell the most about its data, draw every result, and write a cited report.
Run: 31472d20-05f3-4c85-8dd4-6c9178c5f64a (running, 11 agent run(s))
Generated: 2026-10-18T05:55:27Z, version 1
Model cost: USD 0.0000 over 0 model call(s)
Data used
| Data | Kind | Rows | Time span | Summary | Source |
|---|---|---|---|---|---|
| Venues | vector, Point | 40 | 40 point features; 'kind' has 8 values (top: beach 5, stadium 5, market 5); 'capacity' 176 to 8,097 (mean 1090); named by 'name' (e.g. Beach La Estacion, Stadium Los Olivos, Market El Mercado); extent 2.1381,41.3693 to 2.2029,41.4077. Point locations of Venues by kind. | 69 | |
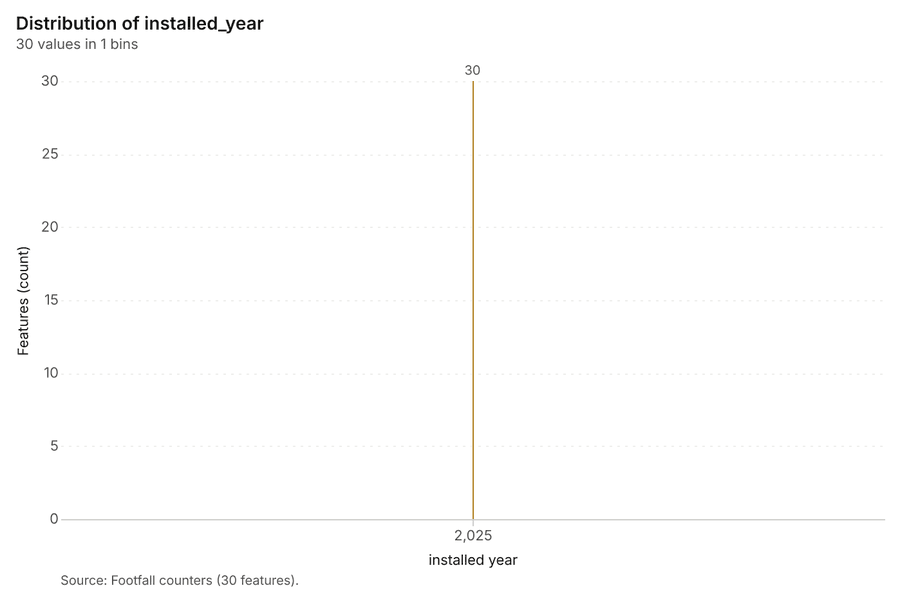
| Footfall counters | vector, Point | 30 | 30 point features; 'installed_year' 2,025 to 2,025 (mean 2025); named by 'name' (e.g. Footfall counter FC01, Footfall counter FC02, Footfall counter FC03); extent 2.1471,41.3678 to 2.1956,41.4005. Point locations of Footfall counters. | 70 | |
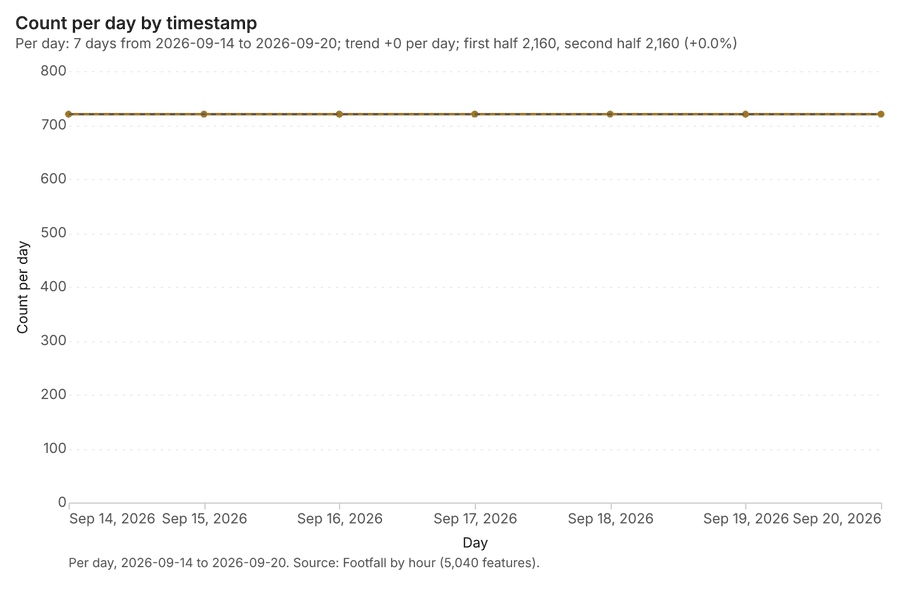
| Footfall by hour | table | 5,040 | 2026-09-14 to 2026-09-20 | Table of 5,040 rows and 3 columns without geometry; dated by 'timestamp' from 2026-09-14 to 2026-09-20; 'pedestrians' 9 to 8,318 (mean 766.5). A table of Footfall by hour without locations. | 2 |
| Visitor check-ins | vector, Point | 1,787 | 2026-08-01 to 2026-09-30 | 1,787 point features; dated by 'checked_in_at' from 2026-08-01 to 2026-09-30; 'visitor_origin' has 4 values (top: Americas 497, Asia 464, domestic 424); 'category' has 4 values (top: food 460, event 452, sightseeing 440); 'group_size' 1 to 4 (mean 2.144); extent 2.1351,41.3650 to 2.2048,41.4092. Dated point events by visitor_origin: where and when Visitor check-ins happen. | 3 |
| Hotels | vector, Point | 120 | 120 point features; 'stars' 2 to 5 (mean 3.408); 'rooms' 17 to 363 (mean 104.1); 'adr_eur' 71 to 510 (mean 173.1); extent 2.1363,41.3675 to 2.2041,41.4087. Point locations of Hotels. | 71 | |
| Districts | vector, Polygon | 10 | 10 polygon (area) features; 'residents' 13,872 to 162,538 (mean 6.674e+04); 'tourist_beds' 1,594 to 7,527 (mean 4832); named by 'name' (e.g. Valle Hondo, Puente Alto Sur, Las Torres); total area 25.97 km2; extent 2.1338,41.3642 to 2.2059,41.4098. Areas (Districts) with residents to compare and map. | 72 | |
| Transit stations | vector, Point | 25 | 25 point features; 'lines' 1 to 3 (mean 1.8); named by 'name' (e.g. Metro station La Fuente, Metro station Las Acacias, Metro station El Puerto Viejo); extent 2.1372,41.3652 to 2.2043,41.4051. Point locations of Transit stations. | 73 | |
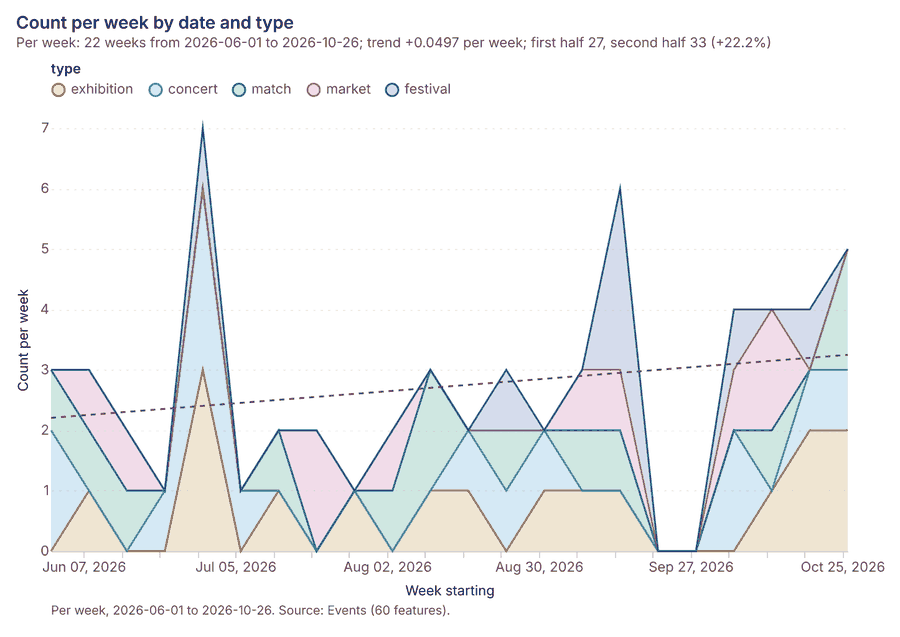
| Events | vector, Point | 60 | 2026-06-02 to 2026-10-31 | 60 point features; dated by 'date' from 2026-06-02 to 2026-10-31; 'type' has 5 values (top: exhibition 16, concert 14, match 13); 'expected_attendance' 397 to 17,281 (mean 3696); extent 2.1476,41.3713 to 2.2029,41.4047. Dated point events by type: where and when Events happen. | 4 |
| Short-term rentals | vector, Point | 359 | 359 point features; 'room_type' has 2 values (top: private room 196, entire home 163); 'licensed' has 2 values (top: True 198, False 161); 'nightly_eur' 44 to 363 (mean 125.7); extent 2.1359,41.3649 to 2.2041,41.4087. Point locations of Short-term rentals by room_type. | 74 | |
| Hotel occupancy by district and month | table | 120 | 2025-10-01 to 2026-09-01 | Table of 120 rows and 5 columns without geometry; dated by 'month' from 2025-10-01 to 2026-09-01; 'area_code' has 10 values (top: DT01 12, DT02 12, DT03 12); 'occupancy_pct' 41 to 97.3 (mean 69.54); 'adr_eur' 99 to 219 (mean 152.6); 'beds' 809 to 8,983 (mean 4657). A table of Hotel occupancy by district and month without locations. | 5 |
| Walking routes | vector, LineString | 7 | 7 line features; 'step_free' has 2 values (top: True 5, False 2); 'km' 0.92 to 4.93 (mean 3.107); named by 'name' (e.g. Walking route Gallery Bajo Rio to Market Los Pinos 2, Walking route Stadium La Loma to Market Los Sauces, Walking route Beach El Faro to Concert hall La Ribera); total length 21.75 km; extent 2.1350,41.3690 to 2.2026,41.4072. Lines (Walking routes) such as routes or networks. | 75 | |
| Event mobility plan | document | 1-page md document 'Event mobility plan: festival weekend 19 and 20 September'; language en; mentions 5 place(s): 41.37806, 2.17872 (1), Stadium Los Olivos (1), Stadium La Alameda (1), Footfall counter FC03 (1), Footfall (1). A document about 41.37806, 2.17872, Stadium Los Olivos, Stadium La Alameda. | 76 | ||
| Sample: Tourism and events, Barcelona | record | 77 | |||
| Events per 10,000 people by feature | layer, Polygon | 10 | 78 | ||
| Hotels per 10,000 people by feature | layer, Polygon | 10 | 79 | ||
| Hot spot analysis: Events | layer, Polygon | 21 | 80 | ||
| Hot spot analysis: Hotels | layer, Polygon | 35 | 81 | ||
| Emerging hot spots: Events | layer, Polygon | 12 | 82 | ||
| Emerging hot spots: Visitor check-ins | layer, Polygon | 247 | 83 | ||
| Calculate density: Events | layer, Polygon | 105 | 84 | ||
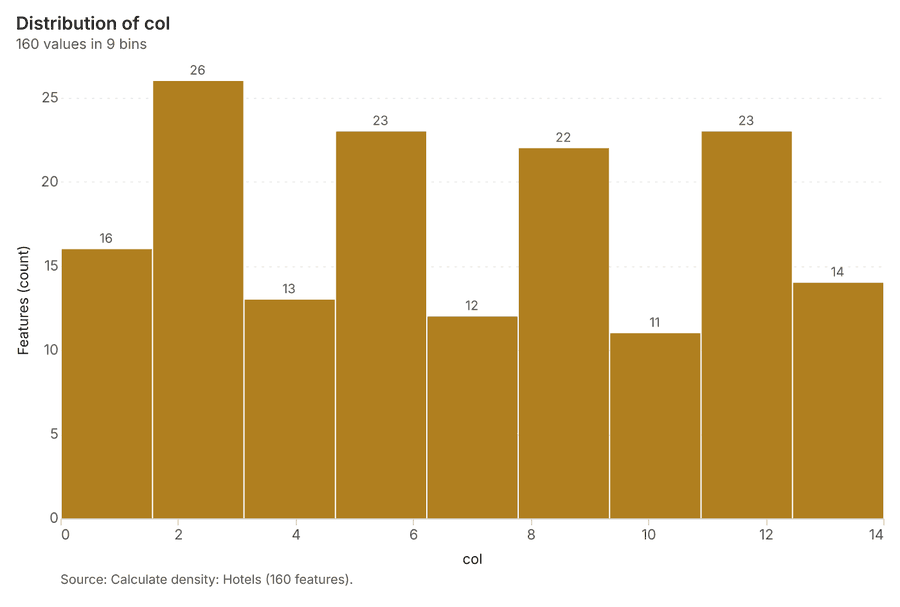
| Calculate density: Hotels | layer, Polygon | 160 | 85 | ||
| Transit stations per 10,000 people by feature | layer, Polygon | 10 | 86 | ||
| Hot spot analysis: Short-term rentals | layer, Polygon | 120 | 87 | ||
| Repeat and near repeat classification: Events | layer, Point | 60 | 88 | ||
| Calculate density: Transit stations | layer, Polygon | 60 | 89 |
Timeline
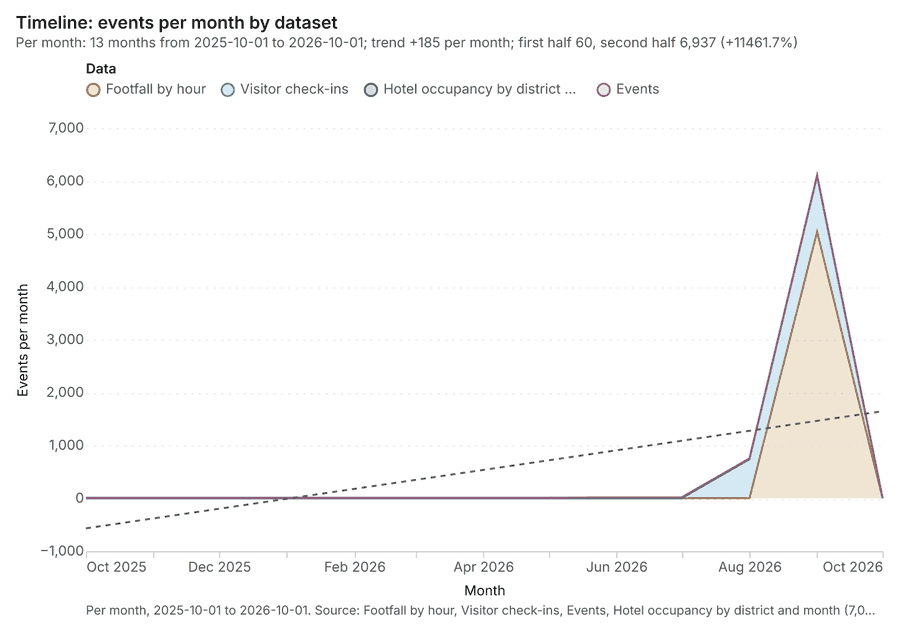
The timeline counts 7,007 dated events in Footfall by hour, Visitor check-ins, Events and 1 more per month, from October 2025 to October 2026 12345. By dataset: Footfall by hour 5,040; Visitor check-ins 1,787; Hotel occupancy by district and month 120; Events 60 1. The trend is +185 events per month; the second half of the months has 6,937 against 60 in the first (+11461.7%) 1.
Busiest months
Quietest months
Pipeline
What this analysis is. Pipeline: Run up to 20 GIS operations in one engine call; a step's params may use "$id" (an earlier step's result) or "$id.key", and layer references 6. Every step's map outputs are saved as styled layers 6.
Why it was run on this data. Districts holds population in 'residents': Events per 10,000 people in each feature compares features of different size; mapped as a choropleth (natural breaks, sequential colors) 7.
What it found. Pipeline on Events, Districts: Pipeline of 2 steps (summarize_within > calculate_field): 1 layer saved 8910. It reported result, count 10; result, elapsed ms 0; billing, cost 0.0215; billing, list price 0.0215; billing, upstream cost 0; list price 0.0215 8.
| Result | Value |
|---|---|
| result, count | 10 |
| result, elapsed ms | 0 |
| billing, cost | 0.0215 |
| billing, list price | 0.0215 |
| billing, upstream cost | 0 |
| list price | 0.0215 |
Findings
- Evidenced: Pipeline on Events, Districts: Pipeline of 2 steps (summarize_within > calculate_field): 1 layer saved 8910.
- Evidenced: It reported result, count 10; result, elapsed ms 0; billing, cost 0.0215; billing, list price 0.0215; billing, upstream cost 0; list price 0.0215 8.
*Tool gp_pipeline; parameters {"save": "final", "steps": [{"id": "counts", "params": {"features": {"layer": "Events (48b188aa)"}, "polygons": {"layer": "Districts (2a6df822)"}}, "operation": "summarize_within"}, {"id": "rate", "params": {"field": "rate_per_10k", "features": "$counts", "expression": "count * 10000 / residents"}, "operation": "calculate_field"}], "project": "7e086c07-eb20-44ad-b602-c5958e8ee13e", "output_name": *
Pipeline
What this analysis is. Pipeline: Run up to 20 GIS operations in one engine call; a step's params may use "$id" (an earlier step's result) or "$id.key", and layer references 6. Every step's map outputs are saved as styled layers 6.
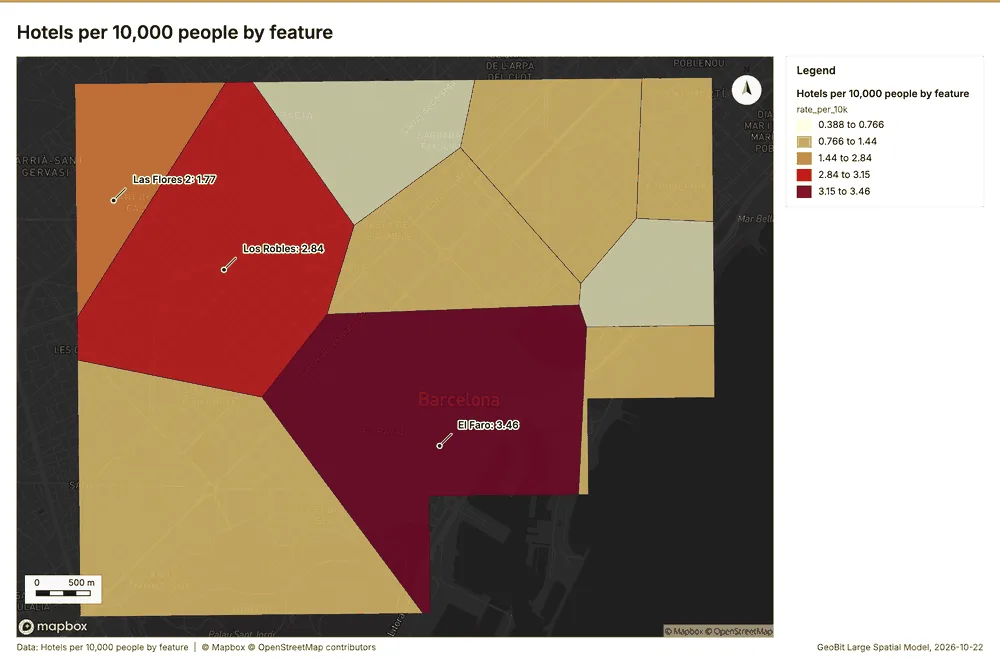
Why it was run on this data. Districts holds population in 'residents': Events per 10,000 people in each feature compares features of different size; mapped as a choropleth (natural breaks, sequential colors) 7.
What it found. Pipeline on Hotels, Districts: Pipeline of 2 steps (summarize_within > calculate_field): 1 layer saved 101112. It reported result, count 10; result, elapsed ms 0; billing, cost 0.0227; billing, list price 0.0227; billing, upstream cost 0; list price 0.0227 11.
| Result | Value |
|---|---|
| result, count | 10 |
| result, elapsed ms | 0 |
| billing, cost | 0.0227 |
| billing, list price | 0.0227 |
| billing, upstream cost | 0 |
| list price | 0.0227 |
Findings
- Evidenced: Pipeline on Hotels, Districts: Pipeline of 2 steps (summarize_within > calculate_field): 1 layer saved 101112.
- Evidenced: It reported result, count 10; result, elapsed ms 0; billing, cost 0.0227; billing, list price 0.0227; billing, upstream cost 0; list price 0.0227 11.
*Tool gp_pipeline; parameters {"save": "final", "steps": [{"id": "counts", "params": {"features": {"layer": "Hotels (3e8f4b82)"}, "polygons": {"layer": "Districts (2a6df822)"}}, "operation": "summarize_within"}, {"id": "rate", "params": {"field": "rate_per_10k", "features": "$counts", "expression": "count * 10000 / residents"}, "operation": "calculate_field"}], "project": "7e086c07-eb20-44ad-b602-c5958e8ee13e", "output_name": *
Hot spots
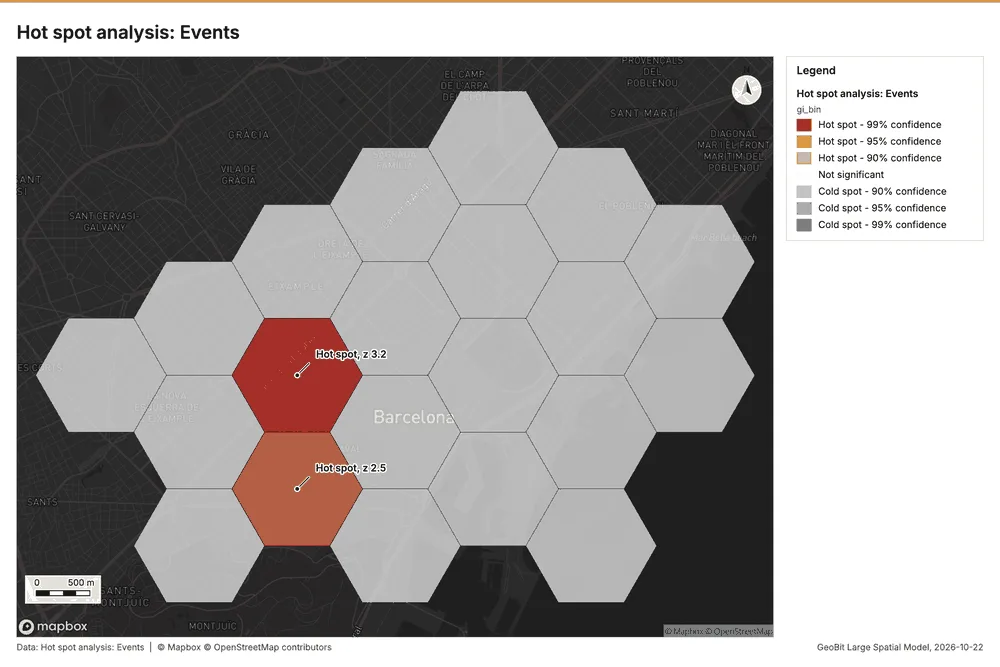
What this analysis is. Hot spot analysis: Getis-Ord Gi* hot and cold spots with z-scores, p-values and confidence bins 13. In ArcGIS it is Find Hot Spots or Hot Spot Analysis (Getis-Ord Gi*); in QGIS, qgis:hotspot (plugin) 13.
Why it was run on this data. 60 points: Getis-Ord Gi* tests whether the concentrations in Events are statistically significant 14.
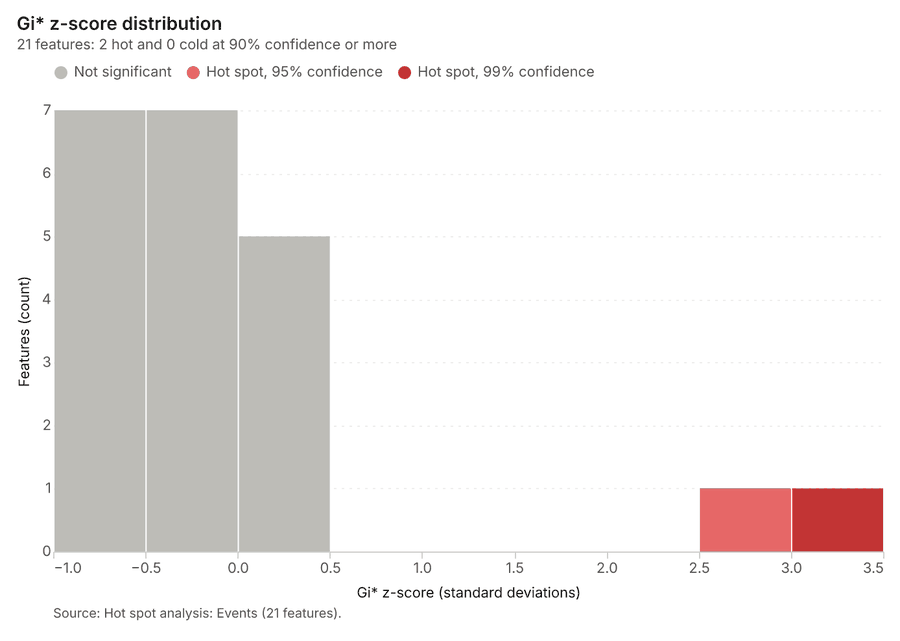
What it found. The hot spot analysis was run using the Events input layer 9, resulting in 1 layer saved labeled hot spot analysis: Events
| Result | Value |
|---|---|
| result, bins | 21 |
| result, count | 21 |
| result, elapsed ms | 2 |
| result, cell size m | 1,000 |
| result, incidents used | 60 |
| result, distance band m | 1,000 |
| billing, cost | 0.0512 |
| billing, list price | 0.0512 |
| billing, upstream cost | 0 |
Findings
- Evidenced: Hot spots on Events: Hot spot analysis: 1 layer saved: Hot spot analysis: Events (21 features) 915.
- Evidenced: It reported result, bins 21; result, count 21; result, elapsed ms 2; result, cell size m 1,000; result, incidents used 60; result, distance band m 1,000 15.
Tool gp_hot_spots; parameters {"project": "7e086c07-eb20-44ad-b602-c5958e8ee13e", "features": {"layer": "Events (48b188aa)"}, "aggregation": "hexagon", "cell_size_m": 1000.0, "distance_band_m": 1000.0}
Hot spots
What this analysis is. Hot spot analysis: Getis-Ord Gi* hot and cold spots with z-scores, p-values and confidence bins 13. In ArcGIS it is Find Hot Spots or Hot Spot Analysis (Getis-Ord Gi*); in QGIS, qgis:hotspot (plugin) 13.
Why it was run on this data. 120 points: Getis-Ord Gi* tests whether the concentrations in Hotels are statistically significant 16.
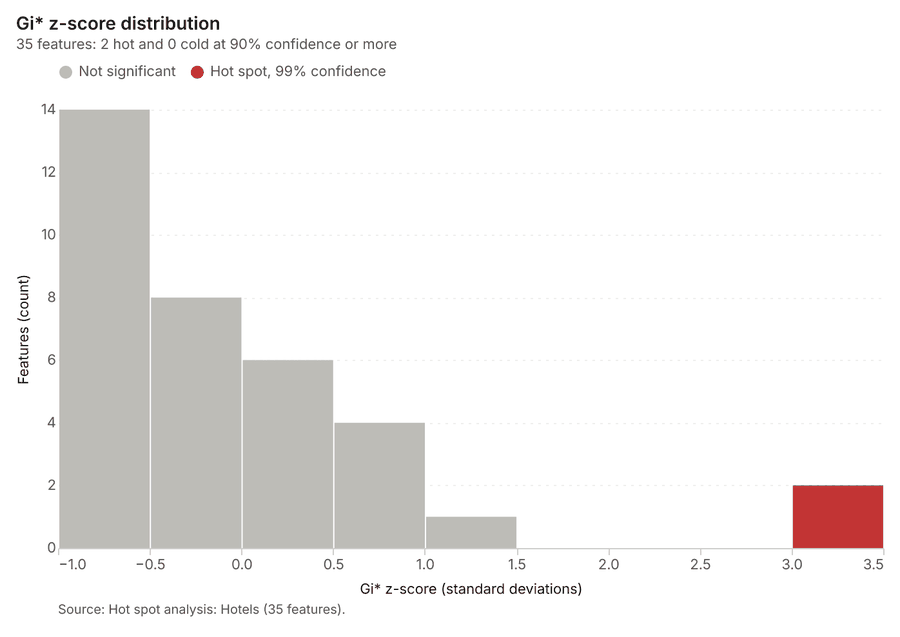
What it found. Hot spots on Hotels: Hot spot analysis: 1 layer saved: Hot spot analysis: Hotels (35 features) 1217. It reported result, bins 35; result, count 35; result, elapsed ms 3; result, cell size m 1,000; result, incidents used 120; result, distance band m 1,000 17.
| Result | Value |
|---|---|
| result, bins | 35 |
| result, count | 35 |
| result, elapsed ms | 3 |
| result, cell size m | 1,000 |
| result, incidents used | 120 |
| result, distance band m | 1,000 |
| billing, cost | 0.0524 |
| billing, list price | 0.0524 |
| billing, upstream cost | 0 |
Findings
- Evidenced: Hot spots on Hotels: Hot spot analysis: 1 layer saved: Hot spot analysis: Hotels (35 features) 1217.
- Evidenced: It reported result, bins 35; result, count 35; result, elapsed ms 3; result, cell size m 1,000; result, incidents used 120; result, distance band m 1,000 17.
A model draft was discarded because a sentence did not cite a source of this section.
Tool gp_hot_spots; parameters {"project": "7e086c07-eb20-44ad-b602-c5958e8ee13e", "features": {"layer": "Hotels (3e8f4b82)"}, "aggregation": "hexagon", "cell_size_m": 1000.0, "distance_band_m": 1000.0}
Space time hot spots
What this analysis is. Emerging hot spots: Where hot spots are new, consecutive, intensifying, persistent, diminishing, sporadic, oscillating or historical over time 18. In ArcGIS it is Emerging Hot Spot Analysis or Create Space Time Cube 18.
Why it was run on this data. Events carry dates in 'date': emerging hot spot analysis finds new, intensifying and fading hot spots per week 19.
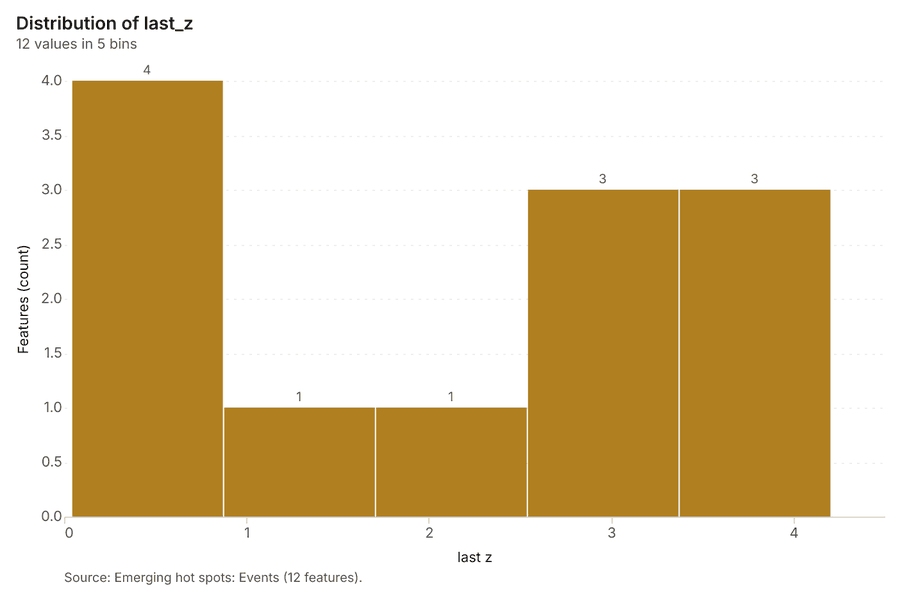
What it found. The analysis of events used a total of 60 features 20. This process identified 12 emerging hot spots, which were saved into a layer called Emerging hot spots: Events 20. Overall, the execution was efficient, taking only 2 elapsed milliseconds 20. The cost calculated for this analysis was 0.103 20.
| Result | Value |
|---|---|
| result, count | 12 |
| result, elapsed ms | 2 |
| result, resolution | 7 |
| result, features used | 60 |
| result, time neighbors | 0 |
| billing, cost | 0.103 |
| billing, list price | 0.103 |
| billing, upstream cost | 0 |
Findings
- Evidenced: Space time hot spots on Events: Emerging hot spots: 1 layer saved: Emerging hot spots: Events (12 features) 920.
- Evidenced: It reported result, count 12; result, elapsed ms 2; result, resolution 7; result, features used 60; result, time neighbors 0; billing, cost 0.103 20.
Tool gp_space_time_hot_spots; parameters {"project": "7e086c07-eb20-44ad-b602-c5958e8ee13e", "features": {"layer": "Events (48b188aa)"}, "interval": "week", "bin_shape": "h3", "resolution": 7, "time_field": "date"}
Space time hot spots
What this analysis is. Emerging hot spots: Where hot spots are new, consecutive, intensifying, persistent, diminishing, sporadic, oscillating or historical over time 18. In ArcGIS it is Emerging Hot Spot Analysis or Create Space Time Cube 18.
Why it was run on this data. Visitor check-ins carry dates in 'checked_in_at': emerging hot spot analysis finds new, intensifying and fading hot spots per week 21.
What it found. The gp_space_time_hot_spots tool was run using the Visitor check-ins dataset 23.
| Result | Value |
|---|---|
| result, count | 247 |
| result, elapsed ms | 25 |
| result, resolution | 9 |
| result, features used | 1,787 |
| result, time neighbors | 0 |
| billing, cost | 0.1893 |
| billing, list price | 0.1893 |
| billing, upstream cost | 0 |
Findings
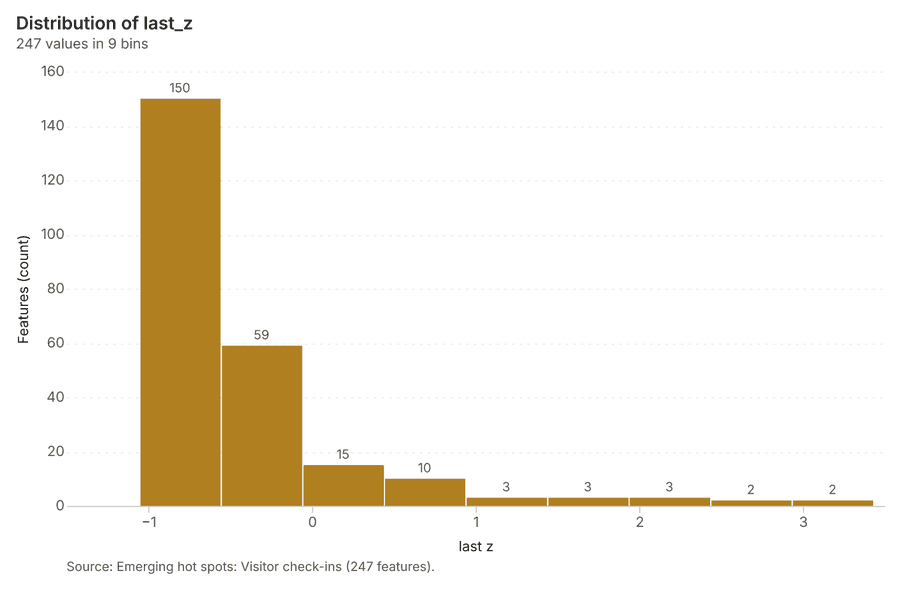
- Evidenced: Space time hot spots on Visitor check-ins: Emerging hot spots: 1 layer saved: Emerging hot spots: Visitor check-ins (247 features) 2223.
- Evidenced: It reported result, count 247; result, elapsed ms 25; result, resolution 9; result, features used 1,787; result, time neighbors 0; billing, cost 0.1893 22.
Tool gp_space_time_hot_spots; parameters {"project": "7e086c07-eb20-44ad-b602-c5958e8ee13e", "features": {"layer": "Visitor check-ins (517cd234)"}, "interval": "week", "bin_shape": "h3", "resolution": 9, "time_field": "checked_in_at"}
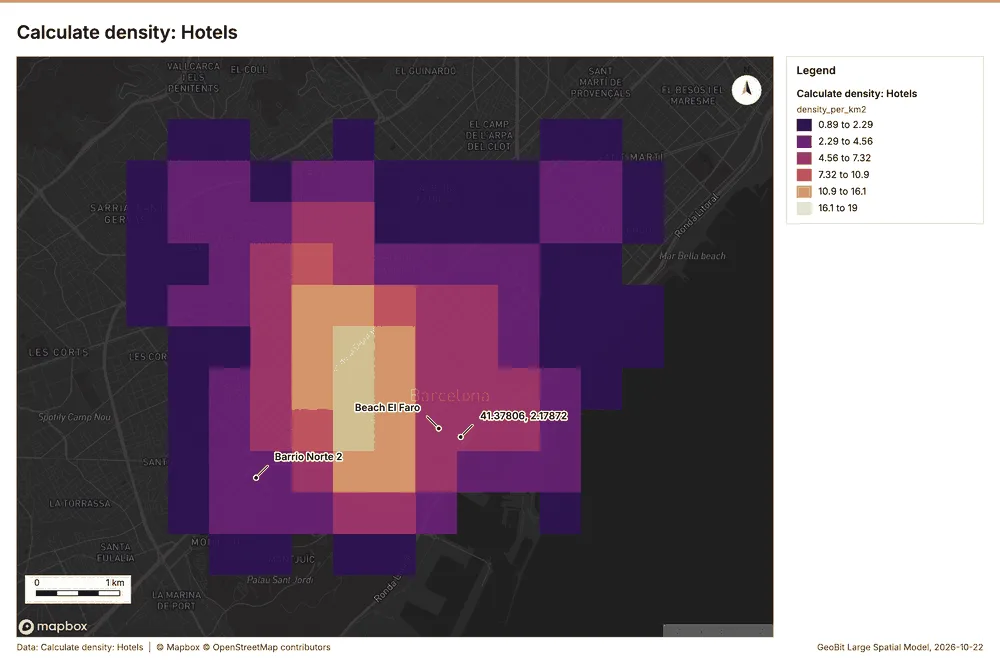
Calculate density
What this analysis is. Calculate density: Kernel density per square kilometer on a grid 24. In ArcGIS it is Calculate Density or Kernel Density; in QGIS, native:heatmapkerneldensityestimation 24.
Why it was run on this data. 60 points in Events: a density surface shows where they concentrate 25.
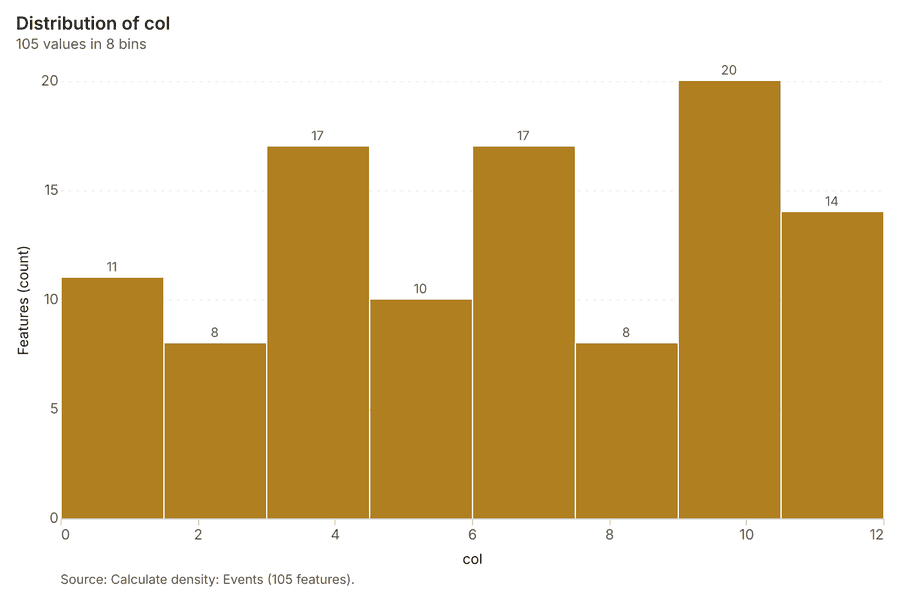
What it found. Calculate density on Events: Calculate density: 1 layer saved: Calculate density: Events (105 features) 926. It reported result, count 105; result, elapsed ms 3; result, bandwidth m 1,000; result, cell size m 500; result, excluded null 0; result, max density per km2 13.52 26.
| Result | Value |
|---|---|
| result, count | 105 |
| result, elapsed ms | 3 |
| result, bandwidth m | 1,000 |
| result, cell size m | 500 |
| result, excluded null | 0 |
| result, max density per km2 | 13.52 |
| billing, cost | 0.0512 |
| billing, list price | 0.0512 |
| billing, upstream cost | 0 |
Findings
- Evidenced: Calculate density on Events: Calculate density: 1 layer saved: Calculate density: Events (105 features) 926.
- Evidenced: It reported result, count 105; result, elapsed ms 3; result, bandwidth m 1,000; result, cell size m 500; result, excluded null 0; result, max density per km2 13.52 26.
Tool gp_calculate_density; parameters {"kernel": "quartic", "project": "7e086c07-eb20-44ad-b602-c5958e8ee13e", "features": {"layer": "Events (48b188aa)"}, "bandwidth_m": 1000.0, "cell_size_m": 500.0}
Calculate density
What this analysis is. Calculate density: Kernel density per square kilometer on a grid 24. In ArcGIS it is Calculate Density or Kernel Density; in QGIS, native:heatmapkerneldensityestimation 24.
Why it was run on this data. 120 points in Hotels: a density surface shows where they concentrate 27.
What it found. Calculate density on Hotels: Calculate density: 1 layer saved: Calculate density: Hotels (160 features) 1228. It reported result, count 160; result, elapsed ms 5; result, bandwidth m 1,000; result, cell size m 500; result, excluded null 0; result, max density per km2 19.04 28.
| Result | Value |
|---|---|
| result, count | 160 |
| result, elapsed ms | 5 |
| result, bandwidth m | 1,000 |
| result, cell size m | 500 |
| result, excluded null | 0 |
| result, max density per km2 | 19.04 |
| billing, cost | 0.0524 |
| billing, list price | 0.0524 |
| billing, upstream cost | 0 |
Findings
- Evidenced: Calculate density on Hotels: Calculate density: 1 layer saved: Calculate density: Hotels (160 features) 1228.
- Evidenced: It reported result, count 160; result, elapsed ms 5; result, bandwidth m 1,000; result, cell size m 500; result, excluded null 0; result, max density per km2 19.04 28.
Tool gp_calculate_density; parameters {"kernel": "quartic", "project": "7e086c07-eb20-44ad-b602-c5958e8ee13e", "features": {"layer": "Hotels (3e8f4b82)"}, "bandwidth_m": 1000.0, "cell_size_m": 500.0}
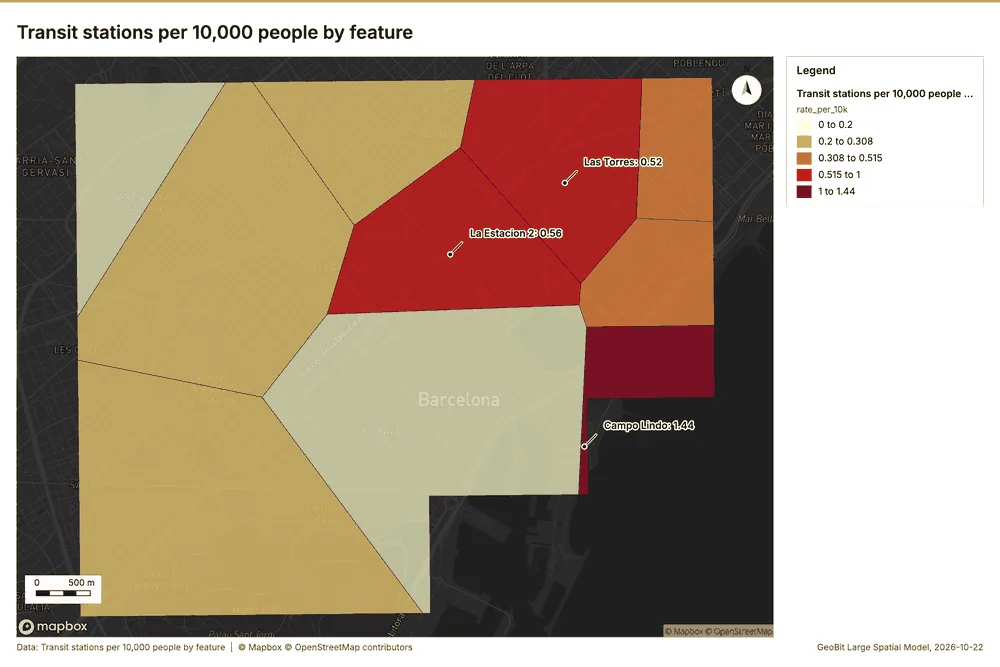
Pipeline
What this analysis is. Pipeline: Run up to 20 GIS operations in one engine call; a step's params may use "$id" (an earlier step's result) or "$id.key", and layer references 6. Every step's map outputs are saved as styled layers 6.
Why it was run on this data. Districts holds population in 'residents': Transit stations per 10,000 people in each feature compares features of different size; mapped as a choropleth (natural breaks, sequential colors) 29.
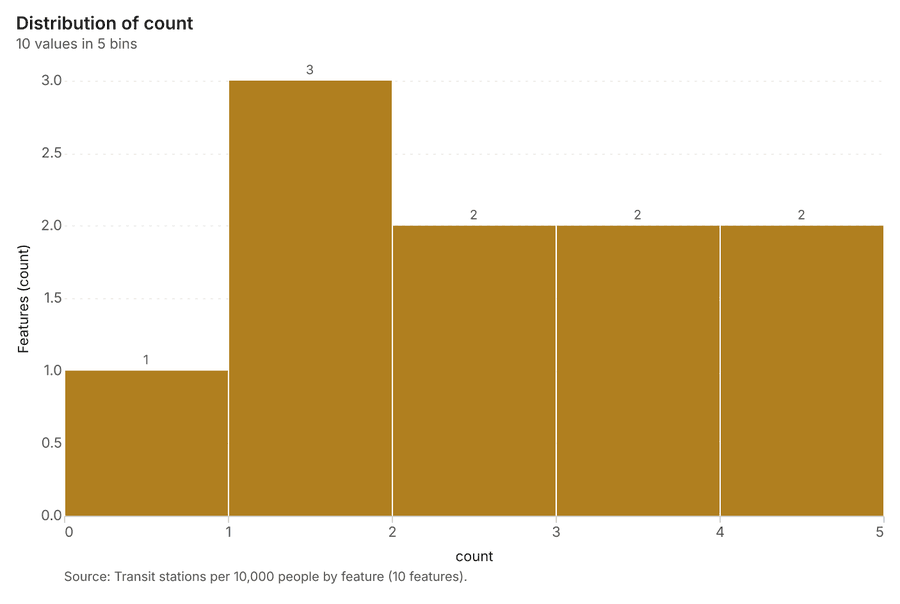
What it found. Pipeline on Transit stations, Districts: Pipeline of 2 steps (summarize_within > calculate_field): 1 layer saved 103031. It reported result, count 10; result, elapsed ms 0; billing, cost 0.0208; billing, list price 0.0208; billing, upstream cost 0; list price 0.0208 30.
| Result | Value |
|---|---|
| result, count | 10 |
| result, elapsed ms | 0 |
| billing, cost | 0.0208 |
| billing, list price | 0.0208 |
| billing, upstream cost | 0 |
| list price | 0.0208 |
Findings
- Evidenced: Pipeline on Transit stations, Districts: Pipeline of 2 steps (summarize_within > calculate_field): 1 layer saved 103031.
- Evidenced: It reported result, count 10; result, elapsed ms 0; billing, cost 0.0208; billing, list price 0.0208; billing, upstream cost 0; list price 0.0208 30.
Tool gp_pipeline; parameters {"save": "final", "steps": [{"id": "counts", "params": {"features": {"layer": "Transit stations (05c69c10)"}, "polygons": {"layer": "Districts (2a6df822)"}}, "operation": "summarize_within"}, {"id": "rate", "params": {"field": "rate_per_10k", "features": "$counts", "expression": "count * 10000 / residents"}, "operation": "calculate_field"}], "project": "7e086c07-eb20-44ad-b602-c5958e8ee13e", "outp
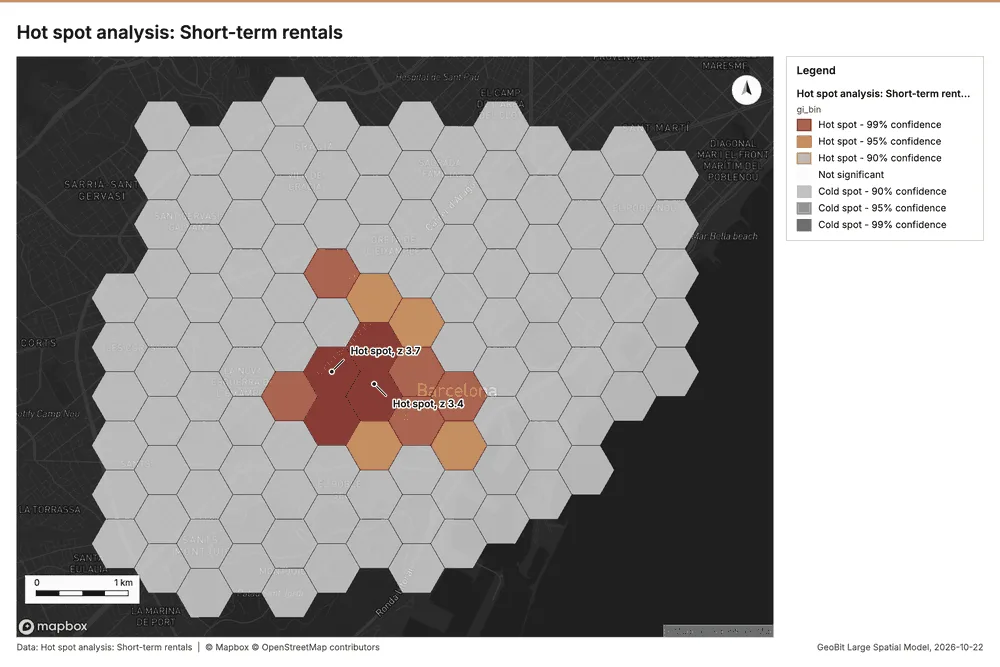
Hot spots
What this analysis is. Hot spot analysis: Getis-Ord Gi* hot and cold spots with z-scores, p-values and confidence bins 13. In ArcGIS it is Find Hot Spots or Hot Spot Analysis (Getis-Ord Gi*); in QGIS, qgis:hotspot (plugin) 13.
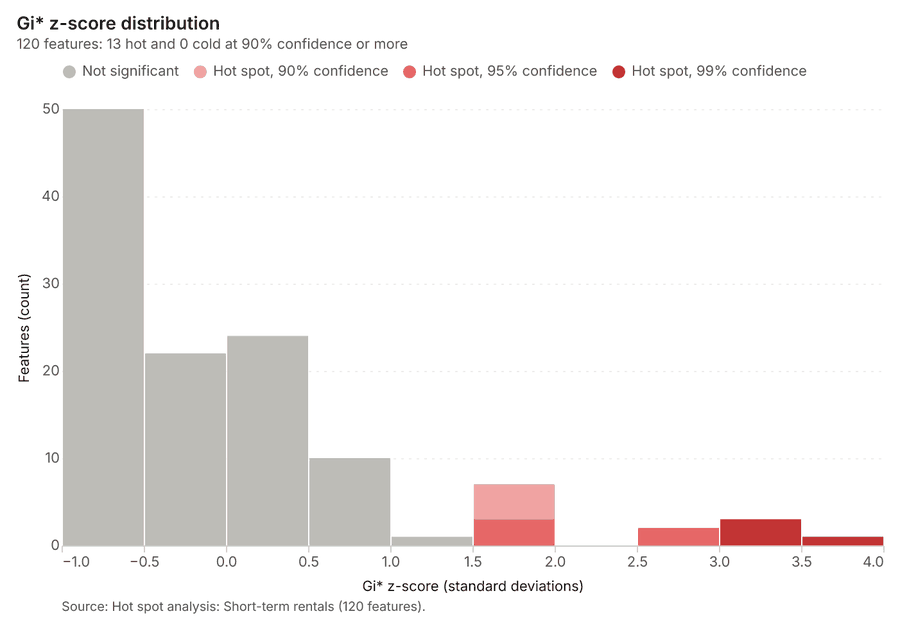
Why it was run on this data. 359 points: Getis-Ord Gi* tests whether the concentrations in Short-term rentals are statistically significant 32.
What it found. Hot spots on Short-term rentals: Hot spot analysis: 1 layer saved: Hot spot analysis: Short-term rentals (120 features) 3334. It reported result, bins 120; result, count 120; result, elapsed ms 6; result, cell size m 500; result, incidents used 359; result, distance band m 500 33.
| Result | Value |
|---|---|
| result, bins | 120 |
| result, count | 120 |
| result, elapsed ms | 6 |
| result, cell size m | 500 |
| result, incidents used | 359 |
| result, distance band m | 500 |
| billing, cost | 0.05718 |
| billing, list price | 0.05718 |
| billing, upstream cost | 0 |
Findings
- Evidenced: Hot spots on Short-term rentals: Hot spot analysis: 1 layer saved: Hot spot analysis: Short-term rentals (120 features) 3334.
- Evidenced: It reported result, bins 120; result, count 120; result, elapsed ms 6; result, cell size m 500; result, incidents used 359; result, distance band m 500 33.
Tool gp_hot_spots; parameters {"project": "7e086c07-eb20-44ad-b602-c5958e8ee13e", "features": {"layer": "Short-term rentals (cfe7bd58)"}, "aggregation": "hexagon", "cell_size_m": 500.0, "distance_band_m": 500.0}
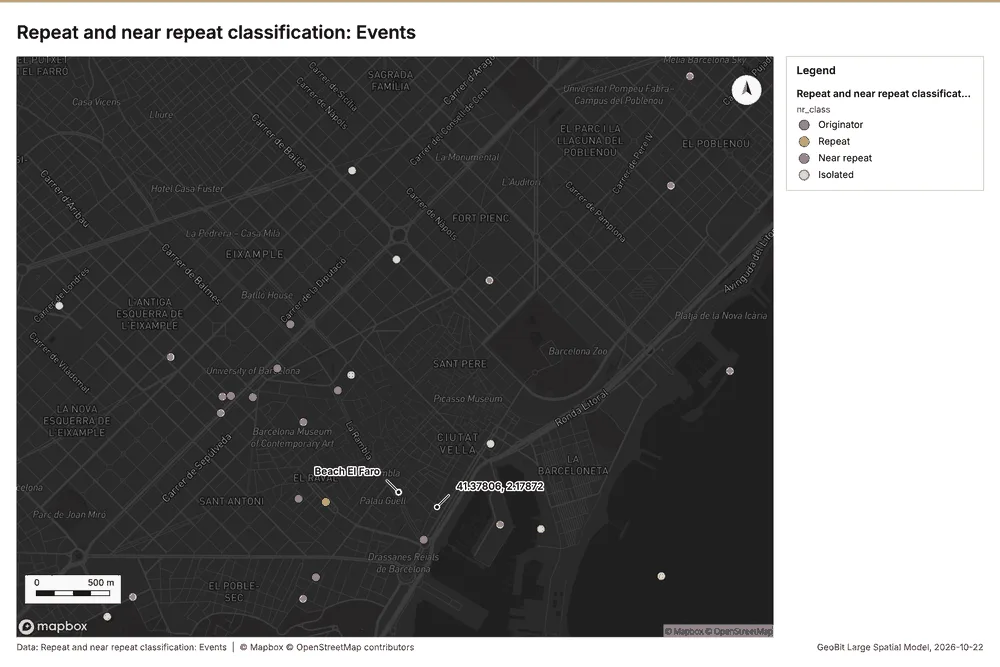
Near repeat
What this analysis is. Repeat and near repeat classification: Classify incidents as originators, repeats (same place) or near repeats within a distance and time window, with a Knox test table 35. In ArcGIS it is Repeat and Near Repeat Classification or Near Repeat Calculator 35.
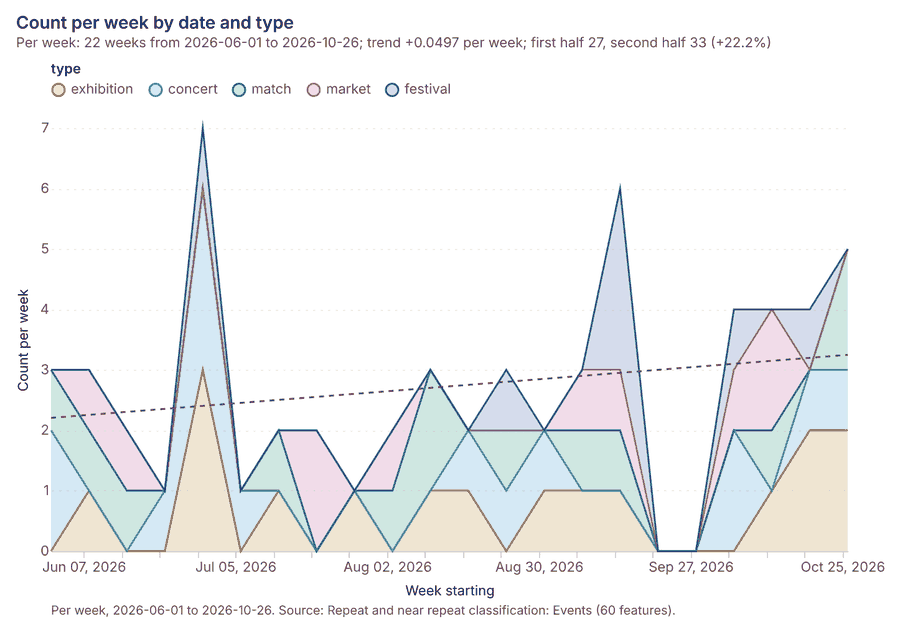
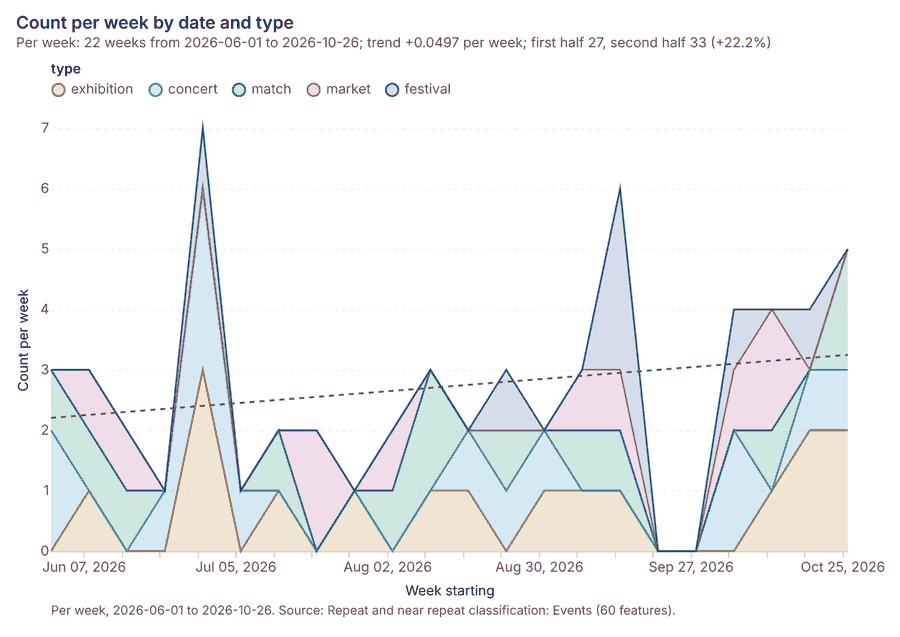
Why it was run on this data. Near repeat analysis tests whether Events close in space also follow each other within 15 days 36.
What it found. Near repeat on Events: Repeat and near repeat classification: 1 layer saved: Repeat and near repeat classification: Events (60 features) 937. It reported result, days 15; result, count 60; result, chains 12; result, distance m 500; result, elapsed ms 4; result, pairs linked 27 37.
| Result | Value |
|---|---|
| result, days | 15 |
| result, count | 60 |
| result, chains | 12 |
| result, distance m | 500 |
| result, elapsed ms | 4 |
| result, pairs linked | 27 |
| billing, cost | 0.0518 |
| billing, list price | 0.0518 |
| billing, upstream cost | 0 |
Findings
- Evidenced: Near repeat on Events: Repeat and near repeat classification: 1 layer saved: Repeat and near repeat classification: Events (60 features) 937.
- Evidenced: It reported result, days 15; result, count 60; result, chains 12; result, distance m 500; result, elapsed ms 4; result, pairs linked 27 37.
Tool gp_near_repeat; parameters {"days": 15, "project": "7e086c07-eb20-44ad-b602-c5958e8ee13e", "features": {"layer": "Events (48b188aa)"}, "distance_m": 500.0, "time_field": "date"}
Calculate density
What this analysis is. Calculate density: Kernel density per square kilometer on a grid 24. In ArcGIS it is Calculate Density or Kernel Density; in QGIS, native:heatmapkerneldensityestimation 24.
Why it was run on this data. 25 points in Transit stations: a density surface shows where they concentrate 38.
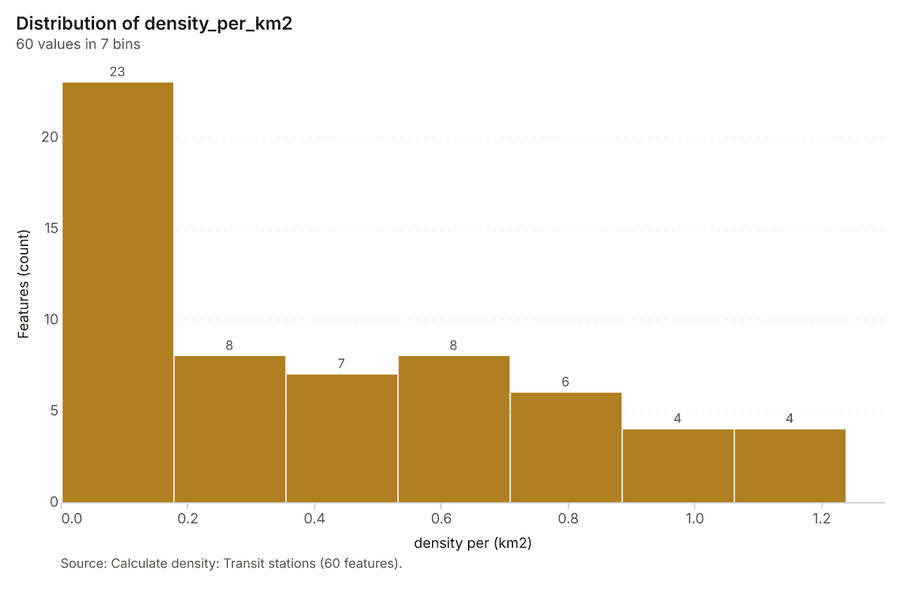
What it found. The density calculation was run on the Transit stations input 39. This process resulted in a count of 60 features, an elapsed time of 2 ms, and a bandwidth of 2,000 m 39. The analysis reported a maximum density per km2 of 1.239 39. The operational cost for the density calculation was 0.0505 39.
| Result | Value |
|---|---|
| result, count | 60 |
| result, elapsed ms | 2 |
| result, bandwidth m | 2,000 |
| result, cell size m | 1,000 |
| result, excluded null | 0 |
| result, max density per km2 | 1.239 |
| billing, cost | 0.0505 |
| billing, list price | 0.0505 |
| billing, upstream cost | 0 |
Findings
- Evidenced: Calculate density on Transit stations: Calculate density: 1 layer saved: Calculate density: Transit stations (60 features) 3139.
- Evidenced: It reported result, count 60; result, elapsed ms 2; result, bandwidth m 2,000; result, cell size m 1,000; result, excluded null 0; result, max density per km2 1.239 39.
Tool gp_calculate_density; parameters {"kernel": "quartic", "project": "7e086c07-eb20-44ad-b602-c5958e8ee13e", "features": {"layer": "Transit stations (05c69c10)"}, "bandwidth_m": 2000.0, "cell_size_m": 1000.0}
Maps and charts
The run also made 12 map image(s) 404142434445464748495051 and 17 chart(s) 5253545556575859606162636465666768.
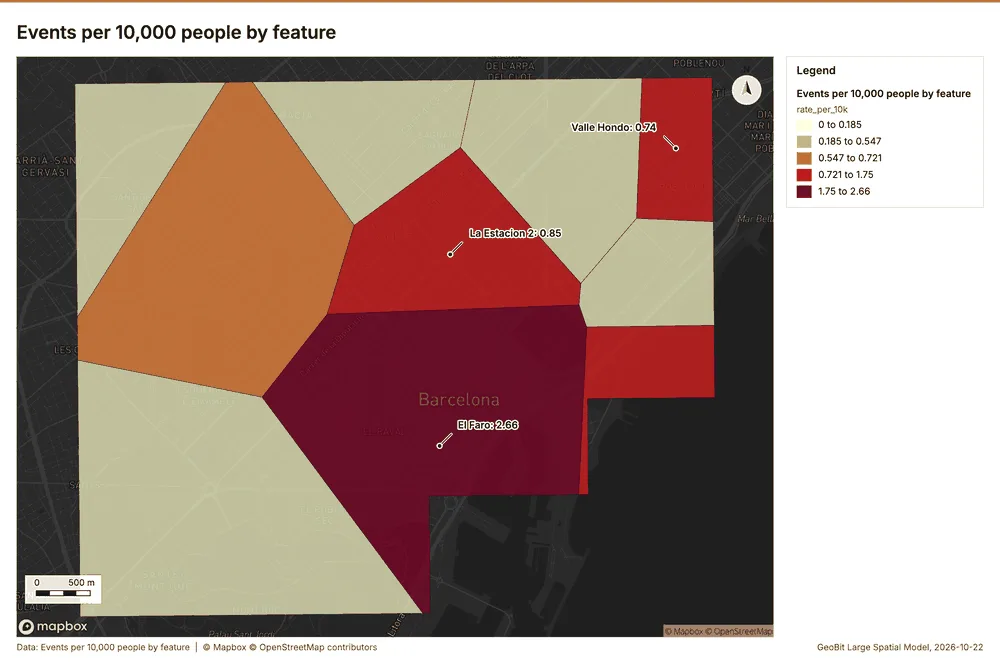
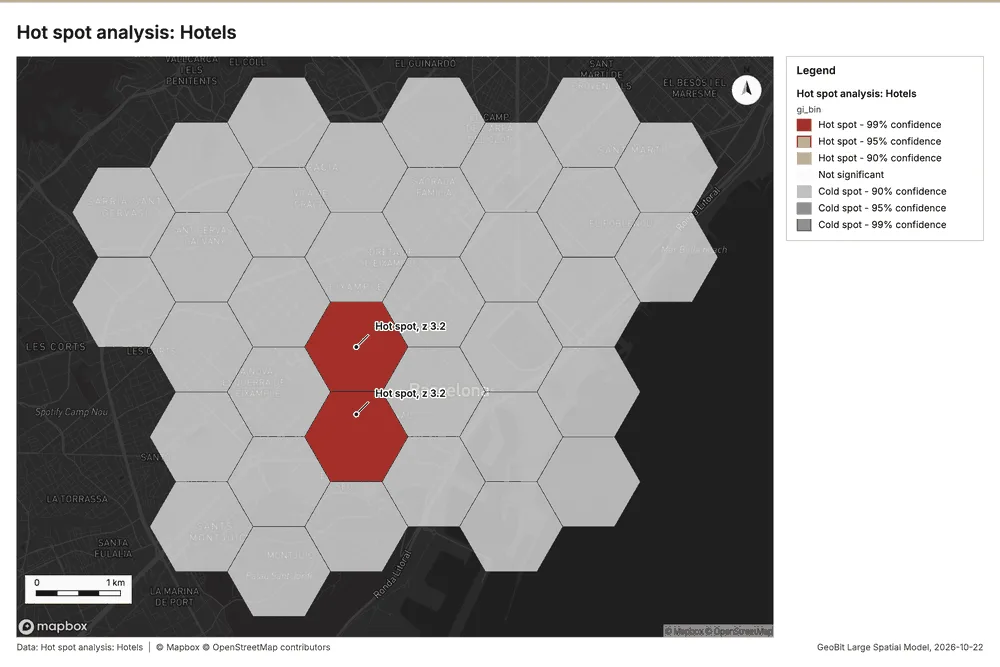
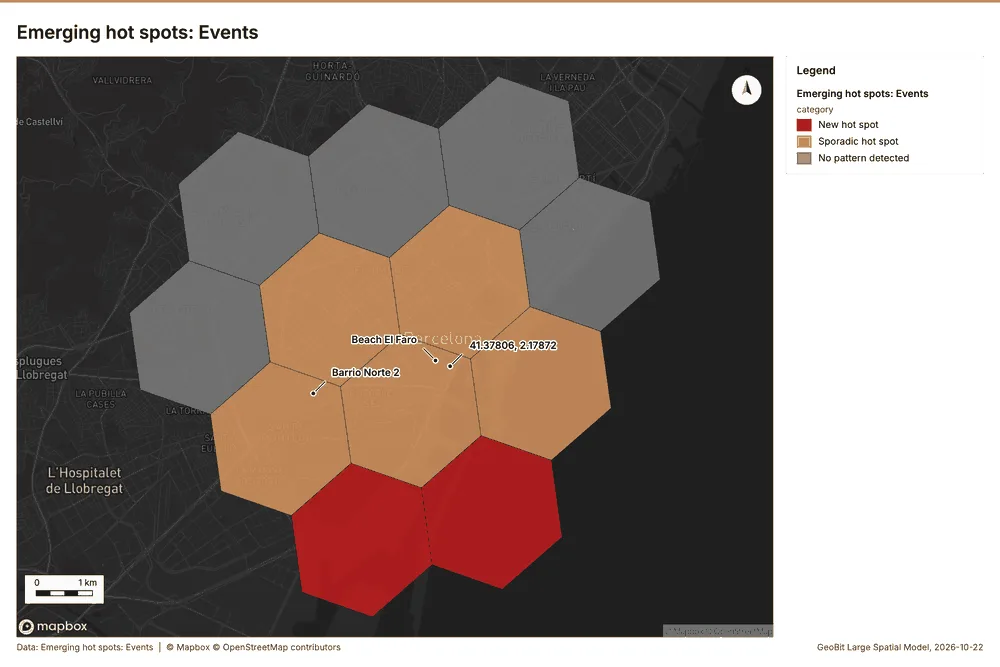
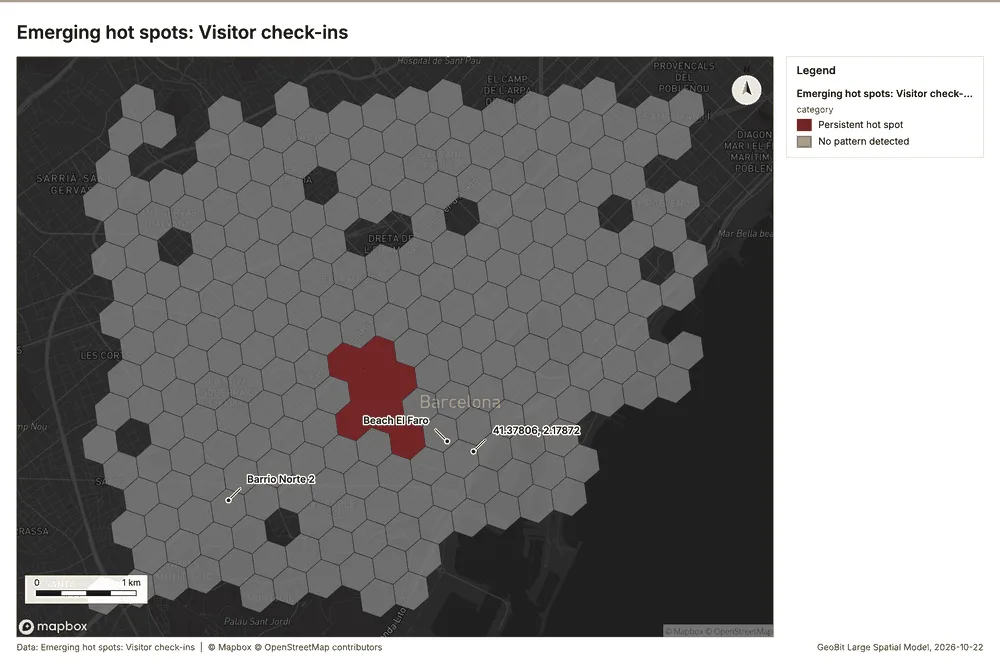
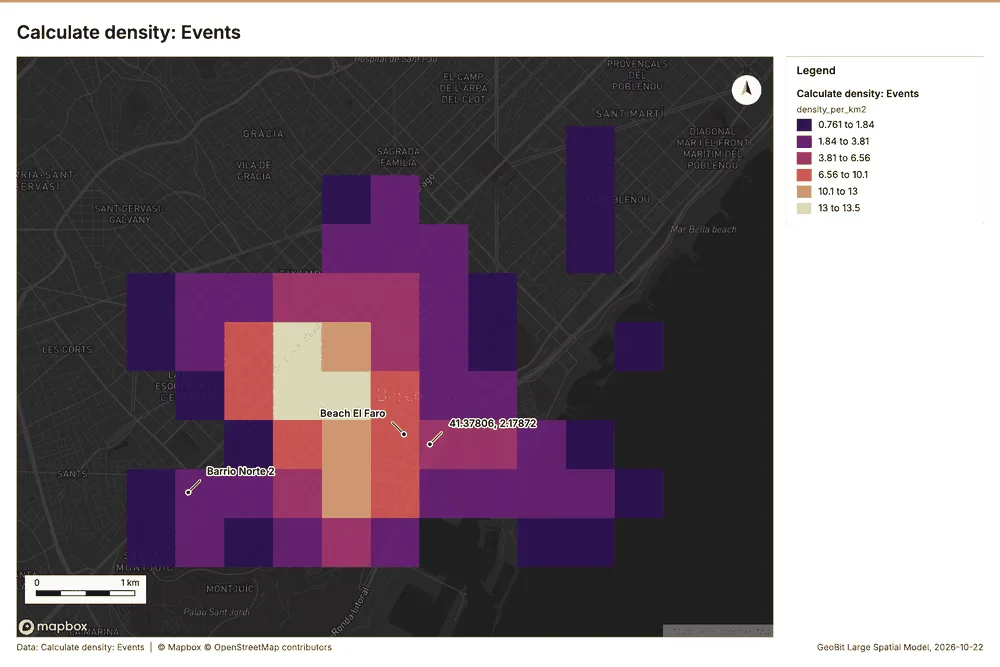
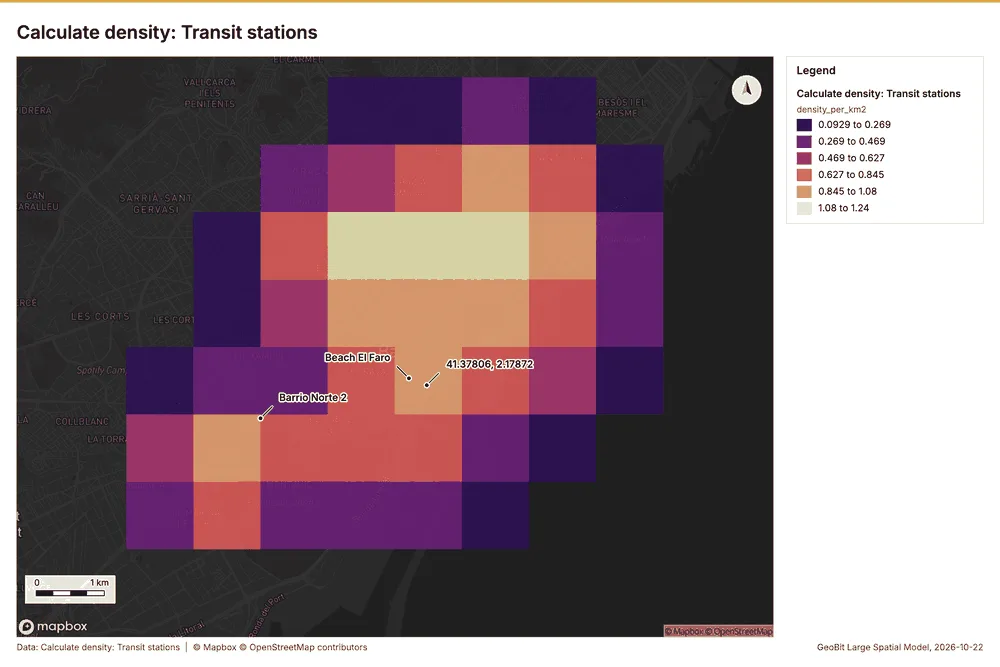
What the map shows. The map displays a 42
Inferred: read from the image by gemma4:e4b, not evidence.
Changes since the last run
This is the first report of this project.
Sources
- 1Rendering: Chart: Timeline: events per month by dataset. 52 rows id c28dd5e4-8e5d-4f58-bf01-ecf5befa059e
- 2Dataset: Footfall by hour. table, 5040 rows id 14c3f63e-f77c-42c5-915f-d9c05adec323
- 3Dataset: Visitor check-ins. vector, 1787 rows id c5304978-960d-40ec-bdc4-acd2ea178039
- 4Dataset: Events. vector, 60 rows id 19eebb1c-a097-45a3-b65f-454a721735ff
- 5Dataset: Hotel occupancy by district and month. table, 120 rows id ddefeb0f-7855-4d3a-bdbc-830daaef4145
- 6Catalog: Pipeline (tool description, gp_pipeline). Run up to 20 GIS operations in one engine call; a step's params may use "$id" (an earlier step's result) or "$id.key", and layer references. Every step's map outputs are saved as styled layers. Never calls Mapbox. id gp_pipeline
- 7Plan: Events per 10,000 people per feature of Districts (the Start plan's candidate c_fc66f1dd9ab5). Districts holds population in 'residents': Events per 10,000 people in each feature compares features of different size; mapped as a choropleth (natural breaks, sequential colors). id 0b51cb1d-362e-46b9-bce1-ee8d0334d0d1:c_fc66f1dd9ab5
- 8Tool result: gp_pipeline, step 0. Pipeline of 2 steps (summarize_within > calculate_field): 1 layer saved. id 6f508d4a-8ac6-43c5-a648-3a317b80b725:0
- 9Layer: Events. 60 features id 48b188aa-e96c-47fa-8a28-11e7d0d1265b
- 10Layer: Districts. 10 features id 2a6df822-dc6d-48ab-bb94-b4a34b363160
- 11Tool result: gp_pipeline, step 1. Pipeline of 2 steps (summarize_within > calculate_field): 1 layer saved. id 6f508d4a-8ac6-43c5-a648-3a317b80b725:1
- 12Layer: Hotels. 120 features id 3e8f4b82-1559-4b63-821d-9911e2fb57de
- 13Catalog: Hot spot analysis (operation catalog, gp_hot_spots). Getis-Ord Gi* hot and cold spots with z-scores, p-values and confidence bins. ArcGIS: Find Hot Spots, Hot Spot Analysis (Getis-Ord Gi*). QGIS: qgis:hotspot (plugin). id gp_hot_spots
- 14Plan: Hot spots of Events (the Start plan's candidate c_7a715b334a74). 60 points: Getis-Ord Gi* tests whether the concentrations in Events are statistically significant. id 0b51cb1d-362e-46b9-bce1-ee8d0334d0d1:c_7a715b334a74
- 15Tool result: gp_hot_spots, step 0. Hot spot analysis: 1 layer saved: Hot spot analysis: Events (21 features). id 84b08bee-0a26-46a8-aa31-3ab02a56479b:0
- 16Plan: Hot spots of Hotels (the Start plan's candidate c_79873e91203b). 120 points: Getis-Ord Gi* tests whether the concentrations in Hotels are statistically significant. id 0b51cb1d-362e-46b9-bce1-ee8d0334d0d1:c_79873e91203b
- 17Tool result: gp_hot_spots, step 1. Hot spot analysis: 1 layer saved: Hot spot analysis: Hotels (35 features). id 84b08bee-0a26-46a8-aa31-3ab02a56479b:1
- 18Catalog: Emerging hot spots (operation catalog, gp_space_time_hot_spots). Where hot spots are new, consecutive, intensifying, persistent, diminishing, sporadic, oscillating or historical over time. ArcGIS: Emerging Hot Spot Analysis, Create Space Time Cube. id gp_space_time_hot_spots
- 19Plan: Space time hot spots of Events (the Start plan's candidate c_8f286e9af1c8). Events carry dates in 'date': emerging hot spot analysis finds new, intensifying and fading hot spots per week. id 0b51cb1d-362e-46b9-bce1-ee8d0334d0d1:c_8f286e9af1c8
- 20Tool result: gp_space_time_hot_spots, step 0. Emerging hot spots: 1 layer saved: Emerging hot spots: Events (12 features). id eb49d63a-8c38-41f3-ab9c-5e8f86d9baac:0
- 21Plan: Space time hot spots of Visitor check-ins (the Start plan's candidate c_20af318bcde6). Visitor check-ins carry dates in 'checked_in_at': emerging hot spot analysis finds new, intensifying and fading hot spots per week. id 0b51cb1d-362e-46b9-bce1-ee8d0334d0d1:c_20af318bcde6
- 22Tool result: gp_space_time_hot_spots, step 1. Emerging hot spots: 1 layer saved: Emerging hot spots: Visitor check-ins (247 features). id eb49d63a-8c38-41f3-ab9c-5e8f86d9baac:1
- 23Layer: Visitor check-ins. 1,787 features id 517cd234-4309-4e40-a7fe-bfcb513649a0
- 24Catalog: Calculate density (operation catalog, gp_calculate_density). Kernel density per square kilometer on a grid. ArcGIS: Calculate Density, Kernel Density. QGIS: native:heatmapkerneldensityestimation. id gp_calculate_density
- 25Plan: Kernel density of Events (the Start plan's candidate c_cf6f233cf11a). 60 points in Events: a density surface shows where they concentrate. id 0b51cb1d-362e-46b9-bce1-ee8d0334d0d1:c_cf6f233cf11a
- 26Tool result: gp_calculate_density, step 0. Calculate density: 1 layer saved: Calculate density: Events (105 features). id ffcce236-4ccf-4454-afd4-62fde6826f22:0
- 27Plan: Kernel density of Hotels (the Start plan's candidate c_f2a0da30a906). 120 points in Hotels: a density surface shows where they concentrate. id 0b51cb1d-362e-46b9-bce1-ee8d0334d0d1:c_f2a0da30a906
- 28Tool result: gp_calculate_density, step 1. Calculate density: 1 layer saved: Calculate density: Hotels (160 features). id ffcce236-4ccf-4454-afd4-62fde6826f22:1
- 29Plan: Transit stations per 10,000 people per feature of Districts (the Start plan's candidate c_058536b42c97). Districts holds population in 'residents': Transit stations per 10,000 people in each feature compares features of different size; mapped as a choropleth (natural breaks, sequential colors). id 0b51cb1d-362e-46b9-bce1-ee8d0334d0d1:c_058536b42c97
- 30Tool result: gp_pipeline, step 0. Pipeline of 2 steps (summarize_within > calculate_field): 1 layer saved. id dd7063d1-b363-4d94-9eb7-b0637b02bd44:0
- 31Layer: Transit stations. 25 features id 05c69c10-6b81-4264-aa80-dccc82f1a9c9
- 32Plan: Hot spots of Short-term rentals (the Start plan's candidate c_c8350b01ed0d). 359 points: Getis-Ord Gi* tests whether the concentrations in Short-term rentals are statistically significant. id 0b51cb1d-362e-46b9-bce1-ee8d0334d0d1:c_c8350b01ed0d
- 33Tool result: gp_hot_spots, step 0. Hot spot analysis: 1 layer saved: Hot spot analysis: Short-term rentals (120 features). id 90ed7ab8-143b-43f0-876d-def245599177:0
- 34Layer: Short-term rentals. 359 features id cfe7bd58-22ce-4b7e-9b85-2abc3992354a
- 35Catalog: Repeat and near repeat classification (operation catalog, gp_near_repeat). Classify incidents as originators, repeats (same place) or near repeats within a distance and time window, with a Knox test table. ArcGIS: Repeat and Near Repeat Classification, Near Repeat Calculator. id gp_near_repeat
- 36Plan: Near repeat of Events (the Start plan's candidate c_f620f1a254d2). Near repeat analysis tests whether Events close in space also follow each other within 15 days. id 0b51cb1d-362e-46b9-bce1-ee8d0334d0d1:c_f620f1a254d2
- 37Tool result: gp_near_repeat, step 0. Repeat and near repeat classification: 1 layer saved: Repeat and near repeat classification: Events (60 features). id 70382b8c-45cd-4cea-8ff2-7b23d4ff890a:0
- 38Plan: Kernel density of Transit stations (the Start plan's candidate c_f08aaf8201f4). 25 points in Transit stations: a density surface shows where they concentrate. id 0b51cb1d-362e-46b9-bce1-ee8d0334d0d1:c_f08aaf8201f4
- 39Tool result: gp_calculate_density, step 0. Calculate density: 1 layer saved: Calculate density: Transit stations (60 features). id 2052a837-292a-4b03-bff0-c4b2801afc2e:0
- 40Rendering: Map: Events per 10,000 people by feature id eec57722-0ad2-4980-8930-376540984ea4
- 41Rendering: Map: Hotels per 10,000 people by feature id 63d6732e-910d-4395-a217-5bcea906df8f
- 42Rendering: Map: Hot spot analysis: Events id 54872c4e-d24c-440f-8d17-ea1b17fedf7a
- 43Rendering: Map: Hot spot analysis: Hotels id 0332ec77-f165-48dd-8f8b-f78eca70bd2e
- 44Rendering: Map: Emerging hot spots: Events id a797e3a3-c203-46a0-adee-6ae0c49df6f7
- 45Rendering: Map: Emerging hot spots: Visitor check-ins id c742998e-376d-4428-9cd8-ee43aff334d8
- 46Rendering: Map: Calculate density: Events id c4858508-5b9c-4244-9da4-22c00b167e7d
- 47Rendering: Map: Calculate density: Hotels id f95cc319-e8fc-4b4d-b94c-0f32f5d881ba
- 48Rendering: Map: Transit stations per 10,000 people by feature id 490f3ebb-c4cf-4df7-a6b0-8a2608c0ce37
- 49Rendering: Map: Hot spot analysis: Short-term rentals id 5f63f0eb-e874-46e7-9c16-5195d066b68e
- 50Rendering: Map: Repeat and near repeat classification: Events id 6ead692c-c1bf-41c9-b506-1b85a1e7c4e7
- 51Rendering: Map: Calculate density: Transit stations id 9c9b72cd-660b-4431-a878-d8ce46aa23b5
- 52Rendering: Chart: Footfall counters over time (installed_year). 1 rows id c57481bf-4a67-476a-8f46-50e95ee01d34
- 53Rendering: Chart: Footfall by hour over time (timestamp). 7 rows id 68fde6c5-f7cb-4519-beb5-fda2f50b9446
- 54Rendering: Chart: Events over time (date). 110 rows id 7d7c5e9a-3392-4fe8-abd9-3e23dce93372
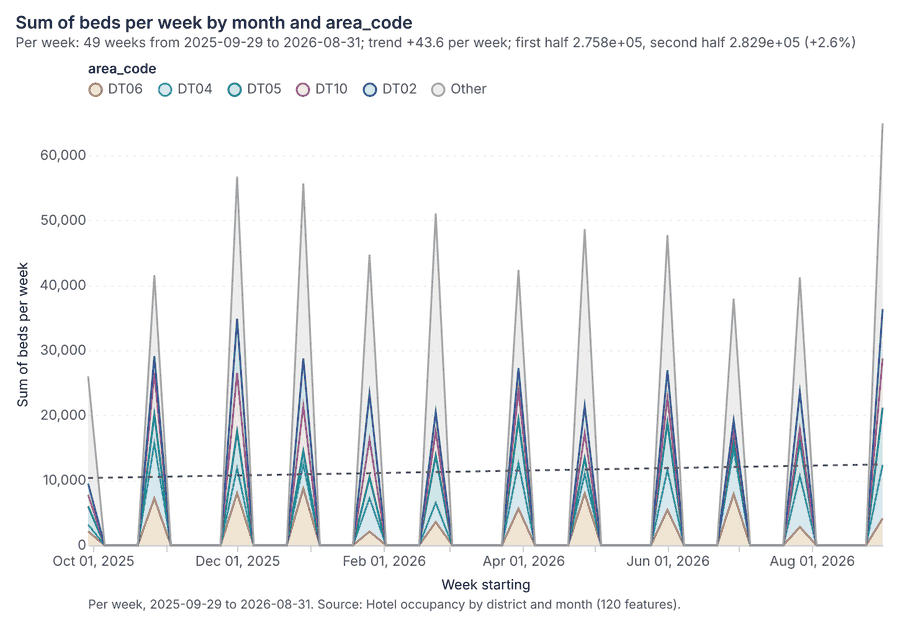
- 55Rendering: Chart: Hotel occupancy by district and month over time (month). 294 rows id 16057d40-3ace-4329-a918-0640eb5a26c4
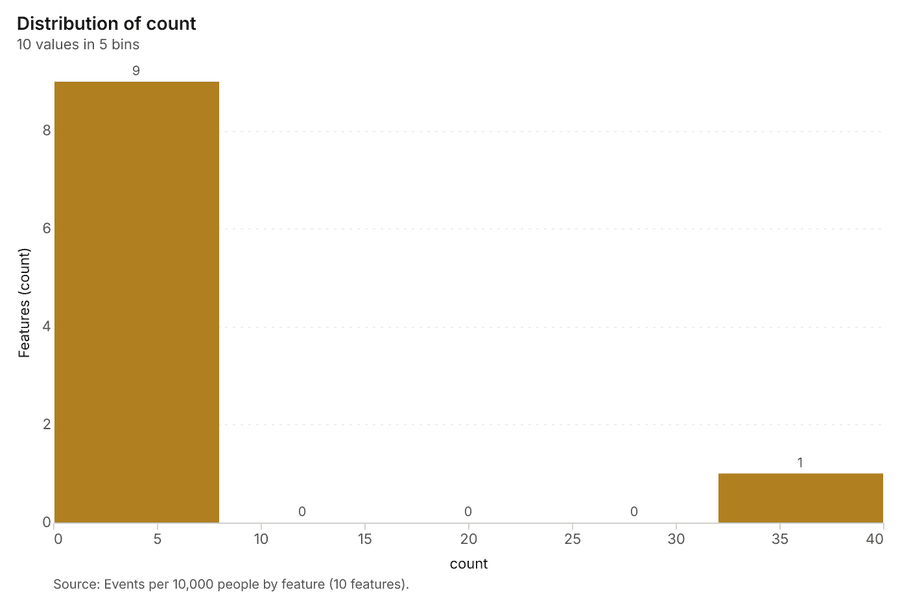
- 56Rendering: Chart: Events per 10,000 people by feature. 5 rows id 4b2b3fe6-a4cc-4a5a-8f99-df4cfc48d3db
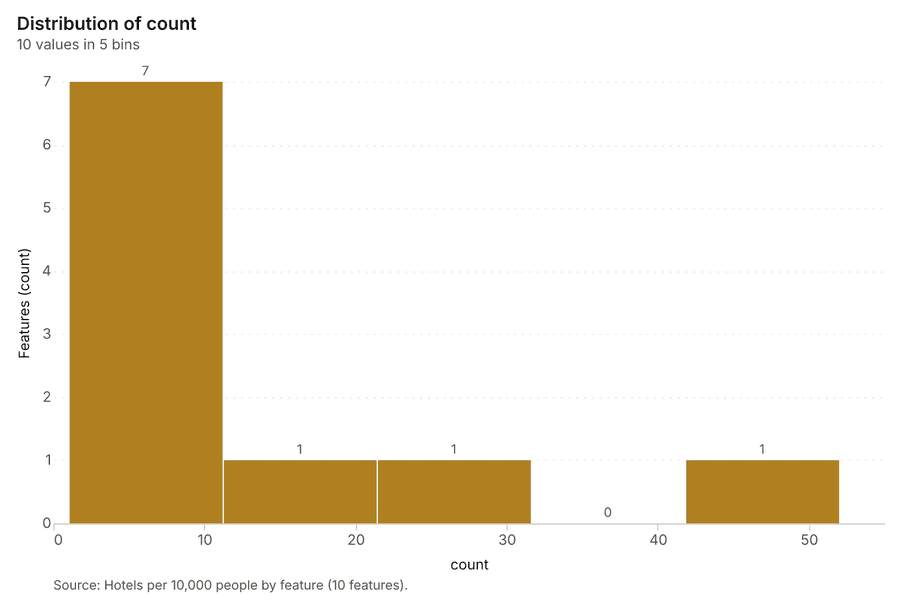
- 57Rendering: Chart: Hotels per 10,000 people by feature. 5 rows id a4fb08df-9753-4dfe-ae78-a53901591524
- 58Rendering: Chart: Hot spot analysis: Events. 5 rows id df76ff7e-00ff-4fc6-b41d-5534968aa408
- 59Rendering: Chart: Hot spot analysis: Hotels. 6 rows id 49c30dd2-4afd-47ce-9cab-fd5b09afd3e2
- 60Rendering: Chart: Emerging hot spots: Events. 5 rows id b15107ab-80aa-4641-95b1-be5375aa81e8
- 61Rendering: Chart: Emerging hot spots: Visitor check-ins. 9 rows id c4087574-f496-4825-92c9-f13d8ca99c72
- 62Rendering: Chart: Calculate density: Events. 8 rows id cd478e87-79f0-4685-a84f-ef9250389ac5
- 63Rendering: Chart: Calculate density: Hotels. 9 rows id 01e6882d-fc1c-41fe-b9f0-d4c083f8ce50
- 64Rendering: Chart: Transit stations per 10,000 people by feature. 5 rows id 4bfbc9fc-df18-4c54-a1e1-dc5127040af0
- 65Rendering: Chart: Hot spot analysis: Short-term rentals. 10 rows id c2f2f8d1-b71f-40d0-96d6-7cd46f9331df
- 66Rendering: Chart: Repeat and near repeat classification: Events. 110 rows id ae906476-4bb5-48f7-b8ac-00ca31455f0b
- 67Rendering: Chart: Calculate density: Transit stations. 7 rows id d67b5707-4e19-4aa1-9943-011622237776
- 68Rendering: Chart: Repeat and near repeat classification: Events over time. 110 rows id 2885d2a0-a6c2-4e19-8f57-418823738ddf
- 69Dataset: Venues. vector, 40 rows id fc2cd39e-1054-4c59-b6b6-a2f324d6bb3e
- 70Dataset: Footfall counters. vector, 30 rows id e0df87f0-4ea0-4648-bcf4-e339d9dd7a09
- 71Dataset: Hotels. vector, 120 rows id 9b34f752-20f9-4be7-a9c5-ca3e89bf6438
- 72Dataset: Districts. vector, 10 rows id 3113aeda-04c2-4be2-9eb4-1141e74fcf1d
- 73Dataset: Transit stations. vector, 25 rows id a1a99e8d-74be-4d47-b8fc-3d2bc032a85e
- 74Dataset: Short-term rentals. vector, 359 rows id bc26f941-1554-4b84-858e-db36a81426a5
- 75Dataset: Walking routes. vector, 7 rows id 9c7a2aa2-432b-4ee7-8b1e-0b0bddcece5a
- 76Dataset: Event mobility plan. document, ? rows id 552eef78-c8b9-412e-9863-a10cdaee4c8c
- 77Record: Sample: Tourism and events, Barcelona id 7e086c07-eb20-44ad-b602-c5958e8ee13e
- 78Layer: Events per 10,000 people by feature. 10 features id 405dd996-09a6-48ed-ba23-86c7253d6c5c
- 79Layer: Hotels per 10,000 people by feature. 10 features id dafbe175-7ed5-414a-a851-63ce5848851d
- 80Layer: Hot spot analysis: Events. 21 features id a5378e74-77ee-4f8e-af6b-f25d1bd7f814
- 81Layer: Hot spot analysis: Hotels. 35 features id 5d3f8200-70e1-4127-b473-2986b030c3dc
- 82Layer: Emerging hot spots: Events. 12 features id 4ef1cdee-955e-4bd5-8945-dcb53b0bb3b3
- 83Layer: Emerging hot spots: Visitor check-ins. 247 features id 0550d911-8aec-447f-ad8b-d74332094159
- 84Layer: Calculate density: Events. 105 features id db4f4d27-3ab9-4f41-8da9-01e00e1e05fd
- 85Layer: Calculate density: Hotels. 160 features id 6a74aae2-e4d7-44bb-bae5-af7907cd724b
- 86Layer: Transit stations per 10,000 people by feature. 10 features id dc9ada02-031c-44ad-aa58-f2cbb1ad1c06
- 87Layer: Hot spot analysis: Short-term rentals. 120 features id 4e76223c-ab8d-4217-a68c-42960cd0306d
- 88Layer: Repeat and near repeat classification: Events. 60 features id 095f2dfc-b0b5-4811-be3f-338320ff4791
- 89Layer: Calculate density: Transit stations. 60 features id 68427dd3-936e-41d3-93aa-54b77e01fe32
Appendix: the data behind the chartsShow
Figure 1. Timeline: events per month by dataset 1
| period | series | value |
|---|---|---|
| 2025-10-01 | Footfall by hour | 0 |
| 2025-10-01 | Visitor check-ins | 0 |
| 2025-10-01 | Hotel occupancy by district and month | 10 |
| 2025-10-01 | Events | 0 |
| 2025-11-01 | Footfall by hour | 0 |
| 2025-11-01 | Visitor check-ins | 0 |
| 2025-11-01 | Hotel occupancy by district and month | 10 |
| 2025-11-01 | Events | 0 |
| 2025-12-01 | Footfall by hour | 0 |
| 2025-12-01 | Visitor check-ins | 0 |
| 2025-12-01 | Hotel occupancy by district and month | 10 |
| 2025-12-01 | Events | 0 |
| 2026-01-01 | Footfall by hour | 0 |
| 2026-01-01 | Visitor check-ins | 0 |
| 2026-01-01 | Hotel occupancy by district and month | 10 |
| 2026-01-01 | Events | 0 |
| 2026-02-01 | Footfall by hour | 0 |
| 2026-02-01 | Visitor check-ins | 0 |
| 2026-02-01 | Hotel occupancy by district and month | 10 |
| 2026-02-01 | Events | 0 |
| 2026-03-01 | Footfall by hour | 0 |
| 2026-03-01 | Visitor check-ins | 0 |
| 2026-03-01 | Hotel occupancy by district and month | 10 |
| 2026-03-01 | Events | 0 |
| 2026-04-01 | Footfall by hour | 0 |
| 2026-04-01 | Visitor check-ins | 0 |
| 2026-04-01 | Hotel occupancy by district and month | 10 |
| 2026-04-01 | Events | 0 |
| 2026-05-01 | Footfall by hour | 0 |
| 2026-05-01 | Visitor check-ins | 0 |
| 2026-05-01 | Hotel occupancy by district and month | 10 |
| 2026-05-01 | Events | 0 |
| 2026-06-01 | Footfall by hour | 0 |
| 2026-06-01 | Visitor check-ins | 0 |
| 2026-06-01 | Hotel occupancy by district and month | 10 |
| 2026-06-01 | Events | 11 |
| 2026-07-01 | Footfall by hour | 0 |
| 2026-07-01 | Visitor check-ins | 0 |
| 2026-07-01 | Hotel occupancy by district and month | 10 |
| 2026-07-01 | Events | 11 |
| 2026-08-01 | Footfall by hour | 0 |
| 2026-08-01 | Visitor check-ins | 736 |
| 2026-08-01 | Hotel occupancy by district and month | 10 |
| 2026-08-01 | Events | 10 |
| 2026-09-01 | Footfall by hour | 5,040 |
| 2026-09-01 | Visitor check-ins | 1,051 |
| 2026-09-01 | Hotel occupancy by district and month | 10 |
| 2026-09-01 | Events | 11 |
| 2026-10-01 | Footfall by hour | 0 |
| 2026-10-01 | Visitor check-ins | 0 |
| 2026-10-01 | Hotel occupancy by district and month | 0 |
| 2026-10-01 | Events | 17 |
Figure 14. Footfall counters over time (installed_year) 52
| bin_start | bin_end | count |
|---|---|---|
| 2,025 | 2,025 | 30 |
Figure 15. Footfall by hour over time (timestamp) 53
| period | value |
|---|---|
| 2026-09-14 | 720 |
| 2026-09-15 | 720 |
| 2026-09-16 | 720 |
| 2026-09-17 | 720 |
| 2026-09-18 | 720 |
| 2026-09-19 | 720 |
| 2026-09-20 | 720 |
Figure 16. Events over time (date) 54
| period | series | value |
|---|---|---|
| 2026-06-01 | exhibition | 0 |
| 2026-06-01 | concert | 2 |
| 2026-06-01 | match | 1 |
| 2026-06-01 | market | 0 |
| 2026-06-01 | festival | 0 |
| 2026-06-08 | exhibition | 1 |
| 2026-06-08 | concert | 0 |
| 2026-06-08 | match | 1 |
| 2026-06-08 | market | 1 |
| 2026-06-08 | festival | 0 |
| 2026-06-15 | exhibition | 0 |
| 2026-06-15 | concert | 0 |
| 2026-06-15 | match | 1 |
| 2026-06-15 | market | 1 |
| 2026-06-15 | festival | 0 |
| 2026-06-22 | exhibition | 0 |
| 2026-06-22 | concert | 1 |
| 2026-06-22 | match | 0 |
| 2026-06-22 | market | 0 |
| 2026-06-22 | festival | 0 |
| 2026-06-29 | exhibition | 3 |
| 2026-06-29 | concert | 3 |
| 2026-06-29 | match | 0 |
| 2026-06-29 | market | 0 |
| 2026-06-29 | festival | 1 |
| 2026-07-06 | exhibition | 0 |
| 2026-07-06 | concert | 1 |
| 2026-07-06 | match | 0 |
| 2026-07-06 | market | 0 |
| 2026-07-06 | festival | 0 |
| 2026-07-13 | exhibition | 1 |
| 2026-07-13 | concert | 0 |
| 2026-07-13 | match | 1 |
| 2026-07-13 | market | 0 |
| 2026-07-13 | festival | 0 |
| 2026-07-20 | exhibition | 0 |
| 2026-07-20 | concert | 0 |
| 2026-07-20 | match | 0 |
| 2026-07-20 | market | 2 |
| 2026-07-20 | festival | 0 |
| 2026-07-27 | exhibition | 1 |
| 2026-07-27 | concert | 0 |
| 2026-07-27 | match | 0 |
| 2026-07-27 | market | 0 |
| 2026-07-27 | festival | 0 |
| 2026-08-03 | exhibition | 0 |
| 2026-08-03 | concert | 0 |
| 2026-08-03 | match | 1 |
| 2026-08-03 | market | 1 |
| 2026-08-03 | festival | 0 |
| 2026-08-10 | exhibition | 1 |
| 2026-08-10 | concert | 0 |
| 2026-08-10 | match | 2 |
| 2026-08-10 | market | 0 |
| 2026-08-10 | festival | 0 |
| 2026-08-17 | exhibition | 1 |
| 2026-08-17 | concert | 1 |
| 2026-08-17 | match | 0 |
| 2026-08-17 | market | 0 |
| 2026-08-17 | festival | 0 |
| 2026-08-24 | exhibition | 0 |
| 2026-08-24 | concert | 1 |
| 2026-08-24 | match | 1 |
| 2026-08-24 | market | 0 |
| 2026-08-24 | festival | 1 |
| 2026-08-31 | exhibition | 1 |
| 2026-08-31 | concert | 1 |
| 2026-08-31 | match | 0 |
| 2026-08-31 | market | 0 |
| 2026-08-31 | festival | 0 |
| 2026-09-07 | exhibition | 1 |
| 2026-09-07 | concert | 0 |
| 2026-09-07 | match | 1 |
| 2026-09-07 | market | 1 |
| 2026-09-07 | festival | 0 |
| 2026-09-14 | exhibition | 1 |
| 2026-09-14 | concert | 0 |
| 2026-09-14 | match | 1 |
| 2026-09-14 | market | 1 |
| 2026-09-14 | festival | 3 |
| 2026-09-21 | exhibition | 0 |
| 2026-09-21 | concert | 0 |
| 2026-09-21 | match | 0 |
| 2026-09-21 | market | 0 |
| 2026-09-21 | festival | 0 |
| 2026-09-28 | exhibition | 0 |
| 2026-09-28 | concert | 0 |
| 2026-09-28 | match | 0 |
| 2026-09-28 | market | 0 |
| 2026-09-28 | festival | 0 |
| 2026-10-05 | exhibition | 0 |
| 2026-10-05 | concert | 2 |
| 2026-10-05 | match | 0 |
| 2026-10-05 | market | 1 |
| 2026-10-05 | festival | 1 |
| 2026-10-12 | exhibition | 1 |
| 2026-10-12 | concert | 0 |
| 2026-10-12 | match | 1 |
| 2026-10-12 | market | 2 |
| 2026-10-12 | festival | 0 |
| 2026-10-19 | exhibition | 2 |
| 2026-10-19 | concert | 1 |
| 2026-10-19 | match | 0 |
| 2026-10-19 | market | 0 |
| 2026-10-19 | festival | 1 |
| 2026-10-26 | exhibition | 2 |
| 2026-10-26 | concert | 1 |
| 2026-10-26 | match | 2 |
| 2026-10-26 | market | 0 |
| 2026-10-26 | festival | 0 |
Figure 17. Hotel occupancy by district and month over time (month) 55
| period | series | value |
|---|---|---|
| 2025-09-29 | DT06 | 2,138 |
| 2025-09-29 | DT04 | 1,034 |
| 2025-09-29 | DT05 | 2,817 |
| 2025-09-29 | DT10 | 1,781 |
| 2025-09-29 | DT02 | 1,728 |
| 2025-09-29 | Other | 1.651e+04 |
| 2025-10-06 | DT06 | 0 |
| 2025-10-06 | DT04 | 0 |
| 2025-10-06 | DT05 | 0 |
| 2025-10-06 | DT10 | 0 |
| 2025-10-06 | DT02 | 0 |
| 2025-10-06 | Other | 0 |
| 2025-10-13 | DT06 | 0 |
| 2025-10-13 | DT04 | 0 |
| 2025-10-13 | DT05 | 0 |
| 2025-10-13 | DT10 | 0 |
| 2025-10-13 | DT02 | 0 |
| 2025-10-13 | Other | 0 |
| 2025-10-20 | DT06 | 0 |
| 2025-10-20 | DT04 | 0 |
| 2025-10-20 | DT05 | 0 |
| 2025-10-20 | DT10 | 0 |
| 2025-10-20 | DT02 | 0 |
| 2025-10-20 | Other | 0 |
| 2025-10-27 | DT06 | 7,226 |
| 2025-10-27 | DT04 | 8,472 |
| 2025-10-27 | DT05 | 4,464 |
| 2025-10-27 | DT10 | 6,345 |
| 2025-10-27 | DT02 | 2,589 |
| 2025-10-27 | Other | 1.248e+04 |
| 2025-11-03 | DT06 | 0 |
| 2025-11-03 | DT04 | 0 |
| 2025-11-03 | DT05 | 0 |
| 2025-11-03 | DT10 | 0 |
| 2025-11-03 | DT02 | 0 |
| 2025-11-03 | Other | 0 |
| 2025-11-10 | DT06 | 0 |
| 2025-11-10 | DT04 | 0 |
| 2025-11-10 | DT05 | 0 |
| 2025-11-10 | DT10 | 0 |
| 2025-11-10 | DT02 | 0 |
| 2025-11-10 | Other | 0 |
| 2025-11-17 | DT06 | 0 |
| 2025-11-17 | DT04 | 0 |
| 2025-11-17 | DT05 | 0 |
| 2025-11-17 | DT10 | 0 |
| 2025-11-17 | DT02 | 0 |
| 2025-11-17 | Other | 0 |
| 2025-11-24 | DT06 | 0 |
| 2025-11-24 | DT04 | 0 |
| 2025-11-24 | DT05 | 0 |
| 2025-11-24 | DT10 | 0 |
| 2025-11-24 | DT02 | 0 |
| 2025-11-24 | Other | 0 |
| 2025-12-01 | DT06 | 8,013 |
| 2025-12-01 | DT04 | 3,856 |
| 2025-12-01 | DT05 | 5,653 |
| 2025-12-01 | DT10 | 8,983 |
| 2025-12-01 | DT02 | 8,363 |
| 2025-12-01 | Other | 2.188e+04 |
| 2025-12-08 | DT06 | 0 |
| 2025-12-08 | DT04 | 0 |
| 2025-12-08 | DT05 | 0 |
| 2025-12-08 | DT10 | 0 |
| 2025-12-08 | DT02 | 0 |
| 2025-12-08 | Other | 0 |
| 2025-12-15 | DT06 | 0 |
| 2025-12-15 | DT04 | 0 |
| 2025-12-15 | DT05 | 0 |
| 2025-12-15 | DT10 | 0 |
| 2025-12-15 | DT02 | 0 |
| 2025-12-15 | Other | 0 |
| 2025-12-22 | DT06 | 0 |
| 2025-12-22 | DT04 | 0 |
| 2025-12-22 | DT05 | 0 |
| 2025-12-22 | DT10 | 0 |
| 2025-12-22 | DT02 | 0 |
| 2025-12-22 | Other | 0 |
| 2025-12-29 | DT06 | 8,732 |
| 2025-12-29 | DT04 | 3,728 |
| 2025-12-29 | DT05 | 2,054 |
| 2025-12-29 | DT10 | 6,927 |
| 2025-12-29 | DT02 | 7,321 |
| 2025-12-29 | Other | 2.694e+04 |
| 2026-01-05 | DT06 | 0 |
| 2026-01-05 | DT04 | 0 |
| 2026-01-05 | DT05 | 0 |
| 2026-01-05 | DT10 | 0 |
| 2026-01-05 | DT02 | 0 |
| 2026-01-05 | Other | 0 |
| 2026-01-12 | DT06 | 0 |
| 2026-01-12 | DT04 | 0 |
| 2026-01-12 | DT05 | 0 |
| 2026-01-12 | DT10 | 0 |
| 2026-01-12 | DT02 | 0 |
| 2026-01-12 | Other | 0 |
| 2026-01-19 | DT06 | 0 |
| 2026-01-19 | DT04 | 0 |
| 2026-01-19 | DT05 | 0 |
| 2026-01-19 | DT10 | 0 |
| 2026-01-19 | DT02 | 0 |
| 2026-01-19 | Other | 0 |
| 2026-01-26 | DT06 | 2,115 |
| 2026-01-26 | DT04 | 5,118 |
| 2026-01-26 | DT05 | 3,277 |
| 2026-01-26 | DT10 | 5,816 |
| 2026-01-26 | DT02 | 7,018 |
| 2026-01-26 | Other | 2.137e+04 |
| 2026-02-02 | DT06 | 0 |
| 2026-02-02 | DT04 | 0 |
| 2026-02-02 | DT05 | 0 |
| 2026-02-02 | DT10 | 0 |
| 2026-02-02 | DT02 | 0 |
| 2026-02-02 | Other | 0 |
| 2026-02-09 | DT06 | 0 |
| 2026-02-09 | DT04 | 0 |
| 2026-02-09 | DT05 | 0 |
| 2026-02-09 | DT10 | 0 |
| 2026-02-09 | DT02 | 0 |
| 2026-02-09 | Other | 0 |
| 2026-02-16 | DT06 | 0 |
| 2026-02-16 | DT04 | 0 |
| 2026-02-16 | DT05 | 0 |
| 2026-02-16 | DT10 | 0 |
| 2026-02-16 | DT02 | 0 |
| 2026-02-16 | Other | 0 |
| 2026-02-23 | DT06 | 3,579 |
| 2026-02-23 | DT04 | 2,962 |
| 2026-02-23 | DT05 | 7,288 |
| 2026-02-23 | DT10 | 3,713 |
| 2026-02-23 | DT02 | 2,970 |
| 2026-02-23 | Other | 3.058e+04 |
| 2026-03-02 | DT06 | 0 |
| 2026-03-02 | DT04 | 0 |
| 2026-03-02 | DT05 | 0 |
| 2026-03-02 | DT10 | 0 |
| 2026-03-02 | DT02 | 0 |
| 2026-03-02 | Other | 0 |
| 2026-03-09 | DT06 | 0 |
| 2026-03-09 | DT04 | 0 |
| 2026-03-09 | DT05 | 0 |
| 2026-03-09 | DT10 | 0 |
| 2026-03-09 | DT02 | 0 |
| 2026-03-09 | Other | 0 |
| 2026-03-16 | DT06 | 0 |
| 2026-03-16 | DT04 | 0 |
| 2026-03-16 | DT05 | 0 |
| 2026-03-16 | DT10 | 0 |
| 2026-03-16 | DT02 | 0 |
| 2026-03-16 | Other | 0 |
| 2026-03-23 | DT06 | 0 |
| 2026-03-23 | DT04 | 0 |
| 2026-03-23 | DT05 | 0 |
| 2026-03-23 | DT10 | 0 |
| 2026-03-23 | DT02 | 0 |
| 2026-03-23 | Other | 0 |
| 2026-03-30 | DT06 | 5,650 |
| 2026-03-30 | DT04 | 6,950 |
| 2026-03-30 | DT05 | 6,796 |
| 2026-03-30 | DT10 | 4,404 |
| 2026-03-30 | DT02 | 3,479 |
| 2026-03-30 | Other | 1.511e+04 |
| 2026-04-06 | DT06 | 0 |
| 2026-04-06 | DT04 | 0 |
| 2026-04-06 | DT05 | 0 |
| 2026-04-06 | DT10 | 0 |
| 2026-04-06 | DT02 | 0 |
| 2026-04-06 | Other | 0 |
| 2026-04-13 | DT06 | 0 |
| 2026-04-13 | DT04 | 0 |
| 2026-04-13 | DT05 | 0 |
| 2026-04-13 | DT10 | 0 |
| 2026-04-13 | DT02 | 0 |
| 2026-04-13 | Other | 0 |
| 2026-04-20 | DT06 | 0 |
| 2026-04-20 | DT04 | 0 |
| 2026-04-20 | DT05 | 0 |
| 2026-04-20 | DT10 | 0 |
| 2026-04-20 | DT02 | 0 |
| 2026-04-20 | Other | 0 |
| 2026-04-27 | DT06 | 7,955 |
| 2026-04-27 | DT04 | 2,998 |
| 2026-04-27 | DT05 | 2,479 |
| 2026-04-27 | DT10 | 3,806 |
| 2026-04-27 | DT02 | 4,230 |
| 2026-04-27 | Other | 2.721e+04 |
| 2026-05-04 | DT06 | 0 |
| 2026-05-04 | DT04 | 0 |
| 2026-05-04 | DT05 | 0 |
| 2026-05-04 | DT10 | 0 |
| 2026-05-04 | DT02 | 0 |
| 2026-05-04 | Other | 0 |
| 2026-05-11 | DT06 | 0 |
| 2026-05-11 | DT04 | 0 |
| 2026-05-11 | DT05 | 0 |
| 2026-05-11 | DT10 | 0 |
| 2026-05-11 | DT02 | 0 |
| 2026-05-11 | Other | 0 |
| 2026-05-18 | DT06 | 0 |
| 2026-05-18 | DT04 | 0 |
| 2026-05-18 | DT05 | 0 |
| 2026-05-18 | DT10 | 0 |
| 2026-05-18 | DT02 | 0 |
| 2026-05-18 | Other | 0 |
| 2026-05-25 | DT06 | 0 |
| 2026-05-25 | DT04 | 0 |
| 2026-05-25 | DT05 | 0 |
| 2026-05-25 | DT10 | 0 |
| 2026-05-25 | DT02 | 0 |
| 2026-05-25 | Other | 0 |
| 2026-06-01 | DT06 | 5,440 |
| 2026-06-01 | DT04 | 6,136 |
| 2026-06-01 | DT05 | 7,347 |
| 2026-06-01 | DT10 | 3,873 |
| 2026-06-01 | DT02 | 4,157 |
| 2026-06-01 | Other | 2.078e+04 |
| 2026-06-08 | DT06 | 0 |
| 2026-06-08 | DT04 | 0 |
| 2026-06-08 | DT05 | 0 |
| 2026-06-08 | DT10 | 0 |
| 2026-06-08 | DT02 | 0 |
| 2026-06-08 | Other | 0 |
| 2026-06-15 | DT06 | 0 |
| 2026-06-15 | DT04 | 0 |
| 2026-06-15 | DT05 | 0 |
| 2026-06-15 | DT10 | 0 |
| 2026-06-15 | DT02 | 0 |
| 2026-06-15 | Other | 0 |
| 2026-06-22 | DT06 | 0 |
| 2026-06-22 | DT04 | 0 |
| 2026-06-22 | DT05 | 0 |
| 2026-06-22 | DT10 | 0 |
| 2026-06-22 | DT02 | 0 |
| 2026-06-22 | Other | 0 |
| 2026-06-29 | DT06 | 7,881 |
| 2026-06-29 | DT04 | 6,851 |
| 2026-06-29 | DT05 | 1,454 |
| 2026-06-29 | DT10 | 1,762 |
| 2026-06-29 | DT02 | 1,279 |
| 2026-06-29 | Other | 1.875e+04 |
| 2026-07-06 | DT06 | 0 |
| 2026-07-06 | DT04 | 0 |
| 2026-07-06 | DT05 | 0 |
| 2026-07-06 | DT10 | 0 |
| 2026-07-06 | DT02 | 0 |
| 2026-07-06 | Other | 0 |
| 2026-07-13 | DT06 | 0 |
| 2026-07-13 | DT04 | 0 |
| 2026-07-13 | DT05 | 0 |
| 2026-07-13 | DT10 | 0 |
| 2026-07-13 | DT02 | 0 |
| 2026-07-13 | Other | 0 |
| 2026-07-20 | DT06 | 0 |
| 2026-07-20 | DT04 | 0 |
| 2026-07-20 | DT05 | 0 |
| 2026-07-20 | DT10 | 0 |
| 2026-07-20 | DT02 | 0 |
| 2026-07-20 | Other | 0 |
| 2026-07-27 | DT06 | 2,819 |
| 2026-07-27 | DT04 | 7,853 |
| 2026-07-27 | DT05 | 5,302 |
| 2026-07-27 | DT10 | 1,915 |
| 2026-07-27 | DT02 | 5,724 |
| 2026-07-27 | Other | 1.762e+04 |
| 2026-08-03 | DT06 | 0 |
| 2026-08-03 | DT04 | 0 |
| 2026-08-03 | DT05 | 0 |
| 2026-08-03 | DT10 | 0 |
| 2026-08-03 | DT02 | 0 |
| 2026-08-03 | Other | 0 |
| 2026-08-10 | DT06 | 0 |
| 2026-08-10 | DT04 | 0 |
| 2026-08-10 | DT05 | 0 |
| 2026-08-10 | DT10 | 0 |
| 2026-08-10 | DT02 | 0 |
| 2026-08-10 | Other | 0 |
| 2026-08-17 | DT06 | 0 |
| 2026-08-17 | DT04 | 0 |
| 2026-08-17 | DT05 | 0 |
| 2026-08-17 | DT10 | 0 |
| 2026-08-17 | DT02 | 0 |
| 2026-08-17 | Other | 0 |
| 2026-08-24 | DT06 | 0 |
| 2026-08-24 | DT04 | 0 |
| 2026-08-24 | DT05 | 0 |
| 2026-08-24 | DT10 | 0 |
| 2026-08-24 | DT02 | 0 |
| 2026-08-24 | Other | 0 |
| 2026-08-31 | DT06 | 4,125 |
| 2026-08-31 | DT04 | 8,231 |
| 2026-08-31 | DT05 | 8,813 |
| 2026-08-31 | DT10 | 7,608 |
| 2026-08-31 | DT02 | 7,592 |
| 2026-08-31 | Other | 2.857e+04 |
Figure 18. Events per 10,000 people by feature 56
| bin_start | bin_end | count |
|---|---|---|
| 0 | 8 | 9 |
| 8 | 16 | 0 |
| 16 | 24 | 0 |
| 24 | 32 | 0 |
| 32 | 40 | 1 |
Figure 19. Hotels per 10,000 people by feature 57
| bin_start | bin_end | count |
|---|---|---|
| 1 | 11.2 | 7 |
| 11.2 | 21.4 | 1 |
| 21.4 | 31.6 | 1 |
| 31.6 | 41.8 | 0 |
| 41.8 | 52 | 1 |
Figure 20. Hot spot analysis: Events 58
| bin_start | bin_end | band | band_label | count |
|---|---|---|---|---|
| -1 | -0.5 | not_significant | Not significant | 7 |
| -0.5 | 0 | not_significant | Not significant | 7 |
| 0 | 0.5 | not_significant | Not significant | 5 |
| 2.5 | 3 | hot_95 | Hot spot, 95% confidence | 1 |
| 3 | 3.5 | hot_99 | Hot spot, 99% confidence | 1 |
Figure 21. Hot spot analysis: Hotels 59
| bin_start | bin_end | band | band_label | count |
|---|---|---|---|---|
| -1 | -0.5 | not_significant | Not significant | 14 |
| -0.5 | 0 | not_significant | Not significant | 8 |
| 0 | 0.5 | not_significant | Not significant | 6 |
| 0.5 | 1 | not_significant | Not significant | 4 |
| 1 | 1.5 | not_significant | Not significant | 1 |
| 3 | 3.5 | hot_99 | Hot spot, 99% confidence | 2 |
Figure 22. Emerging hot spots: Events 60
| bin_start | bin_end | count |
|---|---|---|
| 0.038 | 0.871 | 4 |
| 0.871 | 1.704 | 1 |
| 1.704 | 2.537 | 1 |
| 2.537 | 3.37 | 3 |
| 3.37 | 4.203 | 3 |
Figure 23. Emerging hot spots: Visitor check-ins 61
| bin_start | bin_end | count |
|---|---|---|
| -1.056 | -0.5576 | 150 |
| -0.5576 | -0.05911 | 59 |
| -0.05911 | 0.4393 | 15 |
| 0.4393 | 0.9378 | 10 |
| 0.9378 | 1.436 | 3 |
| 1.436 | 1.935 | 3 |
| 1.935 | 2.433 | 3 |
| 2.433 | 2.932 | 2 |
| 2.932 | 3.43 | 2 |
Figure 24. Calculate density: Events 62
| bin_start | bin_end | count |
|---|---|---|
| 0 | 1.5 | 11 |
| 1.5 | 3 | 8 |
| 3 | 4.5 | 17 |
| 4.5 | 6 | 10 |
| 6 | 7.5 | 17 |
| 7.5 | 9 | 8 |
| 9 | 10.5 | 20 |
| 10.5 | 12 | 14 |
Figure 25. Calculate density: Hotels 63
| bin_start | bin_end | count |
|---|---|---|
| 0 | 1.556 | 16 |
| 1.556 | 3.111 | 26 |
| 3.111 | 4.667 | 13 |
| 4.667 | 6.222 | 23 |
| 6.222 | 7.778 | 12 |
| 7.778 | 9.333 | 22 |
| 9.333 | 10.89 | 11 |
| 10.89 | 12.44 | 23 |
| 12.44 | 14 | 14 |
Figure 26. Transit stations per 10,000 people by feature 64
| bin_start | bin_end | count |
|---|---|---|
| 0 | 1 | 1 |
| 1 | 2 | 3 |
| 2 | 3 | 2 |
| 3 | 4 | 2 |
| 4 | 5 | 2 |
Figure 27. Hot spot analysis: Short-term rentals 65
| bin_start | bin_end | band | band_label | count |
|---|---|---|---|---|
| -1 | -0.5 | not_significant | Not significant | 50 |
| -0.5 | 0 | not_significant | Not significant | 22 |
| 0 | 0.5 | not_significant | Not significant | 24 |
| 0.5 | 1 | not_significant | Not significant | 10 |
| 1 | 1.5 | not_significant | Not significant | 1 |
| 1.5 | 2 | hot_90 | Hot spot, 90% confidence | 4 |
| 1.5 | 2 | hot_95 | Hot spot, 95% confidence | 3 |
| 2.5 | 3 | hot_95 | Hot spot, 95% confidence | 2 |
| 3 | 3.5 | hot_99 | Hot spot, 99% confidence | 3 |
| 3.5 | 4 | hot_99 | Hot spot, 99% confidence | 1 |
Figure 28. Repeat and near repeat classification: Events 66
| period | series | value |
|---|---|---|
| 2026-06-01 | exhibition | 0 |
| 2026-06-01 | concert | 2 |
| 2026-06-01 | match | 1 |
| 2026-06-01 | market | 0 |
| 2026-06-01 | festival | 0 |
| 2026-06-08 | exhibition | 1 |
| 2026-06-08 | concert | 0 |
| 2026-06-08 | match | 1 |
| 2026-06-08 | market | 1 |
| 2026-06-08 | festival | 0 |
| 2026-06-15 | exhibition | 0 |
| 2026-06-15 | concert | 0 |
| 2026-06-15 | match | 1 |
| 2026-06-15 | market | 1 |
| 2026-06-15 | festival | 0 |
| 2026-06-22 | exhibition | 0 |
| 2026-06-22 | concert | 1 |
| 2026-06-22 | match | 0 |
| 2026-06-22 | market | 0 |
| 2026-06-22 | festival | 0 |
| 2026-06-29 | exhibition | 3 |
| 2026-06-29 | concert | 3 |
| 2026-06-29 | match | 0 |
| 2026-06-29 | market | 0 |
| 2026-06-29 | festival | 1 |
| 2026-07-06 | exhibition | 0 |
| 2026-07-06 | concert | 1 |
| 2026-07-06 | match | 0 |
| 2026-07-06 | market | 0 |
| 2026-07-06 | festival | 0 |
| 2026-07-13 | exhibition | 1 |
| 2026-07-13 | concert | 0 |
| 2026-07-13 | match | 1 |
| 2026-07-13 | market | 0 |
| 2026-07-13 | festival | 0 |
| 2026-07-20 | exhibition | 0 |
| 2026-07-20 | concert | 0 |
| 2026-07-20 | match | 0 |
| 2026-07-20 | market | 2 |
| 2026-07-20 | festival | 0 |
| 2026-07-27 | exhibition | 1 |
| 2026-07-27 | concert | 0 |
| 2026-07-27 | match | 0 |
| 2026-07-27 | market | 0 |
| 2026-07-27 | festival | 0 |
| 2026-08-03 | exhibition | 0 |
| 2026-08-03 | concert | 0 |
| 2026-08-03 | match | 1 |
| 2026-08-03 | market | 1 |
| 2026-08-03 | festival | 0 |
| 2026-08-10 | exhibition | 1 |
| 2026-08-10 | concert | 0 |
| 2026-08-10 | match | 2 |
| 2026-08-10 | market | 0 |
| 2026-08-10 | festival | 0 |
| 2026-08-17 | exhibition | 1 |
| 2026-08-17 | concert | 1 |
| 2026-08-17 | match | 0 |
| 2026-08-17 | market | 0 |
| 2026-08-17 | festival | 0 |
| 2026-08-24 | exhibition | 0 |
| 2026-08-24 | concert | 1 |
| 2026-08-24 | match | 1 |
| 2026-08-24 | market | 0 |
| 2026-08-24 | festival | 1 |
| 2026-08-31 | exhibition | 1 |
| 2026-08-31 | concert | 1 |
| 2026-08-31 | match | 0 |
| 2026-08-31 | market | 0 |
| 2026-08-31 | festival | 0 |
| 2026-09-07 | exhibition | 1 |
| 2026-09-07 | concert | 0 |
| 2026-09-07 | match | 1 |
| 2026-09-07 | market | 1 |
| 2026-09-07 | festival | 0 |
| 2026-09-14 | exhibition | 1 |
| 2026-09-14 | concert | 0 |
| 2026-09-14 | match | 1 |
| 2026-09-14 | market | 1 |
| 2026-09-14 | festival | 3 |
| 2026-09-21 | exhibition | 0 |
| 2026-09-21 | concert | 0 |
| 2026-09-21 | match | 0 |
| 2026-09-21 | market | 0 |
| 2026-09-21 | festival | 0 |
| 2026-09-28 | exhibition | 0 |
| 2026-09-28 | concert | 0 |
| 2026-09-28 | match | 0 |
| 2026-09-28 | market | 0 |
| 2026-09-28 | festival | 0 |
| 2026-10-05 | exhibition | 0 |
| 2026-10-05 | concert | 2 |
| 2026-10-05 | match | 0 |
| 2026-10-05 | market | 1 |
| 2026-10-05 | festival | 1 |
| 2026-10-12 | exhibition | 1 |
| 2026-10-12 | concert | 0 |
| 2026-10-12 | match | 1 |
| 2026-10-12 | market | 2 |
| 2026-10-12 | festival | 0 |
| 2026-10-19 | exhibition | 2 |
| 2026-10-19 | concert | 1 |
| 2026-10-19 | match | 0 |
| 2026-10-19 | market | 0 |
| 2026-10-19 | festival | 1 |
| 2026-10-26 | exhibition | 2 |
| 2026-10-26 | concert | 1 |
| 2026-10-26 | match | 2 |
| 2026-10-26 | market | 0 |
| 2026-10-26 | festival | 0 |
Figure 29. Calculate density: Transit stations 67
| bin_start | bin_end | count |
|---|---|---|
| 0.001178 | 0.178 | 23 |
| 0.178 | 0.3547 | 8 |
| 0.3547 | 0.5315 | 7 |
| 0.5315 | 0.7083 | 8 |
| 0.7083 | 0.8851 | 6 |
| 0.8851 | 1.062 | 4 |
| 1.062 | 1.239 | 4 |
Figure 30. Repeat and near repeat classification: Events over time 68
| period | series | value |
|---|---|---|
| 2026-06-01 | exhibition | 0 |
| 2026-06-01 | concert | 2 |
| 2026-06-01 | match | 1 |
| 2026-06-01 | market | 0 |
| 2026-06-01 | festival | 0 |
| 2026-06-08 | exhibition | 1 |
| 2026-06-08 | concert | 0 |
| 2026-06-08 | match | 1 |
| 2026-06-08 | market | 1 |
| 2026-06-08 | festival | 0 |
| 2026-06-15 | exhibition | 0 |
| 2026-06-15 | concert | 0 |
| 2026-06-15 | match | 1 |
| 2026-06-15 | market | 1 |
| 2026-06-15 | festival | 0 |
| 2026-06-22 | exhibition | 0 |
| 2026-06-22 | concert | 1 |
| 2026-06-22 | match | 0 |
| 2026-06-22 | market | 0 |
| 2026-06-22 | festival | 0 |
| 2026-06-29 | exhibition | 3 |
| 2026-06-29 | concert | 3 |
| 2026-06-29 | match | 0 |
| 2026-06-29 | market | 0 |
| 2026-06-29 | festival | 1 |
| 2026-07-06 | exhibition | 0 |
| 2026-07-06 | concert | 1 |
| 2026-07-06 | match | 0 |
| 2026-07-06 | market | 0 |
| 2026-07-06 | festival | 0 |
| 2026-07-13 | exhibition | 1 |
| 2026-07-13 | concert | 0 |
| 2026-07-13 | match | 1 |
| 2026-07-13 | market | 0 |
| 2026-07-13 | festival | 0 |
| 2026-07-20 | exhibition | 0 |
| 2026-07-20 | concert | 0 |
| 2026-07-20 | match | 0 |
| 2026-07-20 | market | 2 |
| 2026-07-20 | festival | 0 |
| 2026-07-27 | exhibition | 1 |
| 2026-07-27 | concert | 0 |
| 2026-07-27 | match | 0 |
| 2026-07-27 | market | 0 |
| 2026-07-27 | festival | 0 |
| 2026-08-03 | exhibition | 0 |
| 2026-08-03 | concert | 0 |
| 2026-08-03 | match | 1 |
| 2026-08-03 | market | 1 |
| 2026-08-03 | festival | 0 |
| 2026-08-10 | exhibition | 1 |
| 2026-08-10 | concert | 0 |
| 2026-08-10 | match | 2 |
| 2026-08-10 | market | 0 |
| 2026-08-10 | festival | 0 |
| 2026-08-17 | exhibition | 1 |
| 2026-08-17 | concert | 1 |
| 2026-08-17 | match | 0 |
| 2026-08-17 | market | 0 |
| 2026-08-17 | festival | 0 |
| 2026-08-24 | exhibition | 0 |
| 2026-08-24 | concert | 1 |
| 2026-08-24 | match | 1 |
| 2026-08-24 | market | 0 |
| 2026-08-24 | festival | 1 |
| 2026-08-31 | exhibition | 1 |
| 2026-08-31 | concert | 1 |
| 2026-08-31 | match | 0 |
| 2026-08-31 | market | 0 |
| 2026-08-31 | festival | 0 |
| 2026-09-07 | exhibition | 1 |
| 2026-09-07 | concert | 0 |
| 2026-09-07 | match | 1 |
| 2026-09-07 | market | 1 |
| 2026-09-07 | festival | 0 |
| 2026-09-14 | exhibition | 1 |
| 2026-09-14 | concert | 0 |
| 2026-09-14 | match | 1 |
| 2026-09-14 | market | 1 |
| 2026-09-14 | festival | 3 |
| 2026-09-21 | exhibition | 0 |
| 2026-09-21 | concert | 0 |
| 2026-09-21 | match | 0 |
| 2026-09-21 | market | 0 |
| 2026-09-21 | festival | 0 |
| 2026-09-28 | exhibition | 0 |
| 2026-09-28 | concert | 0 |
| 2026-09-28 | match | 0 |
| 2026-09-28 | market | 0 |
| 2026-09-28 | festival | 0 |
| 2026-10-05 | exhibition | 0 |
| 2026-10-05 | concert | 2 |
| 2026-10-05 | match | 0 |
| 2026-10-05 | market | 1 |
| 2026-10-05 | festival | 1 |
| 2026-10-12 | exhibition | 1 |
| 2026-10-12 | concert | 0 |
| 2026-10-12 | match | 1 |
| 2026-10-12 | market | 2 |
| 2026-10-12 | festival | 0 |
| 2026-10-19 | exhibition | 2 |
| 2026-10-19 | concert | 1 |
| 2026-10-19 | match | 0 |
| 2026-10-19 | market | 0 |
| 2026-10-19 | festival | 1 |
| 2026-10-26 | exhibition | 2 |
| 2026-10-26 | concert | 1 |
| 2026-10-26 | match | 2 |
| 2026-10-26 | market | 0 |
| 2026-10-26 | festival | 0 |
GeoBit Large Spatial Model. Findings are labeled Evidenced (computed by a tool), Inferred (a reading or reasoning) or Unverified (no evidence yet).