Sample: Electricity utility, Houston: report
Project: Sample: Electricity utility, Houston
Goal: Describe the project Sample: Electricity utility, Houston: run the analyses that tell the most about its data, draw every result, and write a cited report.
Run: 370b2dd2-5561-44b3-aa6f-5fe633bbe222 (running, 11 agent run(s))
Generated: 2026-10-18T05:29:19Z, version 1
Model cost: USD 0.0000 over 0 model call(s)
Data used
| Data | Kind | Rows | Time span | Summary | Source |
|---|---|---|---|---|---|
| Substations | vector, Point | 14 | 14 point features; 'voltage_kv' 35 to 69 (mean 64.14); 'capacity_mva' 40 to 120 (mean 68.57); 'commissioned' 1,970 to 2,017 (mean 1994); named by 'name' (e.g. Juniper Rise Substation, Kingsmead Substation, Larchfield Substation); extent -95.4070,29.7335 to -95.3261,29.7908. Point locations of Substations. | 98 | |
| Feeder lines | vector, LineString | 79 | 79 line features; 'construction' has 2 values (top: overhead 46, underground 33); 'conductor' has 4 values (top: 1/0 ACSR 24, 477 AAC 21, 750 Cu UG 19); 'install_year' 1,964 to 2,022 (mean 1990); 'voltage_kv' 12.47 to 12.47 (mean 12.47); 'length_m' 540 to 3,063 (mean 1690); total length 133.5 km; extent -95.4215,29.7253 to -95.3181,29.7966. Lines (Feeder lines) such as routes or networks. | 99 | |
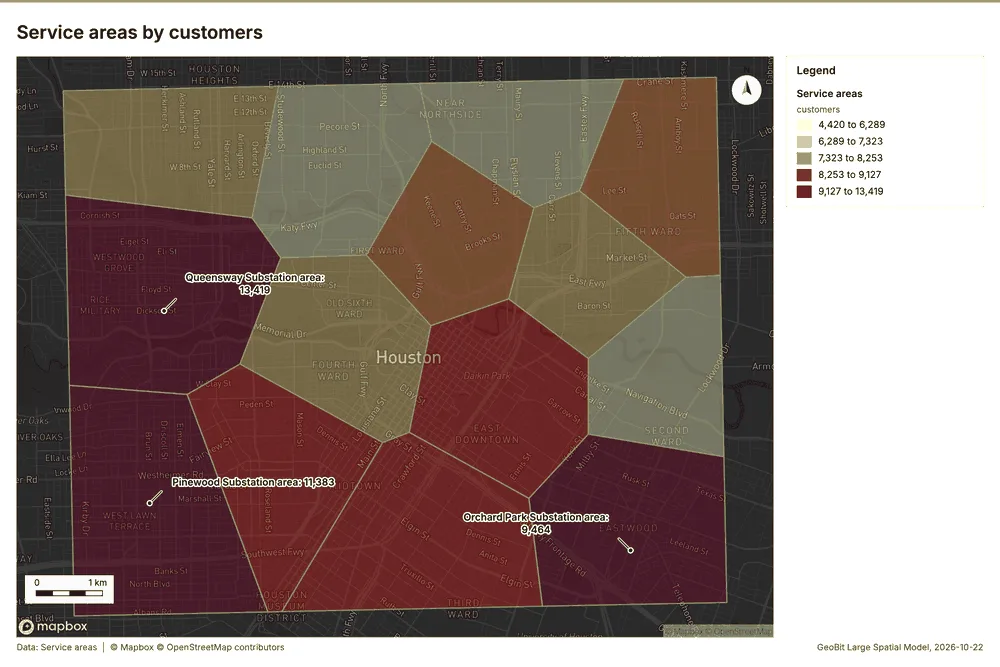
| Service areas | vector, Polygon | 14 | 14 polygon (area) features; 'customers' 4,420 to 13,419 (mean 7965); 'peak_load_mw' 17.1 to 50.9 (mean 36.91); named by 'name' (e.g. Juniper Rise Substation area, Kingsmead Substation area, Larchfield Substation area); total area 79.96 km2; extent -95.4223,29.7234 to -95.3173,29.7974. Areas (Service areas) with customers to compare and map. | 100 | |
| Outages | vector, Point | 1,650 | 2024-10-01 to 2026-09-30 | 1,650 point features; dated by 'started_at' from 2024-10-01 to 2026-09-30; 'cause' has 6 values (top: vegetation 644, equipment 427, weather 343); 'duration_min' 10 to 2,740 (mean 195); 'customers_affected' 6 to 3,173 (mean 234.9); extent -95.4212,29.7255 to -95.3187,29.7961. Dated point events by cause: where and when Outages happen. | 2 |
| Vegetation work orders | vector, Point | 480 | 2024-10-04 to 2026-09-21 | 480 point features; dated by 'date' from 2024-10-04 to 2026-09-21; 'trim_type' has 3 values (top: hazard tree 161, cycle trim 160, hot spot 159); 'spans' 1 to 12 (mean 6.692); 'cost_usd' 566 to 12,478 (mean 2667); extent -95.4210,29.7258 to -95.3186,29.7961. Dated point events by trim_type: where and when Vegetation work orders happen. | 3 |
| Critical customers | vector, Point | 60 | 60 point features; 'type' has 5 values (top: water plant 20, emergency shelter 11, fire station 10); 'backup_generator' has 2 values (top: False 39, True 21); 'priority' 1 to 3 (mean 1.683); extent -95.4198,29.7261 to -95.3218,29.7961. Point locations of Critical customers by type. | 101 | |
| Poles | vector, Point | 450 | 450 point features; 'material' has 3 values (top: wood 207, concrete 131, steel 112); 'inspection_grade' has 4 values (top: B 187, D 95, A 87); 'install_year' 1,967 to 2,024 (mean 2001); extent -95.4214,29.7313 to -95.3201,29.7964. Point locations of Poles by material. | 102 | |
| Feeder reliability by year | table | 316 | 2022-01-01 to 2025-01-01 | Table of 316 rows and 6 columns without geometry; dated by 'year' from 2022-01-01 to 2025-01-01; 'saidi_min' 35.2 to 486.9 (mean 121.6); 'saifi' 0.45 to 2.49 (mean 1.177); 'caidi_min' 29.3 to 391 (mean 106.5). A table of Feeder reliability by year without locations. | 4 |
| Transformer assets | table | 300 | Table of 300 rows and 6 columns without geometry; 'mount' has 2 values (top: pole 164, pad 136); 'kva' 25 to 167 (mean 83.32); 'install_year' 1,970 to 2,024 (mean 1997); 'condition_score' 1 to 10 (mean 5.301). A table of Transformer assets without locations. | 103 | |
| Storm season reliability report | document | 1-page pdf document 'Storm season reliability report'; language en; mentions 3 place(s): Juniper Rise Substation (2), Kingsmead Substation (1), Larchfield Substation (1). A document about Juniper Rise Substation, Kingsmead Substation, Larchfield Substation. | 104 | ||
| Sample: Electricity utility, Houston | record | 105 | |||
| Emerging hot spots: Outages | layer, Polygon | 100 | 106 | ||
| Emerging hot spots: Vegetation work orders | layer, Polygon | 89 | 107 | ||
| Hot spot analysis: Poles | layer, Polygon | 79 | 108 | ||
| Hot spot analysis: Outages | layer, Point | 1,650 | 109 | ||
| Hot spot analysis: Vegetation work orders | layer, Polygon | 86 | 110 | ||
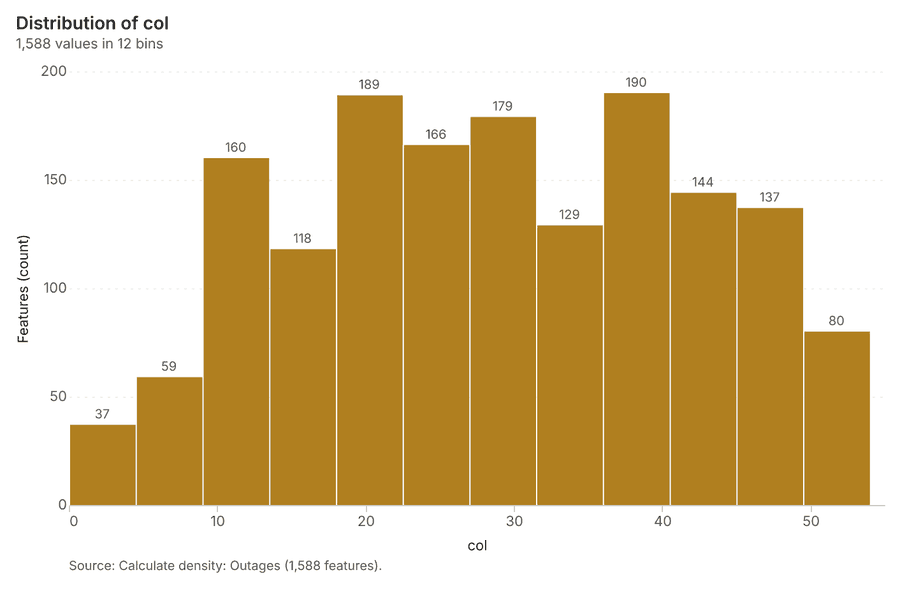
| Calculate density: Poles | layer, Polygon | 344 | 111 | ||
| Calculate density: Outages | layer, Polygon | 1,588 | 112 | ||
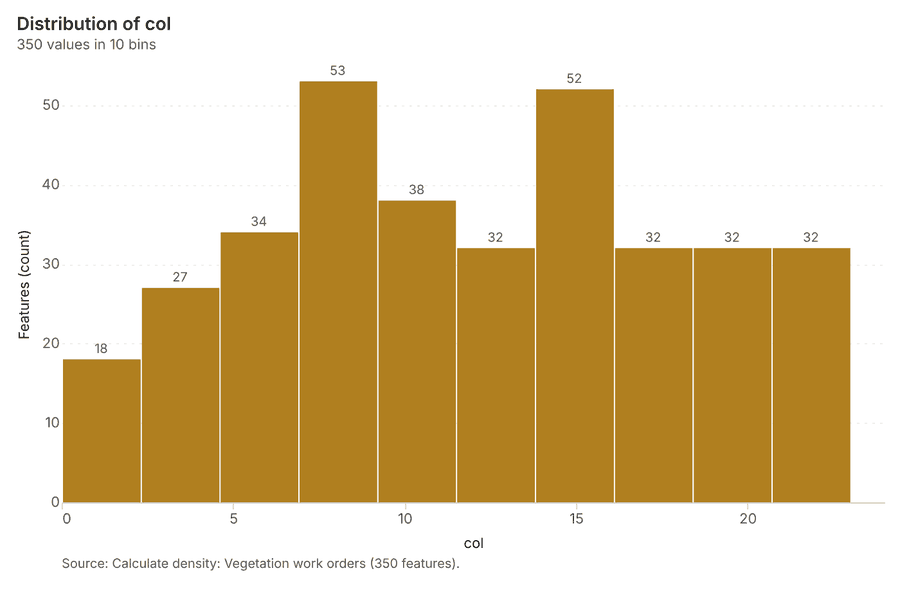
| Calculate density: Vegetation work orders | layer, Polygon | 350 | 113 | ||
| Summarize within: Service areas | layer, Polygon | 14 | 114 | ||
| Summarize within: Service areas | layer, Polygon | 14 | 115 | ||
| Summarize within: Service areas | layer, Polygon | 14 | 116 | ||
| Find point clusters: Poles | layer, Point | 450 | 117 | ||
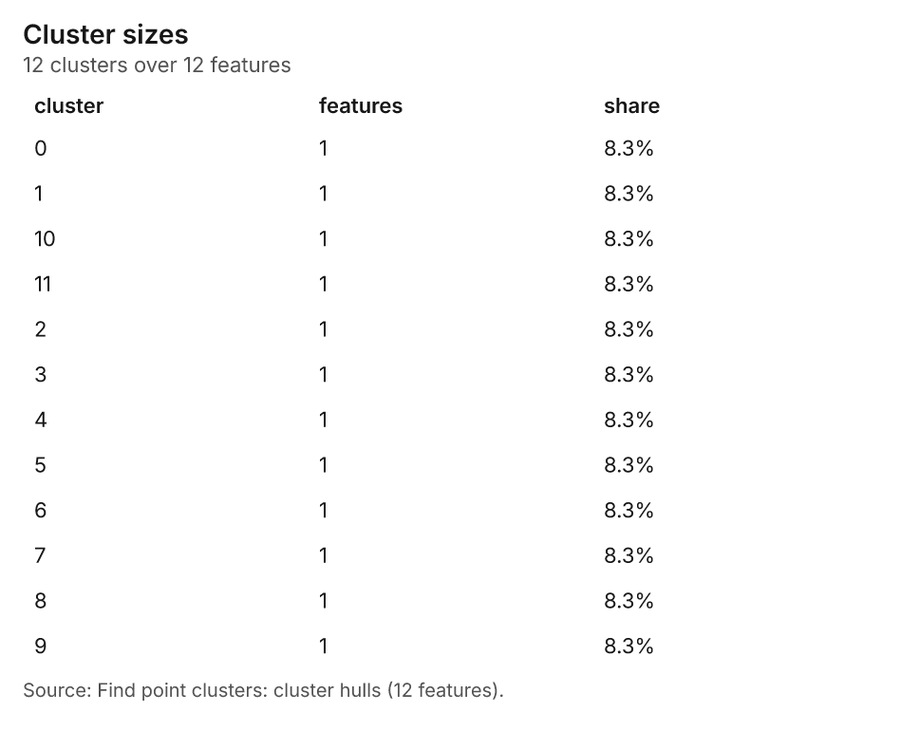
| Find point clusters: cluster hulls | layer, Polygon | 12 | 118 | ||
| Find point clusters: Outages | layer, Point | 1,650 | 119 | ||
| Find point clusters: cluster hulls | layer, Polygon | 12 | 120 | ||
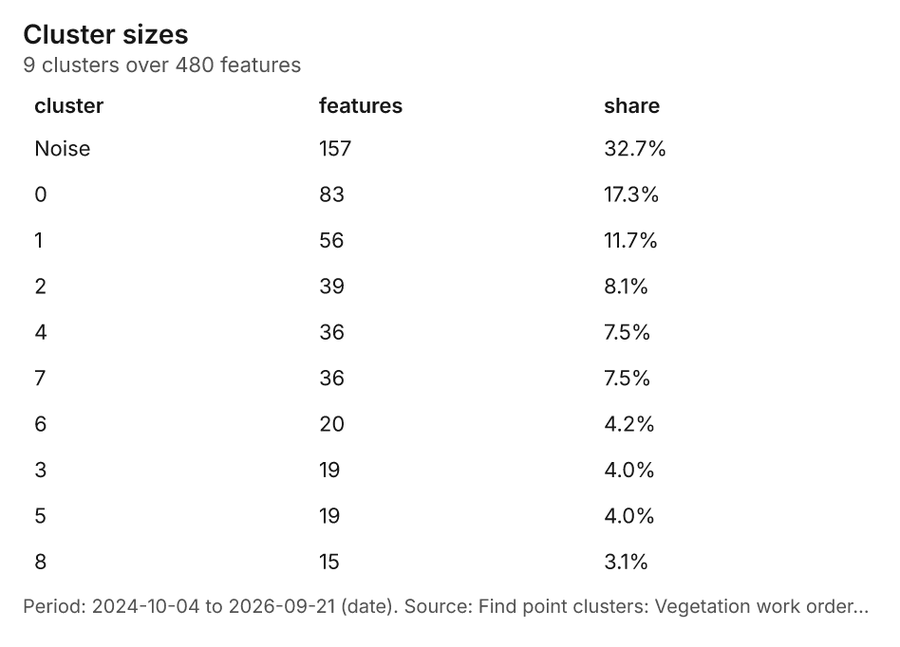
| Find point clusters: Vegetation work orders | layer, Point | 480 | 121 | ||
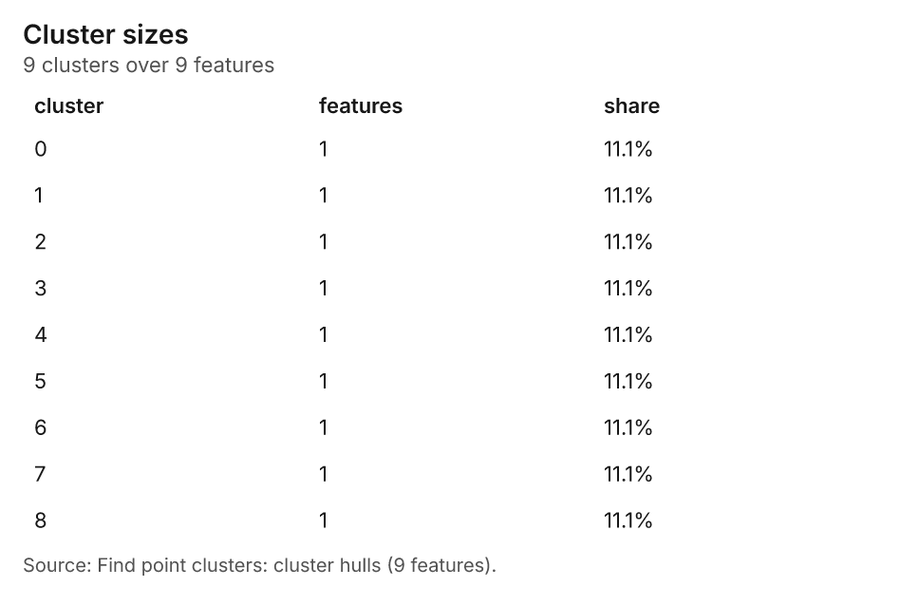
| Find point clusters: cluster hulls | layer, Polygon | 9 | 122 | ||
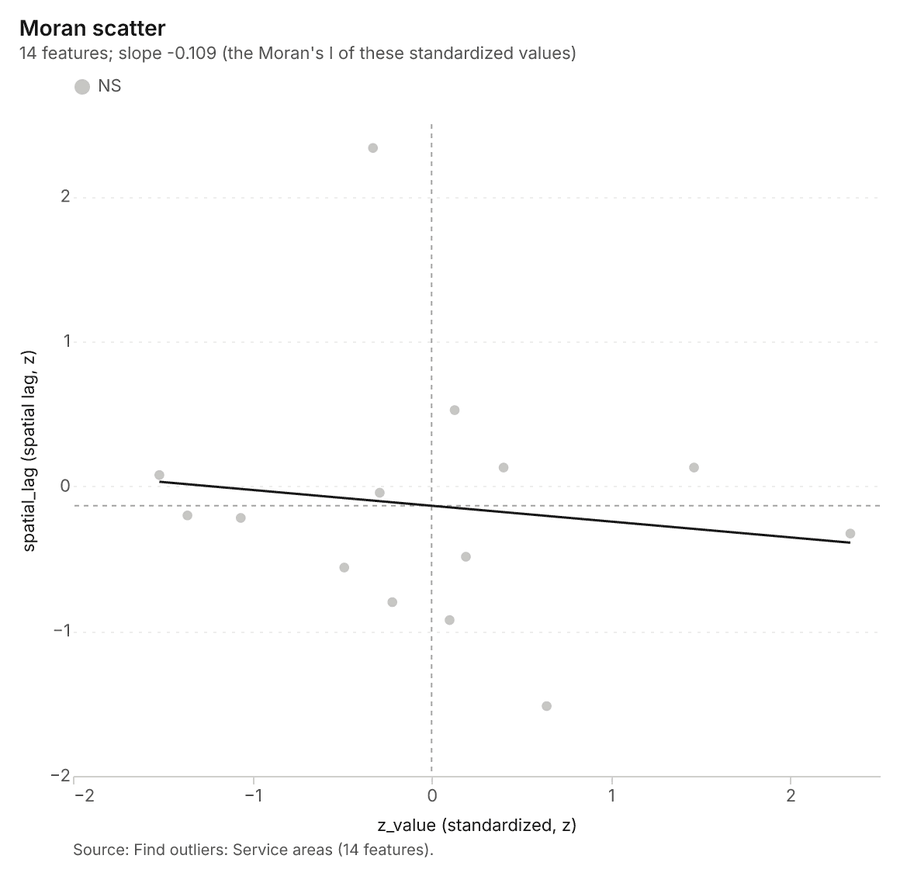
| Find outliers: Service areas | layer, Polygon | 14 | 123 | ||
| Repeat and near repeat classification: Outages | layer, Point | 1,650 | 124 |
Timeline
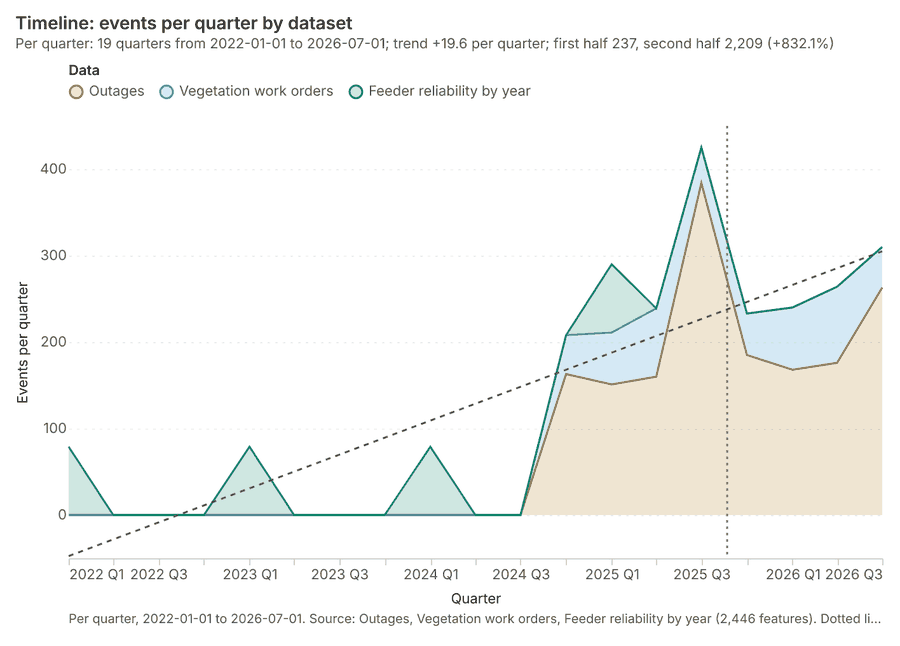
The timeline counts 2,446 dated events in Outages, Vegetation work orders, Feeder reliability by year per quarter, from Q1 2022 to Q3 2026 1234. By dataset: Outages 1,650; Vegetation work orders 480; Feeder reliability by year 316 1. The trend is +19.6 events per quarter; the second half of the quarters has 2,209 against 237 in the first (+832.1%) 1. 8 of the 19 quarters had no events 1. The project's documents name 1 date inside this span, drawn as dotted lines; the most named is 2025-08-22 (Storm season reliability report, page 1, 1 mention) 5.
Busiest quarters
Quietest quarters with events
Space time hot spots
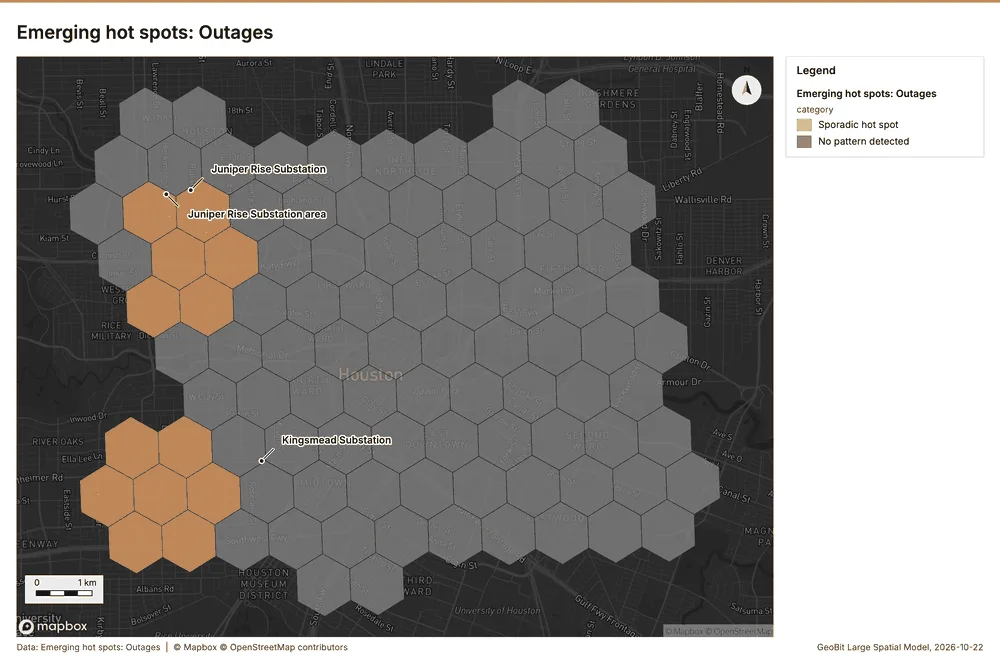
What this analysis is. Emerging hot spots: Where hot spots are new, consecutive, intensifying, persistent, diminishing, sporadic, oscillating or historical over time 6. In ArcGIS it is Emerging Hot Spot Analysis or Create Space Time Cube 6.
Why it was run on this data. Outages carry dates in 'started_at': emerging hot spot analysis finds new, intensifying and fading hot spots per month 7.
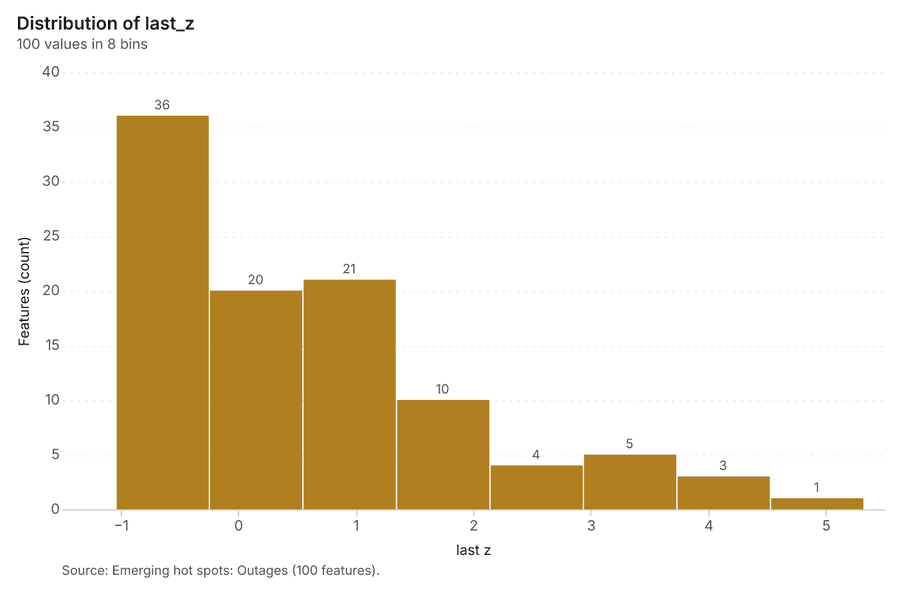
What it found. The gp_space_time_hot_spots tool utilized the Outages input 9 and generated a result with 100 features 8.
| Result | Value |
|---|---|
| result, count | 100 |
| result, elapsed ms | 17 |
| result, resolution | 8 |
| result, features used | 1,650 |
| result, time neighbors | 0 |
| billing, cost | 0.1825 |
| billing, list price | 0.1825 |
| billing, upstream cost | 0 |
Findings
- Evidenced: Space time hot spots on Outages: Emerging hot spots: 1 layer saved: Emerging hot spots: Outages (100 features) 89.
- Evidenced: It reported result, count 100; result, elapsed ms 17; result, resolution 8; result, features used 1,650; result, time neighbors 0; billing, cost 0.1825 8.
Tool gp_space_time_hot_spots; parameters {"agg": "sum", "project": "99e378b8-9e64-42f5-8930-fca7c2a73f57", "features": {"layer": "Outages (74249532)"}, "interval": "month", "bin_shape": "h3", "resolution": 8, "time_field": "started_at", "value_field": "customers_affected"}
Space time hot spots
What this analysis is. Emerging hot spots: Where hot spots are new, consecutive, intensifying, persistent, diminishing, sporadic, oscillating or historical over time 6. In ArcGIS it is Emerging Hot Spot Analysis or Create Space Time Cube 6.
Why it was run on this data. Vegetation work orders carry dates in 'date': emerging hot spot analysis finds new, intensifying and fading hot spots per month 10.
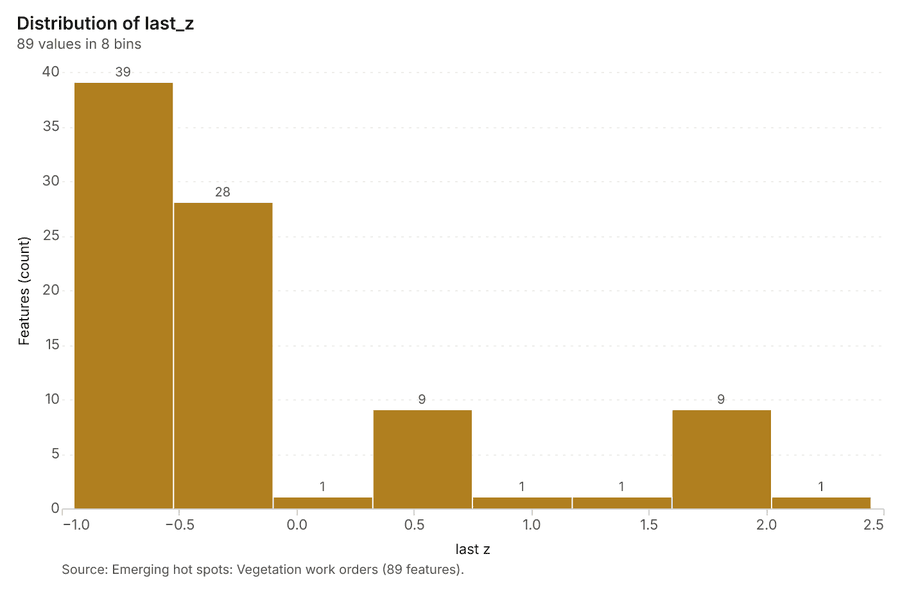
What it found. Space time hot spots on Vegetation work orders: Emerging hot spots: 1 layer saved: Emerging hot spots: Vegetation work orders (89 features) 1112. It reported result, count 89; result, elapsed ms 12; result, resolution 8; result, features used 480; result, time neighbors 0; billing, cost 0.124 11.
| Result | Value |
|---|---|
| result, count | 89 |
| result, elapsed ms | 12 |
| result, resolution | 8 |
| result, features used | 480 |
| result, time neighbors | 0 |
| billing, cost | 0.124 |
| billing, list price | 0.124 |
| billing, upstream cost | 0 |
Findings
- Evidenced: Space time hot spots on Vegetation work orders: Emerging hot spots: 1 layer saved: Emerging hot spots: Vegetation work orders (89 features) 1112.
- Evidenced: It reported result, count 89; result, elapsed ms 12; result, resolution 8; result, features used 480; result, time neighbors 0; billing, cost 0.124 11.
Tool gp_space_time_hot_spots; parameters {"project": "99e378b8-9e64-42f5-8930-fca7c2a73f57", "features": {"layer": "Vegetation work orders (d3eba75a)"}, "interval": "month", "bin_shape": "h3", "resolution": 8, "time_field": "date"}
Hot spots
What this analysis is. Hot spot analysis: Getis-Ord Gi* hot and cold spots with z-scores, p-values and confidence bins 13. In ArcGIS it is Find Hot Spots or Hot Spot Analysis (Getis-Ord Gi*); in QGIS, qgis:hotspot (plugin) 13.
Why it was run on this data. 450 points: Getis-Ord Gi* tests whether the concentrations in Poles are statistically significant 14.
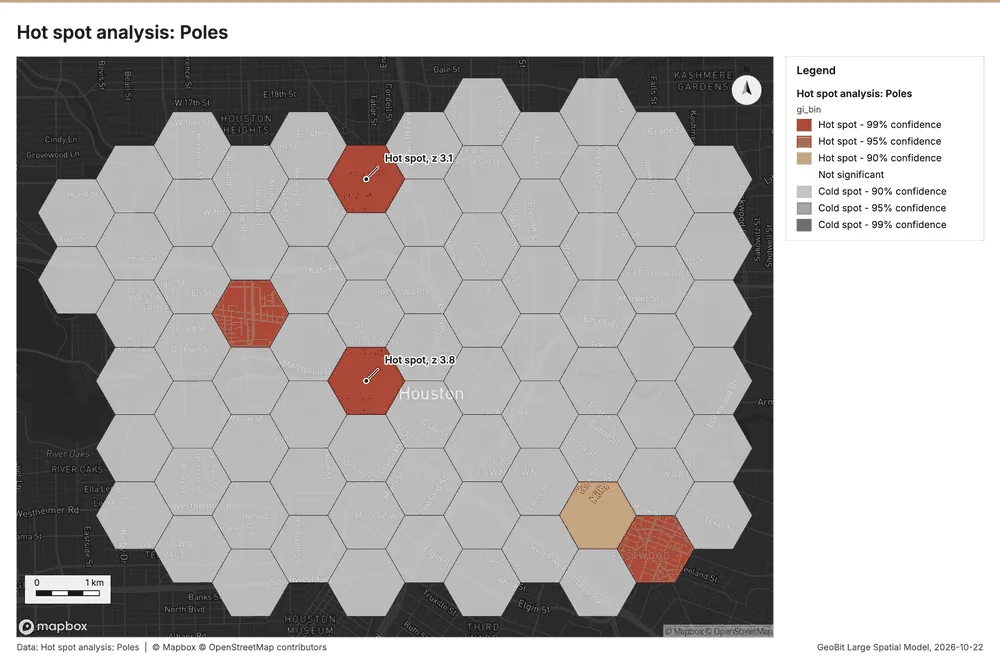
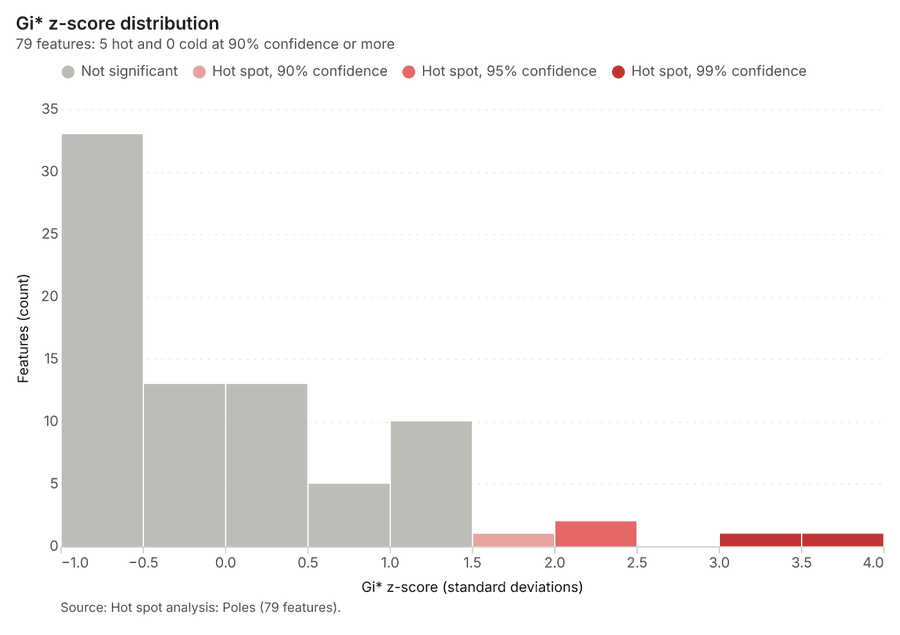
What it found. Hot spots on Poles: Hot spot analysis: 1 layer saved: Hot spot analysis: Poles (79 features) 1516. It reported result, bins 79; result, count 79; result, elapsed ms 5; result, cell size m 1,000; result, incidents used 450; result, distance band m 1,000 15.
| Result | Value |
|---|---|
| result, bins | 79 |
| result, count | 79 |
| result, elapsed ms | 5 |
| result, cell size m | 1,000 |
| result, incidents used | 450 |
| result, distance band m | 1,000 |
| billing, cost | 0.059 |
| billing, list price | 0.059 |
| billing, upstream cost | 0 |
Findings
- Evidenced: Hot spots on Poles: Hot spot analysis: 1 layer saved: Hot spot analysis: Poles (79 features) 1516.
- Evidenced: It reported result, bins 79; result, count 79; result, elapsed ms 5; result, cell size m 1,000; result, incidents used 450; result, distance band m 1,000 15.
Tool gp_hot_spots; parameters {"project": "99e378b8-9e64-42f5-8930-fca7c2a73f57", "features": {"layer": "Poles (cb7cbff1)"}, "aggregation": "hexagon", "cell_size_m": 1000.0, "distance_band_m": 1000.0}
Hot spots
What this analysis is. Hot spot analysis: Getis-Ord Gi* hot and cold spots with z-scores, p-values and confidence bins 13. In ArcGIS it is Find Hot Spots or Hot Spot Analysis (Getis-Ord Gi*); in QGIS, qgis:hotspot (plugin) 13.
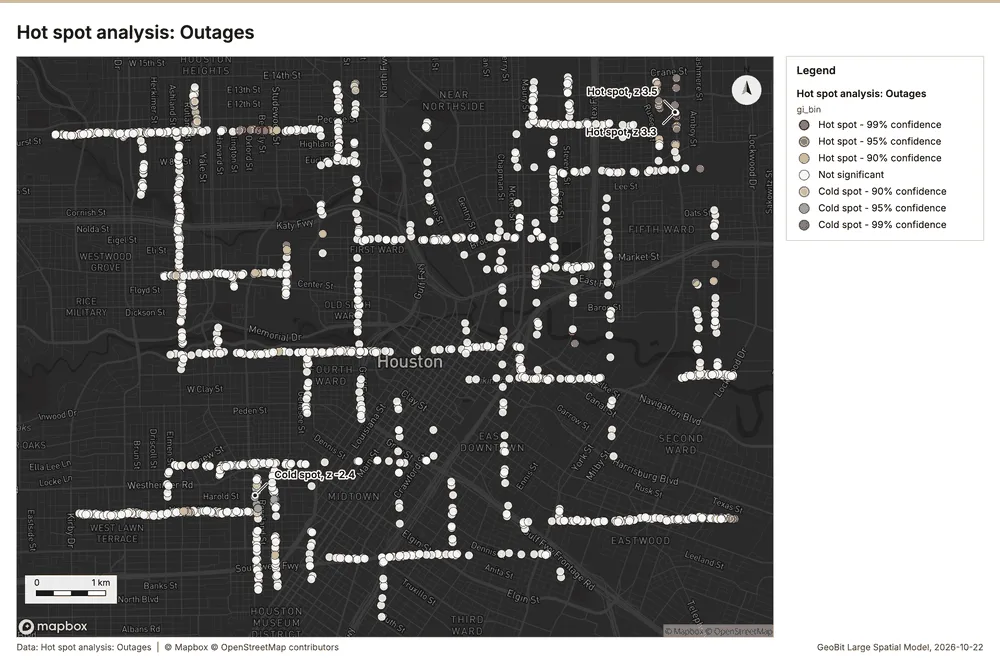
Why it was run on this data. 1650 points: Getis-Ord Gi* tests whether the concentrations in Outages are statistically significant 17.
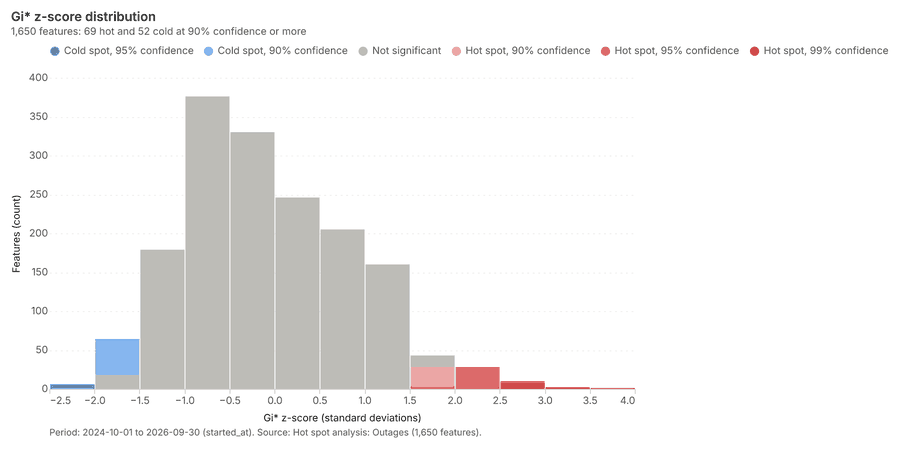
What it found. The hot spot analysis used the Outages layer as the input data 9. The analysis generated a total of 1,650 features, with the process completing in 27 ms 18.
| Result | Value |
|---|---|
| result, count | 1,650 |
| result, elapsed ms | 27 |
| result, excluded null | 0 |
| result, distance band m | 500 |
| billing, cost | 0.083 |
| billing, list price | 0.083 |
| billing, upstream cost | 0 |
Findings
- Evidenced: Hot spots on Outages: Hot spot analysis: 1 layer saved: Hot spot analysis: Outages (1650 features) 918.
- Evidenced: It reported result, count 1,650; result, elapsed ms 27; result, excluded null 0; result, distance band m 500; billing, cost 0.083; billing, list price 0.083 18.
Tool gp_hot_spots; parameters {"field": "customers_affected", "project": "99e378b8-9e64-42f5-8930-fca7c2a73f57", "features": {"layer": "Outages (74249532)"}, "aggregation": "hexagon", "cell_size_m": 500.0, "distance_band_m": 500.0}
Hot spots
What this analysis is. Hot spot analysis: Getis-Ord Gi* hot and cold spots with z-scores, p-values and confidence bins 13. In ArcGIS it is Find Hot Spots or Hot Spot Analysis (Getis-Ord Gi*); in QGIS, qgis:hotspot (plugin) 13.
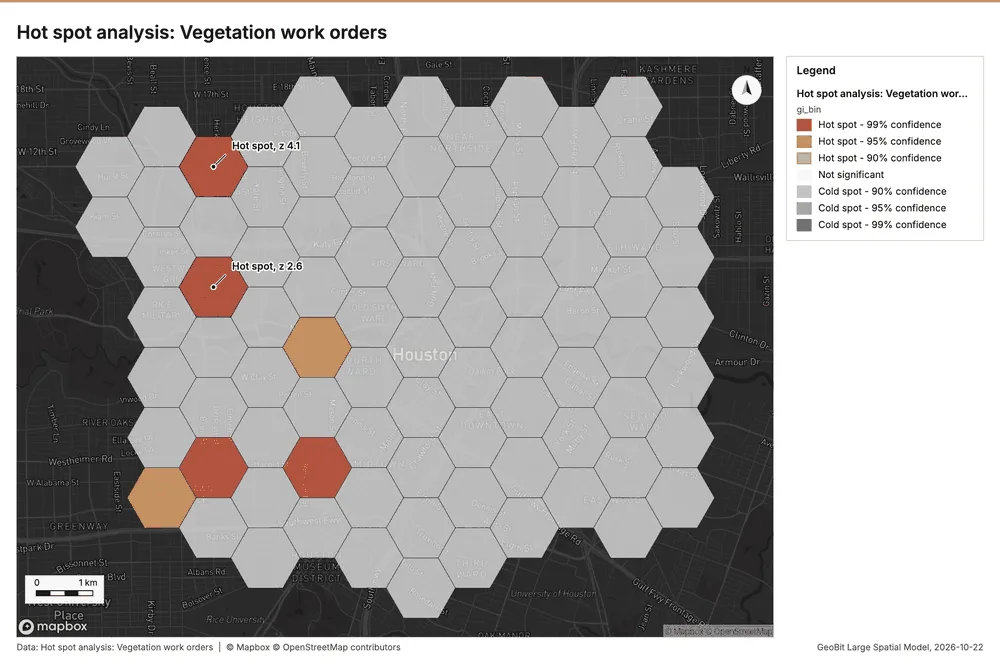
Why it was run on this data. 480 points: Getis-Ord Gi* tests whether the concentrations in Vegetation work orders are statistically significant 19.
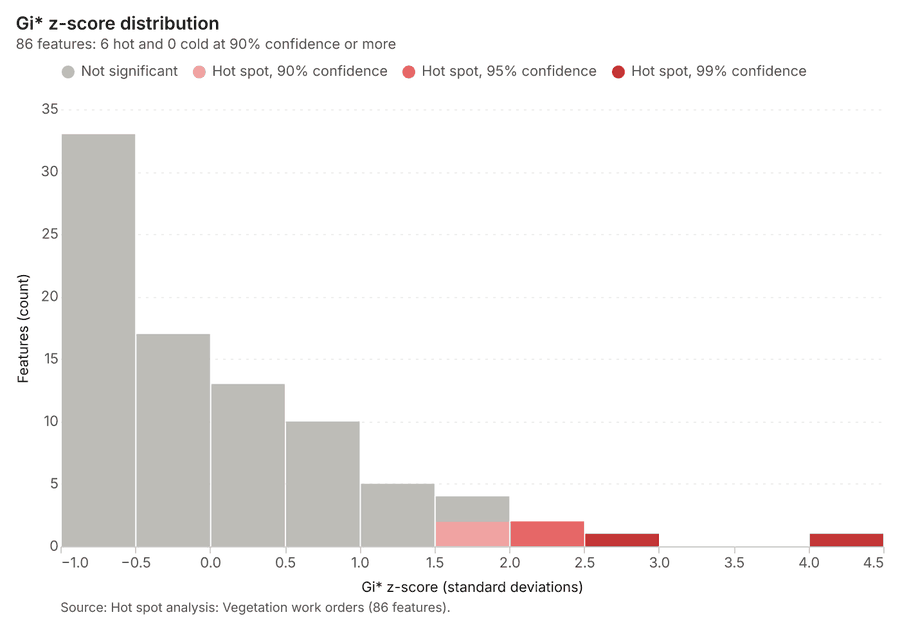
What it found. Hot spots on Vegetation work orders: Hot spot analysis: 1 layer saved: Hot spot analysis: Vegetation work orders (86 features) 1220. It reported result, bins 86; result, count 86; result, elapsed ms 6; result, cell size m 1,000; result, incidents used 480; result, distance band m 1,000 20.
| Result | Value |
|---|---|
| result, bins | 86 |
| result, count | 86 |
| result, elapsed ms | 6 |
| result, cell size m | 1,000 |
| result, incidents used | 480 |
| result, distance band m | 1,000 |
| billing, cost | 0.0596 |
| billing, list price | 0.0596 |
| billing, upstream cost | 0 |
Findings
- Evidenced: Hot spots on Vegetation work orders: Hot spot analysis: 1 layer saved: Hot spot analysis: Vegetation work orders (86 features) 1220.
- Evidenced: It reported result, bins 86; result, count 86; result, elapsed ms 6; result, cell size m 1,000; result, incidents used 480; result, distance band m 1,000 20.
Tool gp_hot_spots; parameters {"project": "99e378b8-9e64-42f5-8930-fca7c2a73f57", "features": {"layer": "Vegetation work orders (d3eba75a)"}, "aggregation": "hexagon", "cell_size_m": 1000.0, "distance_band_m": 1000.0}
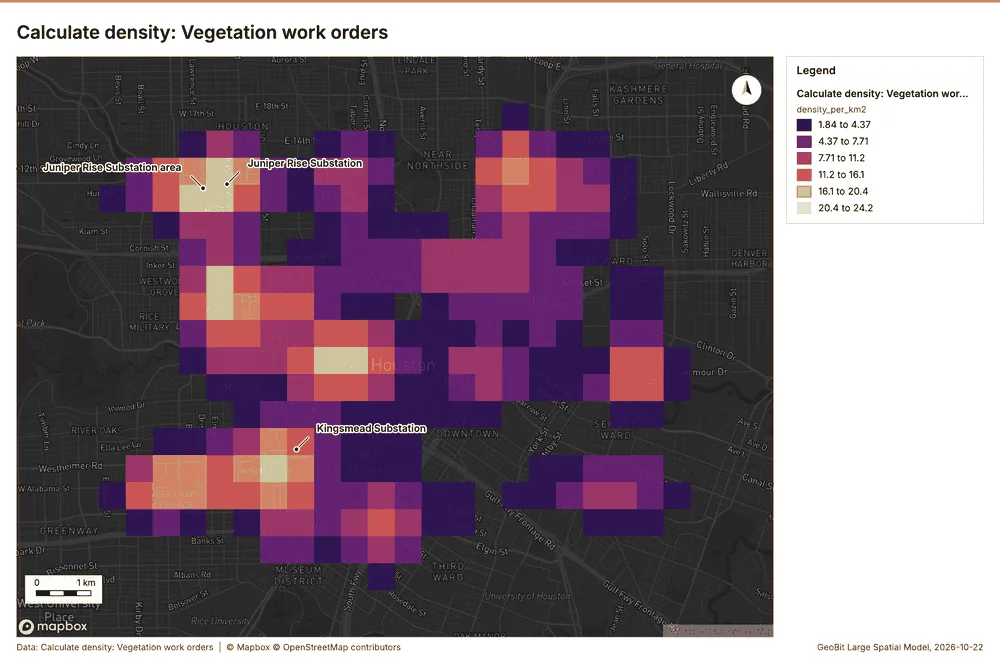
Calculate density
What this analysis is. Calculate density: Kernel density per square kilometer on a grid 21. In ArcGIS it is Calculate Density or Kernel Density; in QGIS, native:heatmapkerneldensityestimation 21.
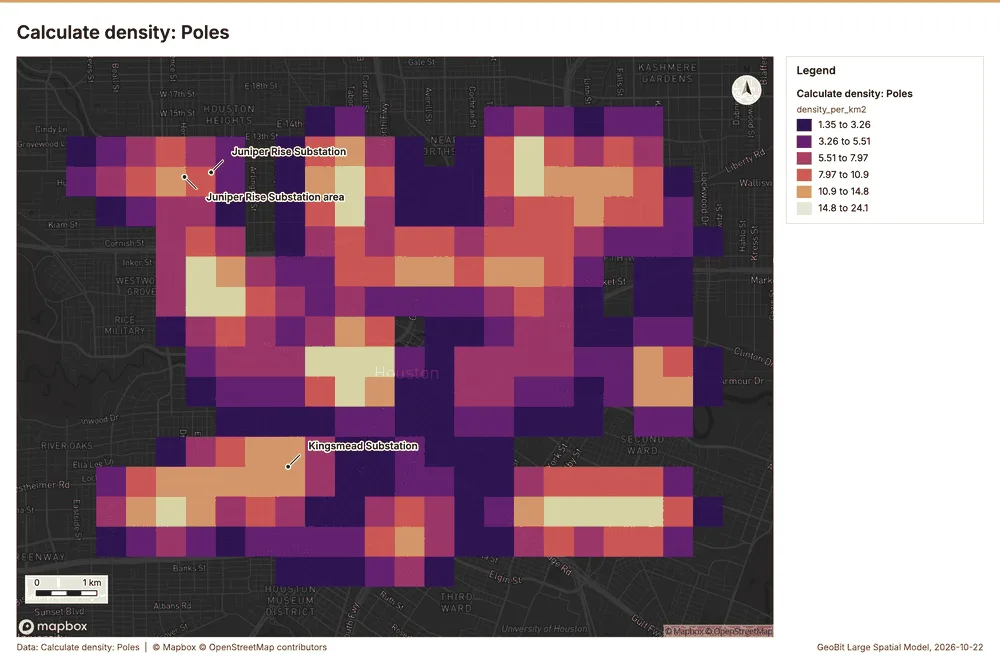
Why it was run on this data. 450 points in Poles: a density surface shows where they concentrate 22.
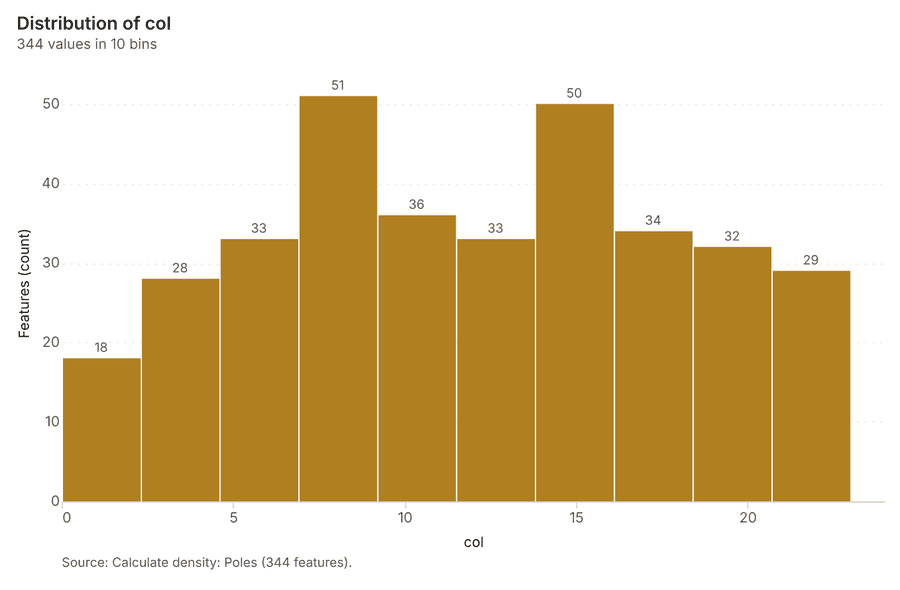
What it found. Calculate density on Poles: Calculate density: 1 layer saved: Calculate density: Poles (344 features) 1623. It reported result, count 344; result, elapsed ms 10; result, bandwidth m 1,000; result, cell size m 500; result, excluded null 0; result, max density per km2 24.11 23.
| Result | Value |
|---|---|
| result, count | 344 |
| result, elapsed ms | 10 |
| result, bandwidth m | 1,000 |
| result, cell size m | 500 |
| result, excluded null | 0 |
| result, max density per km2 | 24.11 |
| billing, cost | 0.059 |
| billing, list price | 0.059 |
| billing, upstream cost | 0 |
Findings
- Evidenced: Calculate density on Poles: Calculate density: 1 layer saved: Calculate density: Poles (344 features) 1623.
- Evidenced: It reported result, count 344; result, elapsed ms 10; result, bandwidth m 1,000; result, cell size m 500; result, excluded null 0; result, max density per km2 24.11 23.
A model draft was discarded because a sentence did not cite a source of this section.
Tool gp_calculate_density; parameters {"kernel": "quartic", "project": "99e378b8-9e64-42f5-8930-fca7c2a73f57", "features": {"layer": "Poles (cb7cbff1)"}, "bandwidth_m": 1000.0, "cell_size_m": 500.0}
Calculate density
What this analysis is. Calculate density: Kernel density per square kilometer on a grid 21. In ArcGIS it is Calculate Density or Kernel Density; in QGIS, native:heatmapkerneldensityestimation 21.
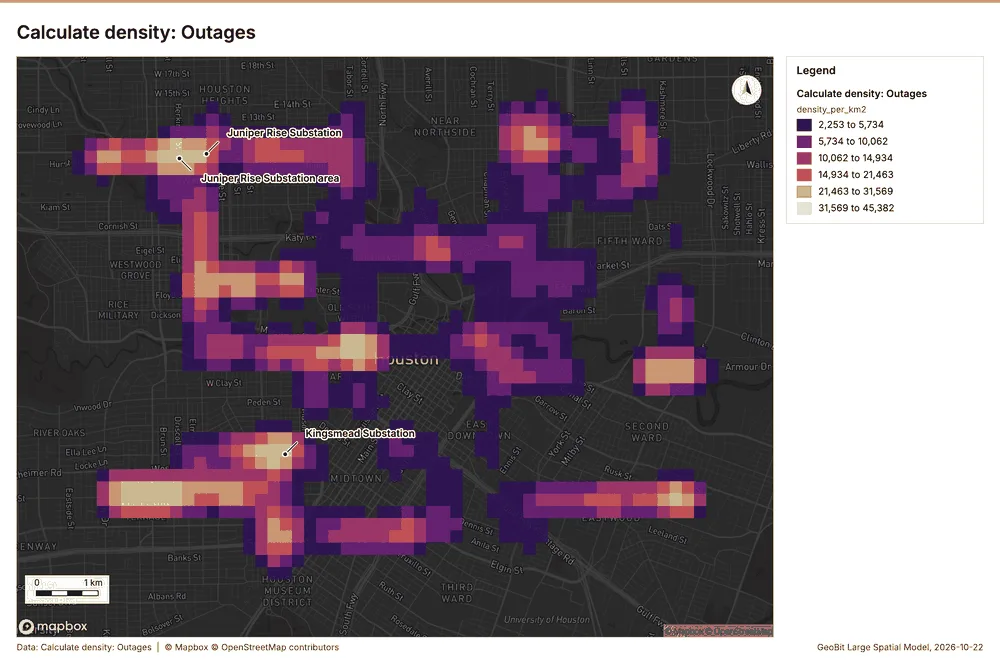
Why it was run on this data. 1650 points in Outages: a density surface shows where they concentrate 24.
What it found. Calculate density on Outages: Calculate density: 1 layer saved: Calculate density: Outages (1588 features) 925. It reported result, count 1,588; result, elapsed ms 45; result, bandwidth m 500; result, cell size m 200; result, excluded null 0; result, max density per km2 4.538e+04 25.
| Result | Value |
|---|---|
| result, count | 1,588 |
| result, elapsed ms | 45 |
| result, bandwidth m | 500 |
| result, cell size m | 200 |
| result, excluded null | 0 |
| result, max density per km2 | 4.538e+04 |
| billing, cost | 0.083 |
| billing, list price | 0.083 |
| billing, upstream cost | 0 |
Findings
- Evidenced: Calculate density on Outages: Calculate density: 1 layer saved: Calculate density: Outages (1588 features) 925.
- Evidenced: It reported result, count 1,588; result, elapsed ms 45; result, bandwidth m 500; result, cell size m 200; result, excluded null 0; result, max density per km2 4.538e+04 25.
Tool gp_calculate_density; parameters {"kernel": "quartic", "project": "99e378b8-9e64-42f5-8930-fca7c2a73f57", "features": {"layer": "Outages (74249532)"}, "bandwidth_m": 500.0, "cell_size_m": 200.0, "weight_field": "customers_affected"}
Calculate density
What this analysis is. Calculate density: Kernel density per square kilometer on a grid 21. In ArcGIS it is Calculate Density or Kernel Density; in QGIS, native:heatmapkerneldensityestimation 21.
Why it was run on this data. 480 points in Vegetation work orders: a density surface shows where they concentrate 26.
What it found. The maximum density calculated was 24.16 per km2 27.
| Result | Value |
|---|---|
| result, count | 350 |
| result, elapsed ms | 10 |
| result, bandwidth m | 1,000 |
| result, cell size m | 500 |
| result, excluded null | 0 |
| result, max density per km2 | 24.16 |
| billing, cost | 0.0596 |
| billing, list price | 0.0596 |
| billing, upstream cost | 0 |
Findings
- Evidenced: Calculate density on Vegetation work orders: Calculate density: 1 layer saved: Calculate density: Vegetation work orders (350 features) 1227.
- Evidenced: It reported result, count 350; result, elapsed ms 10; result, bandwidth m 1,000; result, cell size m 500; result, excluded null 0; result, max density per km2 24.16 27.
Tool gp_calculate_density; parameters {"kernel": "quartic", "project": "99e378b8-9e64-42f5-8930-fca7c2a73f57", "features": {"layer": "Vegetation work orders (d3eba75a)"}, "bandwidth_m": 1000.0, "cell_size_m": 500.0}
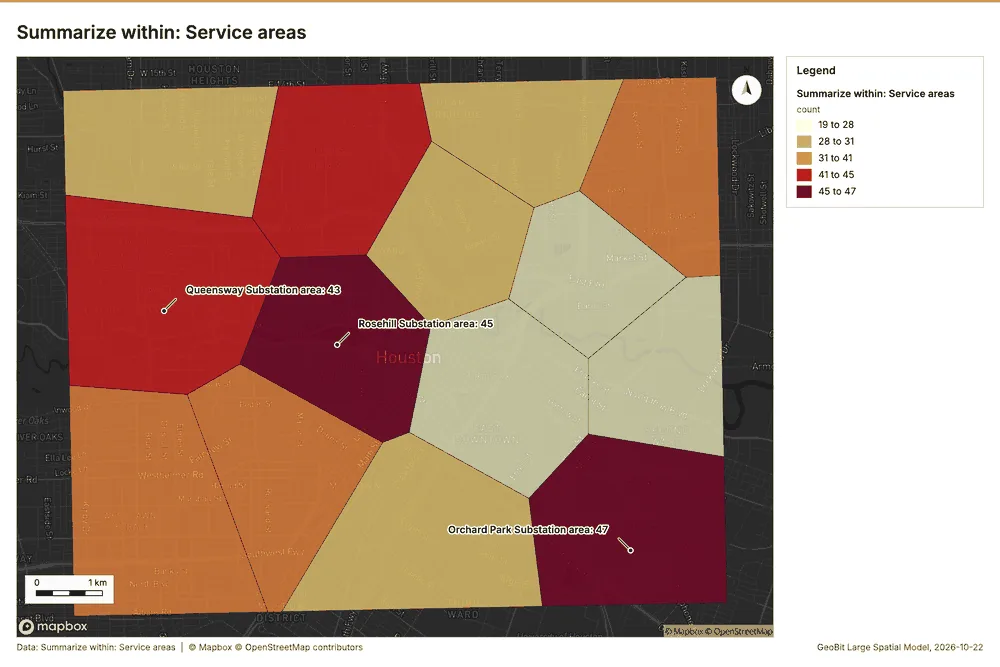
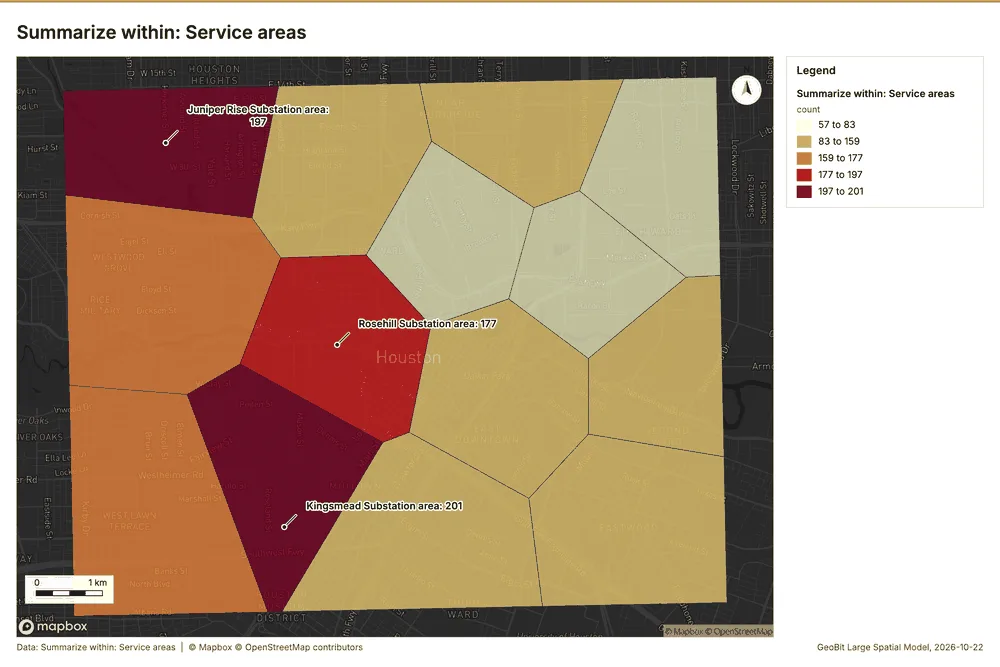
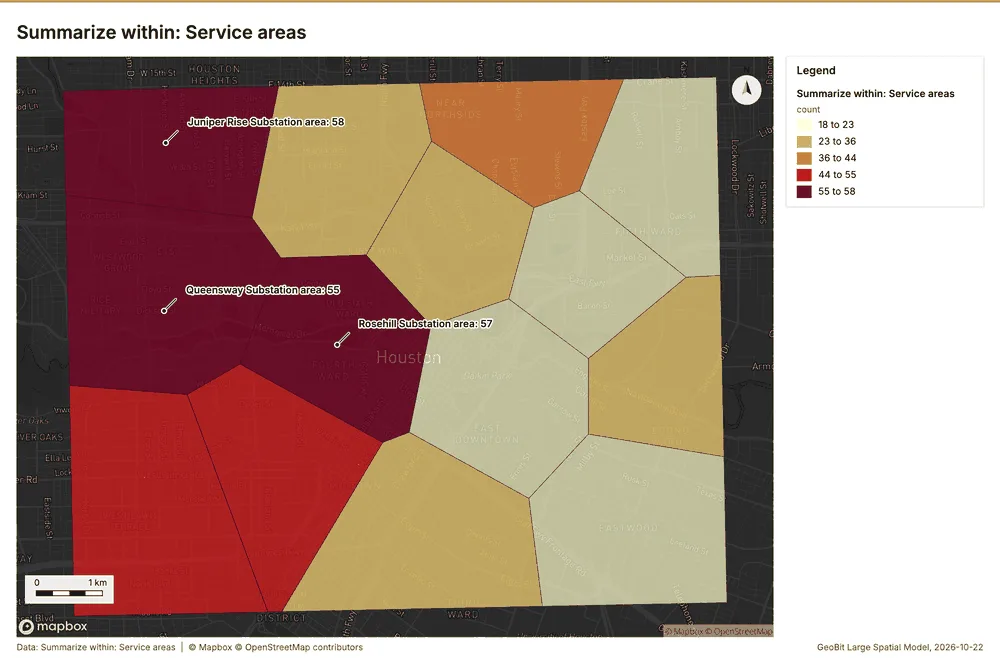
Summarize within
What this analysis is. Summarize within: Count and aggregate the features inside each polygon (or bin), proportionally for lines and polygons 28. In ArcGIS it is Summarize Within or Aggregate Points; in QGIS, native:countpointsinpolygon or native:sumlinelengths 28.
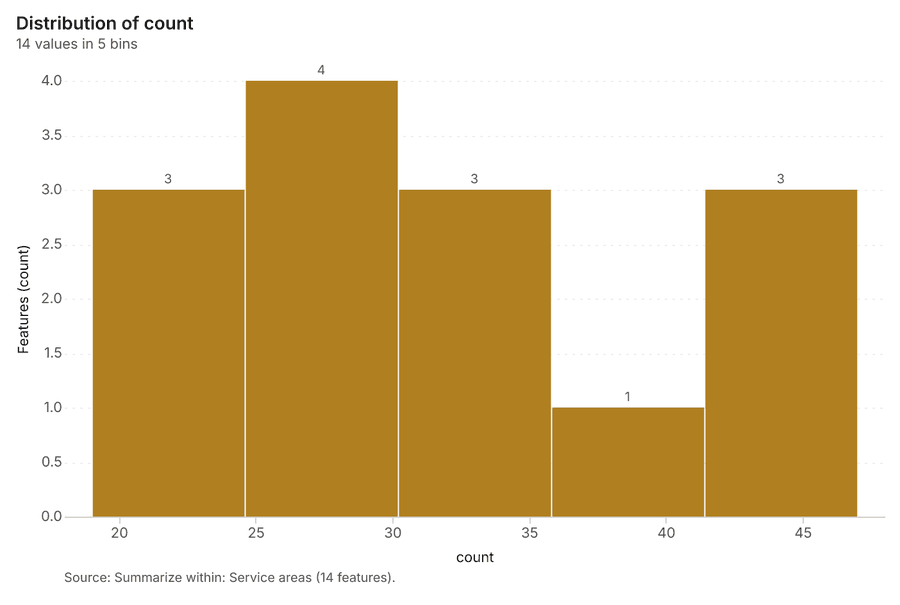
Why it was run on this data. Count Poles inside each feature of Service areas by material; the counts map as a choropleth (natural breaks, sequential colors) 29.
What it found. Summarize within on Poles, Service areas: Summarize within: 1 layer saved: Summarize within: Service areas (14 features) 163031. It reported result, count 14; result, elapsed ms 1; billing, cost 0.0193; billing, list price 0.0193; billing, upstream cost 0 30.
| Result | Value |
|---|---|
| result, count | 14 |
| result, elapsed ms | 1 |
| billing, cost | 0.0193 |
| billing, list price | 0.0193 |
| billing, upstream cost | 0 |
Findings
- Evidenced: Summarize within on Poles, Service areas: Summarize within: 1 layer saved: Summarize within: Service areas (14 features) 163031.
- Evidenced: It reported result, count 14; result, elapsed ms 1; billing, cost 0.0193; billing, list price 0.0193; billing, upstream cost 0 30.
Tool gp_summarize_within; parameters {"stats": [{"stat": "sum", "field": "install_year"}], "project": "99e378b8-9e64-42f5-8930-fca7c2a73f57", "features": {"layer": "Poles (cb7cbff1)"}, "group_by": "material", "polygons": {"layer": "Service areas (af824cfb)"}}
Summarize within
What this analysis is. Summarize within: Count and aggregate the features inside each polygon (or bin), proportionally for lines and polygons 28. In ArcGIS it is Summarize Within or Aggregate Points; in QGIS, native:countpointsinpolygon or native:sumlinelengths 28.
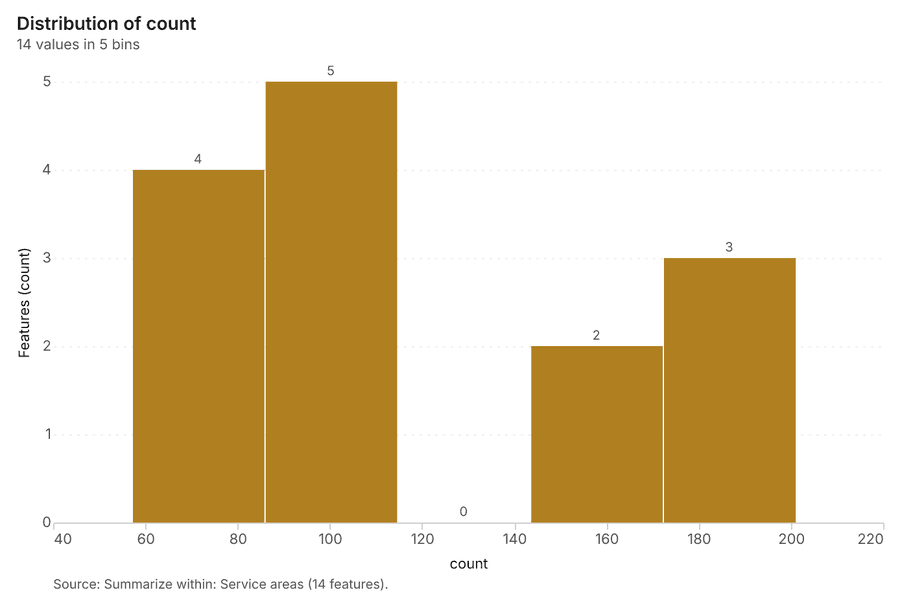
Why it was run on this data. Count Poles inside each feature of Service areas by material; the counts map as a choropleth (natural breaks, sequential colors) 29.
What it found. Summarize within on Outages, Service areas: Summarize within: 1 layer saved: Summarize within: Service areas (14 features) 93132. It reported result, count 14; result, elapsed ms 3; billing, cost 0.0433; billing, list price 0.0433; billing, upstream cost 0 32.
| Result | Value |
|---|---|
| result, count | 14 |
| result, elapsed ms | 3 |
| billing, cost | 0.0433 |
| billing, list price | 0.0433 |
| billing, upstream cost | 0 |
Findings
- Evidenced: Summarize within on Outages, Service areas: Summarize within: 1 layer saved: Summarize within: Service areas (14 features) 93132.
- Evidenced: It reported result, count 14; result, elapsed ms 3; billing, cost 0.0433; billing, list price 0.0433; billing, upstream cost 0 32.
Tool gp_summarize_within; parameters {"stats": [{"stat": "sum", "field": "customers_affected"}], "project": "99e378b8-9e64-42f5-8930-fca7c2a73f57", "features": {"layer": "Outages (74249532)"}, "group_by": "cause", "polygons": {"layer": "Service areas (af824cfb)"}}
Summarize within
What this analysis is. Summarize within: Count and aggregate the features inside each polygon (or bin), proportionally for lines and polygons 28. In ArcGIS it is Summarize Within or Aggregate Points; in QGIS, native:countpointsinpolygon or native:sumlinelengths 28.
Why it was run on this data. Count Poles inside each feature of Service areas by material; the counts map as a choropleth (natural breaks, sequential colors) 29.
What it found. Summarize within on Vegetation work orders, Service areas: Summarize within: 1 layer saved: Summarize within: Service areas (14 features) 123133. It reported result, count 14; result, elapsed ms 1; billing, cost 0.0199; billing, list price 0.0199; billing, upstream cost 0 33.
| Result | Value |
|---|---|
| result, count | 14 |
| result, elapsed ms | 1 |
| billing, cost | 0.0199 |
| billing, list price | 0.0199 |
| billing, upstream cost | 0 |
Findings
- Evidenced: Summarize within on Vegetation work orders, Service areas: Summarize within: 1 layer saved: Summarize within: Service areas (14 features) 123133.
- Evidenced: It reported result, count 14; result, elapsed ms 1; billing, cost 0.0199; billing, list price 0.0199; billing, upstream cost 0 33.
Tool gp_summarize_within; parameters {"stats": [{"stat": "sum", "field": "spans"}], "project": "99e378b8-9e64-42f5-8930-fca7c2a73f57", "features": {"layer": "Vegetation work orders (d3eba75a)"}, "group_by": "trim_type", "polygons": {"layer": "Service areas (af824cfb)"}}
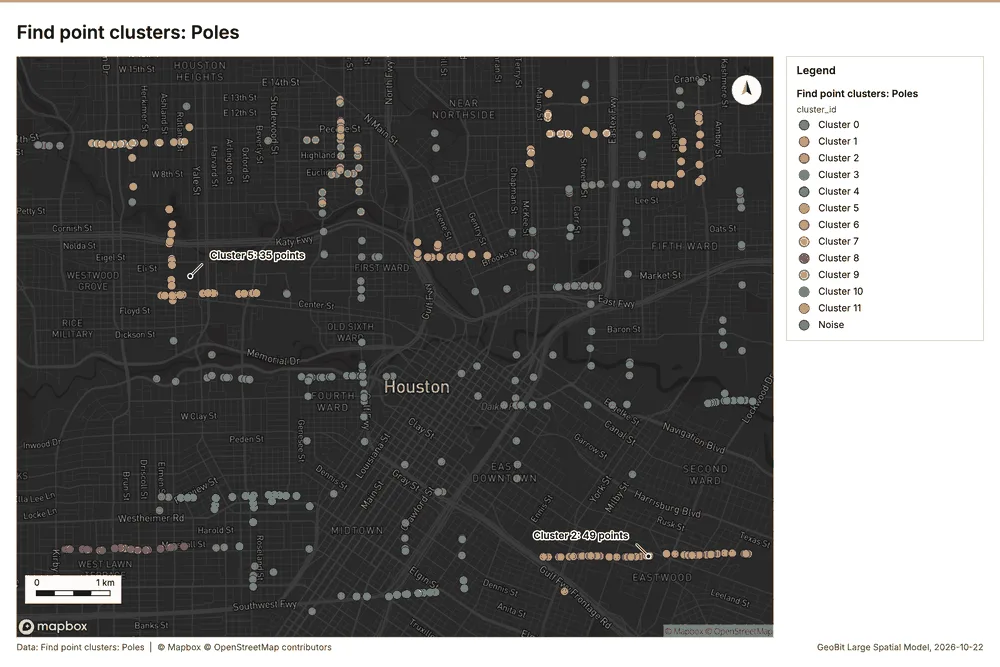
Find point clusters
What this analysis is. Find point clusters: Density-based clusters (DBSCAN, HDBSCAN or OPTICS, optionally space-time) with hulls and noise 34. In ArcGIS it is Find Point Clusters or Density-based Clustering; in QGIS, native:dbscanclustering or native:stdbscanclustering 34.
Why it was run on this data. DBSCAN finds dense groups of Poles and separates noise 35.
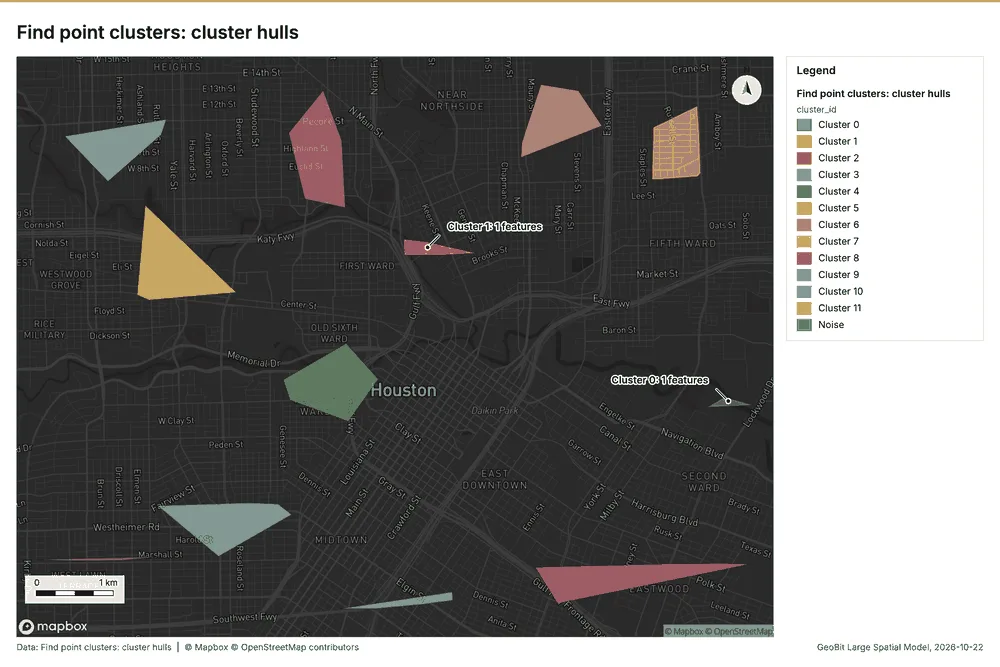
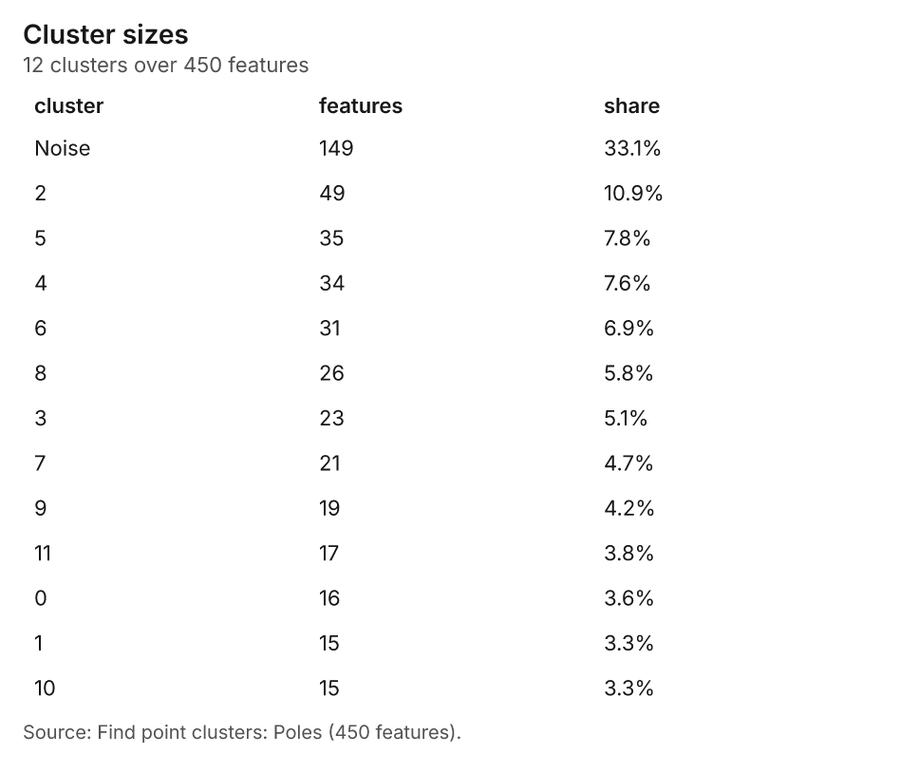
What it found. Find point clusters on Poles: Find point clusters: 2 layers saved: Find point clusters: Poles (450 features); Find point clusters: cluster hulls (12 features) 1636. It reported result, count 450; result, noise 149; result, distance m 500; result, elapsed ms 9; result, min points 11; billing, cost 0.059 36.
| Result | Value |
|---|---|
| result, count | 450 |
| result, noise | 149 |
| result, distance m | 500 |
| result, elapsed ms | 9 |
| result, min points | 11 |
| billing, cost | 0.059 |
| billing, list price | 0.059 |
| billing, upstream cost | 0 |
Findings
- Evidenced: Find point clusters on Poles: Find point clusters: 2 layers saved: Find point clusters: Poles (450 features); Find point clusters: cluster hulls (12 features) 1636.
- Evidenced: It reported result, count 450; result, noise 149; result, distance m 500; result, elapsed ms 9; result, min points 11; billing, cost 0.059 36.
Tool gp_find_point_clusters; parameters {"method": "dbscan", "project": "99e378b8-9e64-42f5-8930-fca7c2a73f57", "features": {"layer": "Poles (cb7cbff1)"}, "distance_m": 500.0, "min_points": 11}
Find point clusters
What this analysis is. Find point clusters: Density-based clusters (DBSCAN, HDBSCAN or OPTICS, optionally space-time) with hulls and noise 34. In ArcGIS it is Find Point Clusters or Density-based Clustering; in QGIS, native:dbscanclustering or native:stdbscanclustering 34.
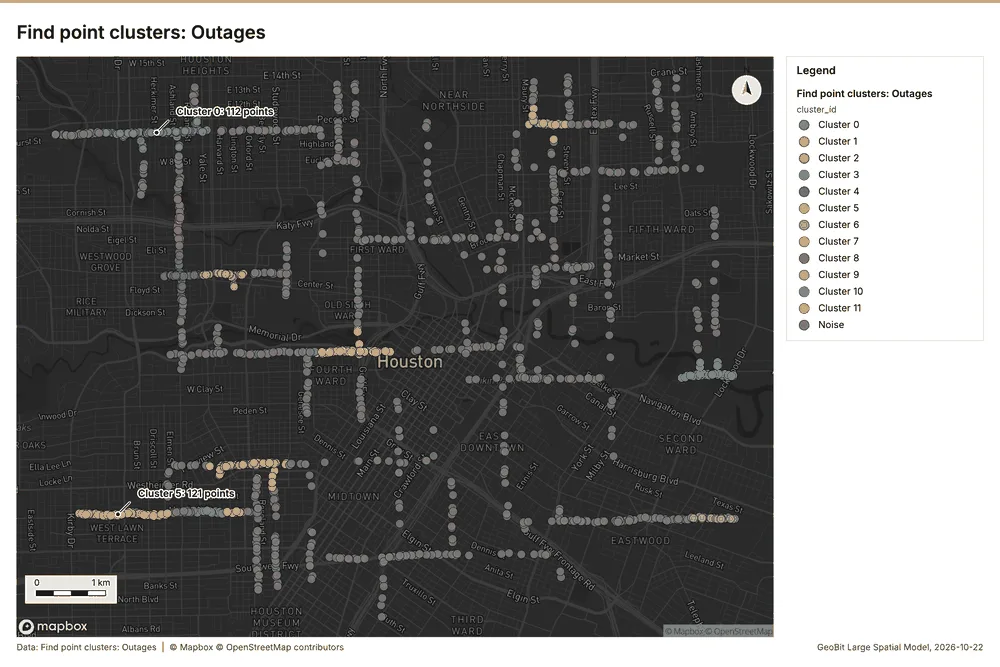
Why it was run on this data. DBSCAN finds dense groups of Outages and separates noise 37.
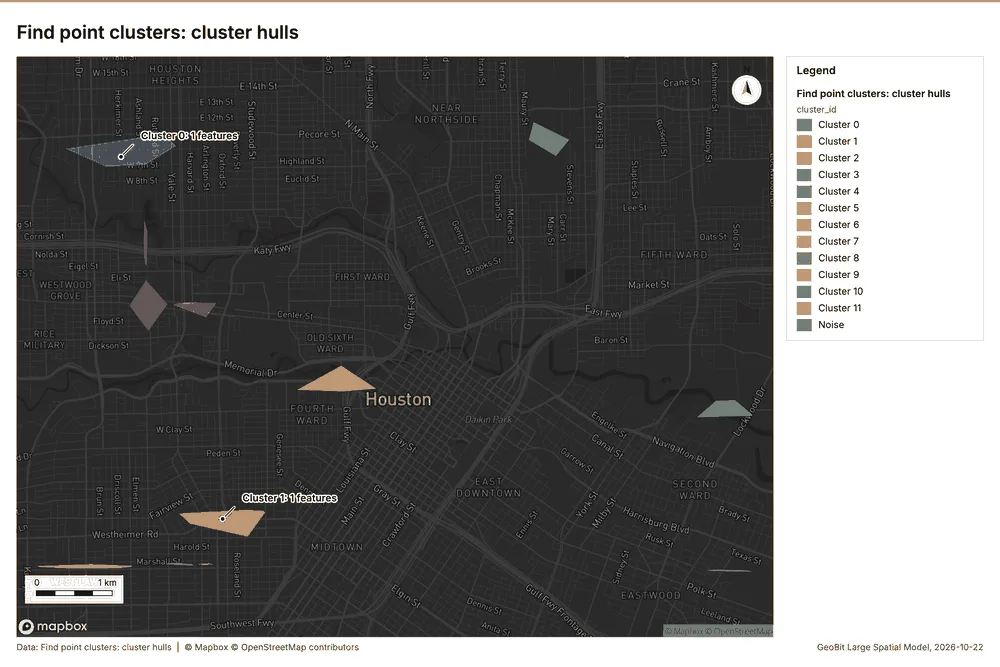
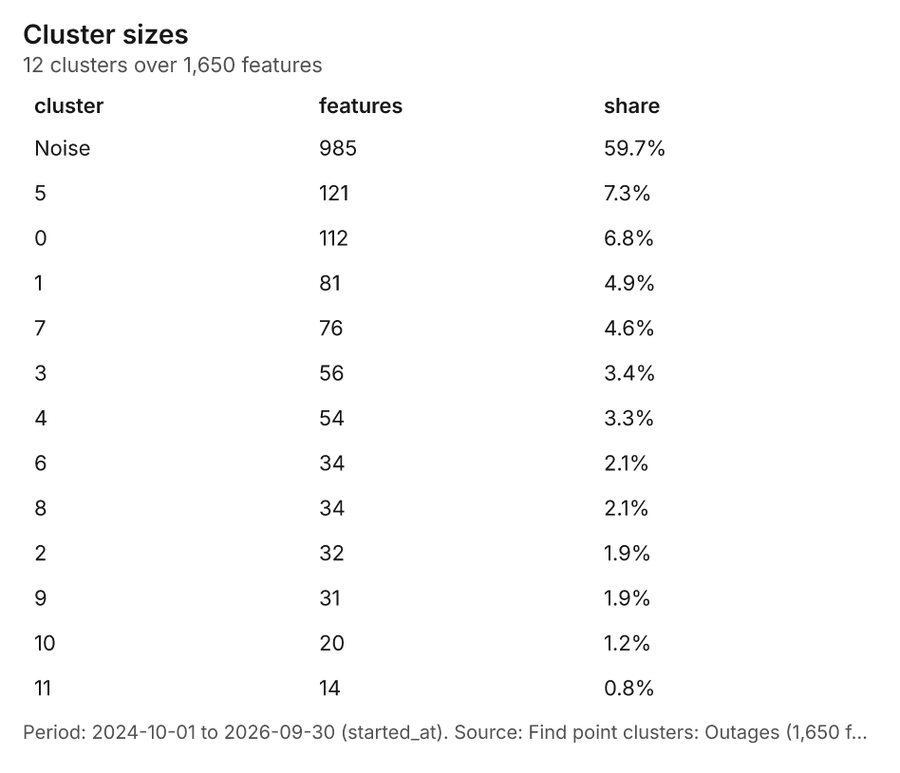
What it found. Find point clusters on Outages: Find point clusters: 2 layers saved: Find point clusters: Outages (1650 features); Find point clusters: cluster hulls (12 features) 938. It reported result, count 1,650; result, noise 985; result, distance m 200; result, elapsed ms 22; result, min points 20; billing, cost 0.083 38.
| Result | Value |
|---|---|
| result, count | 1,650 |
| result, noise | 985 |
| result, distance m | 200 |
| result, elapsed ms | 22 |
| result, min points | 20 |
| billing, cost | 0.083 |
| billing, list price | 0.083 |
| billing, upstream cost | 0 |
Findings
- Evidenced: Find point clusters on Outages: Find point clusters: 2 layers saved: Find point clusters: Outages (1650 features); Find point clusters: cluster hulls (12 features) 938.
- Evidenced: It reported result, count 1,650; result, noise 985; result, distance m 200; result, elapsed ms 22; result, min points 20; billing, cost 0.083 38.
Tool gp_find_point_clusters; parameters {"method": "dbscan", "project": "99e378b8-9e64-42f5-8930-fca7c2a73f57", "features": {"layer": "Outages (74249532)"}, "distance_m": 200.0, "min_points": 20}
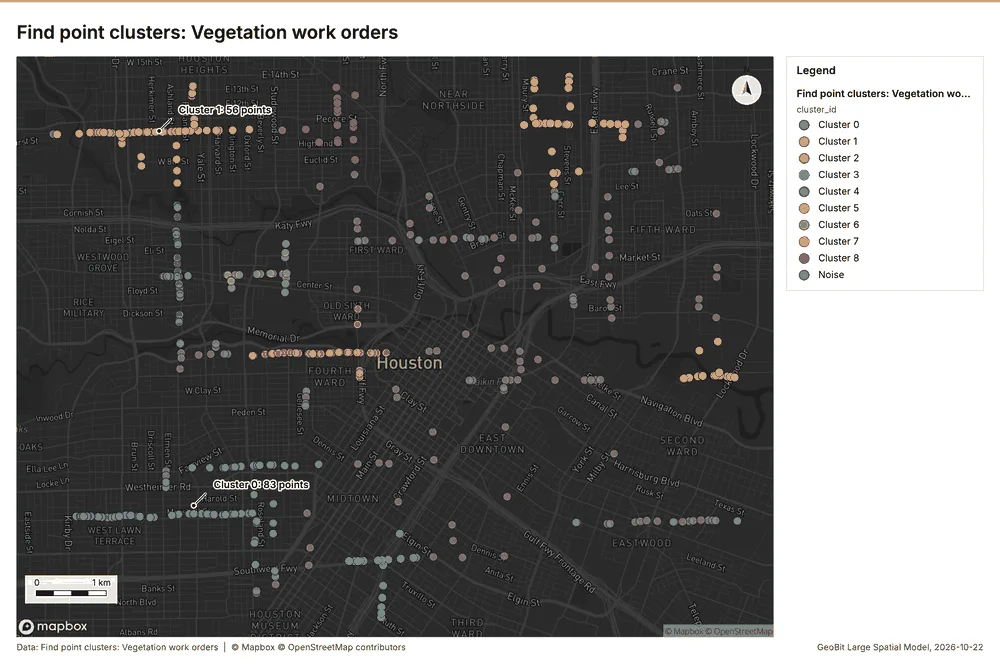
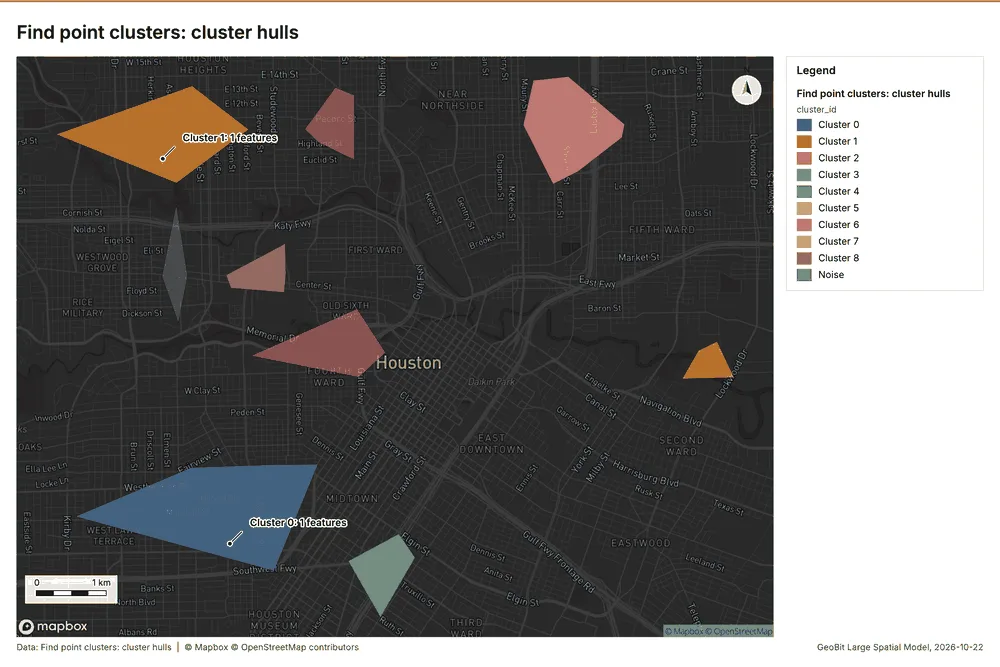
Find point clusters
What this analysis is. Find point clusters: Density-based clusters (DBSCAN, HDBSCAN or OPTICS, optionally space-time) with hulls and noise 34. In ArcGIS it is Find Point Clusters or Density-based Clustering; in QGIS, native:dbscanclustering or native:stdbscanclustering 34.
Why it was run on this data. DBSCAN finds dense groups of Vegetation work orders and separates noise 39.
What it found. Find point clusters on Vegetation work orders: Find point clusters: 2 layers saved: Find point clusters: Vegetation work orders (480 features); Find point clusters: cluster hulls (9 features) 1240. It reported result, count 480; result, noise 157; result, distance m 500; result, elapsed ms 9; result, min points 12; billing, cost 0.0596 40.
| Result | Value |
|---|---|
| result, count | 480 |
| result, noise | 157 |
| result, distance m | 500 |
| result, elapsed ms | 9 |
| result, min points | 12 |
| billing, cost | 0.0596 |
| billing, list price | 0.0596 |
| billing, upstream cost | 0 |
Findings
- Evidenced: Find point clusters on Vegetation work orders: Find point clusters: 2 layers saved: Find point clusters: Vegetation work orders (480 features); Find point clusters: cluster hulls (9 features) 1240.
- Evidenced: It reported result, count 480; result, noise 157; result, distance m 500; result, elapsed ms 9; result, min points 12; billing, cost 0.0596 40.
Tool gp_find_point_clusters; parameters {"method": "dbscan", "project": "99e378b8-9e64-42f5-8930-fca7c2a73f57", "features": {"layer": "Vegetation work orders (d3eba75a)"}, "distance_m": 500.0, "min_points": 12}
Outliers
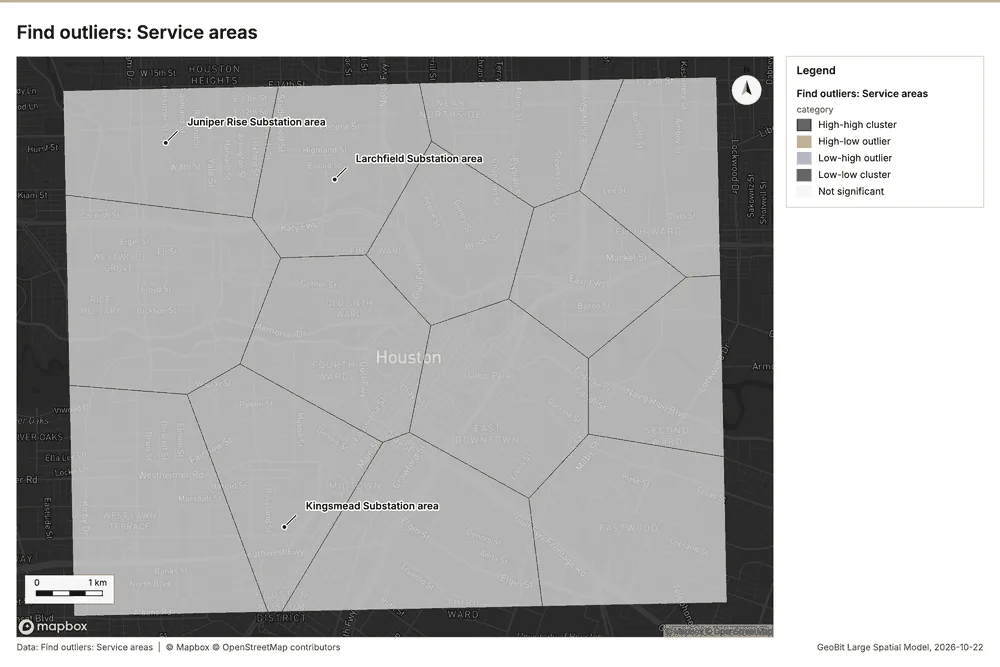
What this analysis is. Find outliers: Anselin local Moran’s I: HH, LL clusters and HL, LH outliers 41. In ArcGIS it is Find Outliers or Cluster and Outlier Analysis (Anselin Local Moran’s I) 41.
Why it was run on this data. Local Moran's I maps clusters and outliers of 'customers' 42.
What it found. Outliers on Service areas: Find outliers: 1 layer saved: Find outliers: Service areas (14 features) 3143. It reported result, count 14; result, elapsed ms 2; result, permutations 199; result, excluded null 0; result, distance band m 2,472; billing, cost 0.05042 43.
| Result | Value |
|---|---|
| result, count | 14 |
| result, elapsed ms | 2 |
| result, permutations | 199 |
| result, excluded null | 0 |
| result, distance band m | 2,472 |
| billing, cost | 0.05042 |
| billing, list price | 0.05042 |
| billing, upstream cost | 0 |
Findings
- Evidenced: Outliers on Service areas: Find outliers: 1 layer saved: Find outliers: Service areas (14 features) 3143.
- Evidenced: It reported result, count 14; result, elapsed ms 2; result, permutations 199; result, excluded null 0; result, distance band m 2,472; billing, cost 0.05042 43.
Tool gp_outliers; parameters {"field": "customers", "project": "99e378b8-9e64-42f5-8930-fca7c2a73f57", "features": {"layer": "Service areas (af824cfb)"}, "aggregation": "hexagon"}
Spatial autocorrelation
What this analysis is. Spatial autocorrelation: Global Moran’s I: is the pattern clustered, dispersed or random 44. In ArcGIS it is Spatial Autocorrelation (Global Moran’s I) 44.
Why it was run on this data. Global Moran's I says whether similar values of 'customers' sit next to each other 45.
What it found. The spatial autocorrelation tool was run using Service areas 31, yielding a Moran's I of 0.02059 46. Analysis of this result showed a p value of 0.6627 46 and a z score of 0.4361 46. Furthermore, the expected I value for the analysis was calculated to be -0.07692 46.
| Result | Value |
|---|---|
| result, n | 14 |
| result, p value | 0.6627 |
| result, z score | 0.4361 |
| result, morans i | 0.02059 |
| result, variance | 0.04999 |
| result, elapsed ms | 1 |
| result, expected i | -0.07692 |
| result, excluded null | 0 |
| result, distance band m | 2,472 |
| result, p value normality | 0.671 |
| result, z score normality | 0.4248 |
| result, variance normality | 0.05269 |
| billing, cost | 0.02 |
| billing, list price | 0.02 |
| billing, upstream cost | 0 |
Findings
- Evidenced: Spatial autocorrelation on Service areas: Spatial autocorrelation: done; no map output 3146.
- Evidenced: It reported result, n 14; result, p value 0.6627; result, z score 0.4361; result, morans i 0.02059; result, variance 0.04999; result, elapsed ms 1 46.
Tool gp_spatial_autocorrelation; parameters {"field": "customers", "project": "99e378b8-9e64-42f5-8930-fca7c2a73f57", "features": {"layer": "Service areas (af824cfb)"}}
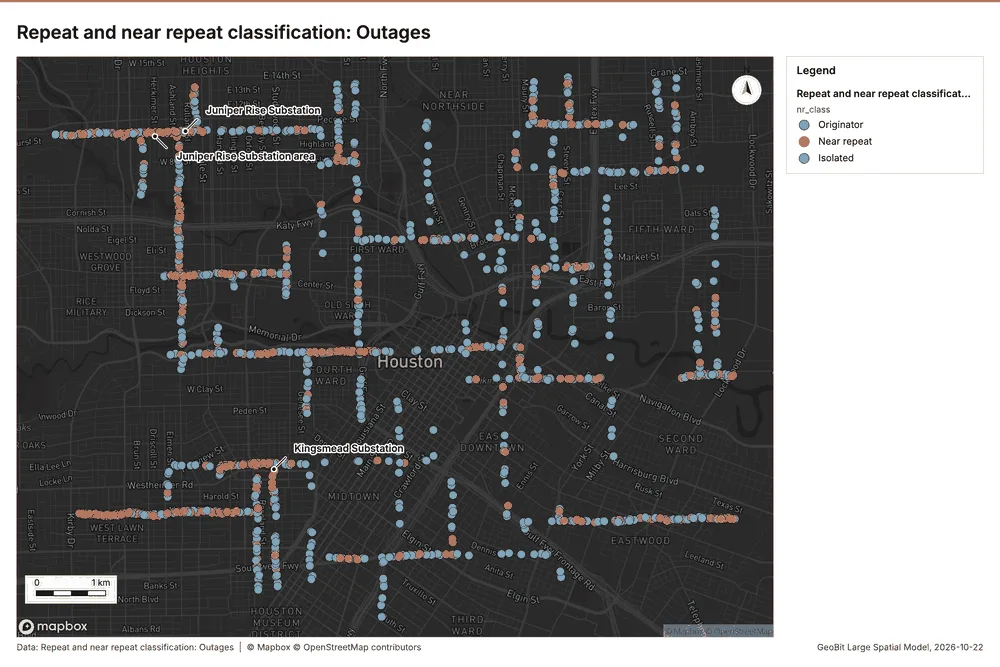
Near repeat
What this analysis is. Repeat and near repeat classification: Classify incidents as originators, repeats (same place) or near repeats within a distance and time window, with a Knox test table 47. In ArcGIS it is Repeat and Near Repeat Classification or Near Repeat Calculator 47.
Why it was run on this data. Near repeat analysis tests whether Outages close in space also follow each other within 30 days 48.
What it found. Near repeat on Outages: Repeat and near repeat classification: 1 layer saved: Repeat and near repeat classification: Outages (1650 features) 949. It reported result, days 30; result, count 1,650; result, chains 266; result, distance m 200; result, elapsed ms 42; result, pairs linked 1,171 49.
| Result | Value |
|---|---|
| result, days | 30 |
| result, count | 1,650 |
| result, chains | 266 |
| result, distance m | 200 |
| result, elapsed ms | 42 |
| result, pairs linked | 1,171 |
| billing, cost | 0.0995 |
| billing, list price | 0.0995 |
| billing, upstream cost | 0 |
Findings
- Evidenced: Near repeat on Outages: Repeat and near repeat classification: 1 layer saved: Repeat and near repeat classification: Outages (1650 features) 949.
- Evidenced: It reported result, days 30; result, count 1,650; result, chains 266; result, distance m 200; result, elapsed ms 42; result, pairs linked 1,171 49.
Tool gp_near_repeat; parameters {"days": 30, "project": "99e378b8-9e64-42f5-8930-fca7c2a73f57", "features": {"layer": "Outages (74249532)"}, "distance_m": 200.0, "time_field": "started_at"}
Maps and charts
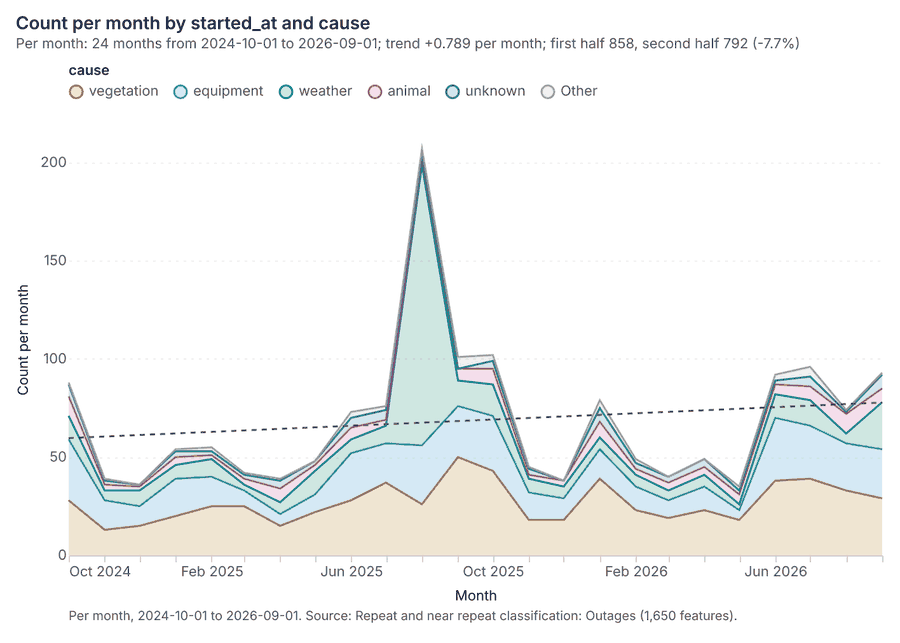
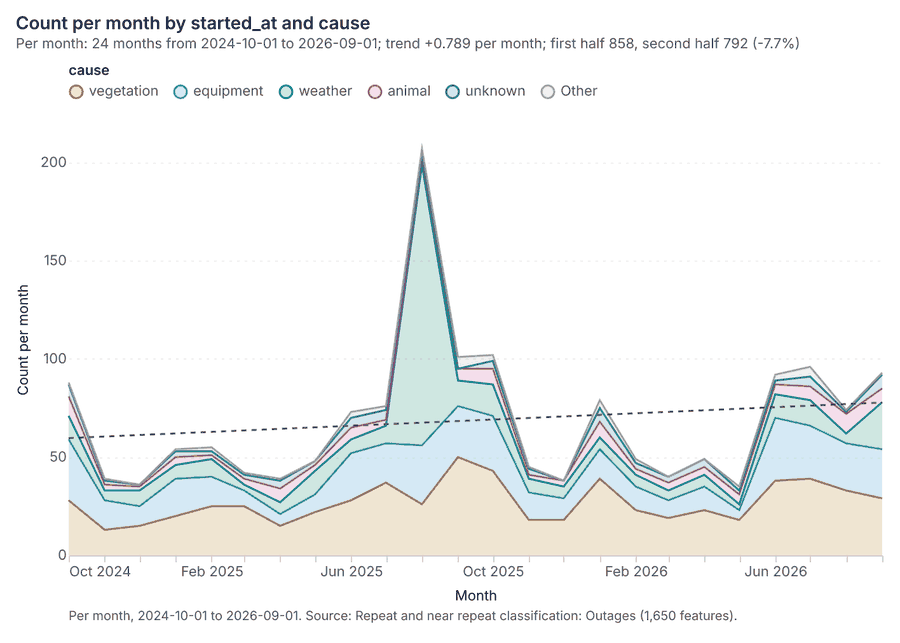
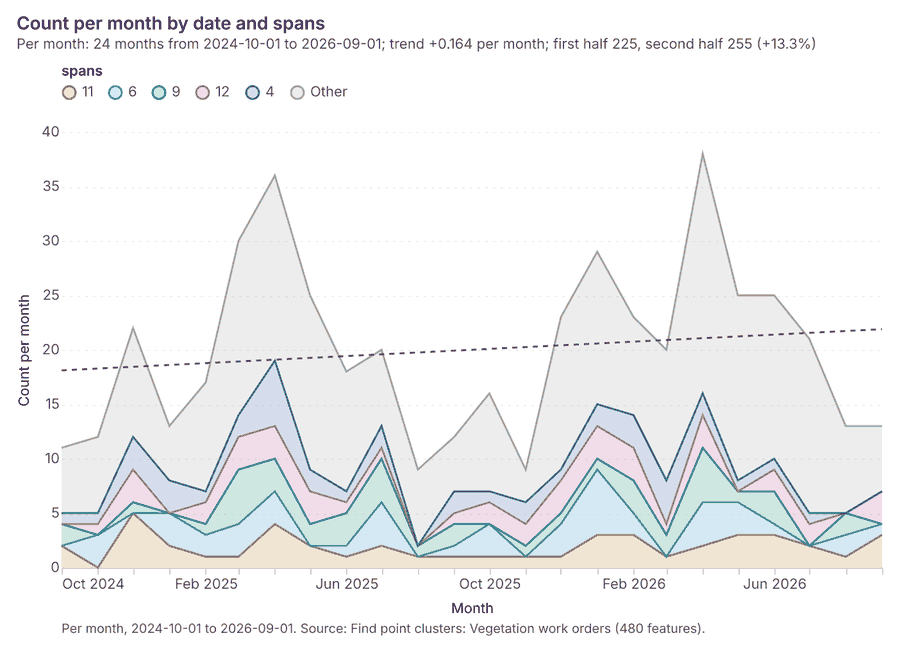
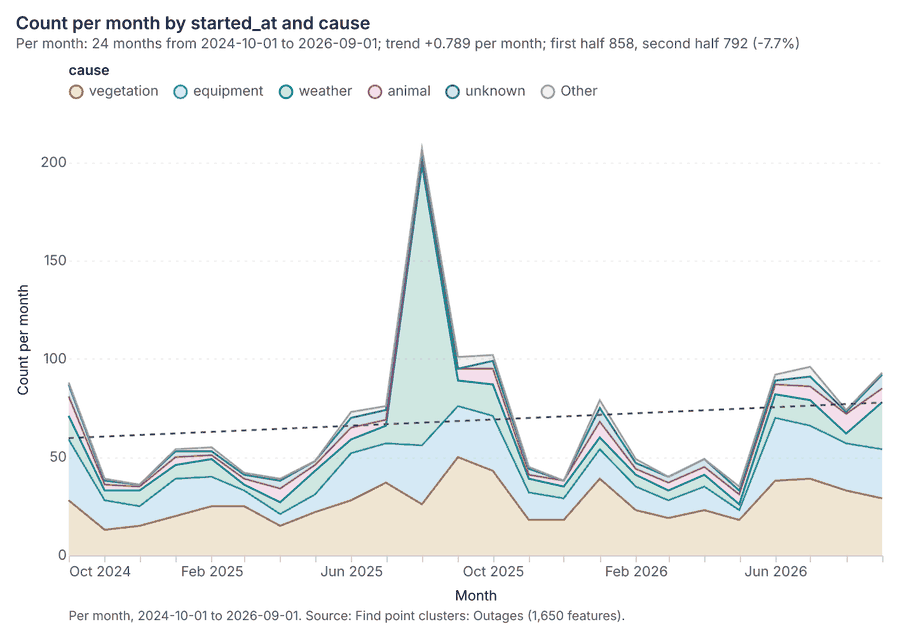
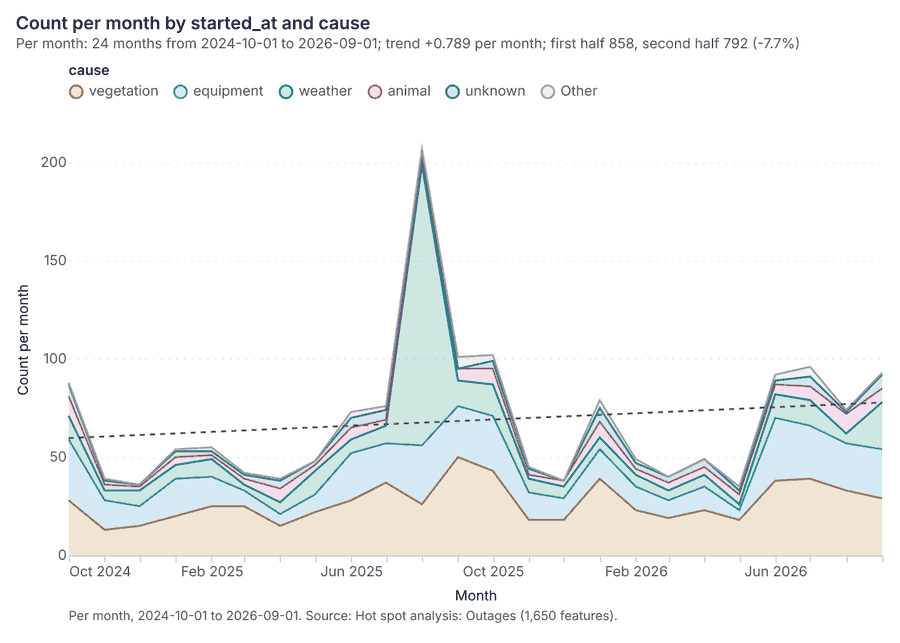
The run also made 20 map image(s) 5051525354555657585960616263646566676869 and 28 chart(s) 70717273747576777879808182838485868788899091929394959697.
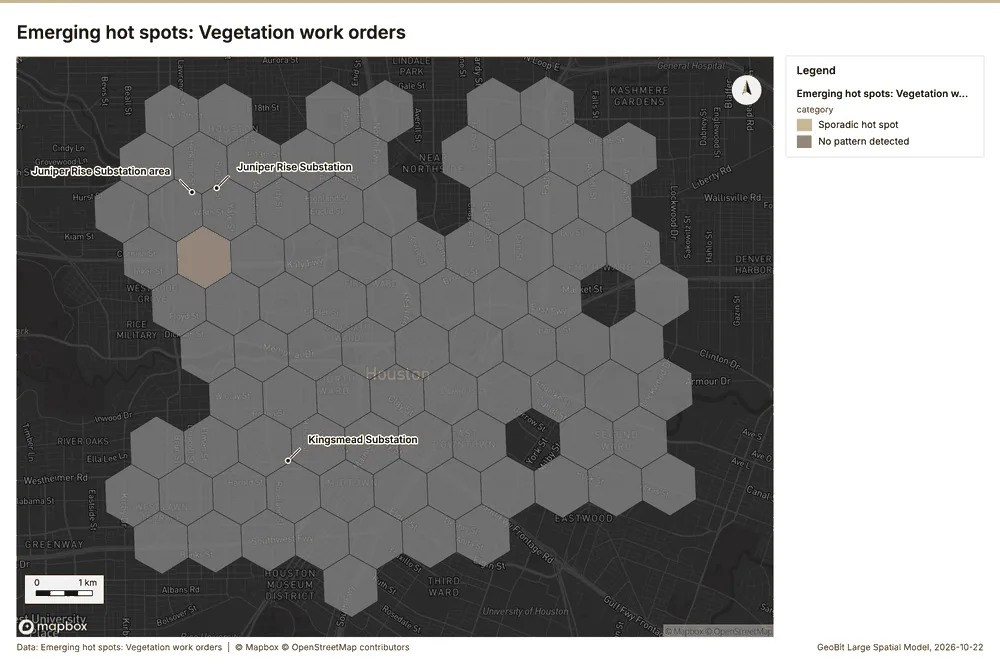
What the map shows. The map visualizes a hot spot analysis for vegetation work orders, classifying areas as having a pattern or having none. The majority of 51
Inferred: read from the image by gemma4:e4b, not evidence.
Changes since the last run
This is the first report of this project.
Sources
- 1Rendering: Chart: Timeline: events per quarter by dataset. 57 rows id 4819230f-295d-49a7-99bf-6b7163fc6b06
- 2Dataset: Outages. vector, 1650 rows id 39df98b3-8a4f-4af6-838d-170705e0bb48
- 3Dataset: Vegetation work orders. vector, 480 rows id 3aea1163-22b4-4a72-88d7-bcae1ecdad23
- 4Dataset: Feeder reliability by year. table, 316 rows id 887eeeea-0f49-451b-93f4-5d68b309bfad
- 5Document page: Storm season reliability report, page 1. 22 August 2025 id 32e35a86-4090-49ec-8ae9-87f7b6be0d6b:1
- 6Catalog: Emerging hot spots (operation catalog, gp_space_time_hot_spots). Where hot spots are new, consecutive, intensifying, persistent, diminishing, sporadic, oscillating or historical over time. ArcGIS: Emerging Hot Spot Analysis, Create Space Time Cube. id gp_space_time_hot_spots
- 7Plan: Space time hot spots of Outages (the Start plan's candidate c_de6ee55db604). Outages carry dates in 'started_at': emerging hot spot analysis finds new, intensifying and fading hot spots per month. id a5b6c9d4-e26f-4c51-adac-5b8547525805:c_de6ee55db604
- 8Tool result: gp_space_time_hot_spots, step 0. Emerging hot spots: 1 layer saved: Emerging hot spots: Outages (100 features). id 7e39f2a8-86e1-4856-b7a7-61e069df845f:0
- 9Layer: Outages. 1,650 features id 74249532-c045-44c9-a616-0fafb7c162a0
- 10Plan: Space time hot spots of Vegetation work orders (the Start plan's candidate c_90f82b668b6e). Vegetation work orders carry dates in 'date': emerging hot spot analysis finds new, intensifying and fading hot spots per month. id a5b6c9d4-e26f-4c51-adac-5b8547525805:c_90f82b668b6e
- 11Tool result: gp_space_time_hot_spots, step 1. Emerging hot spots: 1 layer saved: Emerging hot spots: Vegetation work orders (89 features). id 7e39f2a8-86e1-4856-b7a7-61e069df845f:1
- 12Layer: Vegetation work orders. 480 features id d3eba75a-4345-496b-b3c1-cfad466d3d73
- 13Catalog: Hot spot analysis (operation catalog, gp_hot_spots). Getis-Ord Gi* hot and cold spots with z-scores, p-values and confidence bins. ArcGIS: Find Hot Spots, Hot Spot Analysis (Getis-Ord Gi*). QGIS: qgis:hotspot (plugin). id gp_hot_spots
- 14Plan: Hot spots of Poles (the Start plan's candidate c_8543237d7e01). 450 points: Getis-Ord Gi* tests whether the concentrations in Poles are statistically significant. id a5b6c9d4-e26f-4c51-adac-5b8547525805:c_8543237d7e01
- 15Tool result: gp_hot_spots, step 0. Hot spot analysis: 1 layer saved: Hot spot analysis: Poles (79 features). id dd7f4187-7acb-4060-a294-8f874d038e7b:0
- 16Layer: Poles. 450 features id cb7cbff1-729f-45fd-bbbc-a31c0a2b6043
- 17Plan: Hot spots of Outages (the Start plan's candidate c_2edeaea7ec43). 1650 points: Getis-Ord Gi* tests whether the concentrations in Outages are statistically significant. id a5b6c9d4-e26f-4c51-adac-5b8547525805:c_2edeaea7ec43
- 18Tool result: gp_hot_spots, step 1. Hot spot analysis: 1 layer saved: Hot spot analysis: Outages (1650 features). id dd7f4187-7acb-4060-a294-8f874d038e7b:1
- 19Plan: Hot spots of Vegetation work orders (the Start plan's candidate c_63c929cc68f4). 480 points: Getis-Ord Gi* tests whether the concentrations in Vegetation work orders are statistically significant. id a5b6c9d4-e26f-4c51-adac-5b8547525805:c_63c929cc68f4
- 20Tool result: gp_hot_spots, step 2. Hot spot analysis: 1 layer saved: Hot spot analysis: Vegetation work orders (86 features). id dd7f4187-7acb-4060-a294-8f874d038e7b:2
- 21Catalog: Calculate density (operation catalog, gp_calculate_density). Kernel density per square kilometer on a grid. ArcGIS: Calculate Density, Kernel Density. QGIS: native:heatmapkerneldensityestimation. id gp_calculate_density
- 22Plan: Kernel density of Poles (the Start plan's candidate c_39401f3daf3b). 450 points in Poles: a density surface shows where they concentrate. id a5b6c9d4-e26f-4c51-adac-5b8547525805:c_39401f3daf3b
- 23Tool result: gp_calculate_density, step 0. Calculate density: 1 layer saved: Calculate density: Poles (344 features). id cddccd9e-fca2-4947-ac52-4a032f65ccd9:0
- 24Plan: Kernel density of Outages (the Start plan's candidate c_5f4ad3832af3). 1650 points in Outages: a density surface shows where they concentrate. id a5b6c9d4-e26f-4c51-adac-5b8547525805:c_5f4ad3832af3
- 25Tool result: gp_calculate_density, step 1. Calculate density: 1 layer saved: Calculate density: Outages (1588 features). id cddccd9e-fca2-4947-ac52-4a032f65ccd9:1
- 26Plan: Kernel density of Vegetation work orders (the Start plan's candidate c_fcff6300c7b4). 480 points in Vegetation work orders: a density surface shows where they concentrate. id a5b6c9d4-e26f-4c51-adac-5b8547525805:c_fcff6300c7b4
- 27Tool result: gp_calculate_density, step 2. Calculate density: 1 layer saved: Calculate density: Vegetation work orders (350 features). id cddccd9e-fca2-4947-ac52-4a032f65ccd9:2
- 28Catalog: Summarize within (operation catalog, gp_summarize_within). Count and aggregate the features inside each polygon (or bin), proportionally for lines and polygons. ArcGIS: Summarize Within, Aggregate Points. QGIS: native:countpointsinpolygon, native:sumlinelengths. id gp_summarize_within
- 29Plan: Poles per feature of Service areas (the Start plan's candidate c_0abb031a5451). Count Poles inside each feature of Service areas by material; the counts map as a choropleth (natural breaks, sequential colors). id a5b6c9d4-e26f-4c51-adac-5b8547525805:c_0abb031a5451
- 30Tool result: gp_summarize_within, step 0. Summarize within: 1 layer saved: Summarize within: Service areas (14 features). id 7abde2bd-08d7-47d0-ac4b-96744e82d444:0
- 31Layer: Service areas. 14 features id af824cfb-eb9c-4c01-a5c2-df454a844893
- 32Tool result: gp_summarize_within, step 1. Summarize within: 1 layer saved: Summarize within: Service areas (14 features). id 7abde2bd-08d7-47d0-ac4b-96744e82d444:1
- 33Tool result: gp_summarize_within, step 2. Summarize within: 1 layer saved: Summarize within: Service areas (14 features). id 7abde2bd-08d7-47d0-ac4b-96744e82d444:2
- 34Catalog: Find point clusters (operation catalog, gp_find_point_clusters). Density-based clusters (DBSCAN, HDBSCAN or OPTICS, optionally space-time) with hulls and noise. ArcGIS: Find Point Clusters, Density-based Clustering. QGIS: native:dbscanclustering, native:stdbscanclustering. id gp_find_point_clusters
- 35Plan: Cluster points of Poles (the Start plan's candidate c_49349f7319f8). DBSCAN finds dense groups of Poles and separates noise. id a5b6c9d4-e26f-4c51-adac-5b8547525805:c_49349f7319f8
- 36Tool result: gp_find_point_clusters, step 0. Find point clusters: 2 layers saved: Find point clusters: Poles (450 features); Find point clusters: cluster hulls (12 features). id a1a5ebf4-55fc-498c-bc42-232278d7fd50:0
- 37Plan: Cluster points of Outages (the Start plan's candidate c_9d082d10c718). DBSCAN finds dense groups of Outages and separates noise. id a5b6c9d4-e26f-4c51-adac-5b8547525805:c_9d082d10c718
- 38Tool result: gp_find_point_clusters, step 1. Find point clusters: 2 layers saved: Find point clusters: Outages (1650 features); Find point clusters: cluster hulls (12 features). id a1a5ebf4-55fc-498c-bc42-232278d7fd50:1
- 39Plan: Cluster points of Vegetation work orders (the Start plan's candidate c_ec3997c2afdb). DBSCAN finds dense groups of Vegetation work orders and separates noise. id a5b6c9d4-e26f-4c51-adac-5b8547525805:c_ec3997c2afdb
- 40Tool result: gp_find_point_clusters, step 2. Find point clusters: 2 layers saved: Find point clusters: Vegetation work orders (480 features); Find point clusters: cluster hulls (9 features). id a1a5ebf4-55fc-498c-bc42-232278d7fd50:2
- 41Catalog: Find outliers (operation catalog, gp_outliers). Anselin local Moran’s I: HH, LL clusters and HL, LH outliers. ArcGIS: Find Outliers, Cluster and Outlier Analysis (Anselin Local Moran’s I). id gp_outliers
- 42Plan: Local morans i of Service areas (the Start plan's candidate c_14f3a517187f). Local Moran's I maps clusters and outliers of 'customers'. id a5b6c9d4-e26f-4c51-adac-5b8547525805:c_14f3a517187f
- 43Tool result: gp_outliers, step 0. Find outliers: 1 layer saved: Find outliers: Service areas (14 features). id 0eeb802a-0001-4240-800b-19f28e01e992:0
- 44Catalog: Spatial autocorrelation (operation catalog, gp_spatial_autocorrelation). Global Moran’s I: is the pattern clustered, dispersed or random. ArcGIS: Spatial Autocorrelation (Global Moran’s I). id gp_spatial_autocorrelation
- 45Plan: Global morans i of Service areas (the Start plan's candidate c_ce02f9951480). Global Moran's I says whether similar values of 'customers' sit next to each other. id a5b6c9d4-e26f-4c51-adac-5b8547525805:c_ce02f9951480
- 46Tool result: gp_spatial_autocorrelation, step 1. Spatial autocorrelation: done; no map output. id 0eeb802a-0001-4240-800b-19f28e01e992:1
- 47Catalog: Repeat and near repeat classification (operation catalog, gp_near_repeat). Classify incidents as originators, repeats (same place) or near repeats within a distance and time window, with a Knox test table. ArcGIS: Repeat and Near Repeat Classification, Near Repeat Calculator. id gp_near_repeat
- 48Plan: Near repeat of Outages (the Start plan's candidate c_c8acd413fa13). Near repeat analysis tests whether Outages close in space also follow each other within 30 days. id a5b6c9d4-e26f-4c51-adac-5b8547525805:c_c8acd413fa13
- 49Tool result: gp_near_repeat, step 0. Repeat and near repeat classification: 1 layer saved: Repeat and near repeat classification: Outages (1650 features). id 7d19f92c-f4e9-48f3-93b0-dae3bf87b4ee:0
- 50Rendering: Map: Emerging hot spots: Outages id 85c7e950-dc12-47d7-9698-4f3e33d102c5
- 51Rendering: Map: Emerging hot spots: Vegetation work orders id d57a1eed-7833-4fa0-ba3b-1d34a14adf8d
- 52Rendering: Map: Hot spot analysis: Poles id 9c171d35-6e8a-404e-b179-3a277cac6680
- 53Rendering: Map: Hot spot analysis: Outages id 8b2915ad-3dc8-4c93-8998-6f8c60edde26
- 54Rendering: Map: Hot spot analysis: Vegetation work orders id 1951c285-f42c-4fe7-a12b-c61e0f8e89b1
- 55Rendering: Map: Calculate density: Poles id 77494a3a-e8bf-4ba9-8c9f-bbca3ed39699
- 56Rendering: Map: Calculate density: Outages id 2539e062-6c7a-48d8-915c-ceb004cf1c30
- 57Rendering: Map: Calculate density: Vegetation work orders id 90718fcc-1e9e-4189-b307-dd23cdc248d7
- 58Rendering: Map: Summarize within: Service areas id aaf8c40e-6ba8-477d-9349-b080f65d9f6f
- 59Rendering: Map: Summarize within: Service areas id 205c58ca-663e-465b-b5da-e58df3a3a282
- 60Rendering: Map: Summarize within: Service areas id baad37d3-dcec-4a96-add7-fa1a886f6434
- 61Rendering: Map: Find point clusters: Poles id 244f950b-322a-4f47-9af0-a30ad8fb8bad
- 62Rendering: Map: Find point clusters: cluster hulls id d83dd986-dc80-4bfd-886c-ff9fb5202ae7
- 63Rendering: Map: Find point clusters: Outages id a84598e8-6ff6-4f96-960b-18389e35387e
- 64Rendering: Map: Find point clusters: cluster hulls id f19bdfd5-1091-44cd-baae-dbac01077b12
- 65Rendering: Map: Find point clusters: Vegetation work orders id f99266a6-079b-44d5-852d-676355c69c8f
- 66Rendering: Map: Find point clusters: cluster hulls id d61dc500-d849-4c67-8699-7c2b54d04ac2
- 67Rendering: Map: Service areas by customers id 053475d3-62c9-4ca9-9150-1780c6628edd
- 68Rendering: Map: Find outliers: Service areas id 40748e31-9982-4c38-83df-2e829b1cd052
- 69Rendering: Map: Repeat and near repeat classification: Outages id 2dd79f43-b1db-44d1-b050-cb0ad8062f39
- 70Rendering: Chart: Feeder lines over time (install_year). 8 rows id a6ddfbd0-4d56-4fd4-95e4-dccff9b3fe14
- 71Rendering: Chart: Vegetation work orders over time (date). 72 rows id fe31e6f1-8de6-4739-b859-5ca5639a090e
- 72Rendering: Chart: Poles over time (install_year). 10 rows id 1a338811-8c8f-4624-affb-5f6f2a386c21
- 73Rendering: Chart: Feeder reliability by year over time (year). 37 rows id 81342282-782d-4f77-a6ab-c97a78fe8806
- 74Rendering: Chart: Transformer assets over time (install_year). 10 rows id 8b1d0ff4-f186-4254-b010-9684ed1844c3
- 75Rendering: Chart: Emerging hot spots: Outages. 8 rows id d57c5b66-d8b2-462a-85ae-76e9926eb3b1
- 76Rendering: Chart: Emerging hot spots: Vegetation work orders. 8 rows id d126a2b6-196d-4f93-93d5-5ce7f5d9f891
- 77Rendering: Chart: Hot spot analysis: Poles. 9 rows id b3100e77-5cbe-4a62-b253-290a5d536bb5
- 78Rendering: Chart: Hot spot analysis: Outages. 18 rows id cec85df8-5d0a-4af6-ba88-696eca4ce437
- 79Rendering: Chart: Hot spot analysis: Vegetation work orders. 10 rows id 1a614d2a-305a-4dfc-a43d-d303a95fb7b7
- 80Rendering: Chart: Calculate density: Poles. 10 rows id 2ea4b4d0-a10d-4113-b8f2-fb2372244db4
- 81Rendering: Chart: Calculate density: Outages. 12 rows id a201fc49-4d81-4320-8155-2f3eb69bd7da
- 82Rendering: Chart: Calculate density: Vegetation work orders. 10 rows id 1a66e57b-240e-4644-ab5f-f5d3fceeebe6
- 83Rendering: Chart: Summarize within: Service areas. 5 rows id ac78768b-6dc9-4d58-b972-2cf6dec976ea
- 84Rendering: Chart: Summarize within: Service areas. 5 rows id 0ee3a30f-bde2-4bb4-9019-791dd822ac96
- 85Rendering: Chart: Summarize within: Service areas. 5 rows id 1cd10d51-b513-49a7-b54f-6694f693c6a5
- 86Rendering: Chart: Find point clusters: Poles. 13 rows id 4d716dc4-27b8-4ca0-8c8b-b4246f0cf77f
- 87Rendering: Chart: Find point clusters: cluster hulls. 12 rows id d68e61ee-9527-48bd-93b1-e6d214930ddb
- 88Rendering: Chart: Find point clusters: Outages. 13 rows id 658b2721-1008-4707-8089-5fc9e67e755d
- 89Rendering: Chart: Find point clusters: cluster hulls. 12 rows id 3c8e6159-5e84-4f48-a0a3-71bc429bc627
- 90Rendering: Chart: Find point clusters: Vegetation work orders. 10 rows id 77d5d6a0-286e-48b2-83b6-f1379a2b6e25
- 91Rendering: Chart: Find point clusters: cluster hulls. 9 rows id ebdaf978-c973-42d9-b815-55c700b8af71
- 92Rendering: Chart: Find outliers: Service areas. 14 rows id c9960c12-89e8-43ab-83aa-898a65c8d7e1
- 93Rendering: Chart: Repeat and near repeat classification: Outages. 144 rows id 59506424-cd43-4c06-82b9-310f05aa3ef1
- 94Rendering: Chart: Repeat and near repeat classification: Outages over time. 144 rows id e21c9039-2700-4091-9c70-031cd03ca122
- 95Rendering: Chart: Find point clusters: Vegetation work orders over time. 144 rows id 17f450e3-64de-4bba-a8b9-1f01286c5da9
- 96Rendering: Chart: Find point clusters: Outages over time. 144 rows id 7c632546-38e2-4ef7-a37f-a50b9e7200a4
- 97Rendering: Chart: Hot spot analysis: Outages over time. 144 rows id 89489499-b4a2-4e58-b157-ba3c649aecd2
- 98Dataset: Substations. vector, 14 rows id f259f42c-1706-41ba-a78a-1361f3914e06
- 99Dataset: Feeder lines. vector, 79 rows id ecfb48ff-6d02-430b-9ebb-f111ab17967c
- 100Dataset: Service areas. vector, 14 rows id f3d1d854-cd9c-48c7-8f7a-a2e854a8ceb6
- 101Dataset: Critical customers. vector, 60 rows id e19506c9-69b8-4925-bb88-2c0235b75a70
- 102Dataset: Poles. vector, 450 rows id 3786e568-d7a4-4d47-b594-453c79329fb0
- 103Dataset: Transformer assets. table, 300 rows id 2e9131d9-123c-4a43-986c-82f9c9221692
- 104Dataset: Storm season reliability report. document, ? rows id b535c355-1229-4d0f-9126-2fe58457bcec
- 105Record: Sample: Electricity utility, Houston id 99e378b8-9e64-42f5-8930-fca7c2a73f57
- 106Layer: Emerging hot spots: Outages. 100 features id c053bfd3-6311-4cf3-a811-669d5782bdb3
- 107Layer: Emerging hot spots: Vegetation work orders. 89 features id 1cbdbfca-5f5d-4277-87ce-4d482b63ec8e
- 108Layer: Hot spot analysis: Poles. 79 features id ddab229d-5eab-4322-8c2b-76442371347b
- 109Layer: Hot spot analysis: Outages. 1,650 features id 152d5bad-10c2-42e3-98ef-f598b1d425bd
- 110Layer: Hot spot analysis: Vegetation work orders. 86 features id aa682980-c78f-45bf-a39c-e6c25235ecf0
- 111Layer: Calculate density: Poles. 344 features id 092a4943-ffb6-462a-afdb-cfca08b63795
- 112Layer: Calculate density: Outages. 1,588 features id c9cfc32c-1601-4e5a-9160-a0a02112b586
- 113Layer: Calculate density: Vegetation work orders. 350 features id c3b70581-64dc-4b78-82c2-af051c400b18
- 114Layer: Summarize within: Service areas. 14 features id 080e40ba-f7ec-49b3-856b-2145df7839bf
- 115Layer: Summarize within: Service areas. 14 features id 9f88918e-62a5-4499-b99b-d19d559ee0a7
- 116Layer: Summarize within: Service areas. 14 features id a4302e84-efd6-417d-9791-39532ad03ea3
- 117Layer: Find point clusters: Poles. 450 features id d8bd47c0-3090-477e-9f4e-99798bfd2778
- 118Layer: Find point clusters: cluster hulls. 12 features id 99b9ab3e-1fc2-4630-afb7-f5a5db637828
- 119Layer: Find point clusters: Outages. 1,650 features id 402ad5f6-a892-490a-a647-e6e94f591e27
- 120Layer: Find point clusters: cluster hulls. 12 features id 56caa497-390e-42c8-9f4d-6813ec441e8c
- 121Layer: Find point clusters: Vegetation work orders. 480 features id 9ab95317-7431-4636-b94c-06bb41924b25
- 122Layer: Find point clusters: cluster hulls. 9 features id 134428d0-3eb6-4afb-b65a-2f63ca197338
- 123Layer: Find outliers: Service areas. 14 features id 31a2a6ae-e1c2-4384-bdb2-7d30ebff9f80
- 124Layer: Repeat and near repeat classification: Outages. 1,650 features id 9fd9267d-3aae-4cac-90a0-3de6c177fa4f
Appendix: the data behind the chartsShow
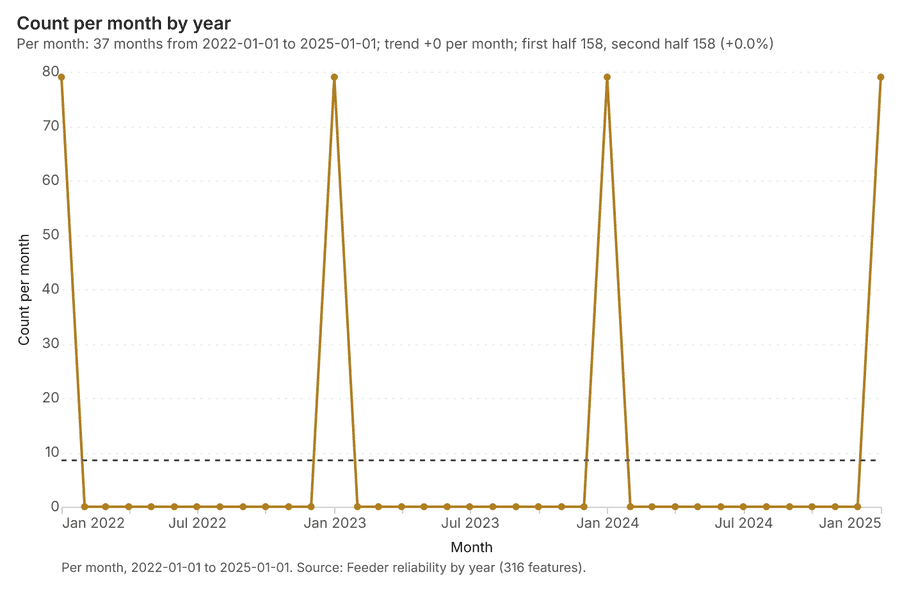
Figure 1. Timeline: events per quarter by dataset 1
| period | series | value |
|---|---|---|
| 2022-01-01 | Outages | 0 |
| 2022-01-01 | Vegetation work orders | 0 |
| 2022-01-01 | Feeder reliability by year | 79 |
| 2022-04-01 | Outages | 0 |
| 2022-04-01 | Vegetation work orders | 0 |
| 2022-04-01 | Feeder reliability by year | 0 |
| 2022-07-01 | Outages | 0 |
| 2022-07-01 | Vegetation work orders | 0 |
| 2022-07-01 | Feeder reliability by year | 0 |
| 2022-10-01 | Outages | 0 |
| 2022-10-01 | Vegetation work orders | 0 |
| 2022-10-01 | Feeder reliability by year | 0 |
| 2023-01-01 | Outages | 0 |
| 2023-01-01 | Vegetation work orders | 0 |
| 2023-01-01 | Feeder reliability by year | 79 |
| 2023-04-01 | Outages | 0 |
| 2023-04-01 | Vegetation work orders | 0 |
| 2023-04-01 | Feeder reliability by year | 0 |
| 2023-07-01 | Outages | 0 |
| 2023-07-01 | Vegetation work orders | 0 |
| 2023-07-01 | Feeder reliability by year | 0 |
| 2023-10-01 | Outages | 0 |
| 2023-10-01 | Vegetation work orders | 0 |
| 2023-10-01 | Feeder reliability by year | 0 |
| 2024-01-01 | Outages | 0 |
| 2024-01-01 | Vegetation work orders | 0 |
| 2024-01-01 | Feeder reliability by year | 79 |
| 2024-04-01 | Outages | 0 |
| 2024-04-01 | Vegetation work orders | 0 |
| 2024-04-01 | Feeder reliability by year | 0 |
| 2024-07-01 | Outages | 0 |
| 2024-07-01 | Vegetation work orders | 0 |
| 2024-07-01 | Feeder reliability by year | 0 |
| 2024-10-01 | Outages | 163 |
| 2024-10-01 | Vegetation work orders | 45 |
| 2024-10-01 | Feeder reliability by year | 0 |
| 2025-01-01 | Outages | 151 |
| 2025-01-01 | Vegetation work orders | 60 |
| 2025-01-01 | Feeder reliability by year | 79 |
| 2025-04-01 | Outages | 160 |
| 2025-04-01 | Vegetation work orders | 79 |
| 2025-04-01 | Feeder reliability by year | 0 |
| 2025-07-01 | Outages | 384 |
| 2025-07-01 | Vegetation work orders | 41 |
| 2025-07-01 | Feeder reliability by year | 0 |
| 2025-10-01 | Outages | 185 |
| 2025-10-01 | Vegetation work orders | 48 |
| 2025-10-01 | Feeder reliability by year | 0 |
| 2026-01-01 | Outages | 168 |
| 2026-01-01 | Vegetation work orders | 72 |
| 2026-01-01 | Feeder reliability by year | 0 |
| 2026-04-01 | Outages | 176 |
| 2026-04-01 | Vegetation work orders | 88 |
| 2026-04-01 | Feeder reliability by year | 0 |
| 2026-07-01 | Outages | 263 |
| 2026-07-01 | Vegetation work orders | 47 |
| 2026-07-01 | Feeder reliability by year | 0 |
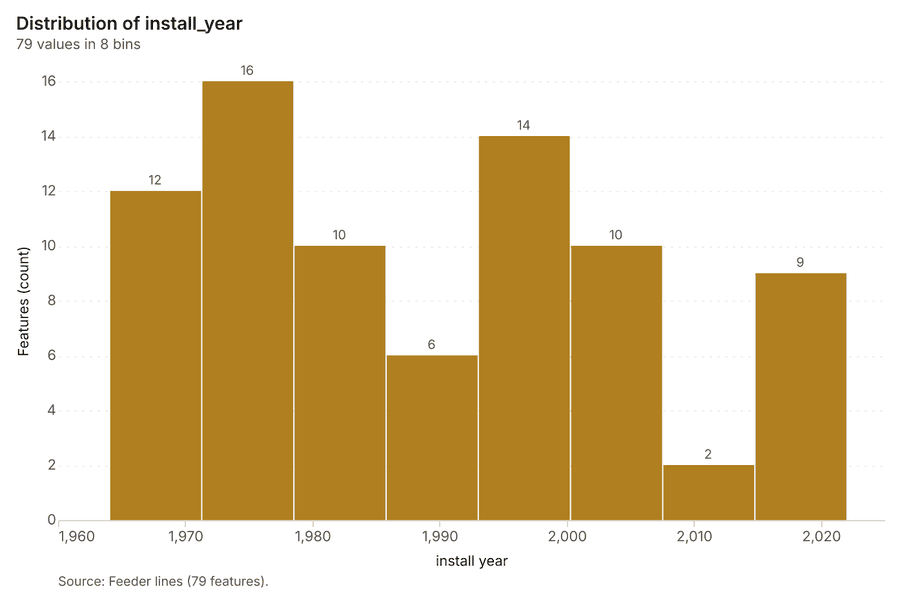
Figure 22. Feeder lines over time (install_year) 70
| bin_start | bin_end | count |
|---|---|---|
| 1,964 | 1,971 | 12 |
| 1,971 | 1,978 | 16 |
| 1,978 | 1,986 | 10 |
| 1,986 | 1,993 | 6 |
| 1,993 | 2,000 | 14 |
| 2,000 | 2,008 | 10 |
| 2,008 | 2,015 | 2 |
| 2,015 | 2,022 | 9 |
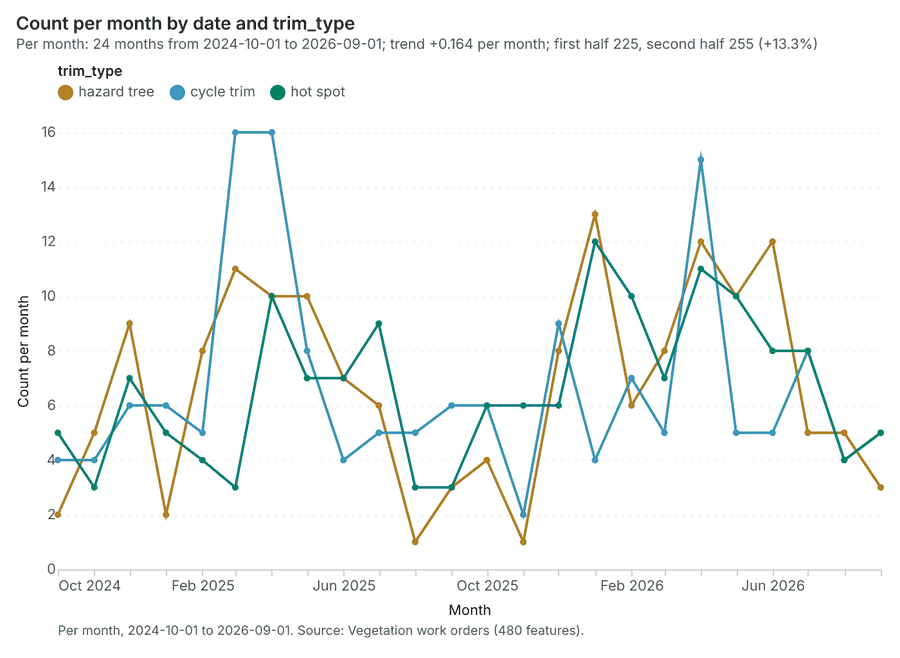
Figure 23. Vegetation work orders over time (date) 71
| period | series | value |
|---|---|---|
| 2024-10-01 | hazard tree | 2 |
| 2024-10-01 | cycle trim | 4 |
| 2024-10-01 | hot spot | 5 |
| 2024-11-01 | hazard tree | 5 |
| 2024-11-01 | cycle trim | 4 |
| 2024-11-01 | hot spot | 3 |
| 2024-12-01 | hazard tree | 9 |
| 2024-12-01 | cycle trim | 6 |
| 2024-12-01 | hot spot | 7 |
| 2025-01-01 | hazard tree | 2 |
| 2025-01-01 | cycle trim | 6 |
| 2025-01-01 | hot spot | 5 |
| 2025-02-01 | hazard tree | 8 |
| 2025-02-01 | cycle trim | 5 |
| 2025-02-01 | hot spot | 4 |
| 2025-03-01 | hazard tree | 11 |
| 2025-03-01 | cycle trim | 16 |
| 2025-03-01 | hot spot | 3 |
| 2025-04-01 | hazard tree | 10 |
| 2025-04-01 | cycle trim | 16 |
| 2025-04-01 | hot spot | 10 |
| 2025-05-01 | hazard tree | 10 |
| 2025-05-01 | cycle trim | 8 |
| 2025-05-01 | hot spot | 7 |
| 2025-06-01 | hazard tree | 7 |
| 2025-06-01 | cycle trim | 4 |
| 2025-06-01 | hot spot | 7 |
| 2025-07-01 | hazard tree | 6 |
| 2025-07-01 | cycle trim | 5 |
| 2025-07-01 | hot spot | 9 |
| 2025-08-01 | hazard tree | 1 |
| 2025-08-01 | cycle trim | 5 |
| 2025-08-01 | hot spot | 3 |
| 2025-09-01 | hazard tree | 3 |
| 2025-09-01 | cycle trim | 6 |
| 2025-09-01 | hot spot | 3 |
| 2025-10-01 | hazard tree | 4 |
| 2025-10-01 | cycle trim | 6 |
| 2025-10-01 | hot spot | 6 |
| 2025-11-01 | hazard tree | 1 |
| 2025-11-01 | cycle trim | 2 |
| 2025-11-01 | hot spot | 6 |
| 2025-12-01 | hazard tree | 8 |
| 2025-12-01 | cycle trim | 9 |
| 2025-12-01 | hot spot | 6 |
| 2026-01-01 | hazard tree | 13 |
| 2026-01-01 | cycle trim | 4 |
| 2026-01-01 | hot spot | 12 |
| 2026-02-01 | hazard tree | 6 |
| 2026-02-01 | cycle trim | 7 |
| 2026-02-01 | hot spot | 10 |
| 2026-03-01 | hazard tree | 8 |
| 2026-03-01 | cycle trim | 5 |
| 2026-03-01 | hot spot | 7 |
| 2026-04-01 | hazard tree | 12 |
| 2026-04-01 | cycle trim | 15 |
| 2026-04-01 | hot spot | 11 |
| 2026-05-01 | hazard tree | 10 |
| 2026-05-01 | cycle trim | 5 |
| 2026-05-01 | hot spot | 10 |
| 2026-06-01 | hazard tree | 12 |
| 2026-06-01 | cycle trim | 5 |
| 2026-06-01 | hot spot | 8 |
| 2026-07-01 | hazard tree | 5 |
| 2026-07-01 | cycle trim | 8 |
| 2026-07-01 | hot spot | 8 |
| 2026-08-01 | hazard tree | 5 |
| 2026-08-01 | cycle trim | 4 |
| 2026-08-01 | hot spot | 4 |
| 2026-09-01 | hazard tree | 3 |
| 2026-09-01 | cycle trim | 5 |
| 2026-09-01 | hot spot | 5 |
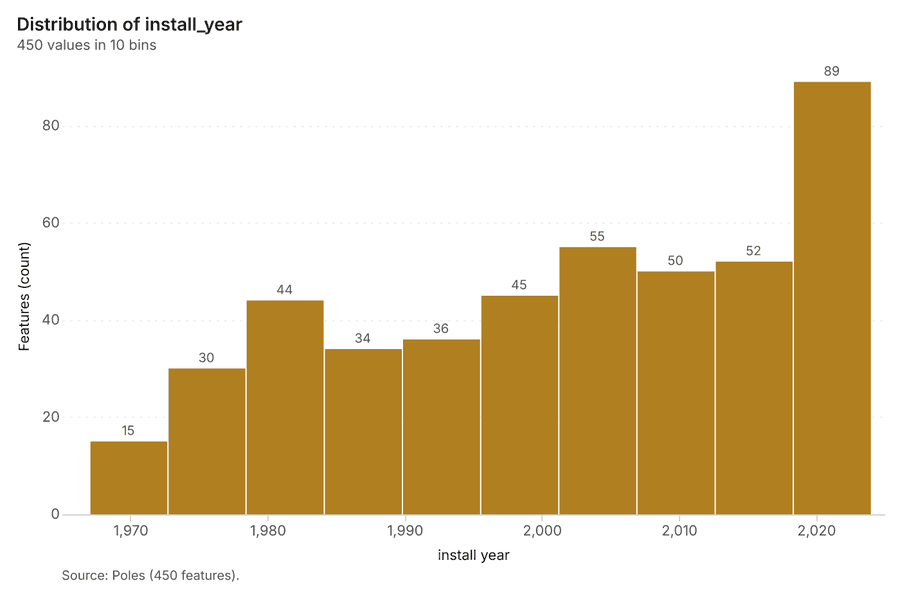
Figure 24. Poles over time (install_year) 72
| bin_start | bin_end | count |
|---|---|---|
| 1,967 | 1,973 | 15 |
| 1,973 | 1,978 | 30 |
| 1,978 | 1,984 | 44 |
| 1,984 | 1,990 | 34 |
| 1,990 | 1,996 | 36 |
| 1,996 | 2,001 | 45 |
| 2,001 | 2,007 | 55 |
| 2,007 | 2,013 | 50 |
| 2,013 | 2,018 | 52 |
| 2,018 | 2,024 | 89 |
Figure 25. Feeder reliability by year over time (year) 73
| period | value |
|---|---|
| 2022-01-01 | 79 |
| 2022-02-01 | 0 |
| 2022-03-01 | 0 |
| 2022-04-01 | 0 |
| 2022-05-01 | 0 |
| 2022-06-01 | 0 |
| 2022-07-01 | 0 |
| 2022-08-01 | 0 |
| 2022-09-01 | 0 |
| 2022-10-01 | 0 |
| 2022-11-01 | 0 |
| 2022-12-01 | 0 |
| 2023-01-01 | 79 |
| 2023-02-01 | 0 |
| 2023-03-01 | 0 |
| 2023-04-01 | 0 |
| 2023-05-01 | 0 |
| 2023-06-01 | 0 |
| 2023-07-01 | 0 |
| 2023-08-01 | 0 |
| 2023-09-01 | 0 |
| 2023-10-01 | 0 |
| 2023-11-01 | 0 |
| 2023-12-01 | 0 |
| 2024-01-01 | 79 |
| 2024-02-01 | 0 |
| 2024-03-01 | 0 |
| 2024-04-01 | 0 |
| 2024-05-01 | 0 |
| 2024-06-01 | 0 |
| 2024-07-01 | 0 |
| 2024-08-01 | 0 |
| 2024-09-01 | 0 |
| 2024-10-01 | 0 |
| 2024-11-01 | 0 |
| 2024-12-01 | 0 |
| 2025-01-01 | 79 |
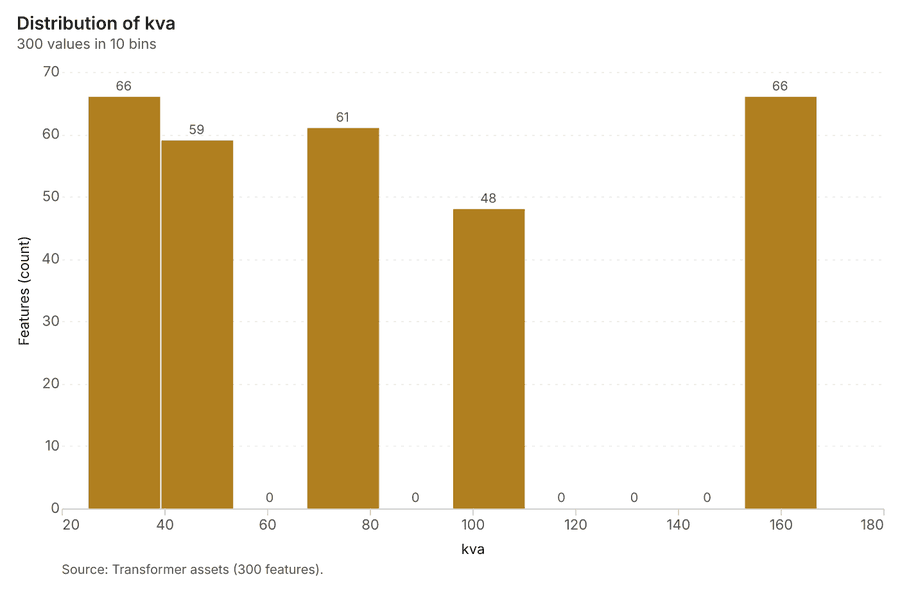
Figure 26. Transformer assets over time (install_year) 74
| bin_start | bin_end | count |
|---|---|---|
| 25 | 39.2 | 66 |
| 39.2 | 53.4 | 59 |
| 53.4 | 67.6 | 0 |
| 67.6 | 81.8 | 61 |
| 81.8 | 96 | 0 |
| 96 | 110.2 | 48 |
| 110.2 | 124.4 | 0 |
| 124.4 | 138.6 | 0 |
| 138.6 | 152.8 | 0 |
| 152.8 | 167 | 66 |
Figure 27. Emerging hot spots: Outages 75
| bin_start | bin_end | count |
|---|---|---|
| -1.044 | -0.2486 | 36 |
| -0.2486 | 0.5467 | 20 |
| 0.5467 | 1.342 | 21 |
| 1.342 | 2.138 | 10 |
| 2.138 | 2.933 | 4 |
| 2.933 | 3.728 | 5 |
| 3.728 | 4.524 | 3 |
| 4.524 | 5.319 | 1 |
Figure 28. Emerging hot spots: Vegetation work orders 76
| bin_start | bin_end | count |
|---|---|---|
| -0.951 | -0.5264 | 39 |
| -0.5264 | -0.1017 | 28 |
| -0.1017 | 0.3229 | 1 |
| 0.3229 | 0.7475 | 9 |
| 0.7475 | 1.172 | 1 |
| 1.172 | 1.597 | 1 |
| 1.597 | 2.021 | 9 |
| 2.021 | 2.446 | 1 |
Figure 29. Hot spot analysis: Poles 77
| bin_start | bin_end | band | band_label | count |
|---|---|---|---|---|
| -1 | -0.5 | not_significant | Not significant | 33 |
| -0.5 | 0 | not_significant | Not significant | 13 |
| 0 | 0.5 | not_significant | Not significant | 13 |
| 0.5 | 1 | not_significant | Not significant | 5 |
| 1 | 1.5 | not_significant | Not significant | 10 |
| 1.5 | 2 | hot_90 | Hot spot, 90% confidence | 1 |
| 2 | 2.5 | hot_95 | Hot spot, 95% confidence | 2 |
| 3 | 3.5 | hot_99 | Hot spot, 99% confidence | 1 |
| 3.5 | 4 | hot_99 | Hot spot, 99% confidence | 1 |
Figure 30. Hot spot analysis: Outages 78
| bin_start | bin_end | band | band_label | count |
|---|---|---|---|---|
| -2.5 | -2 | cold_95 | Cold spot, 95% confidence | 6 |
| -2 | -1.5 | cold_90 | Cold spot, 90% confidence | 45 |
| -2 | -1.5 | cold_95 | Cold spot, 95% confidence | 1 |
| -2 | -1.5 | not_significant | Not significant | 18 |
| -1.5 | -1 | not_significant | Not significant | 179 |
| -1 | -0.5 | not_significant | Not significant | 376 |
| -0.5 | 0 | not_significant | Not significant | 330 |
| 0 | 0.5 | not_significant | Not significant | 246 |
| 0.5 | 1 | not_significant | Not significant | 205 |
| 1 | 1.5 | not_significant | Not significant | 160 |
| 1.5 | 2 | hot_90 | Hot spot, 90% confidence | 25 |
| 1.5 | 2 | hot_95 | Hot spot, 95% confidence | 3 |
| 1.5 | 2 | not_significant | Not significant | 15 |
| 2 | 2.5 | hot_95 | Hot spot, 95% confidence | 28 |
| 2.5 | 3 | hot_95 | Hot spot, 95% confidence | 3 |
| 2.5 | 3 | hot_99 | Hot spot, 99% confidence | 7 |
| 3 | 3.5 | hot_99 | Hot spot, 99% confidence | 2 |
| 3.5 | 4 | hot_99 | Hot spot, 99% confidence | 1 |
Figure 31. Hot spot analysis: Vegetation work orders 79
| bin_start | bin_end | band | band_label | count |
|---|---|---|---|---|
| -1 | -0.5 | not_significant | Not significant | 33 |
| -0.5 | 0 | not_significant | Not significant | 17 |
| 0 | 0.5 | not_significant | Not significant | 13 |
| 0.5 | 1 | not_significant | Not significant | 10 |
| 1 | 1.5 | not_significant | Not significant | 5 |
| 1.5 | 2 | hot_90 | Hot spot, 90% confidence | 2 |
| 1.5 | 2 | not_significant | Not significant | 2 |
| 2 | 2.5 | hot_95 | Hot spot, 95% confidence | 2 |
| 2.5 | 3 | hot_99 | Hot spot, 99% confidence | 1 |
| 4 | 4.5 | hot_99 | Hot spot, 99% confidence | 1 |
Figure 32. Calculate density: Poles 80
| bin_start | bin_end | count |
|---|---|---|
| 0 | 2.3 | 18 |
| 2.3 | 4.6 | 28 |
| 4.6 | 6.9 | 33 |
| 6.9 | 9.2 | 51 |
| 9.2 | 11.5 | 36 |
| 11.5 | 13.8 | 33 |
| 13.8 | 16.1 | 50 |
| 16.1 | 18.4 | 34 |
| 18.4 | 20.7 | 32 |
| 20.7 | 23 | 29 |
Figure 33. Calculate density: Outages 81
| bin_start | bin_end | count |
|---|---|---|
| 0 | 4.5 | 37 |
| 4.5 | 9 | 59 |
| 9 | 13.5 | 160 |
| 13.5 | 18 | 118 |
| 18 | 22.5 | 189 |
| 22.5 | 27 | 166 |
| 27 | 31.5 | 179 |
| 31.5 | 36 | 129 |
| 36 | 40.5 | 190 |
| 40.5 | 45 | 144 |
| 45 | 49.5 | 137 |
| 49.5 | 54 | 80 |
Figure 34. Calculate density: Vegetation work orders 82
| bin_start | bin_end | count |
|---|---|---|
| 0 | 2.3 | 18 |
| 2.3 | 4.6 | 27 |
| 4.6 | 6.9 | 34 |
| 6.9 | 9.2 | 53 |
| 9.2 | 11.5 | 38 |
| 11.5 | 13.8 | 32 |
| 13.8 | 16.1 | 52 |
| 16.1 | 18.4 | 32 |
| 18.4 | 20.7 | 32 |
| 20.7 | 23 | 32 |
Figure 35. Summarize within: Service areas 83
| bin_start | bin_end | count |
|---|---|---|
| 19 | 24.6 | 3 |
| 24.6 | 30.2 | 4 |
| 30.2 | 35.8 | 3 |
| 35.8 | 41.4 | 1 |
| 41.4 | 47 | 3 |
Figure 36. Summarize within: Service areas 84
| bin_start | bin_end | count |
|---|---|---|
| 57 | 85.8 | 4 |
| 85.8 | 114.6 | 5 |
| 114.6 | 143.4 | 0 |
| 143.4 | 172.2 | 2 |
| 172.2 | 201 | 3 |
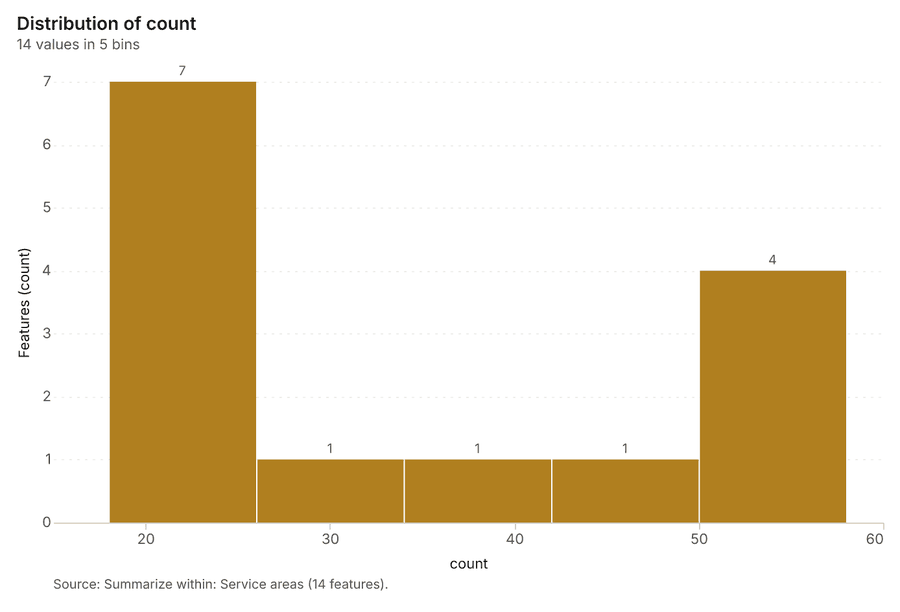
Figure 37. Summarize within: Service areas 85
| bin_start | bin_end | count |
|---|---|---|
| 18 | 26 | 7 |
| 26 | 34 | 1 |
| 34 | 42 | 1 |
| 42 | 50 | 1 |
| 50 | 58 | 4 |
Figure 38. Find point clusters: Poles 86
| cluster | features | fraction | share |
|---|---|---|---|
| Noise | 149 | 0.3311 | 33.1% |
| 2 | 49 | 0.1089 | 10.9% |
| 5 | 35 | 0.07778 | 7.8% |
| 4 | 34 | 0.07556 | 7.6% |
| 6 | 31 | 0.06889 | 6.9% |
| 8 | 26 | 0.05778 | 5.8% |
| 3 | 23 | 0.05111 | 5.1% |
| 7 | 21 | 0.04667 | 4.7% |
| 9 | 19 | 0.04222 | 4.2% |
| 11 | 17 | 0.03778 | 3.8% |
| 0 | 16 | 0.03556 | 3.6% |
| 1 | 15 | 0.03333 | 3.3% |
| 10 | 15 | 0.03333 | 3.3% |
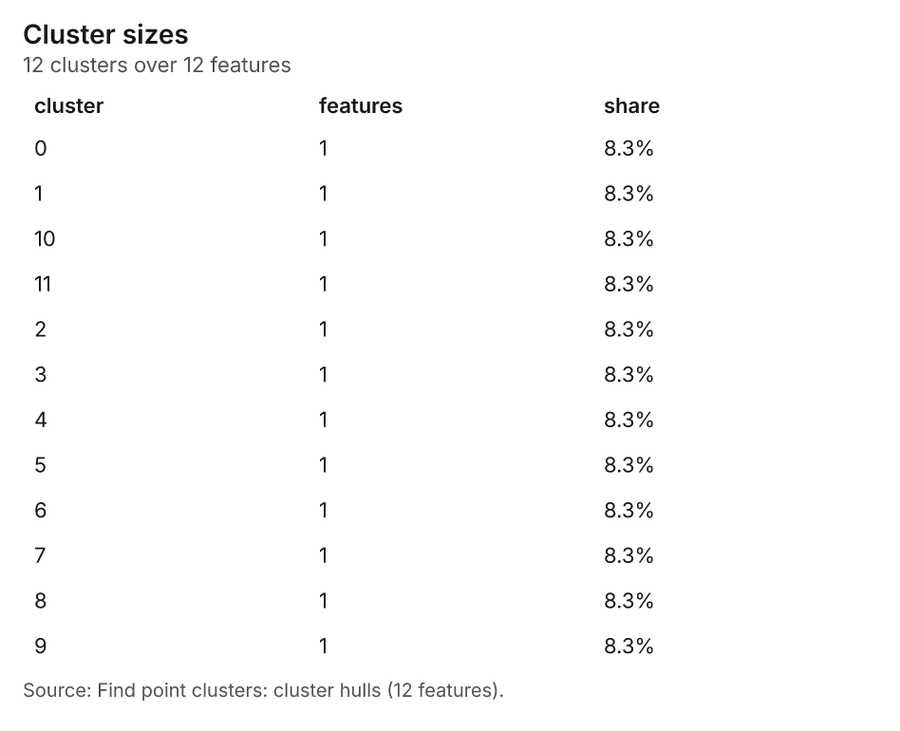
Figure 39. Find point clusters: cluster hulls 87
| cluster | features | fraction | share |
|---|---|---|---|
| 0 | 1 | 0.08333 | 8.3% |
| 1 | 1 | 0.08333 | 8.3% |
| 10 | 1 | 0.08333 | 8.3% |
| 11 | 1 | 0.08333 | 8.3% |
| 2 | 1 | 0.08333 | 8.3% |
| 3 | 1 | 0.08333 | 8.3% |
| 4 | 1 | 0.08333 | 8.3% |
| 5 | 1 | 0.08333 | 8.3% |
| 6 | 1 | 0.08333 | 8.3% |
| 7 | 1 | 0.08333 | 8.3% |
| 8 | 1 | 0.08333 | 8.3% |
| 9 | 1 | 0.08333 | 8.3% |
Figure 40. Find point clusters: Outages 88
| cluster | features | fraction | share |
|---|---|---|---|
| Noise | 985 | 0.597 | 59.7% |
| 5 | 121 | 0.07333 | 7.3% |
| 0 | 112 | 0.06788 | 6.8% |
| 1 | 81 | 0.04909 | 4.9% |
| 7 | 76 | 0.04606 | 4.6% |
| 3 | 56 | 0.03394 | 3.4% |
| 4 | 54 | 0.03273 | 3.3% |
| 6 | 34 | 0.02061 | 2.1% |
| 8 | 34 | 0.02061 | 2.1% |
| 2 | 32 | 0.01939 | 1.9% |
| 9 | 31 | 0.01879 | 1.9% |
| 10 | 20 | 0.01212 | 1.2% |
| 11 | 14 | 0.008485 | 0.8% |
Figure 41. Find point clusters: cluster hulls 89
| cluster | features | fraction | share |
|---|---|---|---|
| 0 | 1 | 0.08333 | 8.3% |
| 1 | 1 | 0.08333 | 8.3% |
| 10 | 1 | 0.08333 | 8.3% |
| 11 | 1 | 0.08333 | 8.3% |
| 2 | 1 | 0.08333 | 8.3% |
| 3 | 1 | 0.08333 | 8.3% |
| 4 | 1 | 0.08333 | 8.3% |
| 5 | 1 | 0.08333 | 8.3% |
| 6 | 1 | 0.08333 | 8.3% |
| 7 | 1 | 0.08333 | 8.3% |
| 8 | 1 | 0.08333 | 8.3% |
| 9 | 1 | 0.08333 | 8.3% |
Figure 42. Find point clusters: Vegetation work orders 90
| cluster | features | fraction | share |
|---|---|---|---|
| Noise | 157 | 0.3271 | 32.7% |
| 0 | 83 | 0.1729 | 17.3% |
| 1 | 56 | 0.1167 | 11.7% |
| 2 | 39 | 0.08125 | 8.1% |
| 4 | 36 | 0.075 | 7.5% |
| 7 | 36 | 0.075 | 7.5% |
| 6 | 20 | 0.04167 | 4.2% |
| 3 | 19 | 0.03958 | 4.0% |
| 5 | 19 | 0.03958 | 4.0% |
| 8 | 15 | 0.03125 | 3.1% |
Figure 43. Find point clusters: cluster hulls 91
| cluster | features | fraction | share |
|---|---|---|---|
| 0 | 1 | 0.1111 | 11.1% |
| 1 | 1 | 0.1111 | 11.1% |
| 2 | 1 | 0.1111 | 11.1% |
| 3 | 1 | 0.1111 | 11.1% |
| 4 | 1 | 0.1111 | 11.1% |
| 5 | 1 | 0.1111 | 11.1% |
| 6 | 1 | 0.1111 | 11.1% |
| 7 | 1 | 0.1111 | 11.1% |
| 8 | 1 | 0.1111 | 11.1% |
Figure 44. Find outliers: Service areas 92
| value | lag | type |
|---|---|---|
| -0.3267 | 2.336 | NS |
| 0.129 | 0.5255 | NS |
| -1.064 | -0.2187 | NS |
| -0.2187 | -0.8003 | NS |
| -0.4868 | -0.5612 | NS |
| 0.642 | -1.518 | NS |
| 1.464 | 0.129 | NS |
| 2.336 | -0.3267 | NS |
| -0.289 | -0.0449 | NS |
| 0.4018 | 0.129 | NS |
| -1.361 | -0.2016 | NS |
| -1.518 | 0.0776 | NS |
| 0.1915 | -0.4868 | NS |
| 0.1007 | -0.924 | NS |
Figure 45. Repeat and near repeat classification: Outages 93
| period | series | value |
|---|---|---|
| 2024-10-01 | vegetation | 28 |
| 2024-10-01 | equipment | 31 |
| 2024-10-01 | weather | 12 |
| 2024-10-01 | animal | 10 |
| 2024-10-01 | unknown | 6 |
| 2024-10-01 | Other | 1 |
| 2024-11-01 | vegetation | 13 |
| 2024-11-01 | equipment | 15 |
| 2024-11-01 | weather | 5 |
| 2024-11-01 | animal | 3 |
| 2024-11-01 | unknown | 2 |
| 2024-11-01 | Other | 1 |
| 2024-12-01 | vegetation | 15 |
| 2024-12-01 | equipment | 10 |
| 2024-12-01 | weather | 8 |
| 2024-12-01 | animal | 2 |
| 2024-12-01 | unknown | 1 |
| 2024-12-01 | Other | 0 |
| 2025-01-01 | vegetation | 20 |
| 2025-01-01 | equipment | 19 |
| 2025-01-01 | weather | 7 |
| 2025-01-01 | animal | 4 |
| 2025-01-01 | unknown | 3 |
| 2025-01-01 | Other | 1 |
| 2025-02-01 | vegetation | 25 |
| 2025-02-01 | equipment | 15 |
| 2025-02-01 | weather | 9 |
| 2025-02-01 | animal | 2 |
| 2025-02-01 | unknown | 2 |
| 2025-02-01 | Other | 2 |
| 2025-03-01 | vegetation | 25 |
| 2025-03-01 | equipment | 8 |
| 2025-03-01 | weather | 3 |
| 2025-03-01 | animal | 3 |
| 2025-03-01 | unknown | 2 |
| 2025-03-01 | Other | 1 |
| 2025-04-01 | vegetation | 15 |
| 2025-04-01 | equipment | 6 |
| 2025-04-01 | weather | 6 |
| 2025-04-01 | animal | 7 |
| 2025-04-01 | unknown | 4 |
| 2025-04-01 | Other | 1 |
| 2025-05-01 | vegetation | 22 |
| 2025-05-01 | equipment | 9 |
| 2025-05-01 | weather | 12 |
| 2025-05-01 | animal | 3 |
| 2025-05-01 | unknown | 2 |
| 2025-05-01 | Other | 0 |
| 2025-06-01 | vegetation | 28 |
| 2025-06-01 | equipment | 24 |
| 2025-06-01 | weather | 7 |
| 2025-06-01 | animal | 6 |
| 2025-06-01 | unknown | 5 |
| 2025-06-01 | Other | 3 |
| 2025-07-01 | vegetation | 37 |
| 2025-07-01 | equipment | 20 |
| 2025-07-01 | weather | 9 |
| 2025-07-01 | animal | 3 |
| 2025-07-01 | unknown | 5 |
| 2025-07-01 | Other | 2 |
| 2025-08-01 | vegetation | 26 |
| 2025-08-01 | equipment | 30 |
| 2025-08-01 | weather | 143 |
| 2025-08-01 | animal | 4 |
| 2025-08-01 | unknown | 1 |
| 2025-08-01 | Other | 3 |
| 2025-09-01 | vegetation | 50 |
| 2025-09-01 | equipment | 26 |
| 2025-09-01 | weather | 13 |
| 2025-09-01 | animal | 6 |
| 2025-09-01 | unknown | 0 |
| 2025-09-01 | Other | 6 |
| 2025-10-01 | vegetation | 43 |
| 2025-10-01 | equipment | 28 |
| 2025-10-01 | weather | 16 |
| 2025-10-01 | animal | 8 |
| 2025-10-01 | unknown | 4 |
| 2025-10-01 | Other | 3 |
| 2025-11-01 | vegetation | 18 |
| 2025-11-01 | equipment | 14 |
| 2025-11-01 | weather | 7 |
| 2025-11-01 | animal | 2 |
| 2025-11-01 | unknown | 3 |
| 2025-11-01 | Other | 1 |
| 2025-12-01 | vegetation | 18 |
| 2025-12-01 | equipment | 11 |
| 2025-12-01 | weather | 6 |
| 2025-12-01 | animal | 3 |
| 2025-12-01 | unknown | 0 |
| 2025-12-01 | Other | 0 |
| 2026-01-01 | vegetation | 39 |
| 2026-01-01 | equipment | 15 |
| 2026-01-01 | weather | 6 |
| 2026-01-01 | animal | 8 |
| 2026-01-01 | unknown | 7 |
| 2026-01-01 | Other | 4 |
| 2026-02-01 | vegetation | 23 |
| 2026-02-01 | equipment | 12 |
| 2026-02-01 | weather | 6 |
| 2026-02-01 | animal | 3 |
| 2026-02-01 | unknown | 3 |
| 2026-02-01 | Other | 2 |
| 2026-03-01 | vegetation | 19 |
| 2026-03-01 | equipment | 9 |
| 2026-03-01 | weather | 5 |
| 2026-03-01 | animal | 4 |
| 2026-03-01 | unknown | 3 |
| 2026-03-01 | Other | 0 |
| 2026-04-01 | vegetation | 23 |
| 2026-04-01 | equipment | 12 |
| 2026-04-01 | weather | 6 |
| 2026-04-01 | animal | 4 |
| 2026-04-01 | unknown | 4 |
| 2026-04-01 | Other | 0 |
| 2026-05-01 | vegetation | 18 |
| 2026-05-01 | equipment | 5 |
| 2026-05-01 | weather | 3 |
| 2026-05-01 | animal | 5 |
| 2026-05-01 | unknown | 2 |
| 2026-05-01 | Other | 2 |
| 2026-06-01 | vegetation | 38 |
| 2026-06-01 | equipment | 32 |
| 2026-06-01 | weather | 12 |
| 2026-06-01 | animal | 5 |
| 2026-06-01 | unknown | 2 |
| 2026-06-01 | Other | 3 |
| 2026-07-01 | vegetation | 39 |
| 2026-07-01 | equipment | 27 |
| 2026-07-01 | weather | 13 |
| 2026-07-01 | animal | 7 |
| 2026-07-01 | unknown | 5 |
| 2026-07-01 | Other | 5 |
| 2026-08-01 | vegetation | 33 |
| 2026-08-01 | equipment | 24 |
| 2026-08-01 | weather | 5 |
| 2026-08-01 | animal | 10 |
| 2026-08-01 | unknown | 1 |
| 2026-08-01 | Other | 1 |
| 2026-09-01 | vegetation | 29 |
| 2026-09-01 | equipment | 25 |
| 2026-09-01 | weather | 24 |
| 2026-09-01 | animal | 7 |
| 2026-09-01 | unknown | 7 |
| 2026-09-01 | Other | 1 |
Figure 46. Repeat and near repeat classification: Outages over time 94
| period | series | value |
|---|---|---|
| 2024-10-01 | vegetation | 28 |
| 2024-10-01 | equipment | 31 |
| 2024-10-01 | weather | 12 |
| 2024-10-01 | animal | 10 |
| 2024-10-01 | unknown | 6 |
| 2024-10-01 | Other | 1 |
| 2024-11-01 | vegetation | 13 |
| 2024-11-01 | equipment | 15 |
| 2024-11-01 | weather | 5 |
| 2024-11-01 | animal | 3 |
| 2024-11-01 | unknown | 2 |
| 2024-11-01 | Other | 1 |
| 2024-12-01 | vegetation | 15 |
| 2024-12-01 | equipment | 10 |
| 2024-12-01 | weather | 8 |
| 2024-12-01 | animal | 2 |
| 2024-12-01 | unknown | 1 |
| 2024-12-01 | Other | 0 |
| 2025-01-01 | vegetation | 20 |
| 2025-01-01 | equipment | 19 |
| 2025-01-01 | weather | 7 |
| 2025-01-01 | animal | 4 |
| 2025-01-01 | unknown | 3 |
| 2025-01-01 | Other | 1 |
| 2025-02-01 | vegetation | 25 |
| 2025-02-01 | equipment | 15 |
| 2025-02-01 | weather | 9 |
| 2025-02-01 | animal | 2 |
| 2025-02-01 | unknown | 2 |
| 2025-02-01 | Other | 2 |
| 2025-03-01 | vegetation | 25 |
| 2025-03-01 | equipment | 8 |
| 2025-03-01 | weather | 3 |
| 2025-03-01 | animal | 3 |
| 2025-03-01 | unknown | 2 |
| 2025-03-01 | Other | 1 |
| 2025-04-01 | vegetation | 15 |
| 2025-04-01 | equipment | 6 |
| 2025-04-01 | weather | 6 |
| 2025-04-01 | animal | 7 |
| 2025-04-01 | unknown | 4 |
| 2025-04-01 | Other | 1 |
| 2025-05-01 | vegetation | 22 |
| 2025-05-01 | equipment | 9 |
| 2025-05-01 | weather | 12 |
| 2025-05-01 | animal | 3 |
| 2025-05-01 | unknown | 2 |
| 2025-05-01 | Other | 0 |
| 2025-06-01 | vegetation | 28 |
| 2025-06-01 | equipment | 24 |
| 2025-06-01 | weather | 7 |
| 2025-06-01 | animal | 6 |
| 2025-06-01 | unknown | 5 |
| 2025-06-01 | Other | 3 |
| 2025-07-01 | vegetation | 37 |
| 2025-07-01 | equipment | 20 |
| 2025-07-01 | weather | 9 |
| 2025-07-01 | animal | 3 |
| 2025-07-01 | unknown | 5 |
| 2025-07-01 | Other | 2 |
| 2025-08-01 | vegetation | 26 |
| 2025-08-01 | equipment | 30 |
| 2025-08-01 | weather | 143 |
| 2025-08-01 | animal | 4 |
| 2025-08-01 | unknown | 1 |
| 2025-08-01 | Other | 3 |
| 2025-09-01 | vegetation | 50 |
| 2025-09-01 | equipment | 26 |
| 2025-09-01 | weather | 13 |
| 2025-09-01 | animal | 6 |
| 2025-09-01 | unknown | 0 |
| 2025-09-01 | Other | 6 |
| 2025-10-01 | vegetation | 43 |
| 2025-10-01 | equipment | 28 |
| 2025-10-01 | weather | 16 |
| 2025-10-01 | animal | 8 |
| 2025-10-01 | unknown | 4 |
| 2025-10-01 | Other | 3 |
| 2025-11-01 | vegetation | 18 |
| 2025-11-01 | equipment | 14 |
| 2025-11-01 | weather | 7 |
| 2025-11-01 | animal | 2 |
| 2025-11-01 | unknown | 3 |
| 2025-11-01 | Other | 1 |
| 2025-12-01 | vegetation | 18 |
| 2025-12-01 | equipment | 11 |
| 2025-12-01 | weather | 6 |
| 2025-12-01 | animal | 3 |
| 2025-12-01 | unknown | 0 |
| 2025-12-01 | Other | 0 |
| 2026-01-01 | vegetation | 39 |
| 2026-01-01 | equipment | 15 |
| 2026-01-01 | weather | 6 |
| 2026-01-01 | animal | 8 |
| 2026-01-01 | unknown | 7 |
| 2026-01-01 | Other | 4 |
| 2026-02-01 | vegetation | 23 |
| 2026-02-01 | equipment | 12 |
| 2026-02-01 | weather | 6 |
| 2026-02-01 | animal | 3 |
| 2026-02-01 | unknown | 3 |
| 2026-02-01 | Other | 2 |
| 2026-03-01 | vegetation | 19 |
| 2026-03-01 | equipment | 9 |
| 2026-03-01 | weather | 5 |
| 2026-03-01 | animal | 4 |
| 2026-03-01 | unknown | 3 |
| 2026-03-01 | Other | 0 |
| 2026-04-01 | vegetation | 23 |
| 2026-04-01 | equipment | 12 |
| 2026-04-01 | weather | 6 |
| 2026-04-01 | animal | 4 |
| 2026-04-01 | unknown | 4 |
| 2026-04-01 | Other | 0 |
| 2026-05-01 | vegetation | 18 |
| 2026-05-01 | equipment | 5 |
| 2026-05-01 | weather | 3 |
| 2026-05-01 | animal | 5 |
| 2026-05-01 | unknown | 2 |
| 2026-05-01 | Other | 2 |
| 2026-06-01 | vegetation | 38 |
| 2026-06-01 | equipment | 32 |
| 2026-06-01 | weather | 12 |
| 2026-06-01 | animal | 5 |
| 2026-06-01 | unknown | 2 |
| 2026-06-01 | Other | 3 |
| 2026-07-01 | vegetation | 39 |
| 2026-07-01 | equipment | 27 |
| 2026-07-01 | weather | 13 |
| 2026-07-01 | animal | 7 |
| 2026-07-01 | unknown | 5 |
| 2026-07-01 | Other | 5 |
| 2026-08-01 | vegetation | 33 |
| 2026-08-01 | equipment | 24 |
| 2026-08-01 | weather | 5 |
| 2026-08-01 | animal | 10 |
| 2026-08-01 | unknown | 1 |
| 2026-08-01 | Other | 1 |
| 2026-09-01 | vegetation | 29 |
| 2026-09-01 | equipment | 25 |
| 2026-09-01 | weather | 24 |
| 2026-09-01 | animal | 7 |
| 2026-09-01 | unknown | 7 |
| 2026-09-01 | Other | 1 |
Figure 47. Find point clusters: Vegetation work orders over time 95
| period | series | value |
|---|---|---|
| 2024-10-01 | 11 | 2 |
| 2024-10-01 | 6 | 0 |
| 2024-10-01 | 9 | 2 |
| 2024-10-01 | 12 | 0 |
| 2024-10-01 | 4 | 1 |
| 2024-10-01 | Other | 6 |
| 2024-11-01 | 11 | 0 |
| 2024-11-01 | 6 | 3 |
| 2024-11-01 | 9 | 0 |
| 2024-11-01 | 12 | 1 |
| 2024-11-01 | 4 | 1 |
| 2024-11-01 | Other | 7 |
| 2024-12-01 | 11 | 5 |
| 2024-12-01 | 6 | 0 |
| 2024-12-01 | 9 | 1 |
| 2024-12-01 | 12 | 3 |
| 2024-12-01 | 4 | 3 |
| 2024-12-01 | Other | 10 |
| 2025-01-01 | 11 | 2 |
| 2025-01-01 | 6 | 3 |
| 2025-01-01 | 9 | 0 |
| 2025-01-01 | 12 | 0 |
| 2025-01-01 | 4 | 3 |
| 2025-01-01 | Other | 5 |
| 2025-02-01 | 11 | 1 |
| 2025-02-01 | 6 | 2 |
| 2025-02-01 | 9 | 1 |
| 2025-02-01 | 12 | 2 |
| 2025-02-01 | 4 | 1 |
| 2025-02-01 | Other | 10 |
| 2025-03-01 | 11 | 1 |
| 2025-03-01 | 6 | 3 |
| 2025-03-01 | 9 | 5 |
| 2025-03-01 | 12 | 3 |
| 2025-03-01 | 4 | 2 |
| 2025-03-01 | Other | 16 |
| 2025-04-01 | 11 | 4 |
| 2025-04-01 | 6 | 3 |
| 2025-04-01 | 9 | 3 |
| 2025-04-01 | 12 | 3 |
| 2025-04-01 | 4 | 6 |
| 2025-04-01 | Other | 17 |
| 2025-05-01 | 11 | 2 |
| 2025-05-01 | 6 | 0 |
| 2025-05-01 | 9 | 2 |
| 2025-05-01 | 12 | 3 |
| 2025-05-01 | 4 | 2 |
| 2025-05-01 | Other | 16 |
| 2025-06-01 | 11 | 1 |
| 2025-06-01 | 6 | 1 |
| 2025-06-01 | 9 | 3 |
| 2025-06-01 | 12 | 1 |
| 2025-06-01 | 4 | 1 |
| 2025-06-01 | Other | 11 |
| 2025-07-01 | 11 | 2 |
| 2025-07-01 | 6 | 4 |
| 2025-07-01 | 9 | 4 |
| 2025-07-01 | 12 | 1 |
| 2025-07-01 | 4 | 2 |
| 2025-07-01 | Other | 7 |
| 2025-08-01 | 11 | 1 |
| 2025-08-01 | 6 | 0 |
| 2025-08-01 | 9 | 1 |
| 2025-08-01 | 12 | 0 |
| 2025-08-01 | 4 | 0 |
| 2025-08-01 | Other | 7 |
| 2025-09-01 | 11 | 1 |
| 2025-09-01 | 6 | 1 |
| 2025-09-01 | 9 | 2 |
| 2025-09-01 | 12 | 1 |
| 2025-09-01 | 4 | 2 |
| 2025-09-01 | Other | 5 |
| 2025-10-01 | 11 | 1 |
| 2025-10-01 | 6 | 3 |
| 2025-10-01 | 9 | 0 |
| 2025-10-01 | 12 | 2 |
| 2025-10-01 | 4 | 1 |
| 2025-10-01 | Other | 9 |
| 2025-11-01 | 11 | 1 |
| 2025-11-01 | 6 | 0 |
| 2025-11-01 | 9 | 1 |
| 2025-11-01 | 12 | 2 |
| 2025-11-01 | 4 | 2 |
| 2025-11-01 | Other | 3 |
| 2025-12-01 | 11 | 1 |
| 2025-12-01 | 6 | 3 |
| 2025-12-01 | 9 | 1 |
| 2025-12-01 | 12 | 3 |
| 2025-12-01 | 4 | 1 |
| 2025-12-01 | Other | 14 |
| 2026-01-01 | 11 | 3 |
| 2026-01-01 | 6 | 6 |
| 2026-01-01 | 9 | 1 |
| 2026-01-01 | 12 | 3 |
| 2026-01-01 | 4 | 2 |
| 2026-01-01 | Other | 14 |
| 2026-02-01 | 11 | 3 |
| 2026-02-01 | 6 | 2 |
| 2026-02-01 | 9 | 3 |
| 2026-02-01 | 12 | 3 |
| 2026-02-01 | 4 | 3 |
| 2026-02-01 | Other | 9 |
| 2026-03-01 | 11 | 1 |
| 2026-03-01 | 6 | 0 |
| 2026-03-01 | 9 | 2 |
| 2026-03-01 | 12 | 1 |
| 2026-03-01 | 4 | 4 |
| 2026-03-01 | Other | 12 |
| 2026-04-01 | 11 | 2 |
| 2026-04-01 | 6 | 4 |
| 2026-04-01 | 9 | 5 |
| 2026-04-01 | 12 | 3 |
| 2026-04-01 | 4 | 2 |
| 2026-04-01 | Other | 22 |
| 2026-05-01 | 11 | 3 |
| 2026-05-01 | 6 | 3 |
| 2026-05-01 | 9 | 1 |
| 2026-05-01 | 12 | 0 |
| 2026-05-01 | 4 | 1 |
| 2026-05-01 | Other | 17 |
| 2026-06-01 | 11 | 3 |
| 2026-06-01 | 6 | 1 |
| 2026-06-01 | 9 | 3 |
| 2026-06-01 | 12 | 2 |
| 2026-06-01 | 4 | 1 |
| 2026-06-01 | Other | 15 |
| 2026-07-01 | 11 | 2 |
| 2026-07-01 | 6 | 0 |
| 2026-07-01 | 9 | 0 |
| 2026-07-01 | 12 | 2 |
| 2026-07-01 | 4 | 1 |
| 2026-07-01 | Other | 16 |
| 2026-08-01 | 11 | 1 |
| 2026-08-01 | 6 | 2 |
| 2026-08-01 | 9 | 2 |
| 2026-08-01 | 12 | 0 |
| 2026-08-01 | 4 | 0 |
| 2026-08-01 | Other | 8 |
| 2026-09-01 | 11 | 3 |
| 2026-09-01 | 6 | 1 |
| 2026-09-01 | 9 | 0 |
| 2026-09-01 | 12 | 3 |
| 2026-09-01 | 4 | 0 |
| 2026-09-01 | Other | 6 |
Figure 48. Find point clusters: Outages over time 96
| period | series | value |
|---|---|---|
| 2024-10-01 | vegetation | 28 |
| 2024-10-01 | equipment | 31 |
| 2024-10-01 | weather | 12 |
| 2024-10-01 | animal | 10 |
| 2024-10-01 | unknown | 6 |
| 2024-10-01 | Other | 1 |
| 2024-11-01 | vegetation | 13 |
| 2024-11-01 | equipment | 15 |
| 2024-11-01 | weather | 5 |
| 2024-11-01 | animal | 3 |
| 2024-11-01 | unknown | 2 |
| 2024-11-01 | Other | 1 |
| 2024-12-01 | vegetation | 15 |
| 2024-12-01 | equipment | 10 |
| 2024-12-01 | weather | 8 |
| 2024-12-01 | animal | 2 |
| 2024-12-01 | unknown | 1 |
| 2024-12-01 | Other | 0 |
| 2025-01-01 | vegetation | 20 |
| 2025-01-01 | equipment | 19 |
| 2025-01-01 | weather | 7 |
| 2025-01-01 | animal | 4 |
| 2025-01-01 | unknown | 3 |
| 2025-01-01 | Other | 1 |
| 2025-02-01 | vegetation | 25 |
| 2025-02-01 | equipment | 15 |
| 2025-02-01 | weather | 9 |
| 2025-02-01 | animal | 2 |
| 2025-02-01 | unknown | 2 |
| 2025-02-01 | Other | 2 |
| 2025-03-01 | vegetation | 25 |
| 2025-03-01 | equipment | 8 |
| 2025-03-01 | weather | 3 |
| 2025-03-01 | animal | 3 |
| 2025-03-01 | unknown | 2 |
| 2025-03-01 | Other | 1 |
| 2025-04-01 | vegetation | 15 |
| 2025-04-01 | equipment | 6 |
| 2025-04-01 | weather | 6 |
| 2025-04-01 | animal | 7 |
| 2025-04-01 | unknown | 4 |
| 2025-04-01 | Other | 1 |
| 2025-05-01 | vegetation | 22 |
| 2025-05-01 | equipment | 9 |
| 2025-05-01 | weather | 12 |
| 2025-05-01 | animal | 3 |
| 2025-05-01 | unknown | 2 |
| 2025-05-01 | Other | 0 |
| 2025-06-01 | vegetation | 28 |
| 2025-06-01 | equipment | 24 |
| 2025-06-01 | weather | 7 |
| 2025-06-01 | animal | 6 |
| 2025-06-01 | unknown | 5 |
| 2025-06-01 | Other | 3 |
| 2025-07-01 | vegetation | 37 |
| 2025-07-01 | equipment | 20 |
| 2025-07-01 | weather | 9 |
| 2025-07-01 | animal | 3 |
| 2025-07-01 | unknown | 5 |
| 2025-07-01 | Other | 2 |
| 2025-08-01 | vegetation | 26 |
| 2025-08-01 | equipment | 30 |
| 2025-08-01 | weather | 143 |
| 2025-08-01 | animal | 4 |
| 2025-08-01 | unknown | 1 |
| 2025-08-01 | Other | 3 |
| 2025-09-01 | vegetation | 50 |
| 2025-09-01 | equipment | 26 |
| 2025-09-01 | weather | 13 |
| 2025-09-01 | animal | 6 |
| 2025-09-01 | unknown | 0 |
| 2025-09-01 | Other | 6 |
| 2025-10-01 | vegetation | 43 |
| 2025-10-01 | equipment | 28 |
| 2025-10-01 | weather | 16 |
| 2025-10-01 | animal | 8 |
| 2025-10-01 | unknown | 4 |
| 2025-10-01 | Other | 3 |
| 2025-11-01 | vegetation | 18 |
| 2025-11-01 | equipment | 14 |
| 2025-11-01 | weather | 7 |
| 2025-11-01 | animal | 2 |
| 2025-11-01 | unknown | 3 |
| 2025-11-01 | Other | 1 |
| 2025-12-01 | vegetation | 18 |
| 2025-12-01 | equipment | 11 |
| 2025-12-01 | weather | 6 |
| 2025-12-01 | animal | 3 |
| 2025-12-01 | unknown | 0 |
| 2025-12-01 | Other | 0 |
| 2026-01-01 | vegetation | 39 |
| 2026-01-01 | equipment | 15 |
| 2026-01-01 | weather | 6 |
| 2026-01-01 | animal | 8 |
| 2026-01-01 | unknown | 7 |
| 2026-01-01 | Other | 4 |
| 2026-02-01 | vegetation | 23 |
| 2026-02-01 | equipment | 12 |
| 2026-02-01 | weather | 6 |
| 2026-02-01 | animal | 3 |
| 2026-02-01 | unknown | 3 |
| 2026-02-01 | Other | 2 |
| 2026-03-01 | vegetation | 19 |
| 2026-03-01 | equipment | 9 |
| 2026-03-01 | weather | 5 |
| 2026-03-01 | animal | 4 |
| 2026-03-01 | unknown | 3 |
| 2026-03-01 | Other | 0 |
| 2026-04-01 | vegetation | 23 |
| 2026-04-01 | equipment | 12 |
| 2026-04-01 | weather | 6 |
| 2026-04-01 | animal | 4 |
| 2026-04-01 | unknown | 4 |
| 2026-04-01 | Other | 0 |
| 2026-05-01 | vegetation | 18 |
| 2026-05-01 | equipment | 5 |
| 2026-05-01 | weather | 3 |
| 2026-05-01 | animal | 5 |
| 2026-05-01 | unknown | 2 |
| 2026-05-01 | Other | 2 |
| 2026-06-01 | vegetation | 38 |
| 2026-06-01 | equipment | 32 |
| 2026-06-01 | weather | 12 |
| 2026-06-01 | animal | 5 |
| 2026-06-01 | unknown | 2 |
| 2026-06-01 | Other | 3 |
| 2026-07-01 | vegetation | 39 |
| 2026-07-01 | equipment | 27 |
| 2026-07-01 | weather | 13 |
| 2026-07-01 | animal | 7 |
| 2026-07-01 | unknown | 5 |
| 2026-07-01 | Other | 5 |
| 2026-08-01 | vegetation | 33 |
| 2026-08-01 | equipment | 24 |
| 2026-08-01 | weather | 5 |
| 2026-08-01 | animal | 10 |
| 2026-08-01 | unknown | 1 |
| 2026-08-01 | Other | 1 |
| 2026-09-01 | vegetation | 29 |
| 2026-09-01 | equipment | 25 |
| 2026-09-01 | weather | 24 |
| 2026-09-01 | animal | 7 |
| 2026-09-01 | unknown | 7 |
| 2026-09-01 | Other | 1 |
Figure 49. Hot spot analysis: Outages over time 97
| period | series | value |
|---|---|---|
| 2024-10-01 | vegetation | 28 |
| 2024-10-01 | equipment | 31 |
| 2024-10-01 | weather | 12 |
| 2024-10-01 | animal | 10 |
| 2024-10-01 | unknown | 6 |
| 2024-10-01 | Other | 1 |
| 2024-11-01 | vegetation | 13 |
| 2024-11-01 | equipment | 15 |
| 2024-11-01 | weather | 5 |
| 2024-11-01 | animal | 3 |
| 2024-11-01 | unknown | 2 |
| 2024-11-01 | Other | 1 |
| 2024-12-01 | vegetation | 15 |
| 2024-12-01 | equipment | 10 |
| 2024-12-01 | weather | 8 |
| 2024-12-01 | animal | 2 |
| 2024-12-01 | unknown | 1 |
| 2024-12-01 | Other | 0 |
| 2025-01-01 | vegetation | 20 |
| 2025-01-01 | equipment | 19 |
| 2025-01-01 | weather | 7 |
| 2025-01-01 | animal | 4 |
| 2025-01-01 | unknown | 3 |
| 2025-01-01 | Other | 1 |
| 2025-02-01 | vegetation | 25 |
| 2025-02-01 | equipment | 15 |
| 2025-02-01 | weather | 9 |
| 2025-02-01 | animal | 2 |
| 2025-02-01 | unknown | 2 |
| 2025-02-01 | Other | 2 |
| 2025-03-01 | vegetation | 25 |
| 2025-03-01 | equipment | 8 |
| 2025-03-01 | weather | 3 |
| 2025-03-01 | animal | 3 |
| 2025-03-01 | unknown | 2 |
| 2025-03-01 | Other | 1 |
| 2025-04-01 | vegetation | 15 |
| 2025-04-01 | equipment | 6 |
| 2025-04-01 | weather | 6 |
| 2025-04-01 | animal | 7 |
| 2025-04-01 | unknown | 4 |
| 2025-04-01 | Other | 1 |
| 2025-05-01 | vegetation | 22 |
| 2025-05-01 | equipment | 9 |
| 2025-05-01 | weather | 12 |
| 2025-05-01 | animal | 3 |
| 2025-05-01 | unknown | 2 |
| 2025-05-01 | Other | 0 |
| 2025-06-01 | vegetation | 28 |
| 2025-06-01 | equipment | 24 |
| 2025-06-01 | weather | 7 |
| 2025-06-01 | animal | 6 |
| 2025-06-01 | unknown | 5 |
| 2025-06-01 | Other | 3 |
| 2025-07-01 | vegetation | 37 |
| 2025-07-01 | equipment | 20 |
| 2025-07-01 | weather | 9 |
| 2025-07-01 | animal | 3 |
| 2025-07-01 | unknown | 5 |
| 2025-07-01 | Other | 2 |
| 2025-08-01 | vegetation | 26 |
| 2025-08-01 | equipment | 30 |
| 2025-08-01 | weather | 143 |
| 2025-08-01 | animal | 4 |
| 2025-08-01 | unknown | 1 |
| 2025-08-01 | Other | 3 |
| 2025-09-01 | vegetation | 50 |
| 2025-09-01 | equipment | 26 |
| 2025-09-01 | weather | 13 |
| 2025-09-01 | animal | 6 |
| 2025-09-01 | unknown | 0 |
| 2025-09-01 | Other | 6 |
| 2025-10-01 | vegetation | 43 |
| 2025-10-01 | equipment | 28 |
| 2025-10-01 | weather | 16 |
| 2025-10-01 | animal | 8 |
| 2025-10-01 | unknown | 4 |
| 2025-10-01 | Other | 3 |
| 2025-11-01 | vegetation | 18 |
| 2025-11-01 | equipment | 14 |
| 2025-11-01 | weather | 7 |
| 2025-11-01 | animal | 2 |
| 2025-11-01 | unknown | 3 |
| 2025-11-01 | Other | 1 |
| 2025-12-01 | vegetation | 18 |
| 2025-12-01 | equipment | 11 |
| 2025-12-01 | weather | 6 |
| 2025-12-01 | animal | 3 |
| 2025-12-01 | unknown | 0 |
| 2025-12-01 | Other | 0 |
| 2026-01-01 | vegetation | 39 |
| 2026-01-01 | equipment | 15 |
| 2026-01-01 | weather | 6 |
| 2026-01-01 | animal | 8 |
| 2026-01-01 | unknown | 7 |
| 2026-01-01 | Other | 4 |
| 2026-02-01 | vegetation | 23 |
| 2026-02-01 | equipment | 12 |
| 2026-02-01 | weather | 6 |
| 2026-02-01 | animal | 3 |
| 2026-02-01 | unknown | 3 |
| 2026-02-01 | Other | 2 |
| 2026-03-01 | vegetation | 19 |
| 2026-03-01 | equipment | 9 |
| 2026-03-01 | weather | 5 |
| 2026-03-01 | animal | 4 |
| 2026-03-01 | unknown | 3 |
| 2026-03-01 | Other | 0 |
| 2026-04-01 | vegetation | 23 |
| 2026-04-01 | equipment | 12 |
| 2026-04-01 | weather | 6 |
| 2026-04-01 | animal | 4 |
| 2026-04-01 | unknown | 4 |
| 2026-04-01 | Other | 0 |
| 2026-05-01 | vegetation | 18 |
| 2026-05-01 | equipment | 5 |
| 2026-05-01 | weather | 3 |
| 2026-05-01 | animal | 5 |
| 2026-05-01 | unknown | 2 |
| 2026-05-01 | Other | 2 |
| 2026-06-01 | vegetation | 38 |
| 2026-06-01 | equipment | 32 |
| 2026-06-01 | weather | 12 |
| 2026-06-01 | animal | 5 |
| 2026-06-01 | unknown | 2 |
| 2026-06-01 | Other | 3 |
| 2026-07-01 | vegetation | 39 |
| 2026-07-01 | equipment | 27 |
| 2026-07-01 | weather | 13 |
| 2026-07-01 | animal | 7 |
| 2026-07-01 | unknown | 5 |
| 2026-07-01 | Other | 5 |
| 2026-08-01 | vegetation | 33 |
| 2026-08-01 | equipment | 24 |
| 2026-08-01 | weather | 5 |
| 2026-08-01 | animal | 10 |
| 2026-08-01 | unknown | 1 |
| 2026-08-01 | Other | 1 |
| 2026-09-01 | vegetation | 29 |
| 2026-09-01 | equipment | 25 |
| 2026-09-01 | weather | 24 |
| 2026-09-01 | animal | 7 |
| 2026-09-01 | unknown | 7 |
| 2026-09-01 | Other | 1 |
GeoBit Large Spatial Model. Findings are labeled Evidenced (computed by a tool), Inferred (a reading or reasoning) or Unverified (no evidence yet).