Sample: Water utility, Cape Town: report
Project: Sample: Water utility, Cape Town
Goal: Describe the project Sample: Water utility, Cape Town: run the analyses that tell the most about its data, draw every result, and write a cited report.
Run: e33b2a03-f978-4654-94e4-ffd327ff8f7b (running, 11 agent run(s))
Generated: 2026-10-18T05:36:20Z, version 1
Model cost: USD 0.0000 over 0 model call(s)
Data used
| Data | Kind | Rows | Time span | Summary | Source |
|---|---|---|---|---|---|
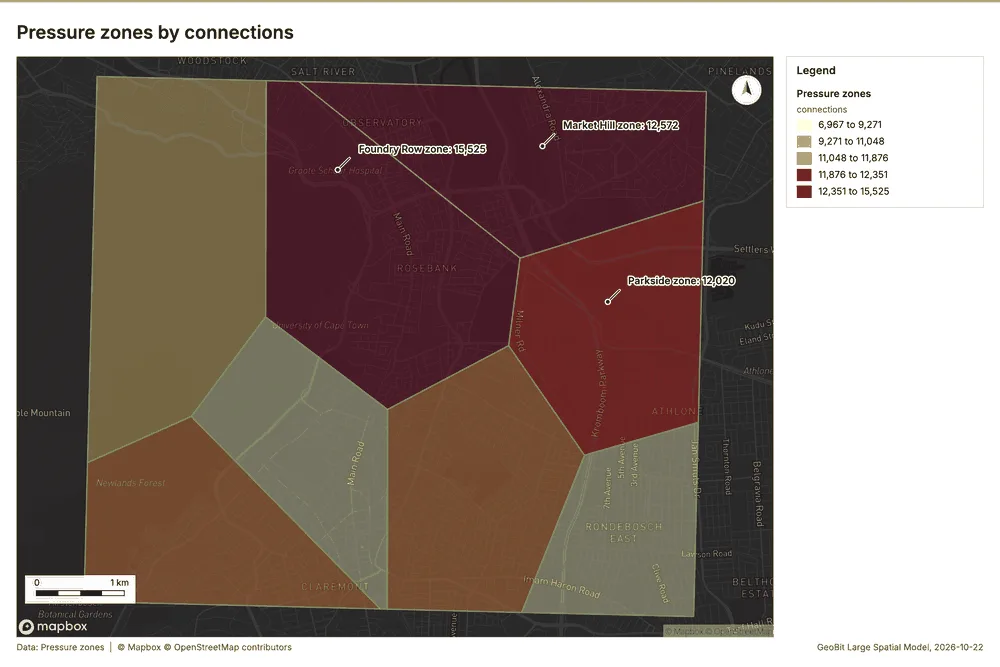
| Pressure zones | vector, Polygon | 8 | 8 polygon (area) features; 'connections' 6,967 to 15,525 (mean 1.113e+04); 'target_pressure_m' 35 to 50 (mean 42.5); named by 'name' (e.g. Millbrook zone, Canal Side zone, Station Quarter zone); total area 41.98 km2; extent 18.4313,-33.9878 to 18.5086,-33.9322. Areas (Pressure zones) with connections to compare and map. | 96 | |
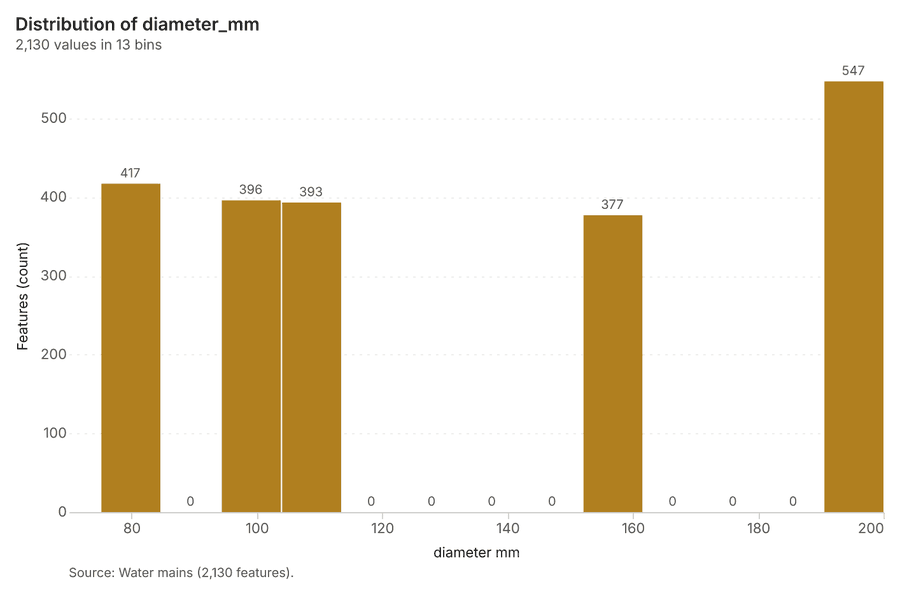
| Water mains | vector, LineString | 2,130 | 2,130 line features; 'material' has 5 values (top: uPVC 655, cast iron 514, asbestos cement 393); 'diameter_mm' 75 to 200 (mean 133.3); 'install_year' 1,938 to 2,024 (mean 1983); 'length_m' 120 to 271 (mean 191.3); total length 408.3 km; extent 18.4321,-33.9871 to 18.5080,-33.9329. Lines (Water mains) such as routes or networks. | 97 | |
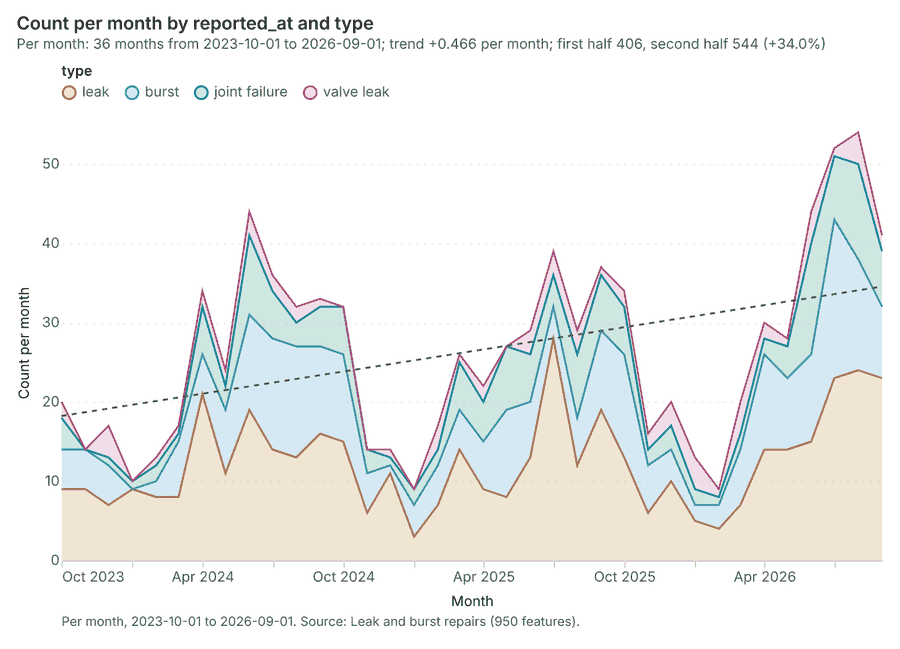
| Leak and burst repairs | vector, Point | 950 | 2023-10-01 to 2026-09-30 | 950 point features; dated by 'reported_at' from 2023-10-01 to 2026-09-30; 'type' has 4 values (top: leak 447, burst 273, joint failure 163); 'material' has 5 values (top: cast iron 609, asbestos cement 201, uPVC 71); 'water_lost_kl' 0.6 to 401.9 (mean 24.65); 'repair_hours' 1.1 to 26.8 (mean 5.718); extent 18.4325,-33.9862 to 18.5076,-33.9336. Dated point events by type: where and when Leak and burst repairs happen. | 2 |
| Reservoirs | vector, Point | 4 | 4 point features; 'capacity_ml' 27 to 77 (mean 55.5); 'top_water_level_m' 141 to 228 (mean 175.5); named by 'name' (e.g. Kloof Reservoir, Berg Reservoir, Vlei Reservoir); extent 18.4404,-33.9811 to 18.5008,-33.9377. Point locations of Reservoirs. | 98 | |
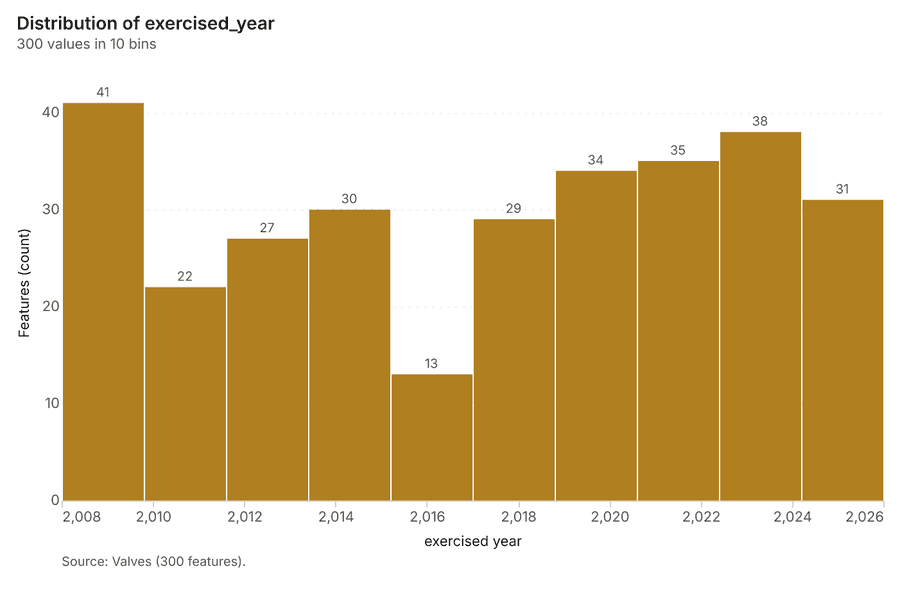
| Valves | vector, Point | 300 | 300 point features; 'type' has 3 values (top: isolation 148, air release 79, pressure reducing 73); 'status' has 3 values (top: open 178, closed 63, unknown 59); 'exercised_year' 2,008 to 2,026 (mean 2017); extent 18.4322,-33.9863 to 18.5081,-33.9330. Point locations of Valves by type. | 99 | |
| Fire hydrants | vector, Point | 250 | 250 point features; 'flow_l_s' 8 to 40 (mean 23.98); 'last_test_year' 2,019 to 2,026 (mean 2023); extent 18.4333,-33.9861 to 18.5076,-33.9337. Point locations of Fire hydrants. | 100 | |
| Customer complaints | vector, Point | 520 | 2025-10-01 to 2026-09-29 | 520 point features; dated by 'date' from 2025-10-01 to 2026-09-29; 'issue' has 4 values (top: low pressure 199, high bill 146, no water 128); extent 18.4339,-33.9870 to 18.5063,-33.9328. Dated point events by issue: where and when Customer complaints happen. | 3 |
| Zone meter readings by month | table | 192 | 2024-10-01 to 2026-09-01 | Table of 192 rows and 6 columns without geometry; dated by 'month' from 2024-10-01 to 2026-09-01; 'supplied_ml' 3260 to 1.097e+04 (mean 6319); 'billed_ml' 2602 to 7144 (mean 4924); 'nrw_pct' 13.1 to 39 (mean 21.25). A table of Zone meter readings by month without locations. | 4 |
| Pipe replacement plan | table | 220 | Table of 220 rows and 4 columns without geometry; 'priority' 1 to 4 (mean 2.364); 'planned_year' 2,027 to 2,030 (mean 2028); 'est_cost_zar' 568,625 to 1,685,831 (mean 1,043,948). A table of Pipe replacement plan without locations. | 101 | |
| Non-revenue water briefing | document | 1-page md document 'Non-revenue water briefing'; language en; mentions 3 place(s): Foundry Row zone (3), Foundry Row (2), Kloof Reservoir (1). A document about Foundry Row zone, Foundry Row, Kloof Reservoir. | 102 | ||
| Sample: Water utility, Cape Town | record | 103 | |||
| Emerging hot spots: Leak and burst repairs | layer, Polygon | 71 | 104 | ||
| Emerging hot spots: Customer complaints | layer, Polygon | 75 | 105 | ||
| Hot spot analysis: Valves | layer, Polygon | 53 | 106 | ||
| Hot spot analysis: Leak and burst repairs | layer, Polygon | 184 | 107 | ||
| Hot spot analysis: Customer complaints | layer, Polygon | 185 | 108 | ||
| Calculate density: Valves | layer, Polygon | 257 | 109 | ||
| Calculate density: Leak and burst repairs | layer, Polygon | 1,220 | 110 | ||
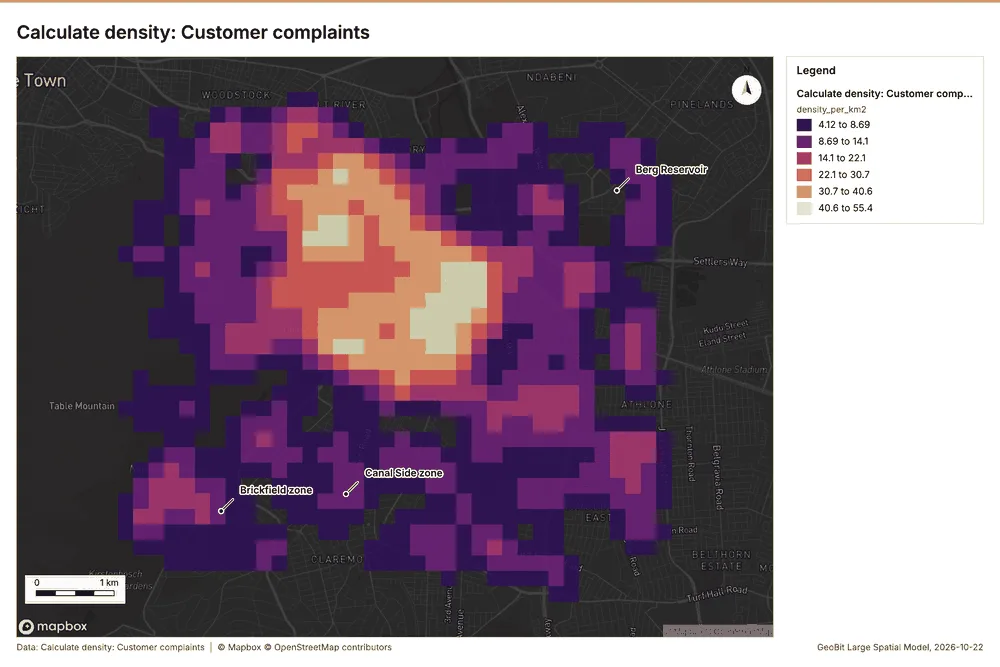
| Calculate density: Customer complaints | layer, Polygon | 1,200 | 111 | ||
| Summarize within: Pressure zones | layer, Polygon | 8 | 112 | ||
| Summarize within: Pressure zones | layer, Polygon | 8 | 113 | ||
| Summarize within: Pressure zones | layer, Polygon | 8 | 114 | ||
| Find point clusters: Valves | layer, Point | 300 | 115 | ||
| Find point clusters: cluster hulls | layer, Polygon | 11 | 116 | ||
| Find point clusters: Leak and burst repairs | layer, Point | 950 | 117 | ||
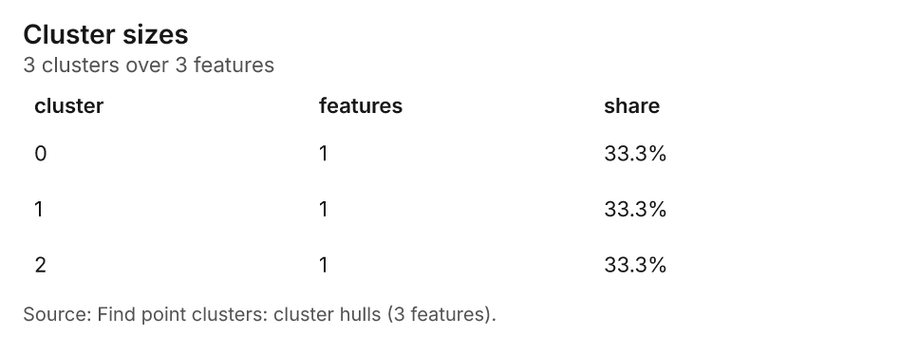
| Find point clusters: cluster hulls | layer, Polygon | 3 | 118 | ||
| Find point clusters: Customer complaints | layer, Point | 520 | 119 | ||
| Find point clusters: cluster hulls | layer, Polygon | 3 | 120 | ||
| Find outliers: Pressure zones | layer, Polygon | 8 | 121 | ||
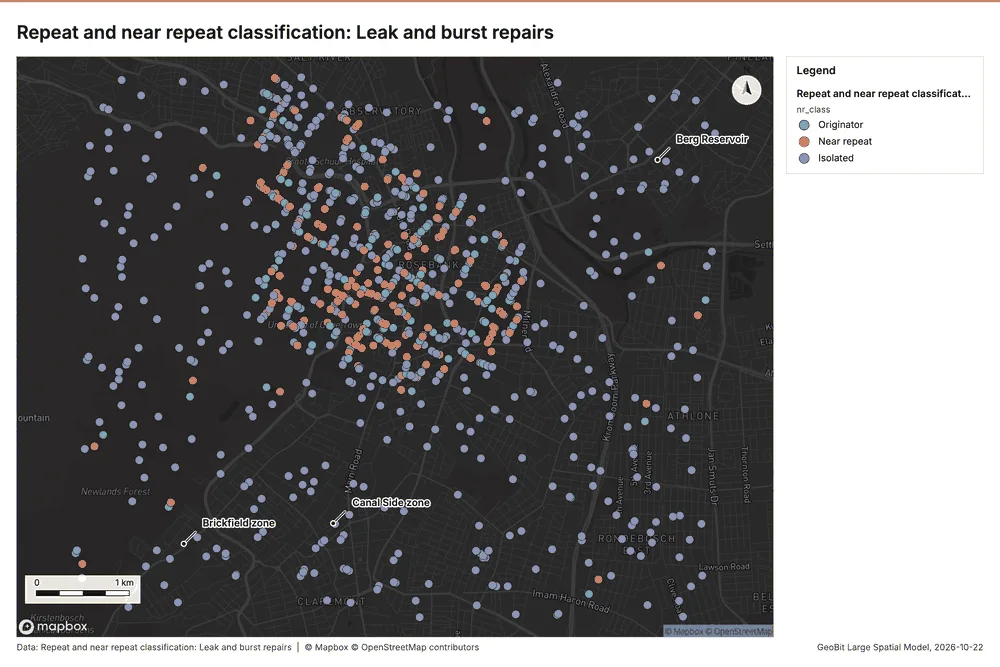
| Repeat and near repeat classification: Leak and burst repairs | layer, Point | 950 | 122 |
Timeline
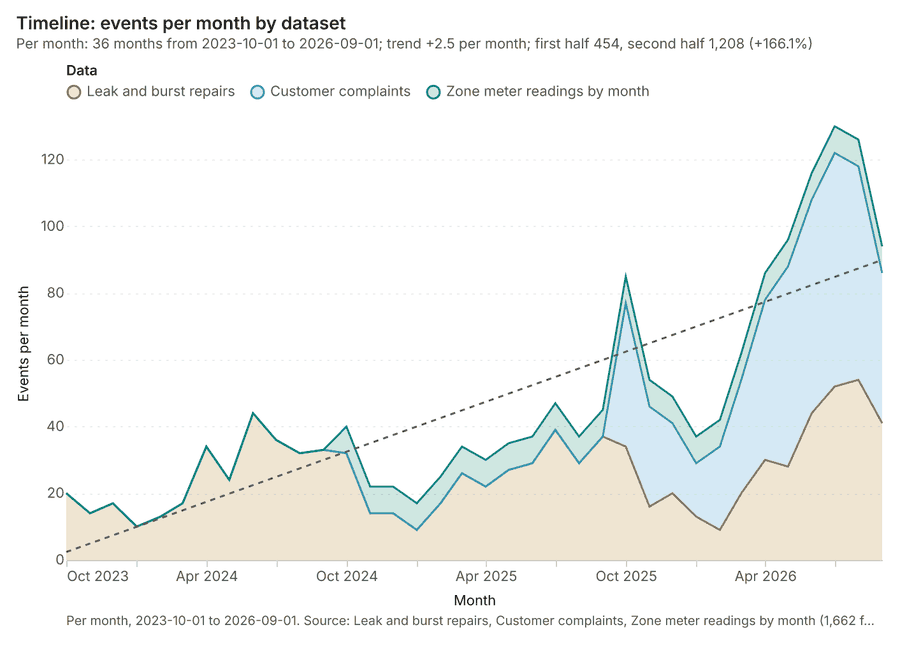
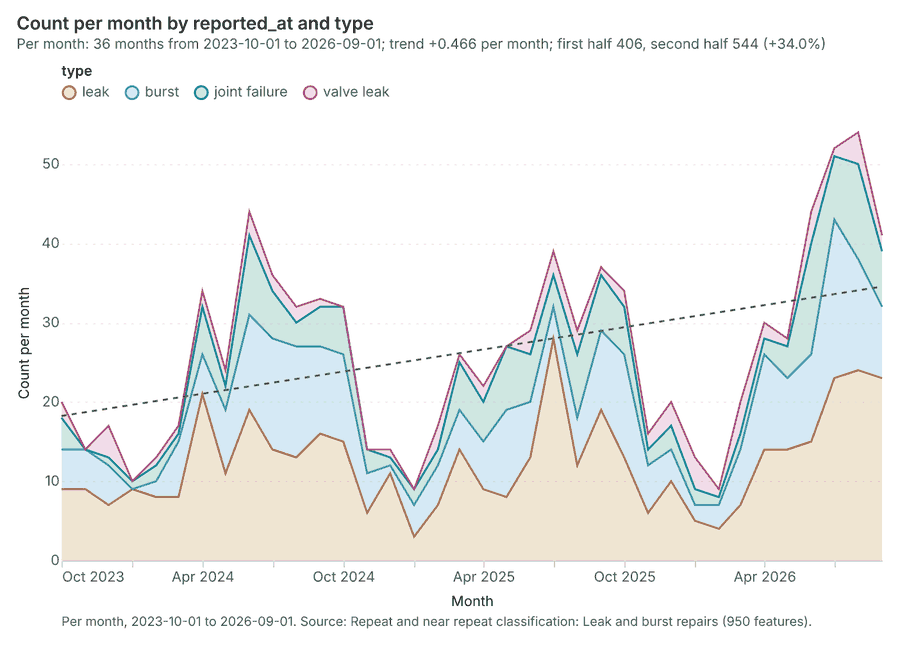
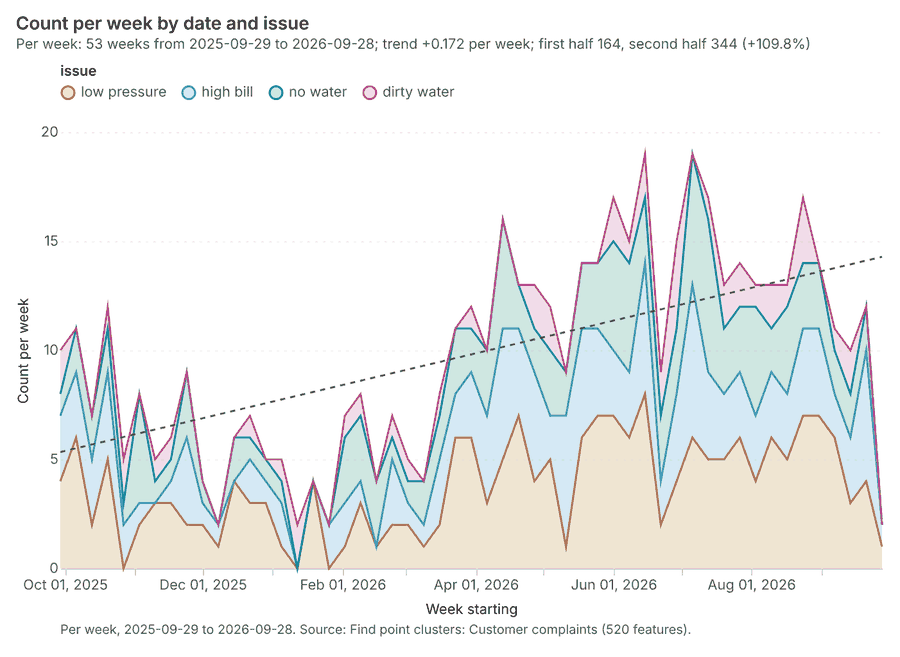
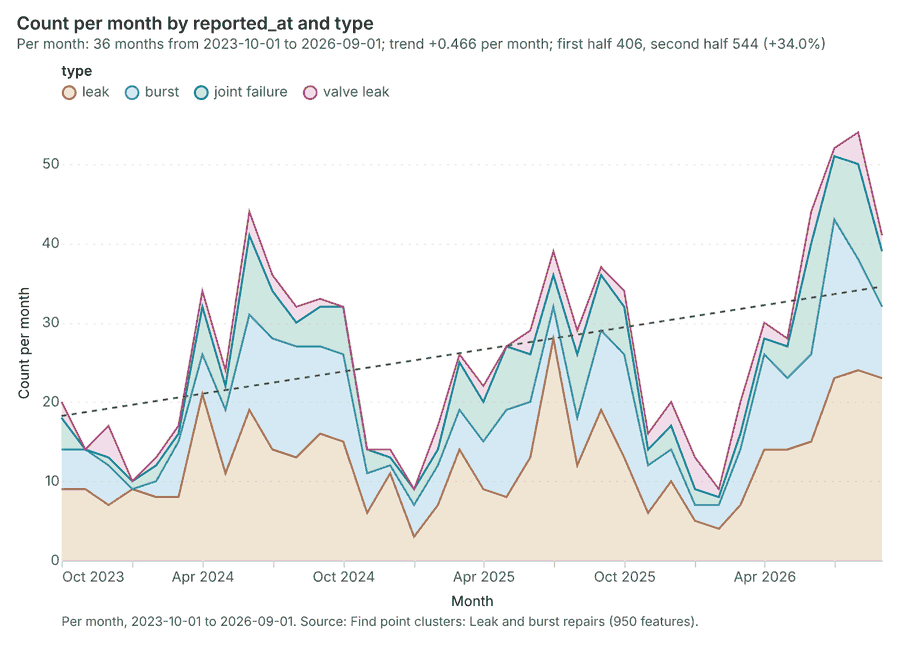
The timeline counts 1,662 dated events in Leak and burst repairs, Customer complaints, Zone meter readings by month per month, from October 2023 to September 2026 1234. By dataset: Leak and burst repairs 950; Customer complaints 520; Zone meter readings by month 192 1. The trend is +2.5 events per month; the second half of the months has 1,208 against 454 in the first (+166.1%) 1.
Busiest months
Quietest months
Space time hot spots
What this analysis is. Emerging hot spots: Where hot spots are new, consecutive, intensifying, persistent, diminishing, sporadic, oscillating or historical over time 5. In ArcGIS it is Emerging Hot Spot Analysis or Create Space Time Cube 5.
Why it was run on this data. Leak and burst repairs carry dates in 'reported_at': emerging hot spot analysis finds new, intensifying and fading hot spots per month 6.
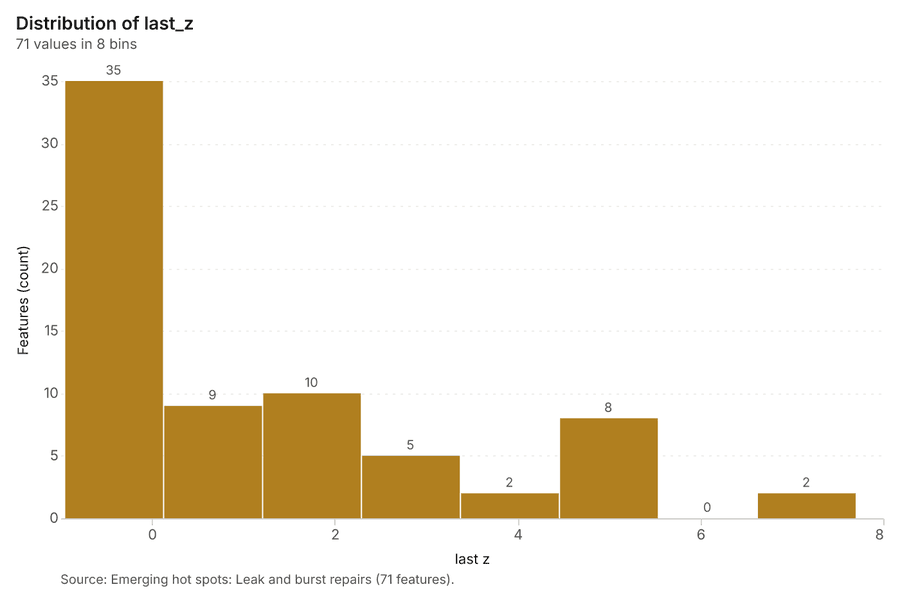
What it found. The analysis generated 1 layer saved named Emerging hot spots: Leak and burst repairs 7. Processing the Leak and burst repairs data 8 resulted in a count of 71 features 7. In total, 950 features were used during this execution 7, which took an elapsed time of 19 ms 7. The billing cost for this operation was 0.1475 7.
| Result | Value |
|---|---|
| result, count | 71 |
| result, elapsed ms | 19 |
| result, resolution | 8 |
| result, features used | 950 |
| result, time neighbors | 0 |
| billing, cost | 0.1475 |
| billing, list price | 0.1475 |
| billing, upstream cost | 0 |
Findings
- Evidenced: Space time hot spots on Leak and burst repairs: Emerging hot spots: 1 layer saved: Emerging hot spots: Leak and burst repairs (71 features) 78.
- Evidenced: It reported result, count 71; result, elapsed ms 19; result, resolution 8; result, features used 950; result, time neighbors 0; billing, cost 0.1475 7.
Tool gp_space_time_hot_spots; parameters {"project": "0f6d1895-598a-4c17-a195-fc538533c4a3", "features": {"layer": "Leak and burst repairs (7e6cb18c)"}, "interval": "month", "bin_shape": "h3", "resolution": 8, "time_field": "reported_at"}
Space time hot spots
What this analysis is. Emerging hot spots: Where hot spots are new, consecutive, intensifying, persistent, diminishing, sporadic, oscillating or historical over time 5. In ArcGIS it is Emerging Hot Spot Analysis or Create Space Time Cube 5.
Why it was run on this data. Customer complaints carry dates in 'date': emerging hot spot analysis finds new, intensifying and fading hot spots per week 9.
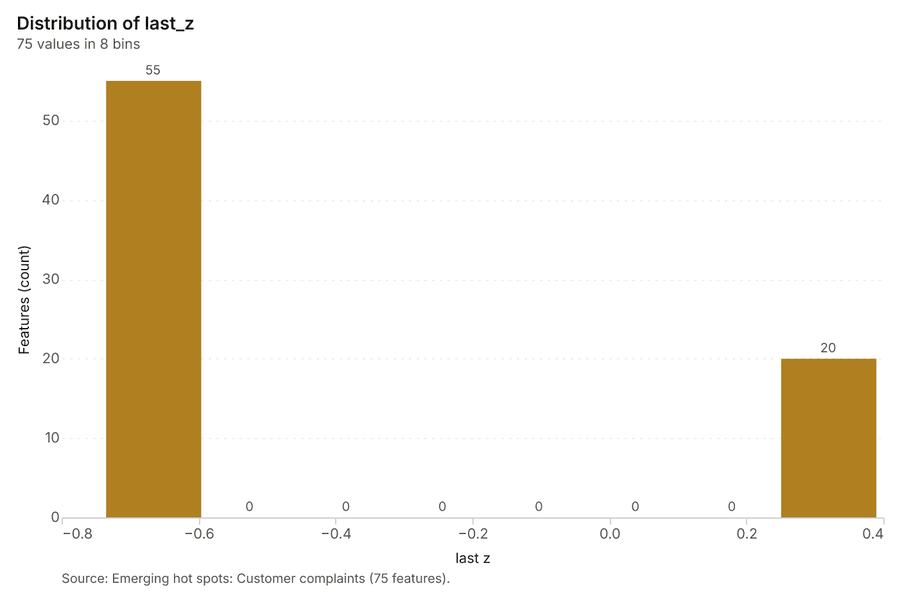
What it found. Space time hot spots on Customer complaints: Emerging hot spots: 1 layer saved: Emerging hot spots: Customer complaints (75 features) 1011. It reported result, count 75; result, elapsed ms 15; result, resolution 8; result, features used 520; result, time neighbors 0; billing, cost 0.126 10.
| Result | Value |
|---|---|
| result, count | 75 |
| result, elapsed ms | 15 |
| result, resolution | 8 |
| result, features used | 520 |
| result, time neighbors | 0 |
| billing, cost | 0.126 |
| billing, list price | 0.126 |
| billing, upstream cost | 0 |
Findings
- Evidenced: Space time hot spots on Customer complaints: Emerging hot spots: 1 layer saved: Emerging hot spots: Customer complaints (75 features) 1011.
- Evidenced: It reported result, count 75; result, elapsed ms 15; result, resolution 8; result, features used 520; result, time neighbors 0; billing, cost 0.126 10.
Tool gp_space_time_hot_spots; parameters {"project": "0f6d1895-598a-4c17-a195-fc538533c4a3", "features": {"layer": "Customer complaints (56e8a858)"}, "interval": "week", "bin_shape": "h3", "resolution": 8, "time_field": "date"}
Hot spots
What this analysis is. Hot spot analysis: Getis-Ord Gi* hot and cold spots with z-scores, p-values and confidence bins 12. In ArcGIS it is Find Hot Spots or Hot Spot Analysis (Getis-Ord Gi*); in QGIS, qgis:hotspot (plugin) 12.
Why it was run on this data. 300 points: Getis-Ord Gi* tests whether the concentrations in Valves are statistically significant 13.
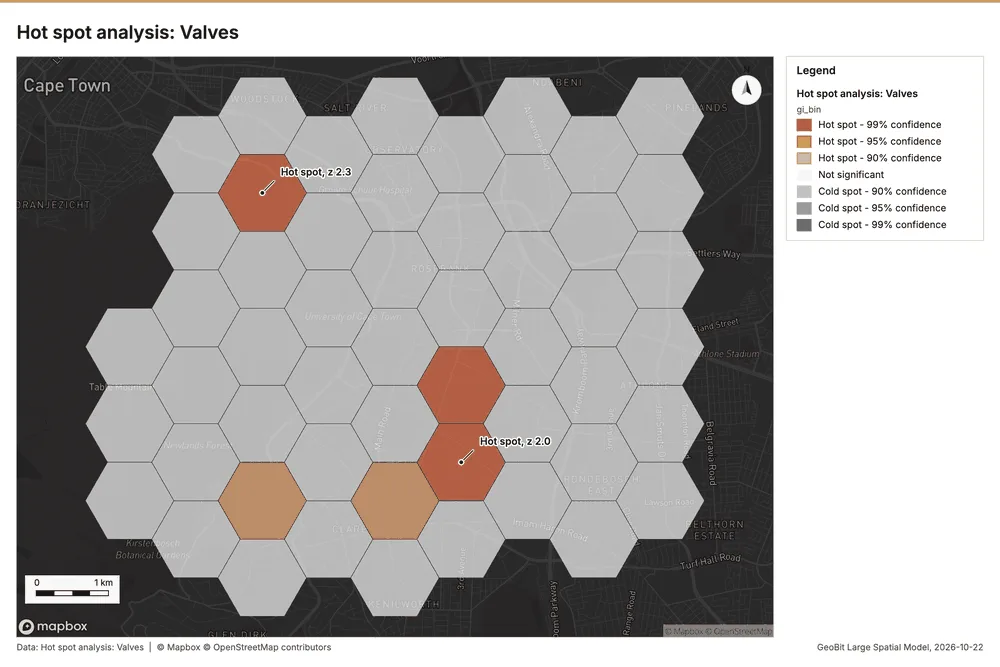
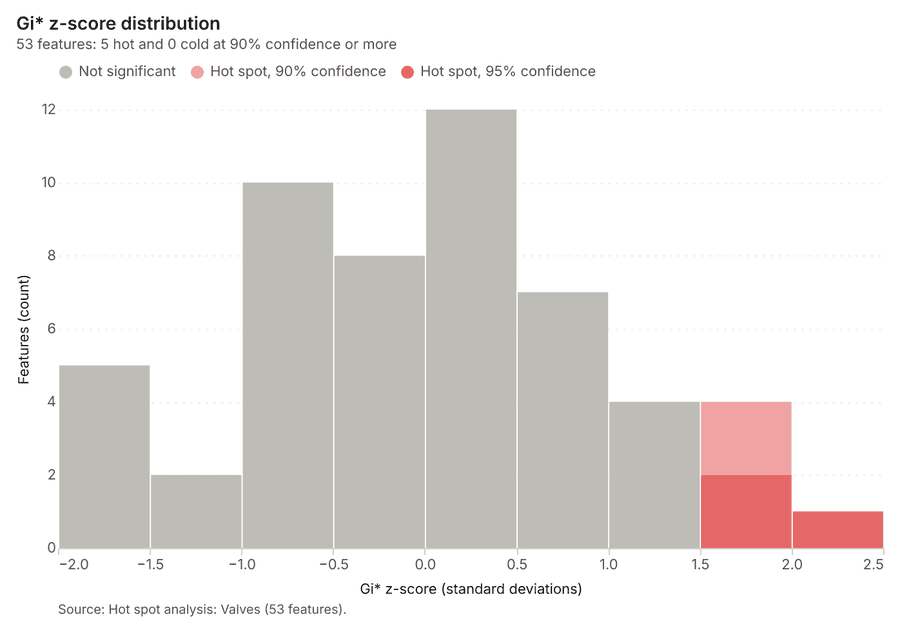
What it found. Hot spots on Valves: Hot spot analysis: 1 layer saved: Hot spot analysis: Valves (53 features) 1415. It reported result, bins 53; result, count 53; result, elapsed ms 6; result, cell size m 1,000; result, incidents used 300; result, distance band m 1,000 14.
| Result | Value |
|---|---|
| result, bins | 53 |
| result, count | 53 |
| result, elapsed ms | 6 |
| result, cell size m | 1,000 |
| result, incidents used | 300 |
| result, distance band m | 1,000 |
| billing, cost | 0.056 |
| billing, list price | 0.056 |
| billing, upstream cost | 0 |
Findings
- Evidenced: Hot spots on Valves: Hot spot analysis: 1 layer saved: Hot spot analysis: Valves (53 features) 1415.
- Evidenced: It reported result, bins 53; result, count 53; result, elapsed ms 6; result, cell size m 1,000; result, incidents used 300; result, distance band m 1,000 14.
Tool gp_hot_spots; parameters {"project": "0f6d1895-598a-4c17-a195-fc538533c4a3", "features": {"layer": "Valves (c6aecae7)"}, "aggregation": "hexagon", "cell_size_m": 1000.0, "distance_band_m": 1000.0}
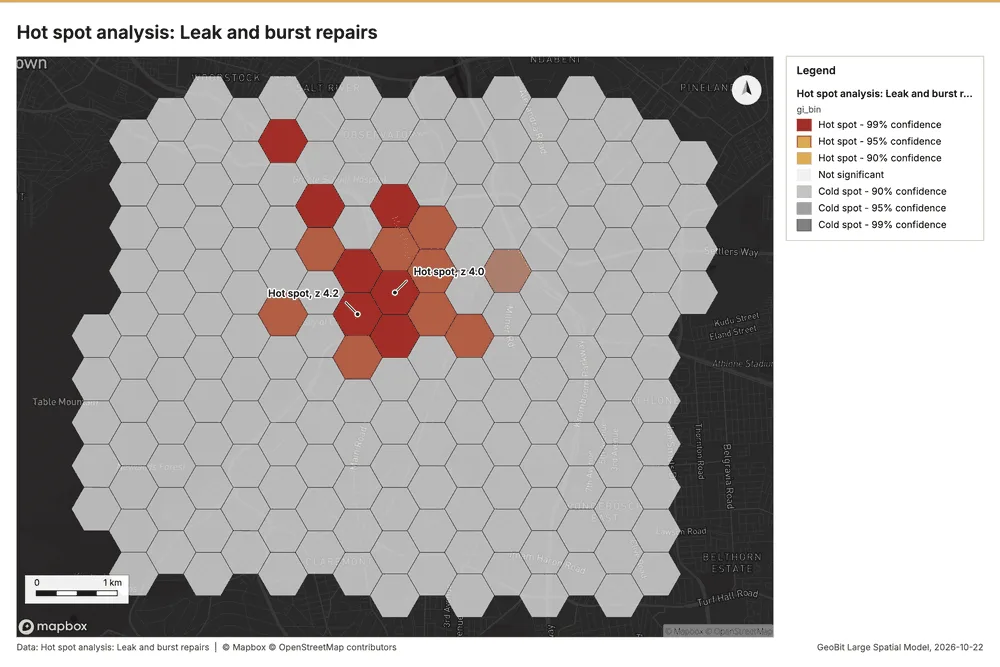
Hot spots
What this analysis is. Hot spot analysis: Getis-Ord Gi* hot and cold spots with z-scores, p-values and confidence bins 12. In ArcGIS it is Find Hot Spots or Hot Spot Analysis (Getis-Ord Gi*); in QGIS, qgis:hotspot (plugin) 12.
Why it was run on this data. 950 points: Getis-Ord Gi* tests whether the concentrations in Leak and burst repairs are statistically significant 16.
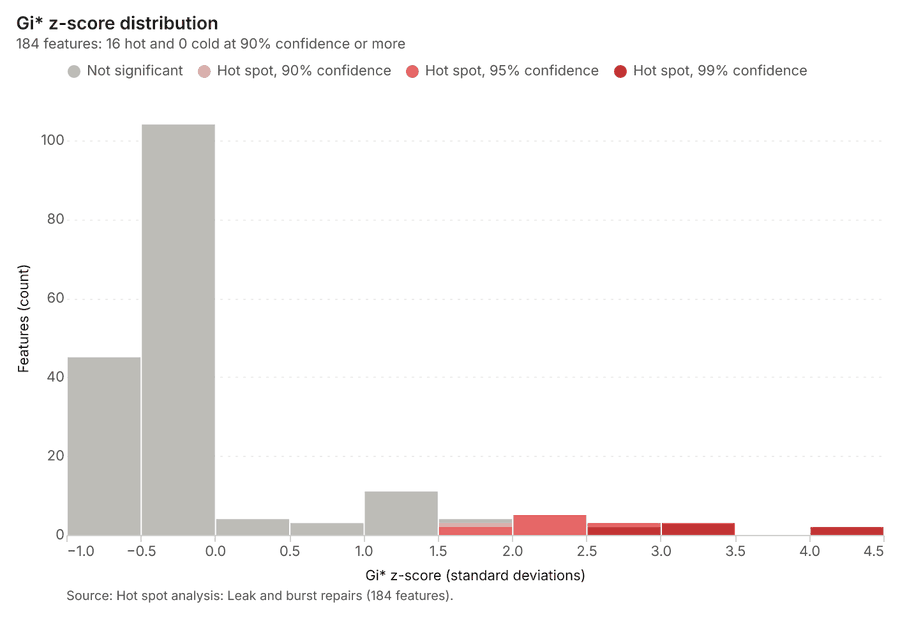
What it found. Hot spots on Leak and burst repairs: Hot spot analysis: 1 layer saved: Hot spot analysis: Leak and burst repairs (184 features) 817. It reported result, bins 184; result, count 184; result, elapsed ms 11; result, cell size m 500; result, incidents used 950; result, distance band m 500 17.
| Result | Value |
|---|---|
| result, bins | 184 |
| result, count | 184 |
| result, elapsed ms | 11 |
| result, cell size m | 500 |
| result, incidents used | 950 |
| result, distance band m | 500 |
| billing, cost | 0.069 |
| billing, list price | 0.069 |
| billing, upstream cost | 0 |
Findings
- Evidenced: Hot spots on Leak and burst repairs: Hot spot analysis: 1 layer saved: Hot spot analysis: Leak and burst repairs (184 features) 817.
- Evidenced: It reported result, bins 184; result, count 184; result, elapsed ms 11; result, cell size m 500; result, incidents used 950; result, distance band m 500 17.
Tool gp_hot_spots; parameters {"project": "0f6d1895-598a-4c17-a195-fc538533c4a3", "features": {"layer": "Leak and burst repairs (7e6cb18c)"}, "aggregation": "hexagon", "cell_size_m": 500.0, "distance_band_m": 500.0}
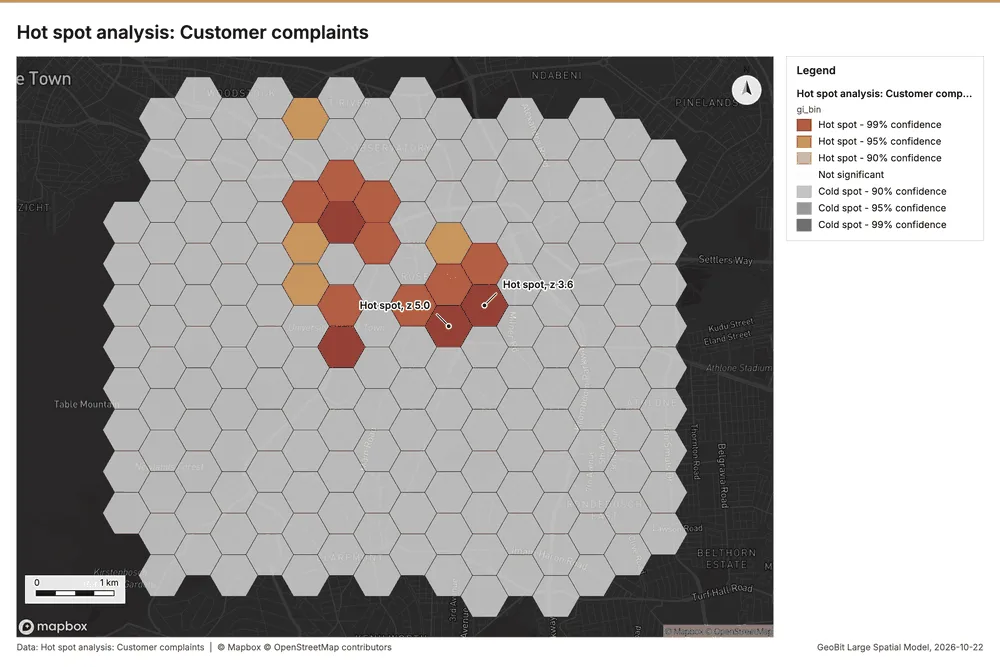
Hot spots
What this analysis is. Hot spot analysis: Getis-Ord Gi* hot and cold spots with z-scores, p-values and confidence bins 12. In ArcGIS it is Find Hot Spots or Hot Spot Analysis (Getis-Ord Gi*); in QGIS, qgis:hotspot (plugin) 12.
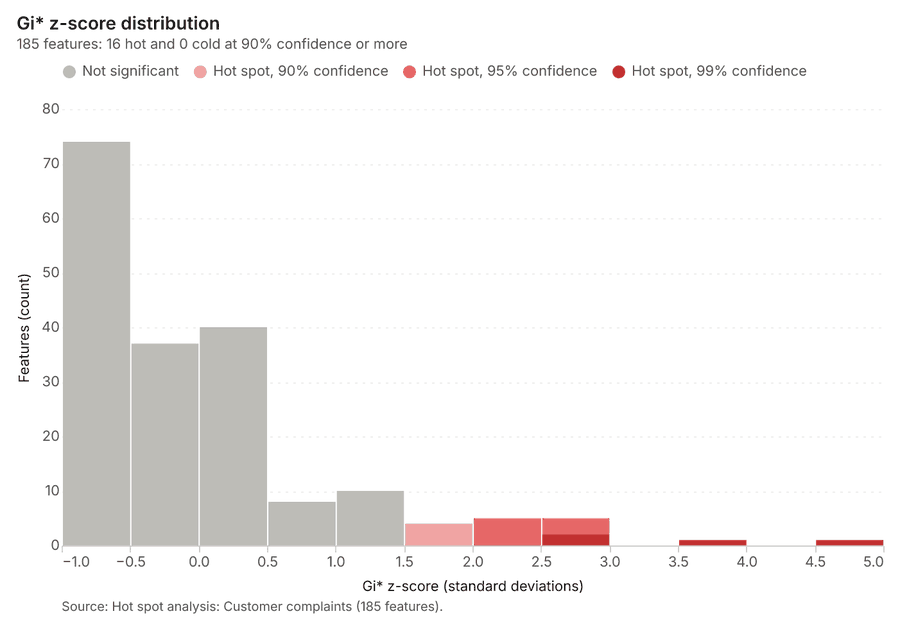
Why it was run on this data. 520 points: Getis-Ord Gi* tests whether the concentrations in Customer complaints are statistically significant 18.
What it found. Hot spots on Customer complaints: Hot spot analysis: 1 layer saved: Hot spot analysis: Customer complaints (185 features) 1119. It reported result, bins 185; result, count 185; result, elapsed ms 9; result, cell size m 500; result, incidents used 520; result, distance band m 500 19.
| Result | Value |
|---|---|
| result, bins | 185 |
| result, count | 185 |
| result, elapsed ms | 9 |
| result, cell size m | 500 |
| result, incidents used | 520 |
| result, distance band m | 500 |
| billing, cost | 0.0604 |
| billing, list price | 0.0604 |
| billing, upstream cost | 0 |
Findings
- Evidenced: Hot spots on Customer complaints: Hot spot analysis: 1 layer saved: Hot spot analysis: Customer complaints (185 features) 1119.
- Evidenced: It reported result, bins 185; result, count 185; result, elapsed ms 9; result, cell size m 500; result, incidents used 520; result, distance band m 500 19.
Tool gp_hot_spots; parameters {"project": "0f6d1895-598a-4c17-a195-fc538533c4a3", "features": {"layer": "Customer complaints (56e8a858)"}, "aggregation": "hexagon", "cell_size_m": 500.0, "distance_band_m": 500.0}
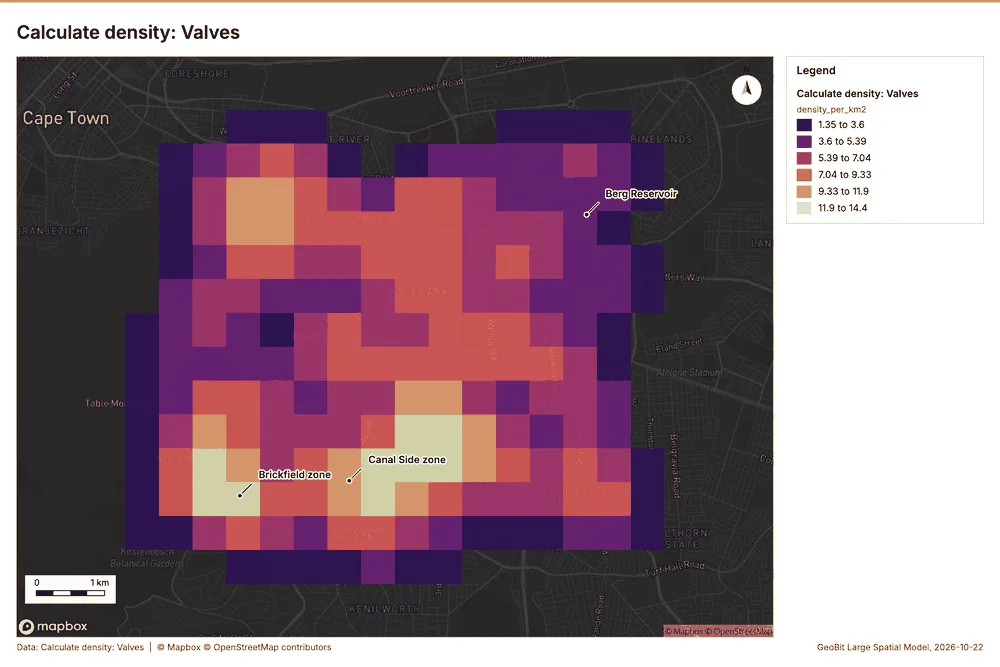
Calculate density
What this analysis is. Calculate density: Kernel density per square kilometer on a grid 20. In ArcGIS it is Calculate Density or Kernel Density; in QGIS, native:heatmapkerneldensityestimation 20.
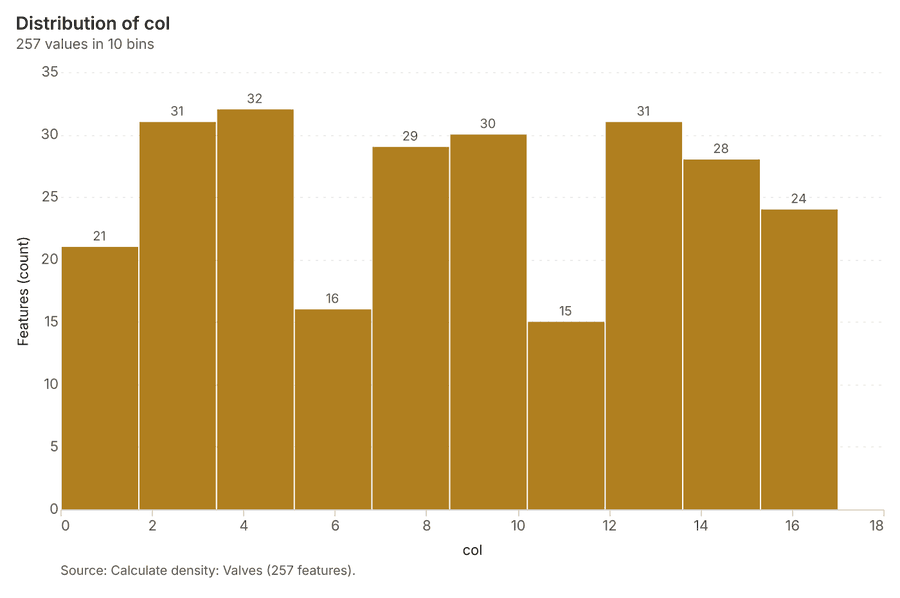
Why it was run on this data. 300 points in Valves: a density surface shows where they concentrate 21.
What it found. Calculate density on Valves: Calculate density: 1 layer saved: Calculate density: Valves (257 features) 1522. It reported result, count 257; result, elapsed ms 9; result, bandwidth m 1,000; result, cell size m 500; result, excluded null 0; result, max density per km2 14.42 22.
| Result | Value |
|---|---|
| result, count | 257 |
| result, elapsed ms | 9 |
| result, bandwidth m | 1,000 |
| result, cell size m | 500 |
| result, excluded null | 0 |
| result, max density per km2 | 14.42 |
| billing, cost | 0.056 |
| billing, list price | 0.056 |
| billing, upstream cost | 0 |
Findings
- Evidenced: Calculate density on Valves: Calculate density: 1 layer saved: Calculate density: Valves (257 features) 1522.
- Evidenced: It reported result, count 257; result, elapsed ms 9; result, bandwidth m 1,000; result, cell size m 500; result, excluded null 0; result, max density per km2 14.42 22.
Tool gp_calculate_density; parameters {"kernel": "quartic", "project": "0f6d1895-598a-4c17-a195-fc538533c4a3", "features": {"layer": "Valves (c6aecae7)"}, "bandwidth_m": 1000.0, "cell_size_m": 500.0}
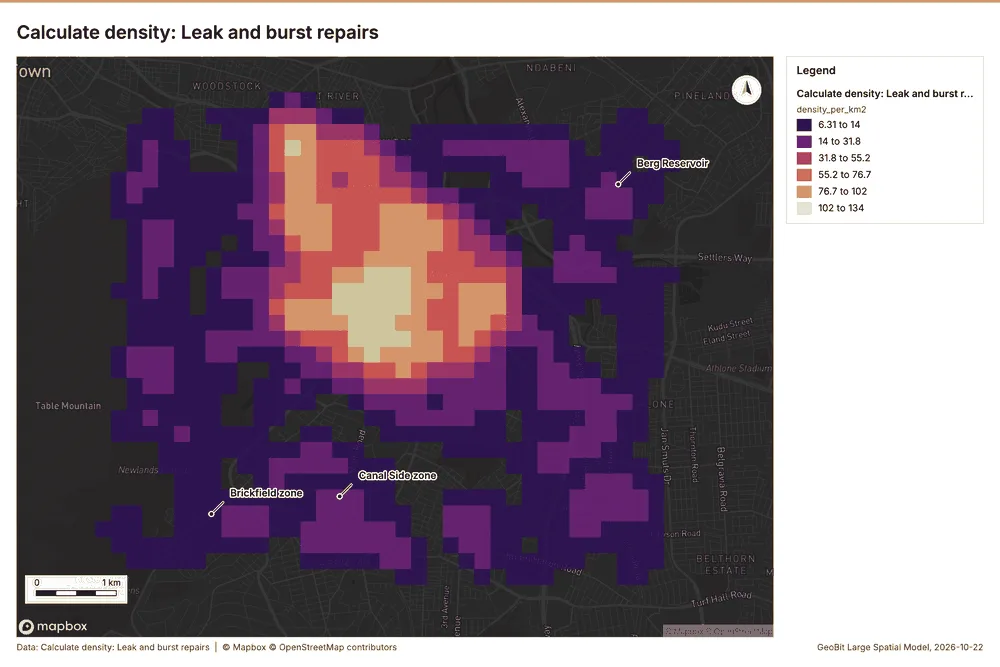
Calculate density
What this analysis is. Calculate density: Kernel density per square kilometer on a grid 20. In ArcGIS it is Calculate Density or Kernel Density; in QGIS, native:heatmapkerneldensityestimation 20.
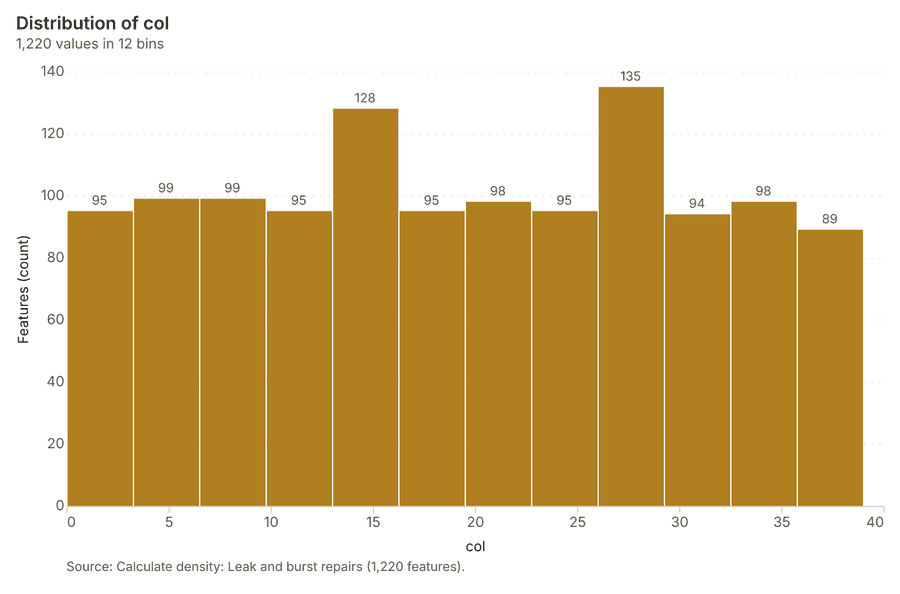
Why it was run on this data. 950 points in Leak and burst repairs: a density surface shows where they concentrate 23.
What it found. The density calculation utilized the Leak and burst repairs data 8, resulting in 1,220 features 24. The analysis determined that the maximum density observed was 133.9 per km2 24.
| Result | Value |
|---|---|
| result, count | 1,220 |
| result, elapsed ms | 36 |
| result, bandwidth m | 500 |
| result, cell size m | 200 |
| result, excluded null | 0 |
| result, max density per km2 | 133.9 |
| billing, cost | 0.069 |
| billing, list price | 0.069 |
| billing, upstream cost | 0 |
Findings
- Evidenced: Calculate density on Leak and burst repairs: Calculate density: 1 layer saved: Calculate density: Leak and burst repairs (1220 features) 824.
- Evidenced: It reported result, count 1,220; result, elapsed ms 36; result, bandwidth m 500; result, cell size m 200; result, excluded null 0; result, max density per km2 133.9 24.
Tool gp_calculate_density; parameters {"kernel": "quartic", "project": "0f6d1895-598a-4c17-a195-fc538533c4a3", "features": {"layer": "Leak and burst repairs (7e6cb18c)"}, "bandwidth_m": 500.0, "cell_size_m": 200.0}
Calculate density
What this analysis is. Calculate density: Kernel density per square kilometer on a grid 20. In ArcGIS it is Calculate Density or Kernel Density; in QGIS, native:heatmapkerneldensityestimation 20.
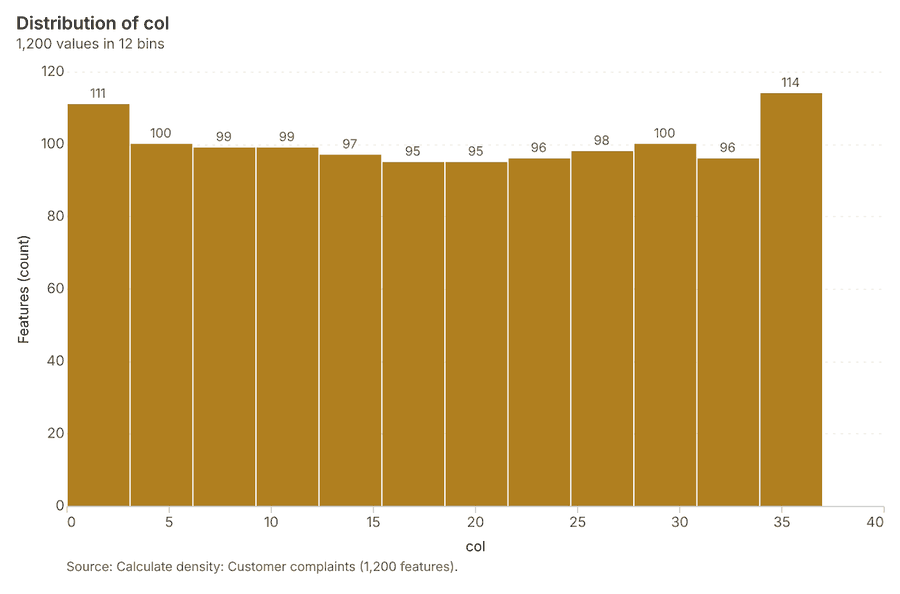
Why it was run on this data. 520 points in Customer complaints: a density surface shows where they concentrate 25.
What it found. Calculate density on Customer complaints: Calculate density: 1 layer saved: Calculate density: Customer complaints (1200 features) 1126. It reported result, count 1,200; result, elapsed ms 34; result, bandwidth m 500; result, cell size m 200; result, excluded null 0; result, max density per km2 55.38 26.
| Result | Value |
|---|---|
| result, count | 1,200 |
| result, elapsed ms | 34 |
| result, bandwidth m | 500 |
| result, cell size m | 200 |
| result, excluded null | 0 |
| result, max density per km2 | 55.38 |
| billing, cost | 0.0604 |
| billing, list price | 0.0604 |
| billing, upstream cost | 0 |
Findings
- Evidenced: Calculate density on Customer complaints: Calculate density: 1 layer saved: Calculate density: Customer complaints (1200 features) 1126.
- Evidenced: It reported result, count 1,200; result, elapsed ms 34; result, bandwidth m 500; result, cell size m 200; result, excluded null 0; result, max density per km2 55.38 26.
Tool gp_calculate_density; parameters {"kernel": "quartic", "project": "0f6d1895-598a-4c17-a195-fc538533c4a3", "features": {"layer": "Customer complaints (56e8a858)"}, "bandwidth_m": 500.0, "cell_size_m": 200.0}
Summarize within
What this analysis is. Summarize within: Count and aggregate the features inside each polygon (or bin), proportionally for lines and polygons 27. In ArcGIS it is Summarize Within or Aggregate Points; in QGIS, native:countpointsinpolygon or native:sumlinelengths 27.
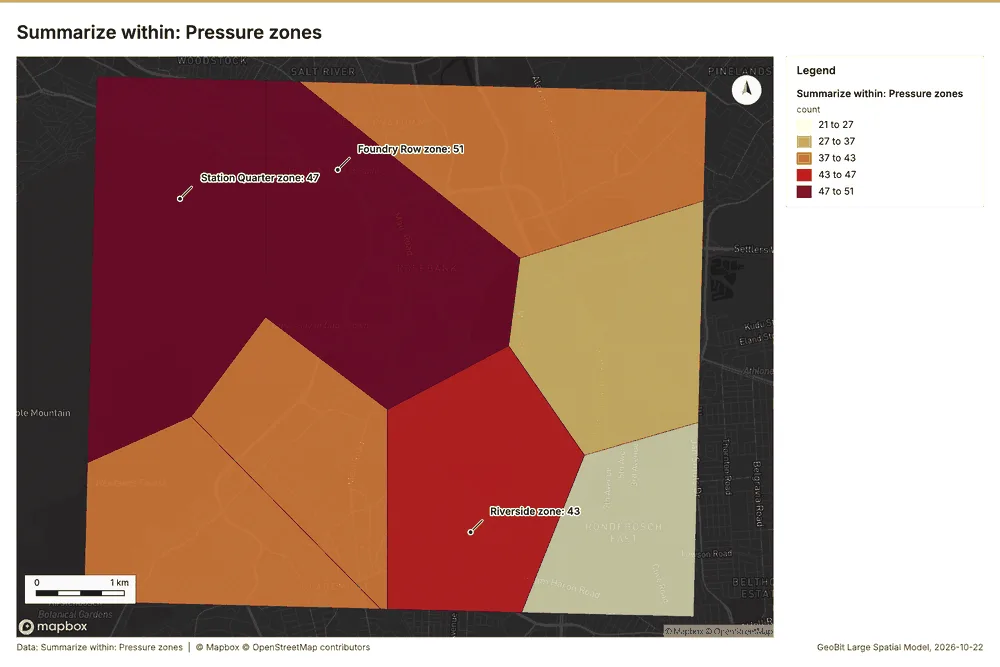
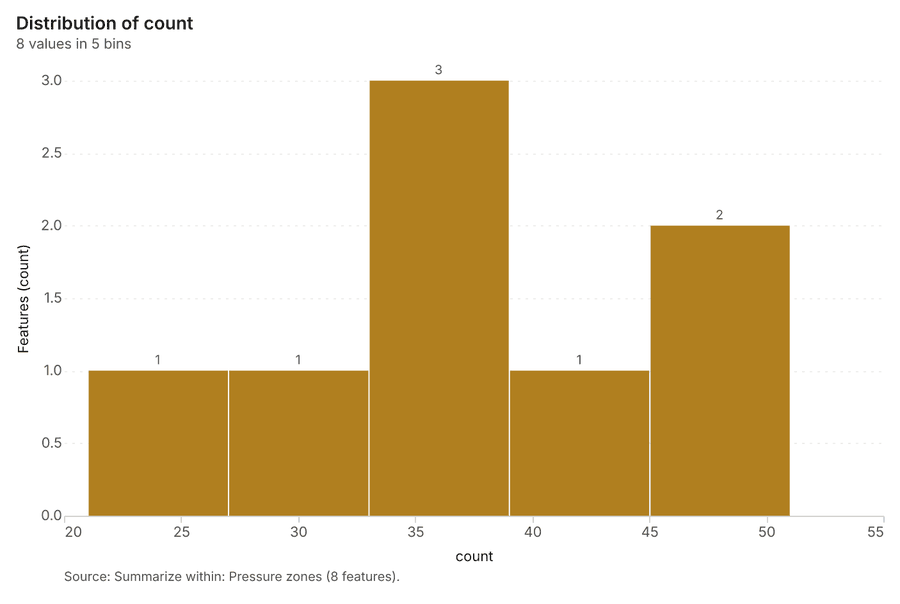
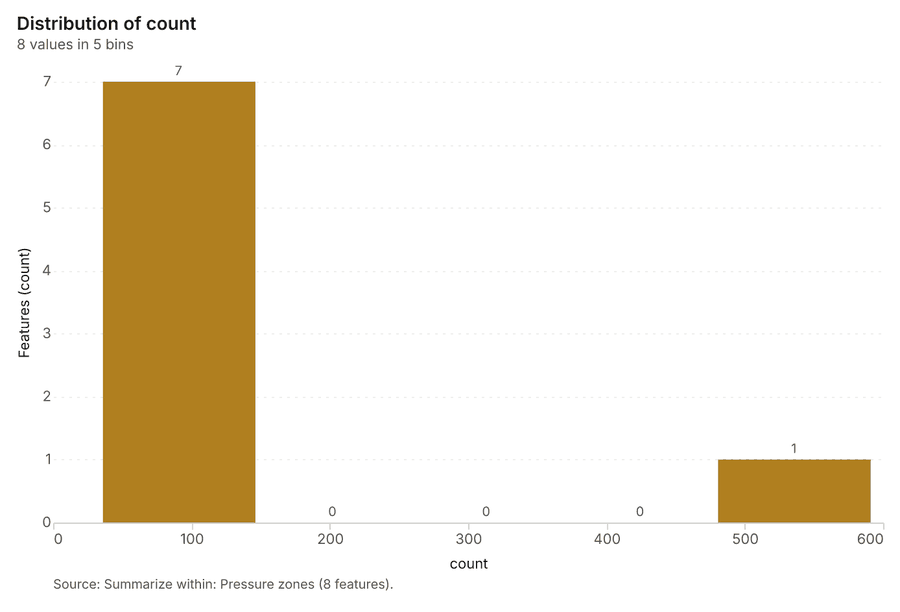
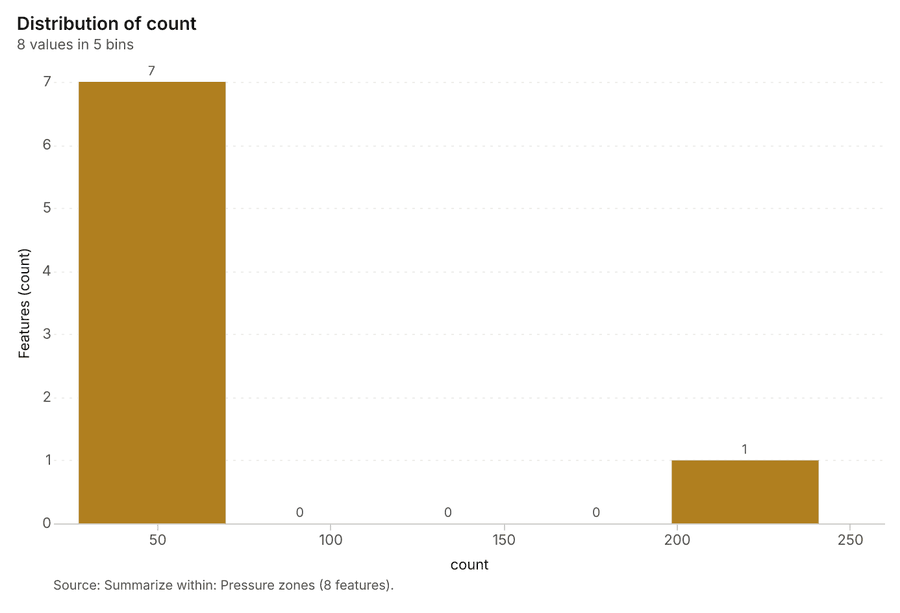
Why it was run on this data. Count Valves inside each feature of Pressure zones by type; the counts map as a choropleth (natural breaks, sequential colors) 28.
What it found. Summarize within on Valves, Pressure zones: Summarize within: 1 layer saved: Summarize within: Pressure zones (8 features) 152930. It reported result, count 8; result, elapsed ms 1; billing, cost 0.01618; billing, list price 0.01618; billing, upstream cost 0 29.
| Result | Value |
|---|---|
| result, count | 8 |
| result, elapsed ms | 1 |
| billing, cost | 0.01618 |
| billing, list price | 0.01618 |
| billing, upstream cost | 0 |
Findings
- Evidenced: Summarize within on Valves, Pressure zones: Summarize within: 1 layer saved: Summarize within: Pressure zones (8 features) 152930.
- Evidenced: It reported result, count 8; result, elapsed ms 1; billing, cost 0.01618; billing, list price 0.01618; billing, upstream cost 0 29.
Tool gp_summarize_within; parameters {"stats": [{"stat": "sum", "field": "exercised_year"}], "project": "0f6d1895-598a-4c17-a195-fc538533c4a3", "features": {"layer": "Valves (c6aecae7)"}, "group_by": "type", "polygons": {"layer": "Pressure zones (a4c55d18)"}}
Summarize within
What this analysis is. Summarize within: Count and aggregate the features inside each polygon (or bin), proportionally for lines and polygons 27. In ArcGIS it is Summarize Within or Aggregate Points; in QGIS, native:countpointsinpolygon or native:sumlinelengths 27.
Why it was run on this data. Count Valves inside each feature of Pressure zones by type; the counts map as a choropleth (natural breaks, sequential colors) 28.
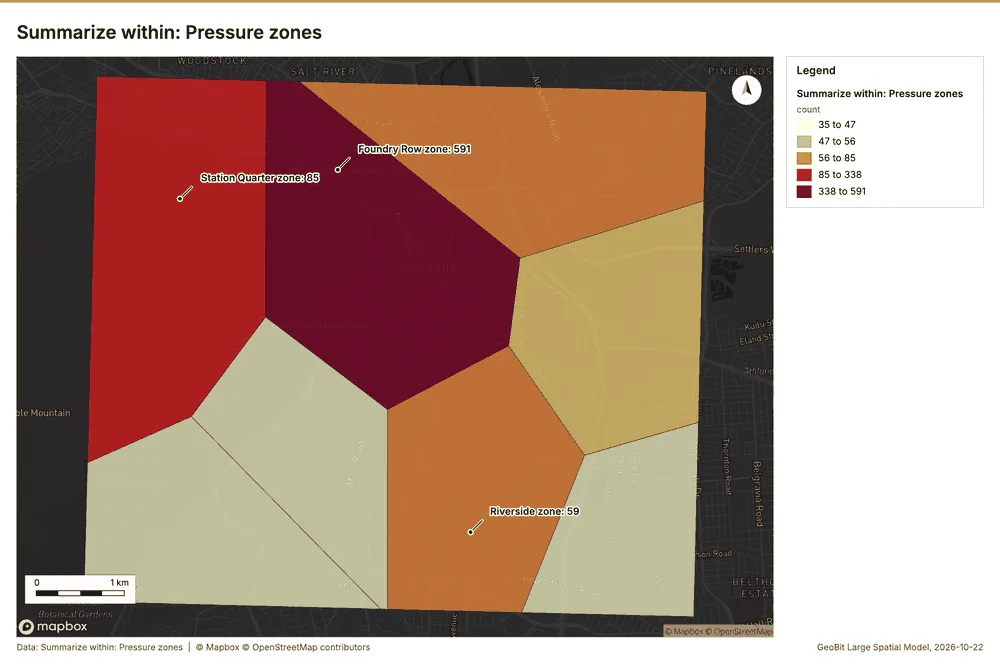
What it found. Summarize within on Leak and burst repairs, Pressure zones: Summarize within: 1 layer saved: Summarize within: Pressure zones (8 features) 83031. It reported result, count 8; result, elapsed ms 2; billing, cost 0.02918; billing, list price 0.02918; billing, upstream cost 0 31.
| Result | Value |
|---|---|
| result, count | 8 |
| result, elapsed ms | 2 |
| billing, cost | 0.02918 |
| billing, list price | 0.02918 |
| billing, upstream cost | 0 |
Findings
- Evidenced: Summarize within on Leak and burst repairs, Pressure zones: Summarize within: 1 layer saved: Summarize within: Pressure zones (8 features) 83031.
- Evidenced: It reported result, count 8; result, elapsed ms 2; billing, cost 0.02918; billing, list price 0.02918; billing, upstream cost 0 31.
Tool gp_summarize_within; parameters {"stats": [{"stat": "sum", "field": "water_lost_kl"}], "project": "0f6d1895-598a-4c17-a195-fc538533c4a3", "features": {"layer": "Leak and burst repairs (7e6cb18c)"}, "group_by": "type", "polygons": {"layer": "Pressure zones (a4c55d18)"}}
Summarize within
What this analysis is. Summarize within: Count and aggregate the features inside each polygon (or bin), proportionally for lines and polygons 27. In ArcGIS it is Summarize Within or Aggregate Points; in QGIS, native:countpointsinpolygon or native:sumlinelengths 27.
Why it was run on this data. Count Valves inside each feature of Pressure zones by type; the counts map as a choropleth (natural breaks, sequential colors) 28.
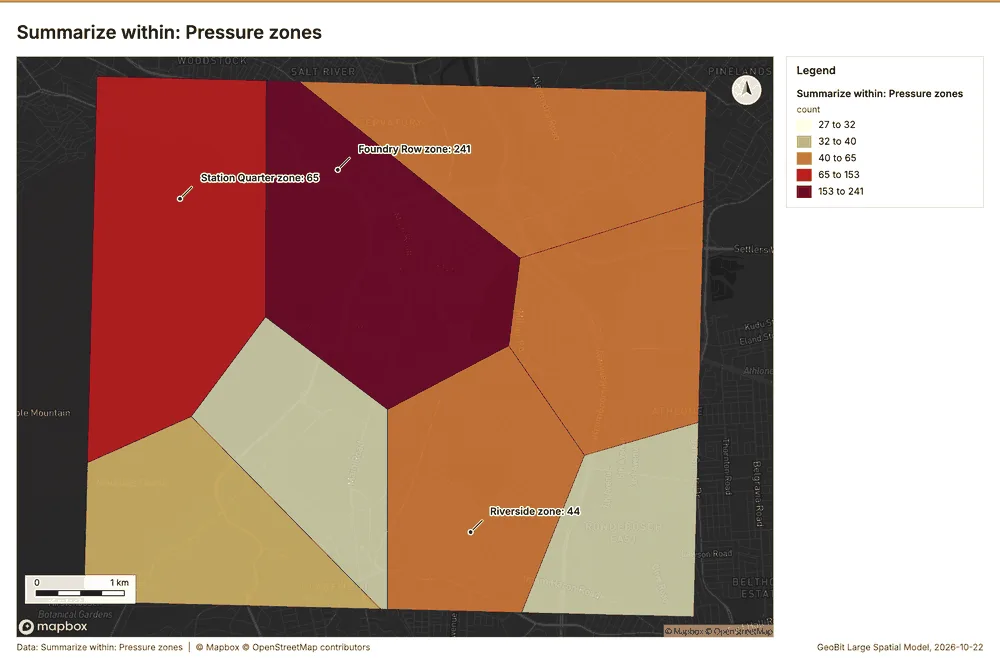
What it found. Summarize within on Customer complaints, Pressure zones: Summarize within: 1 layer saved: Summarize within: Pressure zones (8 features) 113032. It reported result, count 8; result, elapsed ms 1; billing, cost 0.02056; billing, list price 0.02056; billing, upstream cost 0 32.
| Result | Value |
|---|---|
| result, count | 8 |
| result, elapsed ms | 1 |
| billing, cost | 0.02056 |
| billing, list price | 0.02056 |
| billing, upstream cost | 0 |
Findings
- Evidenced: Summarize within on Customer complaints, Pressure zones: Summarize within: 1 layer saved: Summarize within: Pressure zones (8 features) 113032.
- Evidenced: It reported result, count 8; result, elapsed ms 1; billing, cost 0.02056; billing, list price 0.02056; billing, upstream cost 0 32.
Tool gp_summarize_within; parameters {"stats": [], "project": "0f6d1895-598a-4c17-a195-fc538533c4a3", "features": {"layer": "Customer complaints (56e8a858)"}, "group_by": "issue", "polygons": {"layer": "Pressure zones (a4c55d18)"}}
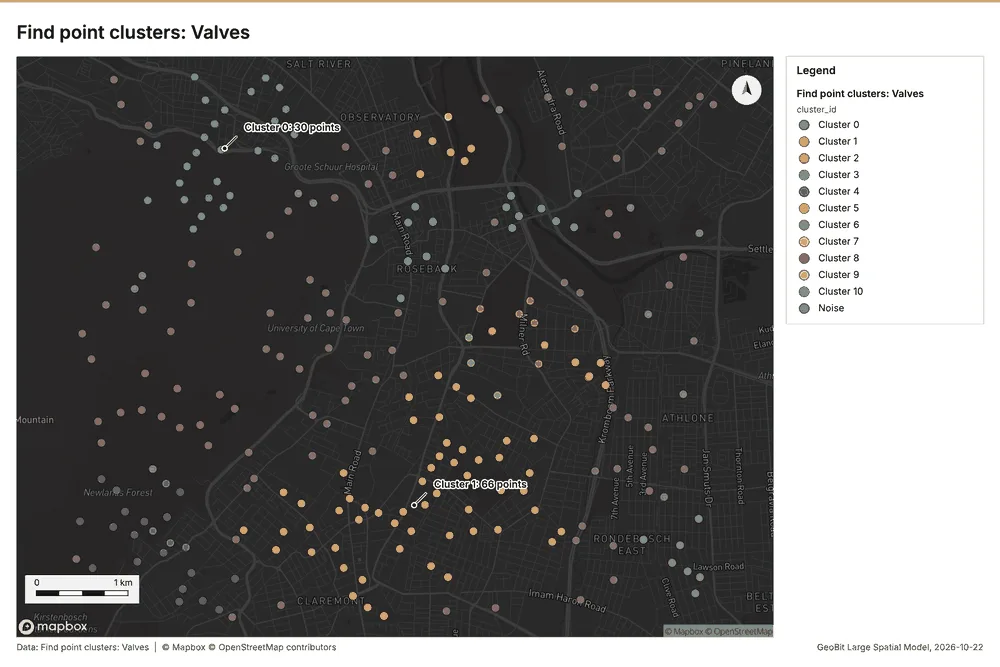
Find point clusters
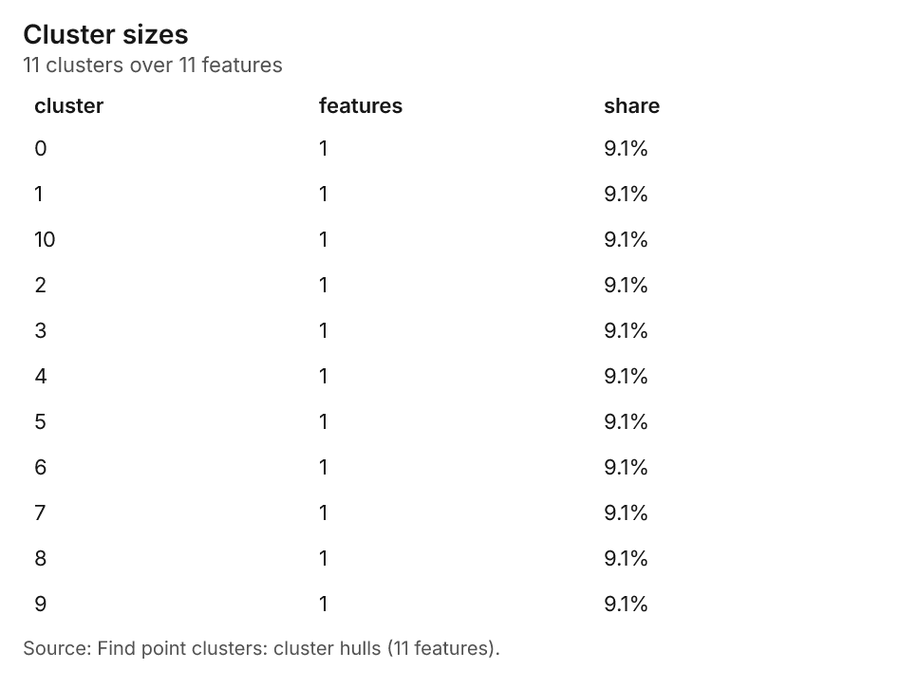
What this analysis is. Find point clusters: Density-based clusters (DBSCAN, HDBSCAN or OPTICS, optionally space-time) with hulls and noise 33. In ArcGIS it is Find Point Clusters or Density-based Clustering; in QGIS, native:dbscanclustering or native:stdbscanclustering 33.
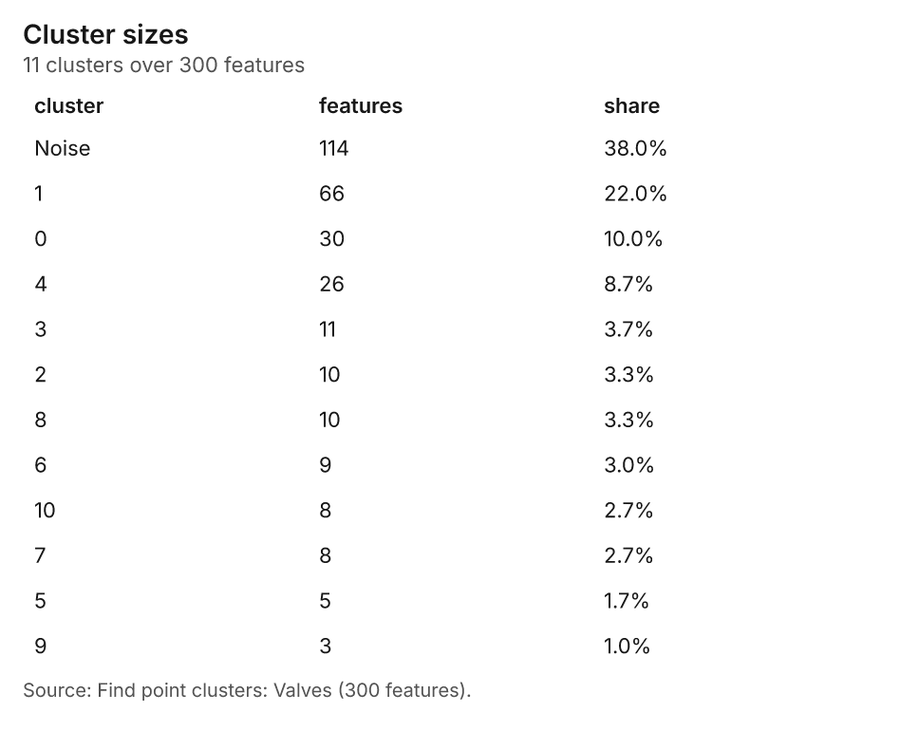
Why it was run on this data. DBSCAN finds dense groups of Valves and separates noise 34.
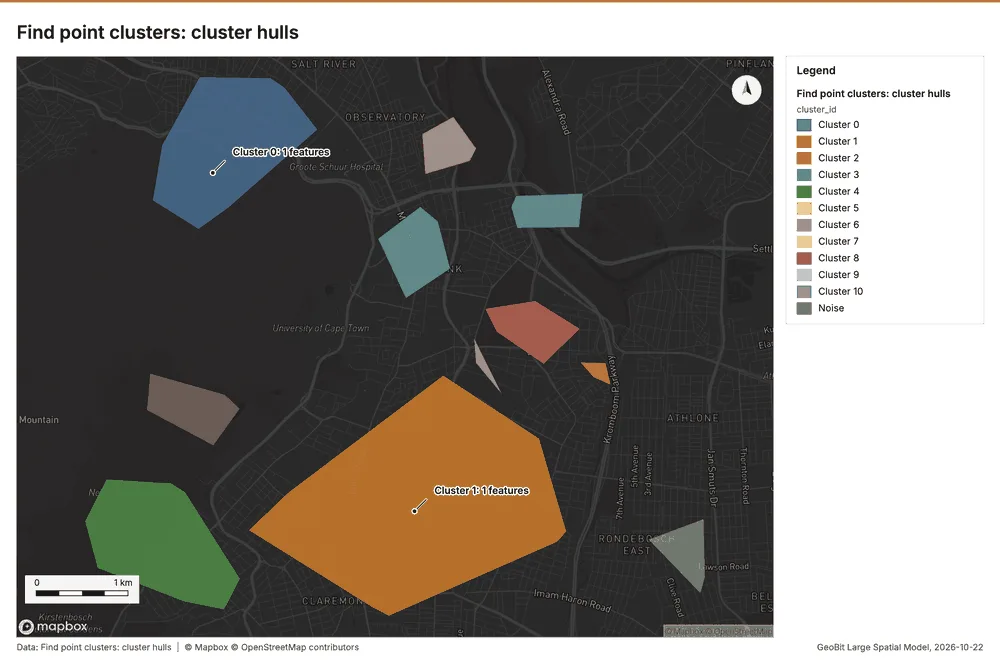
What it found. The analysis utilized the gp_find_point_clusters tool 35 with Valves data as the input 15. This process saved two resulting layers: Find point clusters: Valves with 300 features, and Find point clusters: cluster hulls with 11 features 35.
| Result | Value |
|---|---|
| result, count | 300 |
| result, noise | 114 |
| result, distance m | 500 |
| result, elapsed ms | 8 |
| result, min points | 8 |
| billing, cost | 0.056 |
| billing, list price | 0.056 |
| billing, upstream cost | 0 |
Findings
- Evidenced: Find point clusters on Valves: Find point clusters: 2 layers saved: Find point clusters: Valves (300 features); Find point clusters: cluster hulls (11 features) 1535.
- Evidenced: It reported result, count 300; result, noise 114; result, distance m 500; result, elapsed ms 8; result, min points 8; billing, cost 0.056 35.
Tool gp_find_point_clusters; parameters {"method": "dbscan", "project": "0f6d1895-598a-4c17-a195-fc538533c4a3", "features": {"layer": "Valves (c6aecae7)"}, "distance_m": 500.0, "min_points": 8}
Find point clusters
What this analysis is. Find point clusters: Density-based clusters (DBSCAN, HDBSCAN or OPTICS, optionally space-time) with hulls and noise 33. In ArcGIS it is Find Point Clusters or Density-based Clustering; in QGIS, native:dbscanclustering or native:stdbscanclustering 33.
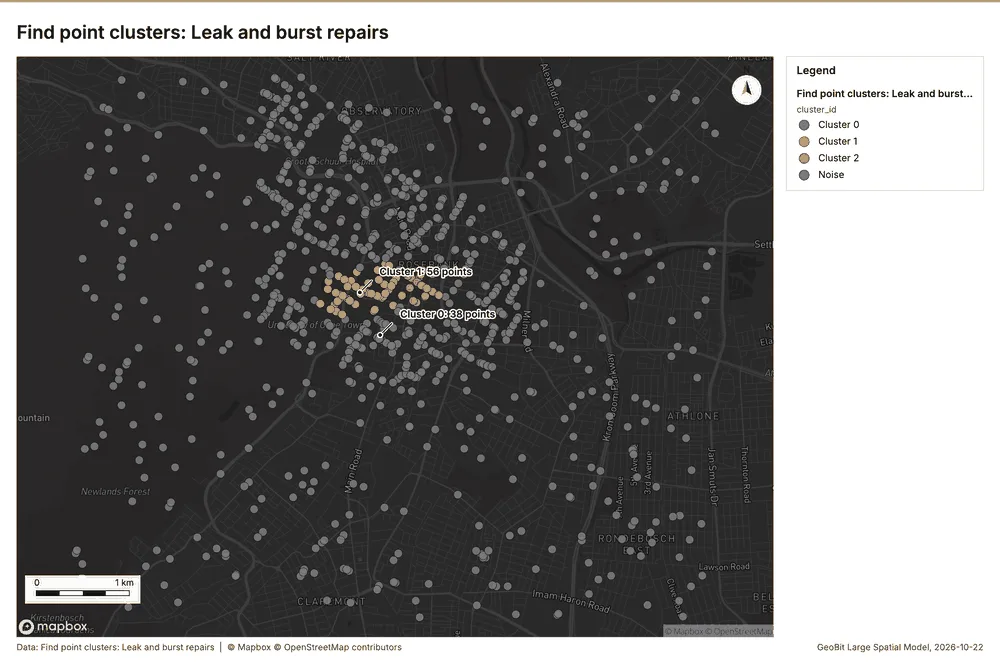
Why it was run on this data. DBSCAN finds dense groups of Leak and burst repairs and separates noise 36.
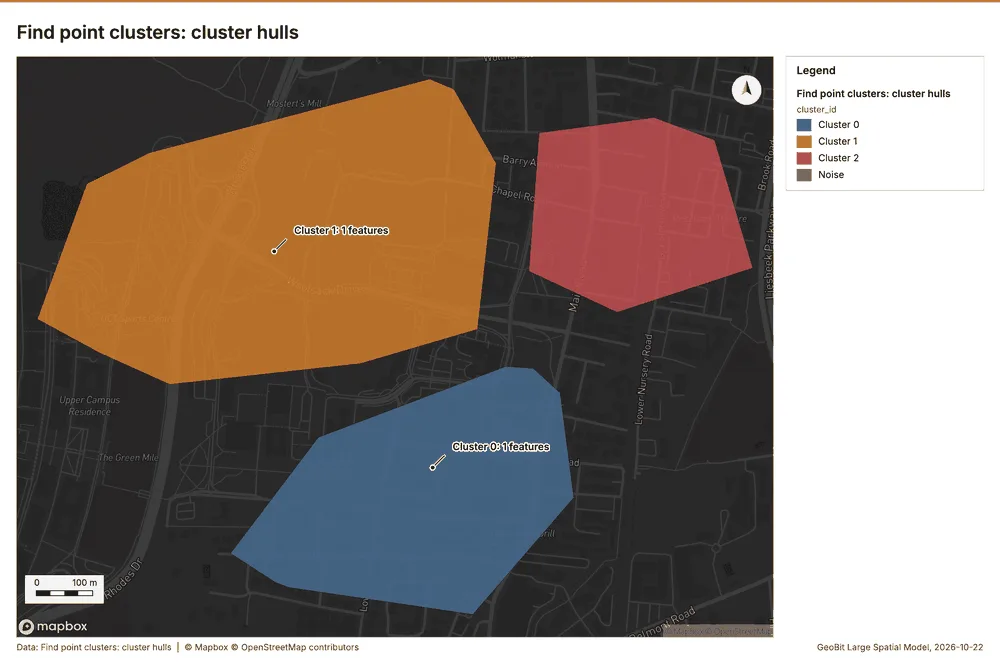
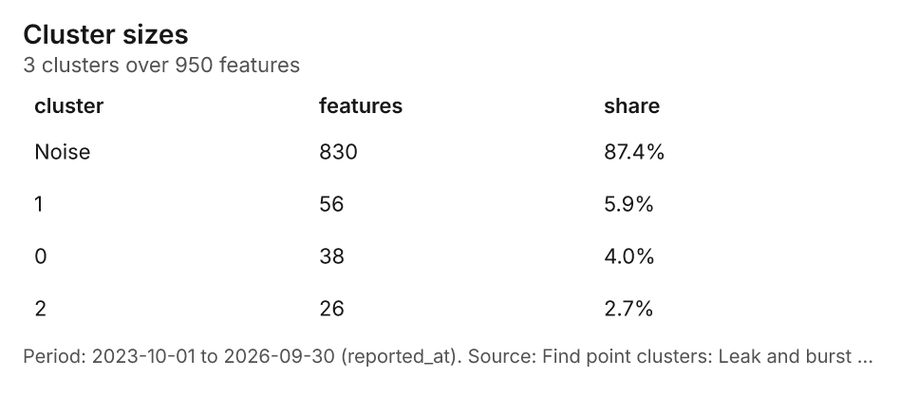
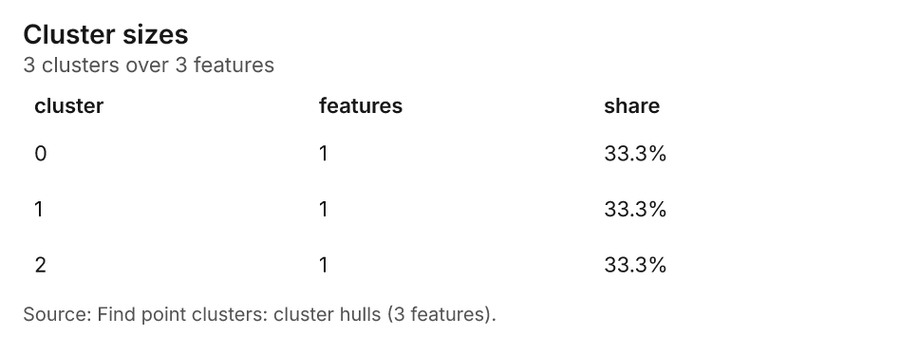
What it found. Find point clusters on Leak and burst repairs: Find point clusters: 2 layers saved: Find point clusters: Leak and burst repairs (950 features); Find point clusters: cluster hulls (3 features) 837. It reported result, count 950; result, noise 830; result, distance m 200; result, elapsed ms 12; result, min points 20; billing, cost 0.069 37.
| Result | Value |
|---|---|
| result, count | 950 |
| result, noise | 830 |
| result, distance m | 200 |
| result, elapsed ms | 12 |
| result, min points | 20 |
| billing, cost | 0.069 |
| billing, list price | 0.069 |
| billing, upstream cost | 0 |
Findings
- Evidenced: Find point clusters on Leak and burst repairs: Find point clusters: 2 layers saved: Find point clusters: Leak and burst repairs (950 features); Find point clusters: cluster hulls (3 features) 837.
- Evidenced: It reported result, count 950; result, noise 830; result, distance m 200; result, elapsed ms 12; result, min points 20; billing, cost 0.069 37.
Tool gp_find_point_clusters; parameters {"method": "dbscan", "project": "0f6d1895-598a-4c17-a195-fc538533c4a3", "features": {"layer": "Leak and burst repairs (7e6cb18c)"}, "distance_m": 200.0, "min_points": 20}
Find point clusters
What this analysis is. Find point clusters: Density-based clusters (DBSCAN, HDBSCAN or OPTICS, optionally space-time) with hulls and noise 33. In ArcGIS it is Find Point Clusters or Density-based Clustering; in QGIS, native:dbscanclustering or native:stdbscanclustering 33.
Why it was run on this data. DBSCAN finds dense groups of Customer complaints and separates noise 38.
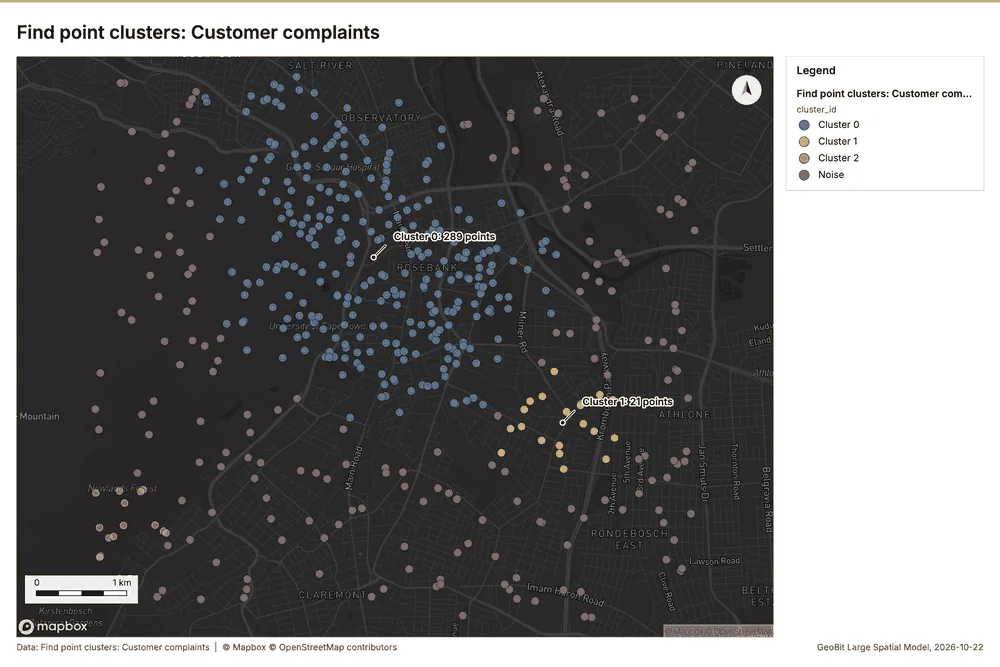
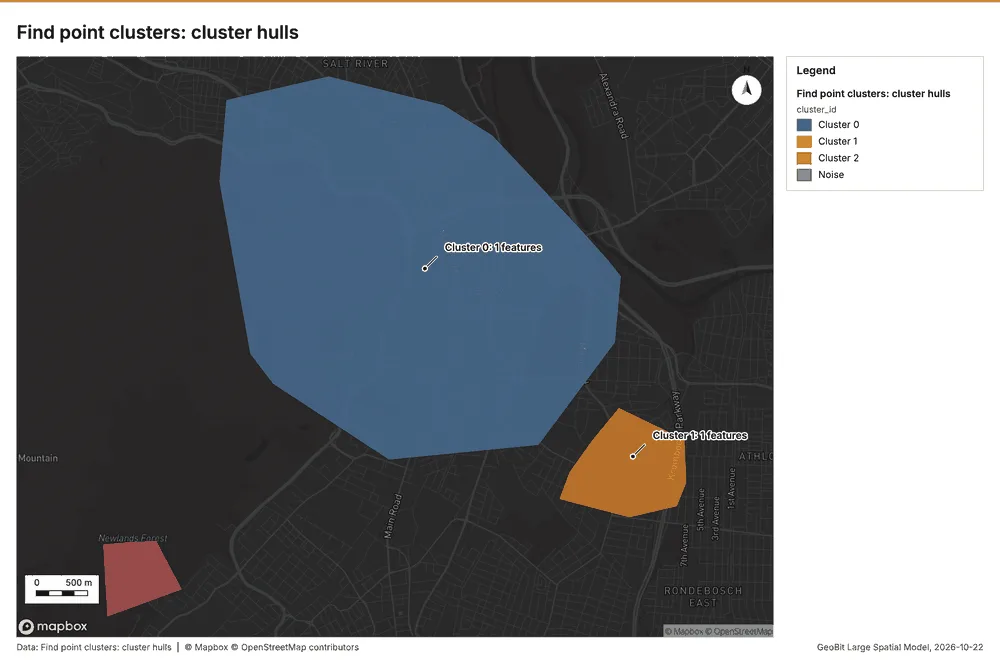
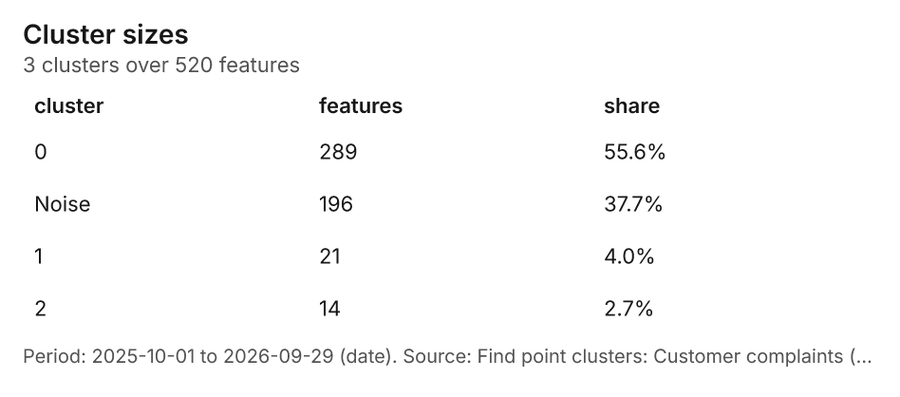
What it found. Find point clusters on Customer complaints: Find point clusters: 2 layers saved: Find point clusters: Customer complaints (520 features); Find point clusters: cluster hulls (3 features) 1139. It reported result, count 520; result, noise 196; result, distance m 500; result, elapsed ms 8; result, min points 13; billing, cost 0.0604 39.
| Result | Value |
|---|---|
| result, count | 520 |
| result, noise | 196 |
| result, distance m | 500 |
| result, elapsed ms | 8 |
| result, min points | 13 |
| billing, cost | 0.0604 |
| billing, list price | 0.0604 |
| billing, upstream cost | 0 |
Findings
- Evidenced: Find point clusters on Customer complaints: Find point clusters: 2 layers saved: Find point clusters: Customer complaints (520 features); Find point clusters: cluster hulls (3 features) 1139.
- Evidenced: It reported result, count 520; result, noise 196; result, distance m 500; result, elapsed ms 8; result, min points 13; billing, cost 0.0604 39.
Tool gp_find_point_clusters; parameters {"method": "dbscan", "project": "0f6d1895-598a-4c17-a195-fc538533c4a3", "features": {"layer": "Customer complaints (56e8a858)"}, "distance_m": 500.0, "min_points": 13}
Outliers
What this analysis is. Find outliers: Anselin local Moran’s I: HH, LL clusters and HL, LH outliers 40. In ArcGIS it is Find Outliers or Cluster and Outlier Analysis (Anselin Local Moran’s I) 40.
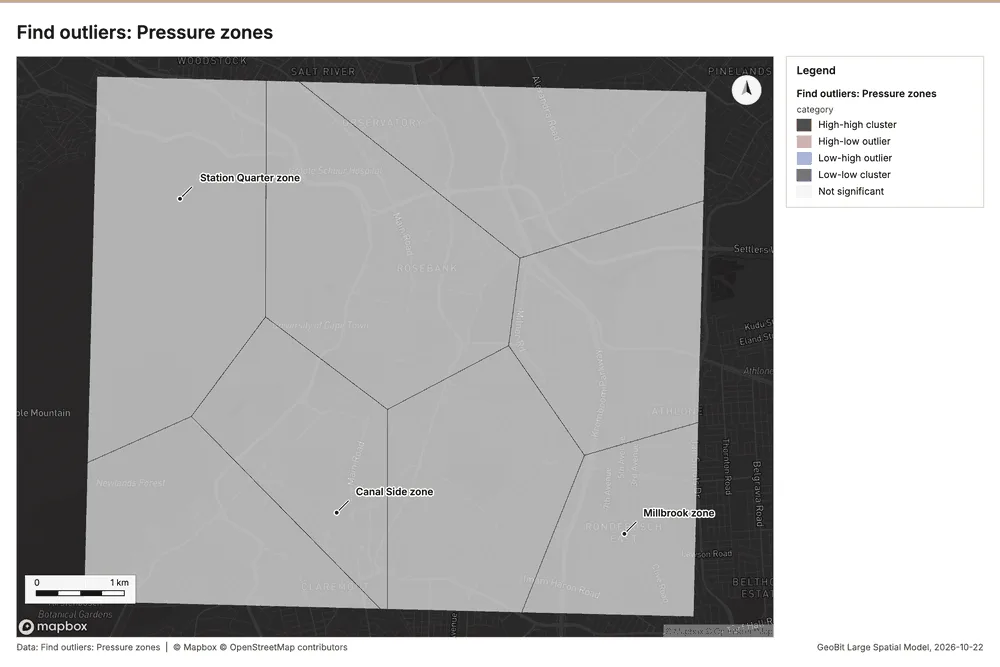
Why it was run on this data. Local Moran's I maps clusters and outliers of 'connections' 41.
What it found. Outliers on Pressure zones: Find outliers: 1 layer saved: Find outliers: Pressure zones (8 features) 3042. It reported result, count 8; result, elapsed ms 3; result, permutations 199; result, excluded null 0; result, distance band m 2,338; billing, cost 0.05024 42.
| Result | Value |
|---|---|
| result, count | 8 |
| result, elapsed ms | 3 |
| result, permutations | 199 |
| result, excluded null | 0 |
| result, distance band m | 2,338 |
| billing, cost | 0.05024 |
| billing, list price | 0.05024 |
| billing, upstream cost | 0 |
Findings
- Evidenced: Outliers on Pressure zones: Find outliers: 1 layer saved: Find outliers: Pressure zones (8 features) 3042.
- Evidenced: It reported result, count 8; result, elapsed ms 3; result, permutations 199; result, excluded null 0; result, distance band m 2,338; billing, cost 0.05024 42.
Tool gp_outliers; parameters {"field": "connections", "project": "0f6d1895-598a-4c17-a195-fc538533c4a3", "features": {"layer": "Pressure zones (a4c55d18)"}, "aggregation": "hexagon"}
Spatial autocorrelation
What this analysis is. Spatial autocorrelation: Global Moran’s I: is the pattern clustered, dispersed or random 43. In ArcGIS it is Spatial Autocorrelation (Global Moran’s I) 43.
Why it was run on this data. Global Moran's I says whether similar values of 'connections' sit next to each other 44.
What it found. The gp_spatial_autocorrelation tool was executed using Pressure zones as input 30, 45.
| Result | Value |
|---|---|
| result, n | 8 |
| result, p value | 0.3743 |
| result, z score | -0.8884 |
| result, morans i | -0.3913 |
| result, variance | 0.07821 |
| result, elapsed ms | 1 |
| result, expected i | -0.1429 |
| result, excluded null | 0 |
| result, distance band m | 2,338 |
| result, p value normality | 0.3878 |
| result, z score normality | -0.8636 |
| result, variance normality | 0.08277 |
| billing, cost | 0.02 |
| billing, list price | 0.02 |
| billing, upstream cost | 0 |
Findings
- Evidenced: Spatial autocorrelation on Pressure zones: Spatial autocorrelation: done; no map output 3045.
- Evidenced: It reported result, n 8; result, p value 0.3743; result, z score -0.8884; result, morans i -0.3913; result, variance 0.07821; result, elapsed ms 1 45.
Tool gp_spatial_autocorrelation; parameters {"field": "connections", "project": "0f6d1895-598a-4c17-a195-fc538533c4a3", "features": {"layer": "Pressure zones (a4c55d18)"}}
Near repeat
What this analysis is. Repeat and near repeat classification: Classify incidents as originators, repeats (same place) or near repeats within a distance and time window, with a Knox test table 46. In ArcGIS it is Repeat and Near Repeat Classification or Near Repeat Calculator 46.
Why it was run on this data. Near repeat analysis tests whether Leak and burst repairs close in space also follow each other within 30 days 47.
What it found. Near repeat on Leak and burst repairs: Repeat and near repeat classification: 1 layer saved: Repeat and near repeat classification: Leak and burst repairs (950 features) 848. It reported result, days 30; result, count 950; result, chains 114; result, distance m 200; result, elapsed ms 20; result, pairs linked 246 48.
| Result | Value |
|---|---|
| result, days | 30 |
| result, count | 950 |
| result, chains | 114 |
| result, distance m | 200 |
| result, elapsed ms | 20 |
| result, pairs linked | 246 |
| billing, cost | 0.0785 |
| billing, list price | 0.0785 |
| billing, upstream cost | 0 |
Findings
- Evidenced: Near repeat on Leak and burst repairs: Repeat and near repeat classification: 1 layer saved: Repeat and near repeat classification: Leak and burst repairs (950 features) 848.
- Evidenced: It reported result, days 30; result, count 950; result, chains 114; result, distance m 200; result, elapsed ms 20; result, pairs linked 246 48.
Tool gp_near_repeat; parameters {"days": 30, "project": "0f6d1895-598a-4c17-a195-fc538533c4a3", "features": {"layer": "Leak and burst repairs (7e6cb18c)"}, "distance_m": 200.0, "time_field": "reported_at"}
Maps and charts
The run also made 20 map image(s) 4950515253545556575859606162636465666768 and 27 chart(s) 697071727374757677787980818283848586878889909192939495.
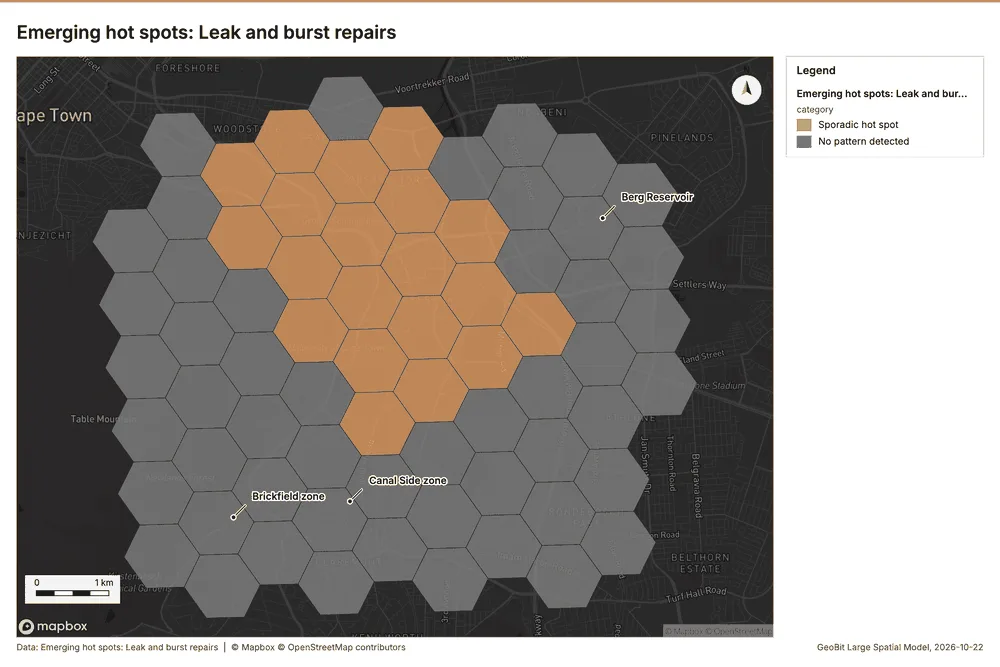
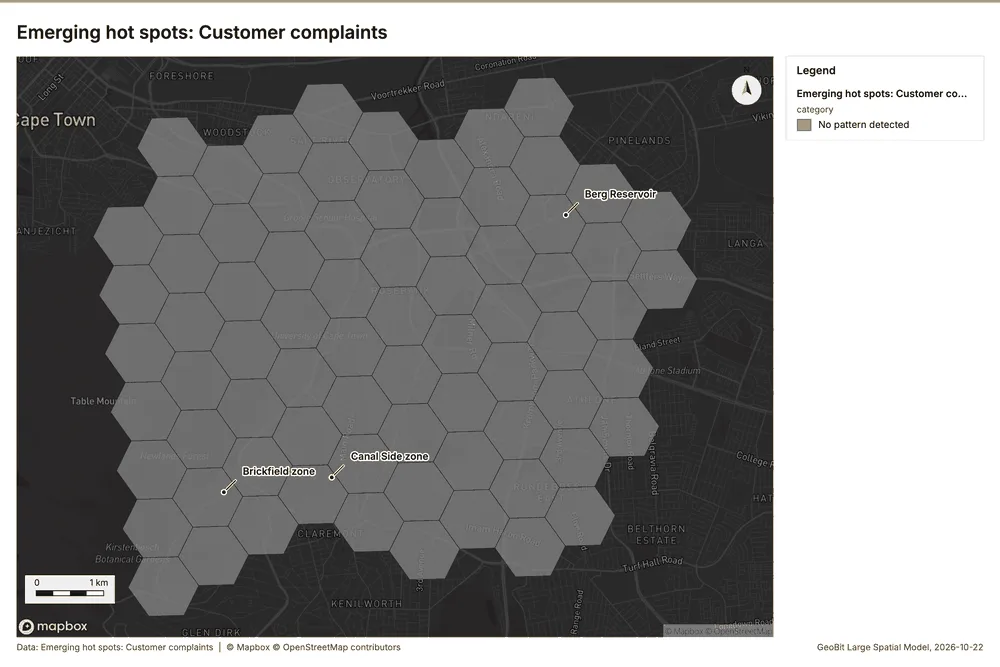
What the map shows. The map displays emerging hot spots concerning leak and burst repairs, utilizing a classification of 'Sporadic hot spot' and 'No pattern detected.' A noticeable cluster of sporadic hot spots, indicated by the lighter orange coloring, is visible in the central-to-upper portion of the mapped area. In contrast, the majority of the tiles surrounding this central region are colored gray, corresponding to an absence of detected pattern. Overall, the analysis shows a localized concentration of repairs activity surrounded by areas where no significant spatial pattern was detected. 49
Inferred: read from the image by gemma4:e4b, not evidence.
Changes since the last run
This is the first report of this project.
Sources
- 1Rendering: Chart: Timeline: events per month by dataset. 108 rows id 94a93c16-67b9-41a4-8ed2-808fbbf2754f
- 2Dataset: Leak and burst repairs. vector, 950 rows id 3f198310-8d97-42f8-b03b-813a838bc233
- 3Dataset: Customer complaints. vector, 520 rows id 57e4c410-eab9-4da0-8287-b2acf2ce16ca
- 4Dataset: Zone meter readings by month. table, 192 rows id 56bef21a-7861-4acc-b024-b65a14052a40
- 5Catalog: Emerging hot spots (operation catalog, gp_space_time_hot_spots). Where hot spots are new, consecutive, intensifying, persistent, diminishing, sporadic, oscillating or historical over time. ArcGIS: Emerging Hot Spot Analysis, Create Space Time Cube. id gp_space_time_hot_spots
- 6Plan: Space time hot spots of Leak and burst repairs (the Start plan's candidate c_6d3c49125c9a). Leak and burst repairs carry dates in 'reported_at': emerging hot spot analysis finds new, intensifying and fading hot spots per month. id 4f377cd3-7339-41df-845b-392c7e4b6b94:c_6d3c49125c9a
- 7Tool result: gp_space_time_hot_spots, step 0. Emerging hot spots: 1 layer saved: Emerging hot spots: Leak and burst repairs (71 features). id 8c251b5b-c068-49c2-83e1-3ea333425a96:0
- 8Layer: Leak and burst repairs. 950 features id 7e6cb18c-a956-4aa0-b060-b927e53b2106
- 9Plan: Space time hot spots of Customer complaints (the Start plan's candidate c_8348225de6d1). Customer complaints carry dates in 'date': emerging hot spot analysis finds new, intensifying and fading hot spots per week. id 4f377cd3-7339-41df-845b-392c7e4b6b94:c_8348225de6d1
- 10Tool result: gp_space_time_hot_spots, step 1. Emerging hot spots: 1 layer saved: Emerging hot spots: Customer complaints (75 features). id 8c251b5b-c068-49c2-83e1-3ea333425a96:1
- 11Layer: Customer complaints. 520 features id 56e8a858-22c0-49f4-ad9c-220e4d9d9989
- 12Catalog: Hot spot analysis (operation catalog, gp_hot_spots). Getis-Ord Gi* hot and cold spots with z-scores, p-values and confidence bins. ArcGIS: Find Hot Spots, Hot Spot Analysis (Getis-Ord Gi*). QGIS: qgis:hotspot (plugin). id gp_hot_spots
- 13Plan: Hot spots of Valves (the Start plan's candidate c_73fb2acb1b6a). 300 points: Getis-Ord Gi* tests whether the concentrations in Valves are statistically significant. id 4f377cd3-7339-41df-845b-392c7e4b6b94:c_73fb2acb1b6a
- 14Tool result: gp_hot_spots, step 0. Hot spot analysis: 1 layer saved: Hot spot analysis: Valves (53 features). id 5758135c-54d5-4daf-a6ef-b217938623cb:0
- 15Layer: Valves. 300 features id c6aecae7-984d-4e15-9197-a69b622b052f
- 16Plan: Hot spots of Leak and burst repairs (the Start plan's candidate c_580c09db1123). 950 points: Getis-Ord Gi* tests whether the concentrations in Leak and burst repairs are statistically significant. id 4f377cd3-7339-41df-845b-392c7e4b6b94:c_580c09db1123
- 17Tool result: gp_hot_spots, step 1. Hot spot analysis: 1 layer saved: Hot spot analysis: Leak and burst repairs (184 features). id 5758135c-54d5-4daf-a6ef-b217938623cb:1
- 18Plan: Hot spots of Customer complaints (the Start plan's candidate c_00d8b144d9af). 520 points: Getis-Ord Gi* tests whether the concentrations in Customer complaints are statistically significant. id 4f377cd3-7339-41df-845b-392c7e4b6b94:c_00d8b144d9af
- 19Tool result: gp_hot_spots, step 2. Hot spot analysis: 1 layer saved: Hot spot analysis: Customer complaints (185 features). id 5758135c-54d5-4daf-a6ef-b217938623cb:2
- 20Catalog: Calculate density (operation catalog, gp_calculate_density). Kernel density per square kilometer on a grid. ArcGIS: Calculate Density, Kernel Density. QGIS: native:heatmapkerneldensityestimation. id gp_calculate_density
- 21Plan: Kernel density of Valves (the Start plan's candidate c_d636e5cd662d). 300 points in Valves: a density surface shows where they concentrate. id 4f377cd3-7339-41df-845b-392c7e4b6b94:c_d636e5cd662d
- 22Tool result: gp_calculate_density, step 0. Calculate density: 1 layer saved: Calculate density: Valves (257 features). id 15ea63ce-83f8-46f4-930b-a1531b369666:0
- 23Plan: Kernel density of Leak and burst repairs (the Start plan's candidate c_ab36517e4e0c). 950 points in Leak and burst repairs: a density surface shows where they concentrate. id 4f377cd3-7339-41df-845b-392c7e4b6b94:c_ab36517e4e0c
- 24Tool result: gp_calculate_density, step 1. Calculate density: 1 layer saved: Calculate density: Leak and burst repairs (1220 features). id 15ea63ce-83f8-46f4-930b-a1531b369666:1
- 25Plan: Kernel density of Customer complaints (the Start plan's candidate c_be075c3460ae). 520 points in Customer complaints: a density surface shows where they concentrate. id 4f377cd3-7339-41df-845b-392c7e4b6b94:c_be075c3460ae
- 26Tool result: gp_calculate_density, step 2. Calculate density: 1 layer saved: Calculate density: Customer complaints (1200 features). id 15ea63ce-83f8-46f4-930b-a1531b369666:2
- 27Catalog: Summarize within (operation catalog, gp_summarize_within). Count and aggregate the features inside each polygon (or bin), proportionally for lines and polygons. ArcGIS: Summarize Within, Aggregate Points. QGIS: native:countpointsinpolygon, native:sumlinelengths. id gp_summarize_within
- 28Plan: Valves per feature of Pressure zones (the Start plan's candidate c_5c2b4f19804e). Count Valves inside each feature of Pressure zones by type; the counts map as a choropleth (natural breaks, sequential colors). id 4f377cd3-7339-41df-845b-392c7e4b6b94:c_5c2b4f19804e
- 29Tool result: gp_summarize_within, step 0. Summarize within: 1 layer saved: Summarize within: Pressure zones (8 features). id 7fbce9f6-226d-43c9-b187-49e18e2f3a63:0
- 30Layer: Pressure zones. 8 features id a4c55d18-97e0-4d48-82c0-0a14b5ad5659
- 31Tool result: gp_summarize_within, step 1. Summarize within: 1 layer saved: Summarize within: Pressure zones (8 features). id 7fbce9f6-226d-43c9-b187-49e18e2f3a63:1
- 32Tool result: gp_summarize_within, step 2. Summarize within: 1 layer saved: Summarize within: Pressure zones (8 features). id 7fbce9f6-226d-43c9-b187-49e18e2f3a63:2
- 33Catalog: Find point clusters (operation catalog, gp_find_point_clusters). Density-based clusters (DBSCAN, HDBSCAN or OPTICS, optionally space-time) with hulls and noise. ArcGIS: Find Point Clusters, Density-based Clustering. QGIS: native:dbscanclustering, native:stdbscanclustering. id gp_find_point_clusters
- 34Plan: Cluster points of Valves (the Start plan's candidate c_5a8770e11140). DBSCAN finds dense groups of Valves and separates noise. id 4f377cd3-7339-41df-845b-392c7e4b6b94:c_5a8770e11140
- 35Tool result: gp_find_point_clusters, step 0. Find point clusters: 2 layers saved: Find point clusters: Valves (300 features); Find point clusters: cluster hulls (11 features). id d14409c4-ceb7-40bf-8118-b4f183221686:0
- 36Plan: Cluster points of Leak and burst repairs (the Start plan's candidate c_fcbb370f7b11). DBSCAN finds dense groups of Leak and burst repairs and separates noise. id 4f377cd3-7339-41df-845b-392c7e4b6b94:c_fcbb370f7b11
- 37Tool result: gp_find_point_clusters, step 1. Find point clusters: 2 layers saved: Find point clusters: Leak and burst repairs (950 features); Find point clusters: cluster hulls (3 features). id d14409c4-ceb7-40bf-8118-b4f183221686:1
- 38Plan: Cluster points of Customer complaints (the Start plan's candidate c_ffd68e523286). DBSCAN finds dense groups of Customer complaints and separates noise. id 4f377cd3-7339-41df-845b-392c7e4b6b94:c_ffd68e523286
- 39Tool result: gp_find_point_clusters, step 2. Find point clusters: 2 layers saved: Find point clusters: Customer complaints (520 features); Find point clusters: cluster hulls (3 features). id d14409c4-ceb7-40bf-8118-b4f183221686:2
- 40Catalog: Find outliers (operation catalog, gp_outliers). Anselin local Moran’s I: HH, LL clusters and HL, LH outliers. ArcGIS: Find Outliers, Cluster and Outlier Analysis (Anselin Local Moran’s I). id gp_outliers
- 41Plan: Local morans i of Pressure zones (the Start plan's candidate c_d6bf59d0b92b). Local Moran's I maps clusters and outliers of 'connections'. id 4f377cd3-7339-41df-845b-392c7e4b6b94:c_d6bf59d0b92b
- 42Tool result: gp_outliers, step 0. Find outliers: 1 layer saved: Find outliers: Pressure zones (8 features). id d51ffd20-8b3f-40ae-b231-4aaceda6ee41:0
- 43Catalog: Spatial autocorrelation (operation catalog, gp_spatial_autocorrelation). Global Moran’s I: is the pattern clustered, dispersed or random. ArcGIS: Spatial Autocorrelation (Global Moran’s I). id gp_spatial_autocorrelation
- 44Plan: Global morans i of Pressure zones (the Start plan's candidate c_6ddd928b3a6c). Global Moran's I says whether similar values of 'connections' sit next to each other. id 4f377cd3-7339-41df-845b-392c7e4b6b94:c_6ddd928b3a6c
- 45Tool result: gp_spatial_autocorrelation, step 1. Spatial autocorrelation: done; no map output. id d51ffd20-8b3f-40ae-b231-4aaceda6ee41:1
- 46Catalog: Repeat and near repeat classification (operation catalog, gp_near_repeat). Classify incidents as originators, repeats (same place) or near repeats within a distance and time window, with a Knox test table. ArcGIS: Repeat and Near Repeat Classification, Near Repeat Calculator. id gp_near_repeat
- 47Plan: Near repeat of Leak and burst repairs (the Start plan's candidate c_31a838496880). Near repeat analysis tests whether Leak and burst repairs close in space also follow each other within 30 days. id 4f377cd3-7339-41df-845b-392c7e4b6b94:c_31a838496880
- 48Tool result: gp_near_repeat, step 0. Repeat and near repeat classification: 1 layer saved: Repeat and near repeat classification: Leak and burst repairs (950 features). id 49d484f0-691d-49a8-9795-a8bae9950aef:0
- 49Rendering: Map: Emerging hot spots: Leak and burst repairs id 3f3bb028-17f1-44d1-9de6-44fc0a9fc721
- 50Rendering: Map: Emerging hot spots: Customer complaints id 9509ddaa-4c98-4096-9c90-32c7d0128ded
- 51Rendering: Map: Hot spot analysis: Valves id d9873c2c-3566-4d27-8fb1-3136201c8204
- 52Rendering: Map: Hot spot analysis: Leak and burst repairs id cdaff975-dab2-424f-adfa-2274328ed591
- 53Rendering: Map: Hot spot analysis: Customer complaints id a6899e22-c5e5-420f-b266-3bc1126baba6
- 54Rendering: Map: Calculate density: Valves id ceb559c1-f678-4874-aea2-b7d563cf1fef
- 55Rendering: Map: Calculate density: Leak and burst repairs id 8c99a9da-4d30-49f5-a977-12f556499841
- 56Rendering: Map: Calculate density: Customer complaints id b9ce5771-f68b-494b-ae0f-5e0d4969f781
- 57Rendering: Map: Summarize within: Pressure zones id fd78fee3-ac8d-4b2b-b5ed-f7f57f068c3f
- 58Rendering: Map: Summarize within: Pressure zones id e6e4e8f2-04db-41fd-9da6-5906d1ba4b30
- 59Rendering: Map: Summarize within: Pressure zones id a4dbb3eb-6f59-462f-b3a9-d07bb0313663
- 60Rendering: Map: Find point clusters: Valves id db8344db-3a76-4085-aeb4-dd38135e8607
- 61Rendering: Map: Find point clusters: cluster hulls id 49a3caba-0eac-49c0-a96c-a416fb8cffcc
- 62Rendering: Map: Find point clusters: Leak and burst repairs id 2ad72120-f06f-49cc-bcfe-1d1f0f3704d0
- 63Rendering: Map: Find point clusters: cluster hulls id 1a6807c6-9e63-44e0-b47a-9cfd06d92860
- 64Rendering: Map: Find point clusters: Customer complaints id 6cdef5e4-9d12-42ff-9772-03d4ae9d2a31
- 65Rendering: Map: Find point clusters: cluster hulls id 0a4f53e6-e3e8-4a99-86a4-49c237e7d264
- 66Rendering: Map: Pressure zones by connections id a91f1b3f-c237-43d7-ba64-33ecbd256f0a
- 67Rendering: Map: Find outliers: Pressure zones id 44cdd90e-0c9c-4cf3-93b9-7b1f48c5e306
- 68Rendering: Map: Repeat and near repeat classification: Leak and burst repairs id 5f3c5bb5-4c59-4d70-a046-4429e3906db9
- 69Rendering: Chart: Water mains over time (install_year). 13 rows id 02627da8-8e62-4e80-9719-72a7e2f55e57
- 70Rendering: Chart: Leak and burst repairs over time (reported_at). 144 rows id c494397c-b48a-49fb-afa7-7a5504c99947
- 71Rendering: Chart: Valves over time (exercised_year). 10 rows id dcd28c89-a9a3-4182-881a-28e358a8b5a7
- 72Rendering: Chart: Fire hydrants over time (last_test_year). 9 rows id 9501bf0d-1118-4646-9011-1d6607707f6d
- 73Rendering: Chart: Customer complaints over time (date). 212 rows id 7b3d1156-e7a8-493d-9083-daeb182a4c85
- 74Rendering: Chart: Zone meter readings by month over time (month). 24 rows id 2ab22dd9-e4bb-48ba-8c04-bc7babef5d0b
- 75Rendering: Chart: Pipe replacement plan over time (planned_year). 9 rows id 177c5fda-dc15-4abc-a44e-4ee15d594e8b
- 76Rendering: Chart: Emerging hot spots: Leak and burst repairs. 8 rows id 595a0dc9-9c95-4ae1-b0ca-4e5d14d12396
- 77Rendering: Chart: Emerging hot spots: Customer complaints. 8 rows id 49549103-57d2-486d-8bd4-4431013cb1b3
- 78Rendering: Chart: Hot spot analysis: Valves. 10 rows id 5e1fa7b3-4f72-4f37-b847-44ccfd91b8d8
- 79Rendering: Chart: Hot spot analysis: Leak and burst repairs. 13 rows id 4cefd833-0e50-4578-9d0a-70931ac2bf5a
- 80Rendering: Chart: Hot spot analysis: Customer complaints. 11 rows id 86d35ebf-41a8-48e6-b171-41a261df419b
- 81Rendering: Chart: Calculate density: Valves. 10 rows id 27f5c03d-412f-4e4d-822d-a1df30a1c49a
- 82Rendering: Chart: Calculate density: Leak and burst repairs. 12 rows id 4666369b-bfa5-4f04-901c-ec29c5b49d6c
- 83Rendering: Chart: Calculate density: Customer complaints. 12 rows id aa86d4c3-c625-4f70-a661-51f8126e6af8
- 84Rendering: Chart: Summarize within: Pressure zones. 5 rows id 0d45df48-f878-4529-8914-7b9c943ea003
- 85Rendering: Chart: Summarize within: Pressure zones. 5 rows id 502ad046-ea5a-4ca6-9f48-484b32739196
- 86Rendering: Chart: Summarize within: Pressure zones. 5 rows id 949001f2-9fc6-4ae2-909c-4b238ba0916e
- 87Rendering: Chart: Find point clusters: Valves. 12 rows id 868093f7-066c-469b-baa7-f20941a2f40e
- 88Rendering: Chart: Find point clusters: cluster hulls. 11 rows id 84119cbe-b098-4105-bce7-8ddc860ad22d
- 89Rendering: Chart: Find point clusters: Leak and burst repairs. 4 rows id 1b45df1b-a05d-4531-ae0d-49c2224a2551
- 90Rendering: Chart: Find point clusters: cluster hulls. 3 rows id 5a127efb-1998-463d-8956-bee898322fc9
- 91Rendering: Chart: Find point clusters: Customer complaints. 4 rows id ae5b32b2-383a-4be8-bf14-6c6f8449b0b1
- 92Rendering: Chart: Find point clusters: cluster hulls. 3 rows id 2b12b071-0f4d-46c7-abc8-69c6b190d0d6
- 93Rendering: Chart: Repeat and near repeat classification: Leak and burst repairs over time. 144 rows id 3fc856ce-5d0d-407f-ad64-e3c0cc964288
- 94Rendering: Chart: Find point clusters: Customer complaints over time. 212 rows id 1e06545d-de8b-4037-b0da-2de0f7f334fe
- 95Rendering: Chart: Find point clusters: Leak and burst repairs over time. 144 rows id b893e1bc-7a5d-4622-8b2d-a1fc99d79142
- 96Dataset: Pressure zones. vector, 8 rows id 8e552b2b-0ef5-4c0c-821c-708e0de62375
- 97Dataset: Water mains. vector, 2130 rows id b6d4651b-de72-426b-b18e-081f92a20090
- 98Dataset: Reservoirs. vector, 4 rows id a4ba7898-6adb-4a62-b4b3-2baa51710fd7
- 99Dataset: Valves. vector, 300 rows id 2f9d6af4-8dbc-4919-9c2e-358009680d94
- 100Dataset: Fire hydrants. vector, 250 rows id 5c702260-a660-41d8-8aac-adc95c8d4329
- 101Dataset: Pipe replacement plan. table, 220 rows id c062d67a-c643-4dbc-bddd-b13a8c563a9e
- 102Dataset: Non-revenue water briefing. document, ? rows id 0a3aab36-0977-4c51-a725-7886eccfb7f7
- 103Record: Sample: Water utility, Cape Town id 0f6d1895-598a-4c17-a195-fc538533c4a3
- 104Layer: Emerging hot spots: Leak and burst repairs. 71 features id fcb15038-1ce5-4dfe-bef3-37f0d0710660
- 105Layer: Emerging hot spots: Customer complaints. 75 features id 6cd4cdee-eaed-4536-97a3-8cfcfcea991a
- 106Layer: Hot spot analysis: Valves. 53 features id e6e46379-bab5-4be3-b731-f573fbaeaa2b
- 107Layer: Hot spot analysis: Leak and burst repairs. 184 features id 1b8c7972-3a5f-43cb-9c04-79be94f68fa2
- 108Layer: Hot spot analysis: Customer complaints. 185 features id cc6c04aa-9769-4c55-bffd-23f14fc19e22
- 109Layer: Calculate density: Valves. 257 features id 7c69e54b-2611-4108-a8f1-7edbf9681ff2
- 110Layer: Calculate density: Leak and burst repairs. 1,220 features id 10a45b3b-e980-47be-9cf9-6b191e7fa957
- 111Layer: Calculate density: Customer complaints. 1,200 features id 36b7f8be-2e78-4f25-add1-4c5b63fade60
- 112Layer: Summarize within: Pressure zones. 8 features id e1b22dd3-e0d4-4c9f-a4dd-6460b011a8f0
- 113Layer: Summarize within: Pressure zones. 8 features id 2c26882f-372c-4dd1-9856-1556ecf83503
- 114Layer: Summarize within: Pressure zones. 8 features id 8d6f5fe5-afba-45d0-8676-09532976c3ba
- 115Layer: Find point clusters: Valves. 300 features id 4058852d-d252-42dd-b715-c4555264de96
- 116Layer: Find point clusters: cluster hulls. 11 features id 01ccf49b-1072-42db-8660-3b6bfa50a885
- 117Layer: Find point clusters: Leak and burst repairs. 950 features id 2ace68cb-dd6a-44c4-9784-ec90079bfd14
- 118Layer: Find point clusters: cluster hulls. 3 features id cee4dd63-1a39-434b-86a5-dbfe42ae6477
- 119Layer: Find point clusters: Customer complaints. 520 features id 7c106e45-1ddc-48c3-bc26-ae9c11c94028
- 120Layer: Find point clusters: cluster hulls. 3 features id 5dfd2c79-c5e3-4675-8539-b2fa77d08d7a
- 121Layer: Find outliers: Pressure zones. 8 features id e61c7a42-8b9f-473a-8310-bc15178693a5
- 122Layer: Repeat and near repeat classification: Leak and burst repairs. 950 features id 9bbadc15-5868-46e4-9005-946ec8a2298c
Appendix: the data behind the chartsShow
Figure 1. Timeline: events per month by dataset 1
| period | series | value |
|---|---|---|
| 2023-10-01 | Leak and burst repairs | 20 |
| 2023-10-01 | Customer complaints | 0 |
| 2023-10-01 | Zone meter readings by month | 0 |
| 2023-11-01 | Leak and burst repairs | 14 |
| 2023-11-01 | Customer complaints | 0 |
| 2023-11-01 | Zone meter readings by month | 0 |
| 2023-12-01 | Leak and burst repairs | 17 |
| 2023-12-01 | Customer complaints | 0 |
| 2023-12-01 | Zone meter readings by month | 0 |
| 2024-01-01 | Leak and burst repairs | 10 |
| 2024-01-01 | Customer complaints | 0 |
| 2024-01-01 | Zone meter readings by month | 0 |
| 2024-02-01 | Leak and burst repairs | 13 |
| 2024-02-01 | Customer complaints | 0 |
| 2024-02-01 | Zone meter readings by month | 0 |
| 2024-03-01 | Leak and burst repairs | 17 |
| 2024-03-01 | Customer complaints | 0 |
| 2024-03-01 | Zone meter readings by month | 0 |
| 2024-04-01 | Leak and burst repairs | 34 |
| 2024-04-01 | Customer complaints | 0 |
| 2024-04-01 | Zone meter readings by month | 0 |
| 2024-05-01 | Leak and burst repairs | 24 |
| 2024-05-01 | Customer complaints | 0 |
| 2024-05-01 | Zone meter readings by month | 0 |
| 2024-06-01 | Leak and burst repairs | 44 |
| 2024-06-01 | Customer complaints | 0 |
| 2024-06-01 | Zone meter readings by month | 0 |
| 2024-07-01 | Leak and burst repairs | 36 |
| 2024-07-01 | Customer complaints | 0 |
| 2024-07-01 | Zone meter readings by month | 0 |
| 2024-08-01 | Leak and burst repairs | 32 |
| 2024-08-01 | Customer complaints | 0 |
| 2024-08-01 | Zone meter readings by month | 0 |
| 2024-09-01 | Leak and burst repairs | 33 |
| 2024-09-01 | Customer complaints | 0 |
| 2024-09-01 | Zone meter readings by month | 0 |
| 2024-10-01 | Leak and burst repairs | 32 |
| 2024-10-01 | Customer complaints | 0 |
| 2024-10-01 | Zone meter readings by month | 8 |
| 2024-11-01 | Leak and burst repairs | 14 |
| 2024-11-01 | Customer complaints | 0 |
| 2024-11-01 | Zone meter readings by month | 8 |
| 2024-12-01 | Leak and burst repairs | 14 |
| 2024-12-01 | Customer complaints | 0 |
| 2024-12-01 | Zone meter readings by month | 8 |
| 2025-01-01 | Leak and burst repairs | 9 |
| 2025-01-01 | Customer complaints | 0 |
| 2025-01-01 | Zone meter readings by month | 8 |
| 2025-02-01 | Leak and burst repairs | 17 |
| 2025-02-01 | Customer complaints | 0 |
| 2025-02-01 | Zone meter readings by month | 8 |
| 2025-03-01 | Leak and burst repairs | 26 |
| 2025-03-01 | Customer complaints | 0 |
| 2025-03-01 | Zone meter readings by month | 8 |
| 2025-04-01 | Leak and burst repairs | 22 |
| 2025-04-01 | Customer complaints | 0 |
| 2025-04-01 | Zone meter readings by month | 8 |
| 2025-05-01 | Leak and burst repairs | 27 |
| 2025-05-01 | Customer complaints | 0 |
| 2025-05-01 | Zone meter readings by month | 8 |
| 2025-06-01 | Leak and burst repairs | 29 |
| 2025-06-01 | Customer complaints | 0 |
| 2025-06-01 | Zone meter readings by month | 8 |
| 2025-07-01 | Leak and burst repairs | 39 |
| 2025-07-01 | Customer complaints | 0 |
| 2025-07-01 | Zone meter readings by month | 8 |
| 2025-08-01 | Leak and burst repairs | 29 |
| 2025-08-01 | Customer complaints | 0 |
| 2025-08-01 | Zone meter readings by month | 8 |
| 2025-09-01 | Leak and burst repairs | 37 |
| 2025-09-01 | Customer complaints | 0 |
| 2025-09-01 | Zone meter readings by month | 8 |
| 2025-10-01 | Leak and burst repairs | 34 |
| 2025-10-01 | Customer complaints | 43 |
| 2025-10-01 | Zone meter readings by month | 8 |
| 2025-11-01 | Leak and burst repairs | 16 |
| 2025-11-01 | Customer complaints | 30 |
| 2025-11-01 | Zone meter readings by month | 8 |
| 2025-12-01 | Leak and burst repairs | 20 |
| 2025-12-01 | Customer complaints | 21 |
| 2025-12-01 | Zone meter readings by month | 8 |
| 2026-01-01 | Leak and burst repairs | 13 |
| 2026-01-01 | Customer complaints | 16 |
| 2026-01-01 | Zone meter readings by month | 8 |
| 2026-02-01 | Leak and burst repairs | 9 |
| 2026-02-01 | Customer complaints | 25 |
| 2026-02-01 | Zone meter readings by month | 8 |
| 2026-03-01 | Leak and burst repairs | 20 |
| 2026-03-01 | Customer complaints | 34 |
| 2026-03-01 | Zone meter readings by month | 8 |
| 2026-04-01 | Leak and burst repairs | 30 |
| 2026-04-01 | Customer complaints | 48 |
| 2026-04-01 | Zone meter readings by month | 8 |
| 2026-05-01 | Leak and burst repairs | 28 |
| 2026-05-01 | Customer complaints | 60 |
| 2026-05-01 | Zone meter readings by month | 8 |
| 2026-06-01 | Leak and burst repairs | 44 |
| 2026-06-01 | Customer complaints | 64 |
| 2026-06-01 | Zone meter readings by month | 8 |
| 2026-07-01 | Leak and burst repairs | 52 |
| 2026-07-01 | Customer complaints | 70 |
| 2026-07-01 | Zone meter readings by month | 8 |
| 2026-08-01 | Leak and burst repairs | 54 |
| 2026-08-01 | Customer complaints | 64 |
| 2026-08-01 | Zone meter readings by month | 8 |
| 2026-09-01 | Leak and burst repairs | 41 |
| 2026-09-01 | Customer complaints | 45 |
| 2026-09-01 | Zone meter readings by month | 8 |
Figure 22. Water mains over time (install_year) 69
| bin_start | bin_end | count |
|---|---|---|
| 75 | 84.62 | 417 |
| 84.62 | 94.23 | 0 |
| 94.23 | 103.8 | 396 |
| 103.8 | 113.5 | 393 |
| 113.5 | 123.1 | 0 |
| 123.1 | 132.7 | 0 |
| 132.7 | 142.3 | 0 |
| 142.3 | 151.9 | 0 |
| 151.9 | 161.5 | 377 |
| 161.5 | 171.2 | 0 |
| 171.2 | 180.8 | 0 |
| 180.8 | 190.4 | 0 |
| 190.4 | 200 | 547 |
Figure 23. Leak and burst repairs over time (reported_at) 70
| period | series | value |
|---|---|---|
| 2023-10-01 | leak | 9 |
| 2023-10-01 | burst | 5 |
| 2023-10-01 | joint failure | 4 |
| 2023-10-01 | valve leak | 2 |
| 2023-11-01 | leak | 9 |
| 2023-11-01 | burst | 5 |
| 2023-11-01 | joint failure | 0 |
| 2023-11-01 | valve leak | 0 |
| 2023-12-01 | leak | 7 |
| 2023-12-01 | burst | 5 |
| 2023-12-01 | joint failure | 1 |
| 2023-12-01 | valve leak | 4 |
| 2024-01-01 | leak | 9 |
| 2024-01-01 | burst | 0 |
| 2024-01-01 | joint failure | 1 |
| 2024-01-01 | valve leak | 0 |
| 2024-02-01 | leak | 8 |
| 2024-02-01 | burst | 2 |
| 2024-02-01 | joint failure | 2 |
| 2024-02-01 | valve leak | 1 |
| 2024-03-01 | leak | 8 |
| 2024-03-01 | burst | 7 |
| 2024-03-01 | joint failure | 1 |
| 2024-03-01 | valve leak | 1 |
| 2024-04-01 | leak | 21 |
| 2024-04-01 | burst | 5 |
| 2024-04-01 | joint failure | 6 |
| 2024-04-01 | valve leak | 2 |
| 2024-05-01 | leak | 11 |
| 2024-05-01 | burst | 8 |
| 2024-05-01 | joint failure | 3 |
| 2024-05-01 | valve leak | 2 |
| 2024-06-01 | leak | 19 |
| 2024-06-01 | burst | 12 |
| 2024-06-01 | joint failure | 10 |
| 2024-06-01 | valve leak | 3 |
| 2024-07-01 | leak | 14 |
| 2024-07-01 | burst | 14 |
| 2024-07-01 | joint failure | 6 |
| 2024-07-01 | valve leak | 2 |
| 2024-08-01 | leak | 13 |
| 2024-08-01 | burst | 14 |
| 2024-08-01 | joint failure | 3 |
| 2024-08-01 | valve leak | 2 |
| 2024-09-01 | leak | 16 |
| 2024-09-01 | burst | 11 |
| 2024-09-01 | joint failure | 5 |
| 2024-09-01 | valve leak | 1 |
| 2024-10-01 | leak | 15 |
| 2024-10-01 | burst | 11 |
| 2024-10-01 | joint failure | 6 |
| 2024-10-01 | valve leak | 0 |
| 2024-11-01 | leak | 6 |
| 2024-11-01 | burst | 5 |
| 2024-11-01 | joint failure | 3 |
| 2024-11-01 | valve leak | 0 |
| 2024-12-01 | leak | 11 |
| 2024-12-01 | burst | 1 |
| 2024-12-01 | joint failure | 1 |
| 2024-12-01 | valve leak | 1 |
| 2025-01-01 | leak | 3 |
| 2025-01-01 | burst | 4 |
| 2025-01-01 | joint failure | 2 |
| 2025-01-01 | valve leak | 0 |
| 2025-02-01 | leak | 7 |
| 2025-02-01 | burst | 5 |
| 2025-02-01 | joint failure | 2 |
| 2025-02-01 | valve leak | 3 |
| 2025-03-01 | leak | 14 |
| 2025-03-01 | burst | 5 |
| 2025-03-01 | joint failure | 6 |
| 2025-03-01 | valve leak | 1 |
| 2025-04-01 | leak | 9 |
| 2025-04-01 | burst | 6 |
| 2025-04-01 | joint failure | 5 |
| 2025-04-01 | valve leak | 2 |
| 2025-05-01 | leak | 8 |
| 2025-05-01 | burst | 11 |
| 2025-05-01 | joint failure | 8 |
| 2025-05-01 | valve leak | 0 |
| 2025-06-01 | leak | 13 |
| 2025-06-01 | burst | 7 |
| 2025-06-01 | joint failure | 6 |
| 2025-06-01 | valve leak | 3 |
| 2025-07-01 | leak | 28 |
| 2025-07-01 | burst | 4 |
| 2025-07-01 | joint failure | 4 |
| 2025-07-01 | valve leak | 3 |
| 2025-08-01 | leak | 12 |
| 2025-08-01 | burst | 6 |
| 2025-08-01 | joint failure | 8 |
| 2025-08-01 | valve leak | 3 |
| 2025-09-01 | leak | 19 |
| 2025-09-01 | burst | 10 |
| 2025-09-01 | joint failure | 7 |
| 2025-09-01 | valve leak | 1 |
| 2025-10-01 | leak | 13 |
| 2025-10-01 | burst | 13 |
| 2025-10-01 | joint failure | 6 |
| 2025-10-01 | valve leak | 2 |
| 2025-11-01 | leak | 6 |
| 2025-11-01 | burst | 6 |
| 2025-11-01 | joint failure | 2 |
| 2025-11-01 | valve leak | 2 |
| 2025-12-01 | leak | 10 |
| 2025-12-01 | burst | 4 |
| 2025-12-01 | joint failure | 3 |
| 2025-12-01 | valve leak | 3 |
| 2026-01-01 | leak | 5 |
| 2026-01-01 | burst | 2 |
| 2026-01-01 | joint failure | 2 |
| 2026-01-01 | valve leak | 4 |
| 2026-02-01 | leak | 4 |
| 2026-02-01 | burst | 3 |
| 2026-02-01 | joint failure | 1 |
| 2026-02-01 | valve leak | 1 |
| 2026-03-01 | leak | 7 |
| 2026-03-01 | burst | 7 |
| 2026-03-01 | joint failure | 2 |
| 2026-03-01 | valve leak | 4 |
| 2026-04-01 | leak | 14 |
| 2026-04-01 | burst | 12 |
| 2026-04-01 | joint failure | 2 |
| 2026-04-01 | valve leak | 2 |
| 2026-05-01 | leak | 14 |
| 2026-05-01 | burst | 9 |
| 2026-05-01 | joint failure | 4 |
| 2026-05-01 | valve leak | 1 |
| 2026-06-01 | leak | 15 |
| 2026-06-01 | burst | 11 |
| 2026-06-01 | joint failure | 14 |
| 2026-06-01 | valve leak | 4 |
| 2026-07-01 | leak | 23 |
| 2026-07-01 | burst | 20 |
| 2026-07-01 | joint failure | 8 |
| 2026-07-01 | valve leak | 1 |
| 2026-08-01 | leak | 24 |
| 2026-08-01 | burst | 14 |
| 2026-08-01 | joint failure | 12 |
| 2026-08-01 | valve leak | 4 |
| 2026-09-01 | leak | 23 |
| 2026-09-01 | burst | 9 |
| 2026-09-01 | joint failure | 7 |
| 2026-09-01 | valve leak | 2 |
Figure 24. Valves over time (exercised_year) 71
| bin_start | bin_end | count |
|---|---|---|
| 2,008 | 2,010 | 41 |
| 2,010 | 2,012 | 22 |
| 2,012 | 2,013 | 27 |
| 2,013 | 2,015 | 30 |
| 2,015 | 2,017 | 13 |
| 2,017 | 2,019 | 29 |
| 2,019 | 2,021 | 34 |
| 2,021 | 2,022 | 35 |
| 2,022 | 2,024 | 38 |
| 2,024 | 2,026 | 31 |
Figure 25. Fire hydrants over time (last_test_year) 72
| bin_start | bin_end | count |
|---|---|---|
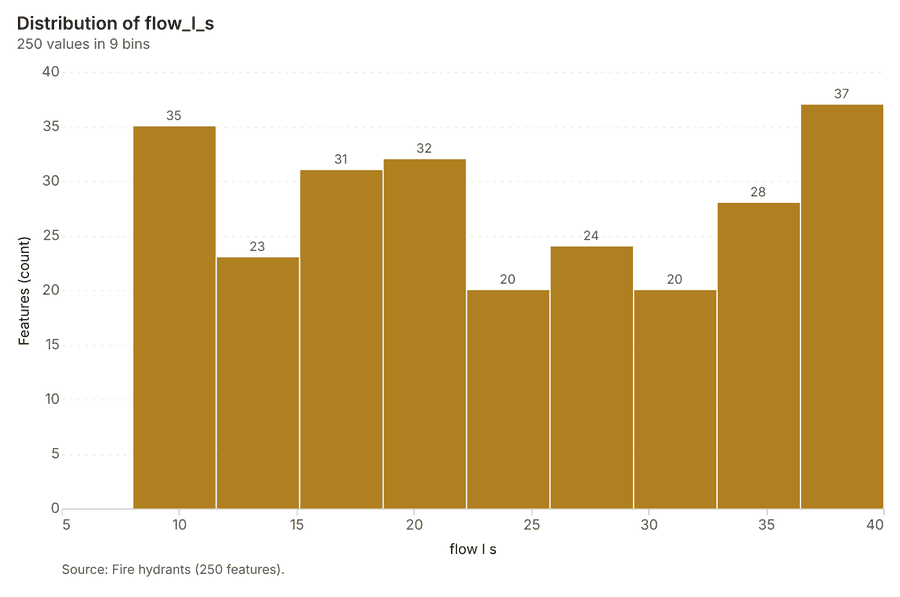
| 8 | 11.56 | 35 |
| 11.56 | 15.11 | 23 |
| 15.11 | 18.67 | 31 |
| 18.67 | 22.22 | 32 |
| 22.22 | 25.78 | 20 |
| 25.78 | 29.33 | 24 |
| 29.33 | 32.89 | 20 |
| 32.89 | 36.44 | 28 |
| 36.44 | 40 | 37 |
Figure 26. Customer complaints over time (date) 73
| period | series | value |
|---|---|---|
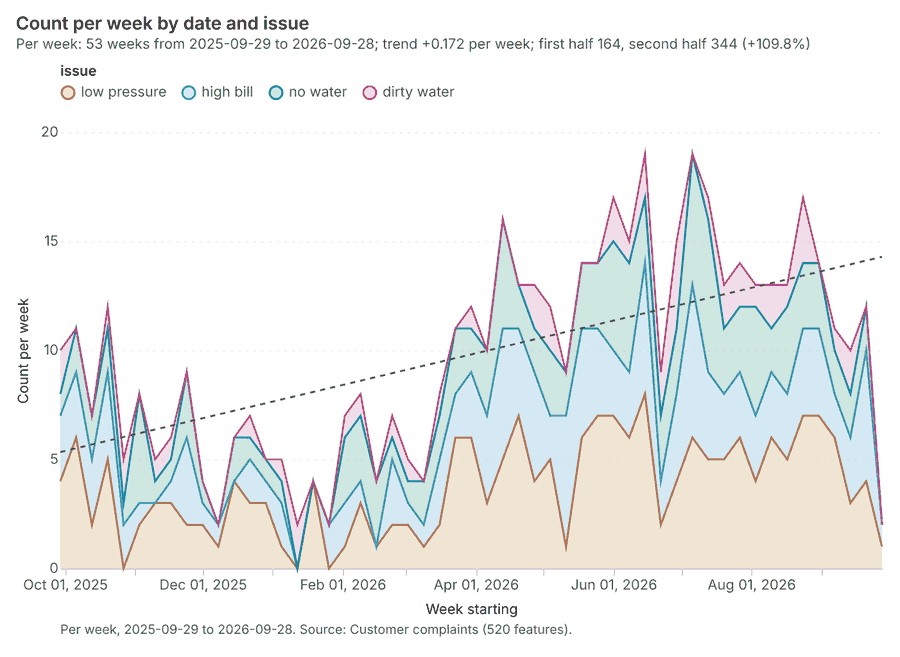
| 2025-09-29 | low pressure | 4 |
| 2025-09-29 | high bill | 3 |
| 2025-09-29 | no water | 1 |
| 2025-09-29 | dirty water | 2 |
| 2025-10-06 | low pressure | 6 |
| 2025-10-06 | high bill | 3 |
| 2025-10-06 | no water | 2 |
| 2025-10-06 | dirty water | 0 |
| 2025-10-13 | low pressure | 2 |
| 2025-10-13 | high bill | 3 |
| 2025-10-13 | no water | 2 |
| 2025-10-13 | dirty water | 0 |
| 2025-10-20 | low pressure | 5 |
| 2025-10-20 | high bill | 4 |
| 2025-10-20 | no water | 2 |
| 2025-10-20 | dirty water | 1 |
| 2025-10-27 | low pressure | 0 |
| 2025-10-27 | high bill | 2 |
| 2025-10-27 | no water | 1 |
| 2025-10-27 | dirty water | 2 |
| 2025-11-03 | low pressure | 2 |
| 2025-11-03 | high bill | 1 |
| 2025-11-03 | no water | 5 |
| 2025-11-03 | dirty water | 0 |
| 2025-11-10 | low pressure | 3 |
| 2025-11-10 | high bill | 0 |
| 2025-11-10 | no water | 1 |
| 2025-11-10 | dirty water | 1 |
| 2025-11-17 | low pressure | 3 |
| 2025-11-17 | high bill | 1 |
| 2025-11-17 | no water | 1 |
| 2025-11-17 | dirty water | 1 |
| 2025-11-24 | low pressure | 2 |
| 2025-11-24 | high bill | 4 |
| 2025-11-24 | no water | 3 |
| 2025-11-24 | dirty water | 0 |
| 2025-12-01 | low pressure | 2 |
| 2025-12-01 | high bill | 1 |
| 2025-12-01 | no water | 1 |
| 2025-12-01 | dirty water | 0 |
| 2025-12-08 | low pressure | 1 |
| 2025-12-08 | high bill | 1 |
| 2025-12-08 | no water | 0 |
| 2025-12-08 | dirty water | 0 |
| 2025-12-15 | low pressure | 4 |
| 2025-12-15 | high bill | 0 |
| 2025-12-15 | no water | 2 |
| 2025-12-15 | dirty water | 0 |
| 2025-12-22 | low pressure | 3 |
| 2025-12-22 | high bill | 2 |
| 2025-12-22 | no water | 1 |
| 2025-12-22 | dirty water | 1 |
| 2025-12-29 | low pressure | 3 |
| 2025-12-29 | high bill | 1 |
| 2025-12-29 | no water | 1 |
| 2025-12-29 | dirty water | 0 |
| 2026-01-05 | low pressure | 1 |
| 2026-01-05 | high bill | 2 |
| 2026-01-05 | no water | 1 |
| 2026-01-05 | dirty water | 1 |
| 2026-01-12 | low pressure | 0 |
| 2026-01-12 | high bill | 0 |
| 2026-01-12 | no water | 0 |
| 2026-01-12 | dirty water | 2 |
| 2026-01-19 | low pressure | 4 |
| 2026-01-19 | high bill | 0 |
| 2026-01-19 | no water | 0 |
| 2026-01-19 | dirty water | 0 |
| 2026-01-26 | low pressure | 0 |
| 2026-01-26 | high bill | 2 |
| 2026-01-26 | no water | 0 |
| 2026-01-26 | dirty water | 0 |
| 2026-02-02 | low pressure | 1 |
| 2026-02-02 | high bill | 2 |
| 2026-02-02 | no water | 3 |
| 2026-02-02 | dirty water | 1 |
| 2026-02-09 | low pressure | 3 |
| 2026-02-09 | high bill | 1 |
| 2026-02-09 | no water | 3 |
| 2026-02-09 | dirty water | 1 |
| 2026-02-16 | low pressure | 1 |
| 2026-02-16 | high bill | 0 |
| 2026-02-16 | no water | 3 |
| 2026-02-16 | dirty water | 0 |
| 2026-02-23 | low pressure | 2 |
| 2026-02-23 | high bill | 3 |
| 2026-02-23 | no water | 1 |
| 2026-02-23 | dirty water | 1 |
| 2026-03-02 | low pressure | 2 |
| 2026-03-02 | high bill | 1 |
| 2026-03-02 | no water | 1 |
| 2026-03-02 | dirty water | 1 |
| 2026-03-09 | low pressure | 1 |
| 2026-03-09 | high bill | 1 |
| 2026-03-09 | no water | 2 |
| 2026-03-09 | dirty water | 0 |
| 2026-03-16 | low pressure | 2 |
| 2026-03-16 | high bill | 3 |
| 2026-03-16 | no water | 2 |
| 2026-03-16 | dirty water | 1 |
| 2026-03-23 | low pressure | 6 |
| 2026-03-23 | high bill | 2 |
| 2026-03-23 | no water | 3 |
| 2026-03-23 | dirty water | 0 |
| 2026-03-30 | low pressure | 6 |
| 2026-03-30 | high bill | 3 |
| 2026-03-30 | no water | 2 |
| 2026-03-30 | dirty water | 1 |
| 2026-04-06 | low pressure | 3 |
| 2026-04-06 | high bill | 4 |
| 2026-04-06 | no water | 3 |
| 2026-04-06 | dirty water | 0 |
| 2026-04-13 | low pressure | 5 |
| 2026-04-13 | high bill | 6 |
| 2026-04-13 | no water | 5 |
| 2026-04-13 | dirty water | 0 |
| 2026-04-20 | low pressure | 7 |
| 2026-04-20 | high bill | 4 |
| 2026-04-20 | no water | 2 |
| 2026-04-20 | dirty water | 0 |
| 2026-04-27 | low pressure | 4 |
| 2026-04-27 | high bill | 5 |
| 2026-04-27 | no water | 2 |
| 2026-04-27 | dirty water | 2 |
| 2026-05-04 | low pressure | 5 |
| 2026-05-04 | high bill | 2 |
| 2026-05-04 | no water | 3 |
| 2026-05-04 | dirty water | 2 |
| 2026-05-11 | low pressure | 1 |
| 2026-05-11 | high bill | 6 |
| 2026-05-11 | no water | 2 |
| 2026-05-11 | dirty water | 0 |
| 2026-05-18 | low pressure | 6 |
| 2026-05-18 | high bill | 5 |
| 2026-05-18 | no water | 3 |
| 2026-05-18 | dirty water | 0 |
| 2026-05-25 | low pressure | 7 |
| 2026-05-25 | high bill | 4 |
| 2026-05-25 | no water | 3 |
| 2026-05-25 | dirty water | 0 |
| 2026-06-01 | low pressure | 7 |
| 2026-06-01 | high bill | 3 |
| 2026-06-01 | no water | 5 |
| 2026-06-01 | dirty water | 2 |
| 2026-06-08 | low pressure | 6 |
| 2026-06-08 | high bill | 3 |
| 2026-06-08 | no water | 5 |
| 2026-06-08 | dirty water | 1 |
| 2026-06-15 | low pressure | 8 |
| 2026-06-15 | high bill | 6 |
| 2026-06-15 | no water | 3 |
| 2026-06-15 | dirty water | 2 |
| 2026-06-22 | low pressure | 2 |
| 2026-06-22 | high bill | 2 |
| 2026-06-22 | no water | 3 |
| 2026-06-22 | dirty water | 2 |
| 2026-06-29 | low pressure | 4 |
| 2026-06-29 | high bill | 4 |
| 2026-06-29 | no water | 3 |
| 2026-06-29 | dirty water | 4 |
| 2026-07-06 | low pressure | 6 |
| 2026-07-06 | high bill | 7 |
| 2026-07-06 | no water | 6 |
| 2026-07-06 | dirty water | 0 |
| 2026-07-13 | low pressure | 5 |
| 2026-07-13 | high bill | 4 |
| 2026-07-13 | no water | 7 |
| 2026-07-13 | dirty water | 1 |
| 2026-07-20 | low pressure | 5 |
| 2026-07-20 | high bill | 3 |
| 2026-07-20 | no water | 3 |
| 2026-07-20 | dirty water | 2 |
| 2026-07-27 | low pressure | 6 |
| 2026-07-27 | high bill | 3 |
| 2026-07-27 | no water | 3 |
| 2026-07-27 | dirty water | 2 |
| 2026-08-03 | low pressure | 4 |
| 2026-08-03 | high bill | 3 |
| 2026-08-03 | no water | 5 |
| 2026-08-03 | dirty water | 1 |
| 2026-08-10 | low pressure | 6 |
| 2026-08-10 | high bill | 3 |
| 2026-08-10 | no water | 2 |
| 2026-08-10 | dirty water | 2 |
| 2026-08-17 | low pressure | 5 |
| 2026-08-17 | high bill | 3 |
| 2026-08-17 | no water | 4 |
| 2026-08-17 | dirty water | 1 |
| 2026-08-24 | low pressure | 7 |
| 2026-08-24 | high bill | 4 |
| 2026-08-24 | no water | 3 |
| 2026-08-24 | dirty water | 3 |
| 2026-08-31 | low pressure | 7 |
| 2026-08-31 | high bill | 4 |
| 2026-08-31 | no water | 3 |
| 2026-08-31 | dirty water | 0 |
| 2026-09-07 | low pressure | 6 |
| 2026-09-07 | high bill | 2 |
| 2026-09-07 | no water | 2 |
| 2026-09-07 | dirty water | 1 |
| 2026-09-14 | low pressure | 3 |
| 2026-09-14 | high bill | 3 |
| 2026-09-14 | no water | 2 |
| 2026-09-14 | dirty water | 2 |
| 2026-09-21 | low pressure | 4 |
| 2026-09-21 | high bill | 6 |
| 2026-09-21 | no water | 2 |
| 2026-09-21 | dirty water | 0 |
| 2026-09-28 | low pressure | 1 |
| 2026-09-28 | high bill | 1 |
| 2026-09-28 | no water | 0 |
| 2026-09-28 | dirty water | 0 |
Figure 27. Zone meter readings by month over time (month) 74
| period | value |
|---|---|
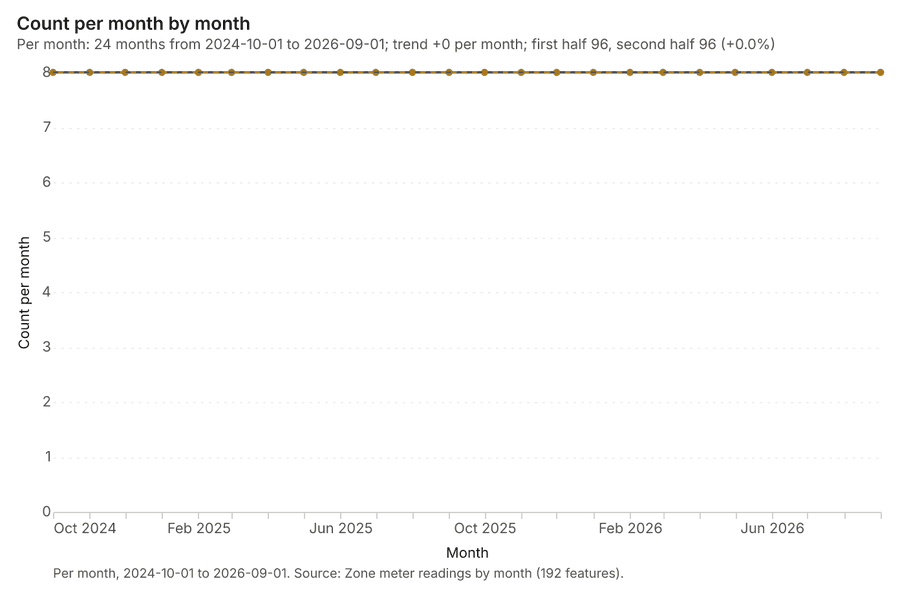
| 2024-10-01 | 8 |
| 2024-11-01 | 8 |
| 2024-12-01 | 8 |
| 2025-01-01 | 8 |
| 2025-02-01 | 8 |
| 2025-03-01 | 8 |
| 2025-04-01 | 8 |
| 2025-05-01 | 8 |
| 2025-06-01 | 8 |
| 2025-07-01 | 8 |
| 2025-08-01 | 8 |
| 2025-09-01 | 8 |
| 2025-10-01 | 8 |
| 2025-11-01 | 8 |
| 2025-12-01 | 8 |
| 2026-01-01 | 8 |
| 2026-02-01 | 8 |
| 2026-03-01 | 8 |
| 2026-04-01 | 8 |
| 2026-05-01 | 8 |
| 2026-06-01 | 8 |
| 2026-07-01 | 8 |
| 2026-08-01 | 8 |
| 2026-09-01 | 8 |
Figure 28. Pipe replacement plan over time (planned_year) 75
| bin_start | bin_end | count |
|---|---|---|
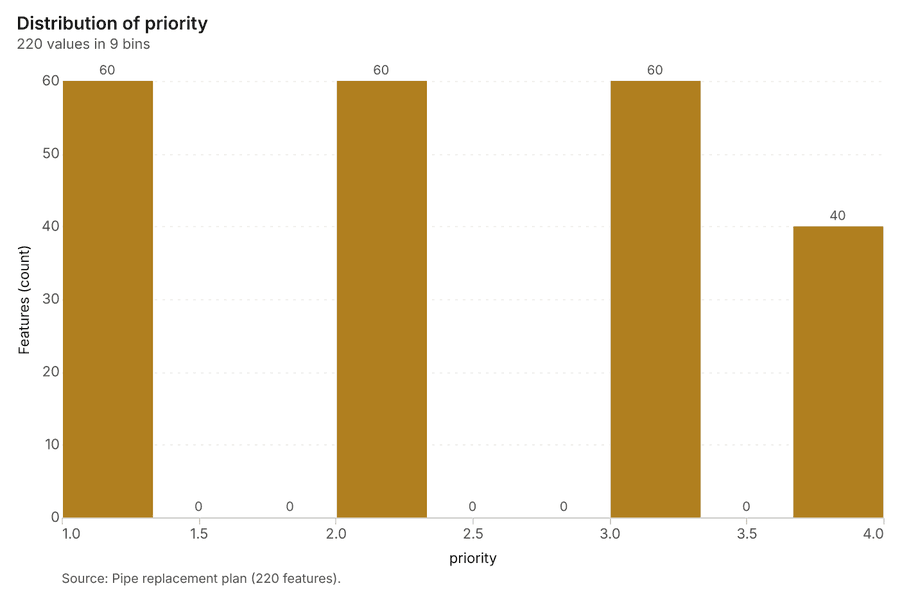
| 1 | 1.333 | 60 |
| 1.333 | 1.667 | 0 |
| 1.667 | 2 | 0 |
| 2 | 2.333 | 60 |
| 2.333 | 2.667 | 0 |
| 2.667 | 3 | 0 |
| 3 | 3.333 | 60 |
| 3.333 | 3.667 | 0 |
| 3.667 | 4 | 40 |
Figure 29. Emerging hot spots: Leak and burst repairs 76
| bin_start | bin_end | count |
|---|---|---|
| -0.961 | 0.1214 | 35 |
| 0.1214 | 1.204 | 9 |
| 1.204 | 2.286 | 10 |
| 2.286 | 3.369 | 5 |
| 3.369 | 4.451 | 2 |
| 4.451 | 5.533 | 8 |
| 5.533 | 6.616 | 0 |
| 6.616 | 7.698 | 2 |
Figure 30. Emerging hot spots: Customer complaints 77
| bin_start | bin_end | count |
|---|---|---|
| -0.737 | -0.5961 | 55 |
| -0.5961 | -0.4552 | 0 |
| -0.4552 | -0.3144 | 0 |
| -0.3144 | -0.1735 | 0 |
| -0.1735 | -0.03263 | 0 |
| -0.03263 | 0.1082 | 0 |
| 0.1082 | 0.2491 | 0 |
| 0.2491 | 0.39 | 20 |
Figure 31. Hot spot analysis: Valves 78
| bin_start | bin_end | band | band_label | count |
|---|---|---|---|---|
| -2 | -1.5 | not_significant | Not significant | 5 |
| -1.5 | -1 | not_significant | Not significant | 2 |
| -1 | -0.5 | not_significant | Not significant | 10 |
| -0.5 | 0 | not_significant | Not significant | 8 |
| 0 | 0.5 | not_significant | Not significant | 12 |
| 0.5 | 1 | not_significant | Not significant | 7 |
| 1 | 1.5 | not_significant | Not significant | 4 |
| 1.5 | 2 | hot_90 | Hot spot, 90% confidence | 2 |
| 1.5 | 2 | hot_95 | Hot spot, 95% confidence | 2 |
| 2 | 2.5 | hot_95 | Hot spot, 95% confidence | 1 |
Figure 32. Hot spot analysis: Leak and burst repairs 79
| bin_start | bin_end | band | band_label | count |
|---|---|---|---|---|
| -1 | -0.5 | not_significant | Not significant | 45 |
| -0.5 | 0 | not_significant | Not significant | 104 |
| 0 | 0.5 | not_significant | Not significant | 4 |
| 0.5 | 1 | not_significant | Not significant | 3 |
| 1 | 1.5 | not_significant | Not significant | 11 |
| 1.5 | 2 | hot_90 | Hot spot, 90% confidence | 1 |
| 1.5 | 2 | hot_95 | Hot spot, 95% confidence | 2 |
| 1.5 | 2 | not_significant | Not significant | 1 |
| 2 | 2.5 | hot_95 | Hot spot, 95% confidence | 5 |
| 2.5 | 3 | hot_95 | Hot spot, 95% confidence | 1 |
| 2.5 | 3 | hot_99 | Hot spot, 99% confidence | 2 |
| 3 | 3.5 | hot_99 | Hot spot, 99% confidence | 3 |
| 4 | 4.5 | hot_99 | Hot spot, 99% confidence | 2 |
Figure 33. Hot spot analysis: Customer complaints 80
| bin_start | bin_end | band | band_label | count |
|---|---|---|---|---|
| -1 | -0.5 | not_significant | Not significant | 74 |
| -0.5 | 0 | not_significant | Not significant | 37 |
| 0 | 0.5 | not_significant | Not significant | 40 |
| 0.5 | 1 | not_significant | Not significant | 8 |
| 1 | 1.5 | not_significant | Not significant | 10 |
| 1.5 | 2 | hot_90 | Hot spot, 90% confidence | 4 |
| 2 | 2.5 | hot_95 | Hot spot, 95% confidence | 5 |
| 2.5 | 3 | hot_95 | Hot spot, 95% confidence | 3 |
| 2.5 | 3 | hot_99 | Hot spot, 99% confidence | 2 |
| 3.5 | 4 | hot_99 | Hot spot, 99% confidence | 1 |
| 4.5 | 5 | hot_99 | Hot spot, 99% confidence | 1 |
Figure 34. Calculate density: Valves 81
| bin_start | bin_end | count |
|---|---|---|
| 0 | 1.7 | 21 |
| 1.7 | 3.4 | 31 |
| 3.4 | 5.1 | 32 |
| 5.1 | 6.8 | 16 |
| 6.8 | 8.5 | 29 |
| 8.5 | 10.2 | 30 |
| 10.2 | 11.9 | 15 |
| 11.9 | 13.6 | 31 |
| 13.6 | 15.3 | 28 |
| 15.3 | 17 | 24 |
Figure 35. Calculate density: Leak and burst repairs 82
| bin_start | bin_end | count |
|---|---|---|
| 0 | 3.25 | 95 |
| 3.25 | 6.5 | 99 |
| 6.5 | 9.75 | 99 |
| 9.75 | 13 | 95 |
| 13 | 16.25 | 128 |
| 16.25 | 19.5 | 95 |
| 19.5 | 22.75 | 98 |
| 22.75 | 26 | 95 |
| 26 | 29.25 | 135 |
| 29.25 | 32.5 | 94 |
| 32.5 | 35.75 | 98 |
| 35.75 | 39 | 89 |
Figure 36. Calculate density: Customer complaints 83
| bin_start | bin_end | count |
|---|---|---|
| 0 | 3.083 | 111 |
| 3.083 | 6.167 | 100 |
| 6.167 | 9.25 | 99 |
| 9.25 | 12.33 | 99 |
| 12.33 | 15.42 | 97 |
| 15.42 | 18.5 | 95 |
| 18.5 | 21.58 | 95 |
| 21.58 | 24.67 | 96 |
| 24.67 | 27.75 | 98 |
| 27.75 | 30.83 | 100 |
| 30.83 | 33.92 | 96 |
| 33.92 | 37 | 114 |
Figure 37. Summarize within: Pressure zones 84
| bin_start | bin_end | count |
|---|---|---|
| 21 | 27 | 1 |
| 27 | 33 | 1 |
| 33 | 39 | 3 |
| 39 | 45 | 1 |
| 45 | 51 | 2 |
Figure 38. Summarize within: Pressure zones 85
| bin_start | bin_end | count |
|---|---|---|
| 35 | 146.2 | 7 |
| 146.2 | 257.4 | 0 |
| 257.4 | 368.6 | 0 |
| 368.6 | 479.8 | 0 |
| 479.8 | 591 | 1 |
Figure 39. Summarize within: Pressure zones 86
| bin_start | bin_end | count |
|---|---|---|
| 27 | 69.8 | 7 |
| 69.8 | 112.6 | 0 |
| 112.6 | 155.4 | 0 |
| 155.4 | 198.2 | 0 |
| 198.2 | 241 | 1 |
Figure 40. Find point clusters: Valves 87
| cluster | features | fraction | share |
|---|---|---|---|
| Noise | 114 | 0.38 | 38.0% |
| 1 | 66 | 0.22 | 22.0% |
| 0 | 30 | 0.1 | 10.0% |
| 4 | 26 | 0.08667 | 8.7% |
| 3 | 11 | 0.03667 | 3.7% |
| 2 | 10 | 0.03333 | 3.3% |
| 8 | 10 | 0.03333 | 3.3% |
| 6 | 9 | 0.03 | 3.0% |
| 10 | 8 | 0.02667 | 2.7% |
| 7 | 8 | 0.02667 | 2.7% |
| 5 | 5 | 0.01667 | 1.7% |
| 9 | 3 | 0.01 | 1.0% |
Figure 41. Find point clusters: cluster hulls 88
| cluster | features | fraction | share |
|---|---|---|---|
| 0 | 1 | 0.09091 | 9.1% |
| 1 | 1 | 0.09091 | 9.1% |
| 10 | 1 | 0.09091 | 9.1% |
| 2 | 1 | 0.09091 | 9.1% |
| 3 | 1 | 0.09091 | 9.1% |
| 4 | 1 | 0.09091 | 9.1% |
| 5 | 1 | 0.09091 | 9.1% |
| 6 | 1 | 0.09091 | 9.1% |
| 7 | 1 | 0.09091 | 9.1% |
| 8 | 1 | 0.09091 | 9.1% |
| 9 | 1 | 0.09091 | 9.1% |
Figure 42. Find point clusters: Leak and burst repairs 89
| cluster | features | fraction | share |
|---|---|---|---|
| Noise | 830 | 0.8737 | 87.4% |
| 1 | 56 | 0.05895 | 5.9% |
| 0 | 38 | 0.04 | 4.0% |
| 2 | 26 | 0.02737 | 2.7% |
Figure 43. Find point clusters: cluster hulls 90
| cluster | features | fraction | share |
|---|---|---|---|
| 0 | 1 | 0.3333 | 33.3% |
| 1 | 1 | 0.3333 | 33.3% |
| 2 | 1 | 0.3333 | 33.3% |
Figure 44. Find point clusters: Customer complaints 91
| cluster | features | fraction | share |
|---|---|---|---|
| 0 | 289 | 0.5558 | 55.6% |
| Noise | 196 | 0.3769 | 37.7% |
| 1 | 21 | 0.04038 | 4.0% |
| 2 | 14 | 0.02692 | 2.7% |
Figure 45. Find point clusters: cluster hulls 92
| cluster | features | fraction | share |
|---|---|---|---|
| 0 | 1 | 0.3333 | 33.3% |
| 1 | 1 | 0.3333 | 33.3% |
| 2 | 1 | 0.3333 | 33.3% |
Figure 46. Repeat and near repeat classification: Leak and burst repairs over time 93
| period | series | value |
|---|---|---|
| 2023-10-01 | leak | 9 |
| 2023-10-01 | burst | 5 |
| 2023-10-01 | joint failure | 4 |
| 2023-10-01 | valve leak | 2 |
| 2023-11-01 | leak | 9 |
| 2023-11-01 | burst | 5 |
| 2023-11-01 | joint failure | 0 |
| 2023-11-01 | valve leak | 0 |
| 2023-12-01 | leak | 7 |
| 2023-12-01 | burst | 5 |
| 2023-12-01 | joint failure | 1 |
| 2023-12-01 | valve leak | 4 |
| 2024-01-01 | leak | 9 |
| 2024-01-01 | burst | 0 |
| 2024-01-01 | joint failure | 1 |
| 2024-01-01 | valve leak | 0 |
| 2024-02-01 | leak | 8 |
| 2024-02-01 | burst | 2 |
| 2024-02-01 | joint failure | 2 |
| 2024-02-01 | valve leak | 1 |
| 2024-03-01 | leak | 8 |
| 2024-03-01 | burst | 7 |
| 2024-03-01 | joint failure | 1 |
| 2024-03-01 | valve leak | 1 |
| 2024-04-01 | leak | 21 |
| 2024-04-01 | burst | 5 |
| 2024-04-01 | joint failure | 6 |
| 2024-04-01 | valve leak | 2 |
| 2024-05-01 | leak | 11 |
| 2024-05-01 | burst | 8 |
| 2024-05-01 | joint failure | 3 |
| 2024-05-01 | valve leak | 2 |
| 2024-06-01 | leak | 19 |
| 2024-06-01 | burst | 12 |
| 2024-06-01 | joint failure | 10 |
| 2024-06-01 | valve leak | 3 |
| 2024-07-01 | leak | 14 |
| 2024-07-01 | burst | 14 |
| 2024-07-01 | joint failure | 6 |
| 2024-07-01 | valve leak | 2 |
| 2024-08-01 | leak | 13 |
| 2024-08-01 | burst | 14 |
| 2024-08-01 | joint failure | 3 |
| 2024-08-01 | valve leak | 2 |
| 2024-09-01 | leak | 16 |
| 2024-09-01 | burst | 11 |
| 2024-09-01 | joint failure | 5 |
| 2024-09-01 | valve leak | 1 |
| 2024-10-01 | leak | 15 |
| 2024-10-01 | burst | 11 |
| 2024-10-01 | joint failure | 6 |
| 2024-10-01 | valve leak | 0 |
| 2024-11-01 | leak | 6 |
| 2024-11-01 | burst | 5 |
| 2024-11-01 | joint failure | 3 |
| 2024-11-01 | valve leak | 0 |
| 2024-12-01 | leak | 11 |
| 2024-12-01 | burst | 1 |
| 2024-12-01 | joint failure | 1 |
| 2024-12-01 | valve leak | 1 |
| 2025-01-01 | leak | 3 |
| 2025-01-01 | burst | 4 |
| 2025-01-01 | joint failure | 2 |
| 2025-01-01 | valve leak | 0 |
| 2025-02-01 | leak | 7 |
| 2025-02-01 | burst | 5 |
| 2025-02-01 | joint failure | 2 |
| 2025-02-01 | valve leak | 3 |
| 2025-03-01 | leak | 14 |
| 2025-03-01 | burst | 5 |
| 2025-03-01 | joint failure | 6 |
| 2025-03-01 | valve leak | 1 |
| 2025-04-01 | leak | 9 |
| 2025-04-01 | burst | 6 |
| 2025-04-01 | joint failure | 5 |
| 2025-04-01 | valve leak | 2 |
| 2025-05-01 | leak | 8 |
| 2025-05-01 | burst | 11 |
| 2025-05-01 | joint failure | 8 |
| 2025-05-01 | valve leak | 0 |
| 2025-06-01 | leak | 13 |
| 2025-06-01 | burst | 7 |
| 2025-06-01 | joint failure | 6 |
| 2025-06-01 | valve leak | 3 |
| 2025-07-01 | leak | 28 |
| 2025-07-01 | burst | 4 |
| 2025-07-01 | joint failure | 4 |
| 2025-07-01 | valve leak | 3 |
| 2025-08-01 | leak | 12 |
| 2025-08-01 | burst | 6 |
| 2025-08-01 | joint failure | 8 |
| 2025-08-01 | valve leak | 3 |
| 2025-09-01 | leak | 19 |
| 2025-09-01 | burst | 10 |
| 2025-09-01 | joint failure | 7 |
| 2025-09-01 | valve leak | 1 |
| 2025-10-01 | leak | 13 |
| 2025-10-01 | burst | 13 |
| 2025-10-01 | joint failure | 6 |
| 2025-10-01 | valve leak | 2 |
| 2025-11-01 | leak | 6 |
| 2025-11-01 | burst | 6 |
| 2025-11-01 | joint failure | 2 |
| 2025-11-01 | valve leak | 2 |
| 2025-12-01 | leak | 10 |
| 2025-12-01 | burst | 4 |
| 2025-12-01 | joint failure | 3 |
| 2025-12-01 | valve leak | 3 |
| 2026-01-01 | leak | 5 |
| 2026-01-01 | burst | 2 |
| 2026-01-01 | joint failure | 2 |
| 2026-01-01 | valve leak | 4 |
| 2026-02-01 | leak | 4 |
| 2026-02-01 | burst | 3 |
| 2026-02-01 | joint failure | 1 |
| 2026-02-01 | valve leak | 1 |
| 2026-03-01 | leak | 7 |
| 2026-03-01 | burst | 7 |
| 2026-03-01 | joint failure | 2 |
| 2026-03-01 | valve leak | 4 |
| 2026-04-01 | leak | 14 |
| 2026-04-01 | burst | 12 |
| 2026-04-01 | joint failure | 2 |
| 2026-04-01 | valve leak | 2 |
| 2026-05-01 | leak | 14 |
| 2026-05-01 | burst | 9 |
| 2026-05-01 | joint failure | 4 |
| 2026-05-01 | valve leak | 1 |
| 2026-06-01 | leak | 15 |
| 2026-06-01 | burst | 11 |
| 2026-06-01 | joint failure | 14 |
| 2026-06-01 | valve leak | 4 |
| 2026-07-01 | leak | 23 |
| 2026-07-01 | burst | 20 |
| 2026-07-01 | joint failure | 8 |
| 2026-07-01 | valve leak | 1 |
| 2026-08-01 | leak | 24 |
| 2026-08-01 | burst | 14 |
| 2026-08-01 | joint failure | 12 |
| 2026-08-01 | valve leak | 4 |
| 2026-09-01 | leak | 23 |
| 2026-09-01 | burst | 9 |
| 2026-09-01 | joint failure | 7 |
| 2026-09-01 | valve leak | 2 |
Figure 47. Find point clusters: Customer complaints over time 94
| period | series | value |
|---|---|---|
| 2025-09-29 | low pressure | 4 |
| 2025-09-29 | high bill | 3 |
| 2025-09-29 | no water | 1 |
| 2025-09-29 | dirty water | 2 |
| 2025-10-06 | low pressure | 6 |
| 2025-10-06 | high bill | 3 |
| 2025-10-06 | no water | 2 |
| 2025-10-06 | dirty water | 0 |
| 2025-10-13 | low pressure | 2 |
| 2025-10-13 | high bill | 3 |
| 2025-10-13 | no water | 2 |
| 2025-10-13 | dirty water | 0 |
| 2025-10-20 | low pressure | 5 |
| 2025-10-20 | high bill | 4 |
| 2025-10-20 | no water | 2 |
| 2025-10-20 | dirty water | 1 |
| 2025-10-27 | low pressure | 0 |
| 2025-10-27 | high bill | 2 |
| 2025-10-27 | no water | 1 |
| 2025-10-27 | dirty water | 2 |
| 2025-11-03 | low pressure | 2 |
| 2025-11-03 | high bill | 1 |
| 2025-11-03 | no water | 5 |
| 2025-11-03 | dirty water | 0 |
| 2025-11-10 | low pressure | 3 |
| 2025-11-10 | high bill | 0 |
| 2025-11-10 | no water | 1 |
| 2025-11-10 | dirty water | 1 |
| 2025-11-17 | low pressure | 3 |
| 2025-11-17 | high bill | 1 |
| 2025-11-17 | no water | 1 |
| 2025-11-17 | dirty water | 1 |
| 2025-11-24 | low pressure | 2 |
| 2025-11-24 | high bill | 4 |
| 2025-11-24 | no water | 3 |
| 2025-11-24 | dirty water | 0 |
| 2025-12-01 | low pressure | 2 |
| 2025-12-01 | high bill | 1 |
| 2025-12-01 | no water | 1 |
| 2025-12-01 | dirty water | 0 |
| 2025-12-08 | low pressure | 1 |
| 2025-12-08 | high bill | 1 |
| 2025-12-08 | no water | 0 |
| 2025-12-08 | dirty water | 0 |
| 2025-12-15 | low pressure | 4 |
| 2025-12-15 | high bill | 0 |
| 2025-12-15 | no water | 2 |
| 2025-12-15 | dirty water | 0 |
| 2025-12-22 | low pressure | 3 |
| 2025-12-22 | high bill | 2 |
| 2025-12-22 | no water | 1 |
| 2025-12-22 | dirty water | 1 |
| 2025-12-29 | low pressure | 3 |
| 2025-12-29 | high bill | 1 |
| 2025-12-29 | no water | 1 |
| 2025-12-29 | dirty water | 0 |
| 2026-01-05 | low pressure | 1 |
| 2026-01-05 | high bill | 2 |
| 2026-01-05 | no water | 1 |
| 2026-01-05 | dirty water | 1 |
| 2026-01-12 | low pressure | 0 |
| 2026-01-12 | high bill | 0 |
| 2026-01-12 | no water | 0 |
| 2026-01-12 | dirty water | 2 |
| 2026-01-19 | low pressure | 4 |
| 2026-01-19 | high bill | 0 |
| 2026-01-19 | no water | 0 |
| 2026-01-19 | dirty water | 0 |
| 2026-01-26 | low pressure | 0 |
| 2026-01-26 | high bill | 2 |
| 2026-01-26 | no water | 0 |
| 2026-01-26 | dirty water | 0 |
| 2026-02-02 | low pressure | 1 |
| 2026-02-02 | high bill | 2 |
| 2026-02-02 | no water | 3 |
| 2026-02-02 | dirty water | 1 |
| 2026-02-09 | low pressure | 3 |
| 2026-02-09 | high bill | 1 |
| 2026-02-09 | no water | 3 |
| 2026-02-09 | dirty water | 1 |
| 2026-02-16 | low pressure | 1 |
| 2026-02-16 | high bill | 0 |
| 2026-02-16 | no water | 3 |
| 2026-02-16 | dirty water | 0 |
| 2026-02-23 | low pressure | 2 |
| 2026-02-23 | high bill | 3 |
| 2026-02-23 | no water | 1 |
| 2026-02-23 | dirty water | 1 |
| 2026-03-02 | low pressure | 2 |
| 2026-03-02 | high bill | 1 |
| 2026-03-02 | no water | 1 |
| 2026-03-02 | dirty water | 1 |
| 2026-03-09 | low pressure | 1 |
| 2026-03-09 | high bill | 1 |
| 2026-03-09 | no water | 2 |
| 2026-03-09 | dirty water | 0 |
| 2026-03-16 | low pressure | 2 |
| 2026-03-16 | high bill | 3 |
| 2026-03-16 | no water | 2 |
| 2026-03-16 | dirty water | 1 |
| 2026-03-23 | low pressure | 6 |
| 2026-03-23 | high bill | 2 |
| 2026-03-23 | no water | 3 |
| 2026-03-23 | dirty water | 0 |
| 2026-03-30 | low pressure | 6 |
| 2026-03-30 | high bill | 3 |
| 2026-03-30 | no water | 2 |
| 2026-03-30 | dirty water | 1 |
| 2026-04-06 | low pressure | 3 |
| 2026-04-06 | high bill | 4 |
| 2026-04-06 | no water | 3 |
| 2026-04-06 | dirty water | 0 |
| 2026-04-13 | low pressure | 5 |
| 2026-04-13 | high bill | 6 |
| 2026-04-13 | no water | 5 |
| 2026-04-13 | dirty water | 0 |
| 2026-04-20 | low pressure | 7 |
| 2026-04-20 | high bill | 4 |
| 2026-04-20 | no water | 2 |
| 2026-04-20 | dirty water | 0 |
| 2026-04-27 | low pressure | 4 |
| 2026-04-27 | high bill | 5 |
| 2026-04-27 | no water | 2 |
| 2026-04-27 | dirty water | 2 |
| 2026-05-04 | low pressure | 5 |
| 2026-05-04 | high bill | 2 |
| 2026-05-04 | no water | 3 |
| 2026-05-04 | dirty water | 2 |
| 2026-05-11 | low pressure | 1 |
| 2026-05-11 | high bill | 6 |
| 2026-05-11 | no water | 2 |
| 2026-05-11 | dirty water | 0 |
| 2026-05-18 | low pressure | 6 |
| 2026-05-18 | high bill | 5 |
| 2026-05-18 | no water | 3 |
| 2026-05-18 | dirty water | 0 |
| 2026-05-25 | low pressure | 7 |
| 2026-05-25 | high bill | 4 |
| 2026-05-25 | no water | 3 |
| 2026-05-25 | dirty water | 0 |
| 2026-06-01 | low pressure | 7 |
| 2026-06-01 | high bill | 3 |
| 2026-06-01 | no water | 5 |
| 2026-06-01 | dirty water | 2 |
| 2026-06-08 | low pressure | 6 |
| 2026-06-08 | high bill | 3 |
| 2026-06-08 | no water | 5 |
| 2026-06-08 | dirty water | 1 |
| 2026-06-15 | low pressure | 8 |
| 2026-06-15 | high bill | 6 |
| 2026-06-15 | no water | 3 |
| 2026-06-15 | dirty water | 2 |
| 2026-06-22 | low pressure | 2 |
| 2026-06-22 | high bill | 2 |
| 2026-06-22 | no water | 3 |
| 2026-06-22 | dirty water | 2 |
| 2026-06-29 | low pressure | 4 |
| 2026-06-29 | high bill | 4 |
| 2026-06-29 | no water | 3 |
| 2026-06-29 | dirty water | 4 |
| 2026-07-06 | low pressure | 6 |
| 2026-07-06 | high bill | 7 |
| 2026-07-06 | no water | 6 |
| 2026-07-06 | dirty water | 0 |
| 2026-07-13 | low pressure | 5 |
| 2026-07-13 | high bill | 4 |
| 2026-07-13 | no water | 7 |
| 2026-07-13 | dirty water | 1 |
| 2026-07-20 | low pressure | 5 |
| 2026-07-20 | high bill | 3 |
| 2026-07-20 | no water | 3 |
| 2026-07-20 | dirty water | 2 |
| 2026-07-27 | low pressure | 6 |
| 2026-07-27 | high bill | 3 |
| 2026-07-27 | no water | 3 |
| 2026-07-27 | dirty water | 2 |
| 2026-08-03 | low pressure | 4 |
| 2026-08-03 | high bill | 3 |
| 2026-08-03 | no water | 5 |
| 2026-08-03 | dirty water | 1 |
| 2026-08-10 | low pressure | 6 |
| 2026-08-10 | high bill | 3 |
| 2026-08-10 | no water | 2 |
| 2026-08-10 | dirty water | 2 |
| 2026-08-17 | low pressure | 5 |
| 2026-08-17 | high bill | 3 |
| 2026-08-17 | no water | 4 |
| 2026-08-17 | dirty water | 1 |
| 2026-08-24 | low pressure | 7 |
| 2026-08-24 | high bill | 4 |
| 2026-08-24 | no water | 3 |
| 2026-08-24 | dirty water | 3 |
| 2026-08-31 | low pressure | 7 |
| 2026-08-31 | high bill | 4 |
| 2026-08-31 | no water | 3 |
| 2026-08-31 | dirty water | 0 |
| 2026-09-07 | low pressure | 6 |
| 2026-09-07 | high bill | 2 |
| 2026-09-07 | no water | 2 |
| 2026-09-07 | dirty water | 1 |
| 2026-09-14 | low pressure | 3 |
| 2026-09-14 | high bill | 3 |
| 2026-09-14 | no water | 2 |
| 2026-09-14 | dirty water | 2 |
| 2026-09-21 | low pressure | 4 |
| 2026-09-21 | high bill | 6 |
| 2026-09-21 | no water | 2 |
| 2026-09-21 | dirty water | 0 |
| 2026-09-28 | low pressure | 1 |
| 2026-09-28 | high bill | 1 |
| 2026-09-28 | no water | 0 |
| 2026-09-28 | dirty water | 0 |
Figure 48. Find point clusters: Leak and burst repairs over time 95
| period | series | value |
|---|---|---|
| 2023-10-01 | leak | 9 |
| 2023-10-01 | burst | 5 |
| 2023-10-01 | joint failure | 4 |
| 2023-10-01 | valve leak | 2 |
| 2023-11-01 | leak | 9 |
| 2023-11-01 | burst | 5 |
| 2023-11-01 | joint failure | 0 |
| 2023-11-01 | valve leak | 0 |
| 2023-12-01 | leak | 7 |
| 2023-12-01 | burst | 5 |
| 2023-12-01 | joint failure | 1 |
| 2023-12-01 | valve leak | 4 |
| 2024-01-01 | leak | 9 |
| 2024-01-01 | burst | 0 |
| 2024-01-01 | joint failure | 1 |
| 2024-01-01 | valve leak | 0 |
| 2024-02-01 | leak | 8 |
| 2024-02-01 | burst | 2 |
| 2024-02-01 | joint failure | 2 |
| 2024-02-01 | valve leak | 1 |
| 2024-03-01 | leak | 8 |
| 2024-03-01 | burst | 7 |
| 2024-03-01 | joint failure | 1 |
| 2024-03-01 | valve leak | 1 |
| 2024-04-01 | leak | 21 |
| 2024-04-01 | burst | 5 |
| 2024-04-01 | joint failure | 6 |
| 2024-04-01 | valve leak | 2 |
| 2024-05-01 | leak | 11 |
| 2024-05-01 | burst | 8 |
| 2024-05-01 | joint failure | 3 |
| 2024-05-01 | valve leak | 2 |
| 2024-06-01 | leak | 19 |
| 2024-06-01 | burst | 12 |
| 2024-06-01 | joint failure | 10 |
| 2024-06-01 | valve leak | 3 |
| 2024-07-01 | leak | 14 |
| 2024-07-01 | burst | 14 |
| 2024-07-01 | joint failure | 6 |
| 2024-07-01 | valve leak | 2 |
| 2024-08-01 | leak | 13 |
| 2024-08-01 | burst | 14 |
| 2024-08-01 | joint failure | 3 |
| 2024-08-01 | valve leak | 2 |
| 2024-09-01 | leak | 16 |
| 2024-09-01 | burst | 11 |
| 2024-09-01 | joint failure | 5 |
| 2024-09-01 | valve leak | 1 |
| 2024-10-01 | leak | 15 |
| 2024-10-01 | burst | 11 |
| 2024-10-01 | joint failure | 6 |
| 2024-10-01 | valve leak | 0 |
| 2024-11-01 | leak | 6 |
| 2024-11-01 | burst | 5 |
| 2024-11-01 | joint failure | 3 |
| 2024-11-01 | valve leak | 0 |
| 2024-12-01 | leak | 11 |
| 2024-12-01 | burst | 1 |
| 2024-12-01 | joint failure | 1 |
| 2024-12-01 | valve leak | 1 |
| 2025-01-01 | leak | 3 |
| 2025-01-01 | burst | 4 |
| 2025-01-01 | joint failure | 2 |
| 2025-01-01 | valve leak | 0 |
| 2025-02-01 | leak | 7 |
| 2025-02-01 | burst | 5 |
| 2025-02-01 | joint failure | 2 |
| 2025-02-01 | valve leak | 3 |
| 2025-03-01 | leak | 14 |
| 2025-03-01 | burst | 5 |
| 2025-03-01 | joint failure | 6 |
| 2025-03-01 | valve leak | 1 |
| 2025-04-01 | leak | 9 |
| 2025-04-01 | burst | 6 |
| 2025-04-01 | joint failure | 5 |
| 2025-04-01 | valve leak | 2 |
| 2025-05-01 | leak | 8 |
| 2025-05-01 | burst | 11 |
| 2025-05-01 | joint failure | 8 |
| 2025-05-01 | valve leak | 0 |
| 2025-06-01 | leak | 13 |
| 2025-06-01 | burst | 7 |
| 2025-06-01 | joint failure | 6 |
| 2025-06-01 | valve leak | 3 |
| 2025-07-01 | leak | 28 |
| 2025-07-01 | burst | 4 |
| 2025-07-01 | joint failure | 4 |
| 2025-07-01 | valve leak | 3 |
| 2025-08-01 | leak | 12 |
| 2025-08-01 | burst | 6 |
| 2025-08-01 | joint failure | 8 |
| 2025-08-01 | valve leak | 3 |
| 2025-09-01 | leak | 19 |
| 2025-09-01 | burst | 10 |
| 2025-09-01 | joint failure | 7 |
| 2025-09-01 | valve leak | 1 |
| 2025-10-01 | leak | 13 |
| 2025-10-01 | burst | 13 |
| 2025-10-01 | joint failure | 6 |
| 2025-10-01 | valve leak | 2 |
| 2025-11-01 | leak | 6 |
| 2025-11-01 | burst | 6 |
| 2025-11-01 | joint failure | 2 |
| 2025-11-01 | valve leak | 2 |
| 2025-12-01 | leak | 10 |
| 2025-12-01 | burst | 4 |
| 2025-12-01 | joint failure | 3 |
| 2025-12-01 | valve leak | 3 |
| 2026-01-01 | leak | 5 |
| 2026-01-01 | burst | 2 |
| 2026-01-01 | joint failure | 2 |
| 2026-01-01 | valve leak | 4 |
| 2026-02-01 | leak | 4 |
| 2026-02-01 | burst | 3 |
| 2026-02-01 | joint failure | 1 |
| 2026-02-01 | valve leak | 1 |
| 2026-03-01 | leak | 7 |
| 2026-03-01 | burst | 7 |
| 2026-03-01 | joint failure | 2 |
| 2026-03-01 | valve leak | 4 |
| 2026-04-01 | leak | 14 |
| 2026-04-01 | burst | 12 |
| 2026-04-01 | joint failure | 2 |
| 2026-04-01 | valve leak | 2 |
| 2026-05-01 | leak | 14 |
| 2026-05-01 | burst | 9 |
| 2026-05-01 | joint failure | 4 |
| 2026-05-01 | valve leak | 1 |
| 2026-06-01 | leak | 15 |
| 2026-06-01 | burst | 11 |
| 2026-06-01 | joint failure | 14 |
| 2026-06-01 | valve leak | 4 |
| 2026-07-01 | leak | 23 |
| 2026-07-01 | burst | 20 |
| 2026-07-01 | joint failure | 8 |
| 2026-07-01 | valve leak | 1 |
| 2026-08-01 | leak | 24 |
| 2026-08-01 | burst | 14 |
| 2026-08-01 | joint failure | 12 |
| 2026-08-01 | valve leak | 4 |
| 2026-09-01 | leak | 23 |
| 2026-09-01 | burst | 9 |
| 2026-09-01 | joint failure | 7 |
| 2026-09-01 | valve leak | 2 |
GeoBit Large Spatial Model. Findings are labeled Evidenced (computed by a tool), Inferred (a reading or reasoning) or Unverified (no evidence yet).