Sample: Ports and maritime operations, Rotterdam: report
Project: Sample: Ports and maritime operations, Rotterdam
Goal: Describe the project Sample: Ports and maritime operations, Rotterdam: run the analyses that tell the most about its data, draw every result, and write a cited report.
Run: cad465dd-123d-4ad9-bf15-16d738364e59 (running, 11 agent run(s))
Generated: 2026-10-18T05:44:00Z, version 1
Model cost: USD 0.0000 over 0 model call(s)
Data used
| Data | Kind | Rows | Time span | Summary | Source |
|---|---|---|---|---|---|
| Berths | vector, LineString | 14 | 14 line features; 'depth_m' 11 to 18.5 (mean 15.24); 'length_m' 425 to 500 (mean 457.1); 'cranes' 2 to 6 (mean 4.714); named by 'name' (e.g. Berth 01 North quay, Berth 02 North quay, Berth 03 North quay); total length 6.402 km; extent 4.3883,51.8767 to 4.4506,51.8951. Lines (Berths) such as routes or networks. | 97 | |
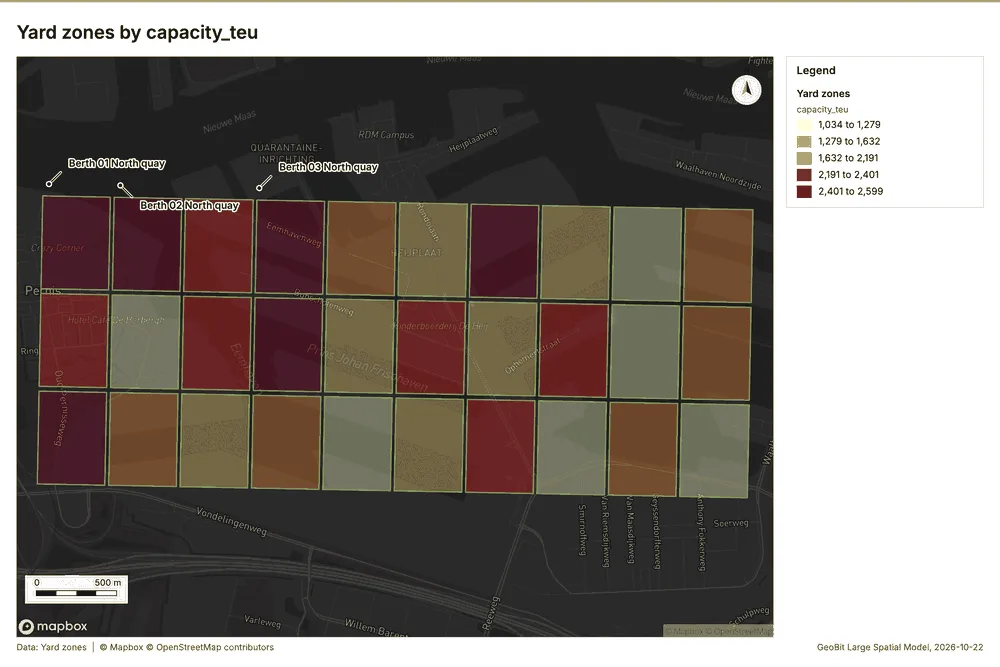
| Yard zones | vector, Polygon | 30 | 30 polygon (area) features; 'kind' has 4 values (top: import/export stack 24, empties 3, reefer 2); 'capacity_teu' 1,034 to 2,599 (mean 1869); 'utilization_pct' 55.3 to 98 (mean 78.84); total area 7.459 km2; extent 4.3872,51.8774 to 4.4527,51.8944. Areas (Yard zones) with capacity_teu to compare and map. | 98 | |
| Gates | vector, Point | 4 | 4 point features; 'ocr' has 2 values (top: True 3, False 1); 'lanes' 5 to 12 (mean 7.75); named by 'name' (e.g. Gate A, Gate B, Gate C); extent 4.3864,51.8708 to 4.4195,51.8917. Point locations of Gates by ocr. | 99 | |
| Truck gate transactions | vector, Point | 2,000 | 2026-08-31 to 2026-09-27 | 2,000 point features; dated by 'gate_in_at' from 2026-08-31 to 2026-09-27; 'move' has 3 values (top: drop-off 687, pick-up 666, dual 647); 'container' has 4 values (top: 20 ft 534, 40 ft high cube 531, reefer 40 ft 502); 'turn_time_min' 11 to 133 (mean 34.09); extent 4.3875,51.8776 to 4.4525,51.8944. Dated point events by move: where and when Truck gate transactions happen. | 2 |
| Cranes | vector, Point | 40 | 40 point features; 'type' has 2 values (top: ship to shore 28, yard gantry 12); 'moves_per_hour' 14.2 to 35.9 (mean 26.82); extent 4.3901,51.8770 to 4.4484,51.8949. Point locations of Cranes by type. | 100 | |
| Reefer points | vector, Point | 100 | 100 point features; 'in_use' has 2 values (top: True 86, False 14); 'alarm' has 2 values (top: False 98, True 2); extent 4.4398,51.8829 to 4.4525,51.8881. Point locations of Reefer points by in_use. | 101 | |
| Terminal roads | vector, LineString | 10 | 10 line features; 'one_way' has 2 values (top: False 5, True 5); 'speed_kmh' 30 to 30 (mean 30); total length 29.05 km; extent 4.3870,51.8773 to 4.4529,51.8946. Lines (Terminal roads) such as routes or networks. | 102 | |
| Equipment faults | vector, Point | 260 | 2026-06-01 to 2026-09-30 | 260 point features; dated by 'date' from 2026-06-01 to 2026-09-30; 'system' has 4 values (top: hoist 74, electrical 68, spreader 61); 'downtime_h' 0.4 to 14 (mean 3.164); extent 4.3901,51.8770 to 4.4484,51.8949. Dated point events by system: where and when Equipment faults happen. | 3 |
| Berth calls | table | 360 | 2026-04-01 to 2026-09-30 | Table of 360 rows and 7 columns without geometry; dated by 'arrival_date' from 2026-04-01 to 2026-09-30; 'moves' 232 to 4,435 (mean 1125); 'crane_hours' 7.9 to 147.4 (mean 39.05); 'berth_hours' 2.5 to 57.7 (mean 12.75). A table of Berth calls without locations. | 4 |
| Yard inventory by day | table | 840 | 2026-08-31 to 2026-09-27 | Table of 840 rows and 4 columns without geometry; dated by 'date' from 2026-08-31 to 2026-09-27; 'teu_on_hand' 733 to 2,530 (mean 1337); 'avg_dwell_days' 3 to 8.4 (mean 4.57). A table of Yard inventory by day without locations. | 5 |
| Terminal performance report | document | 1-page md document 'Terminal performance report, September 2026'; language en; mentions 5 place(s): Berth 01 North quay (1), Berth 08 North quay (1), Berth (1), Y207 on Monday (1), Gate C (1). A document about Berth 01 North quay, Berth 08 North quay, Berth. | 103 | ||
| Sample: Ports and maritime operations, Rotterdam | record | 104 | |||
| Emerging hot spots: Equipment faults | layer, Polygon | 22 | 105 | ||
| Emerging hot spots: Truck gate transactions | layer, Polygon | 111 | 106 | ||
| Repeat and near repeat classification: Equipment faults | layer, Point | 260 | 107 | ||
| Summarize within: Yard zones | layer, Polygon | 30 | 108 | ||
| Summarize within: Yard zones | layer, Polygon | 30 | 109 | ||
| Summarize within: Yard zones | layer, Polygon | 30 | 110 | ||
| Hot spot analysis: Equipment faults | layer, Polygon | 41 | 111 | ||
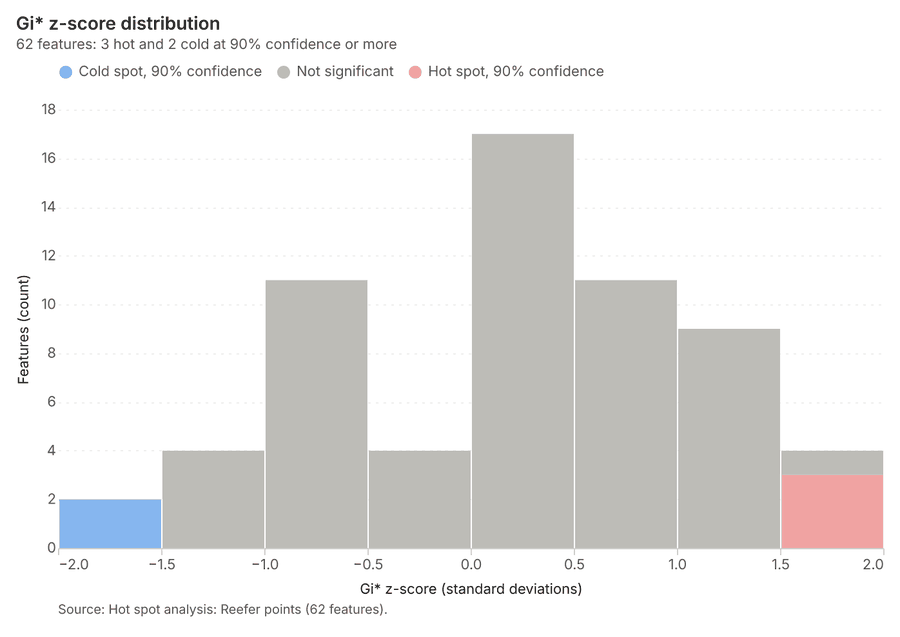
| Hot spot analysis: Reefer points | layer, Polygon | 62 | 112 | ||
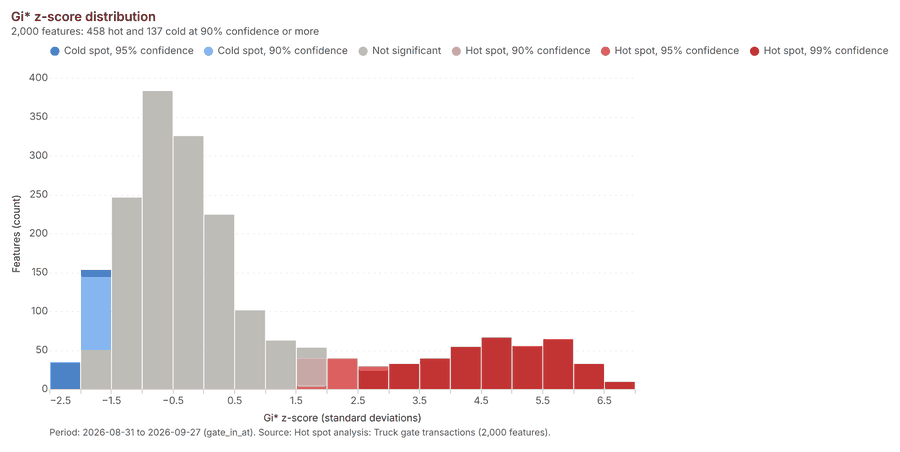
| Hot spot analysis: Truck gate transactions | layer, Point | 2,000 | 113 | ||
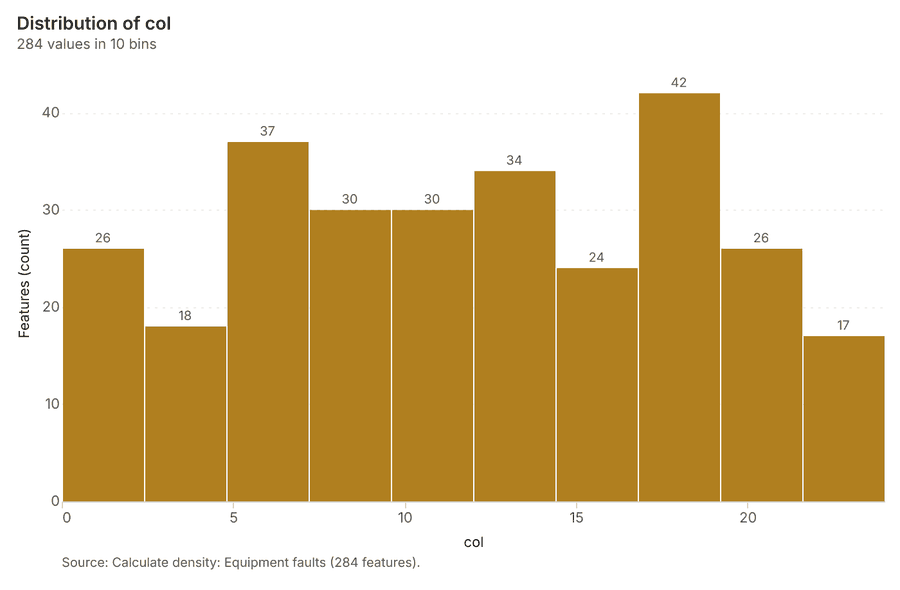
| Calculate density: Equipment faults | layer, Polygon | 284 | 114 | ||
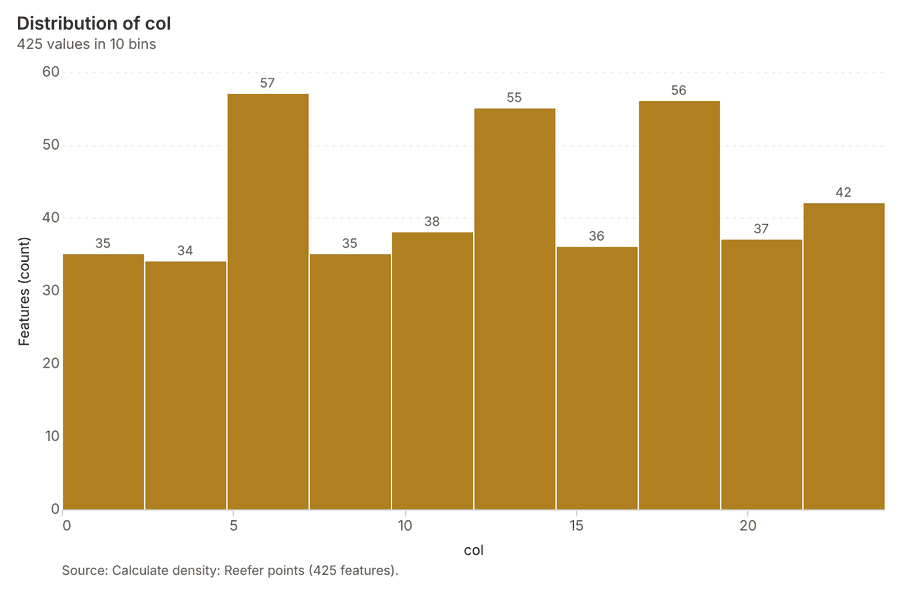
| Calculate density: Reefer points | layer, Polygon | 425 | 115 | ||
| Calculate density: Truck gate transactions | layer, Polygon | 4,119 | 116 | ||
| Find point clusters: Equipment faults | layer, Point | 260 | 117 | ||
| Find point clusters: cluster hulls | layer, Polygon | 21 | 118 | ||
| Find point clusters: Reefer points | layer, Point | 100 | 119 | ||
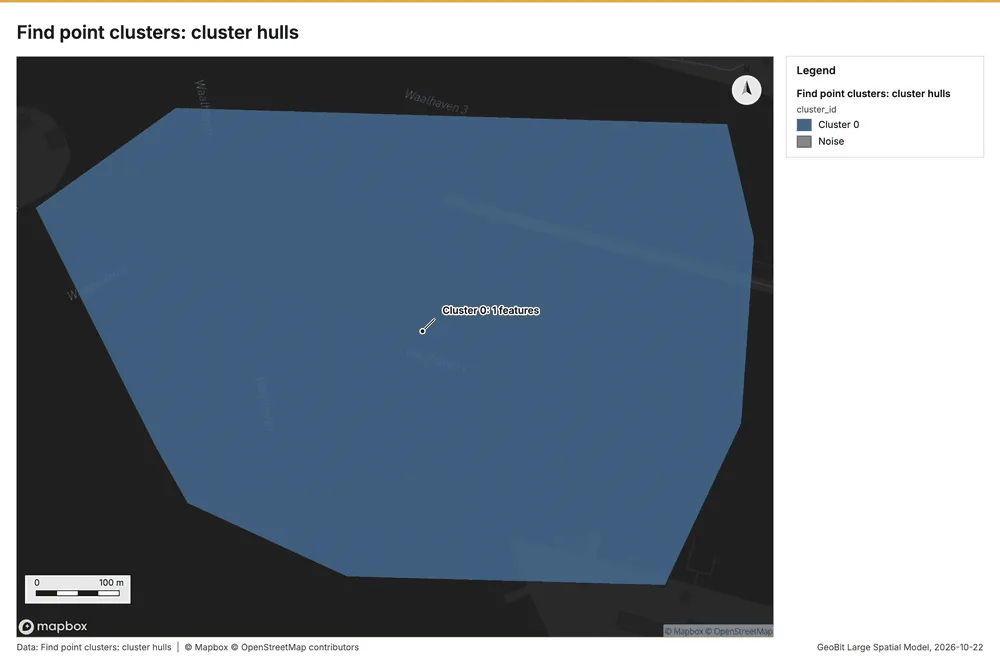
| Find point clusters: cluster hulls | layer, Polygon | 1 | 120 | ||
| Find point clusters: Truck gate transactions | layer, Point | 2,000 | 121 | ||
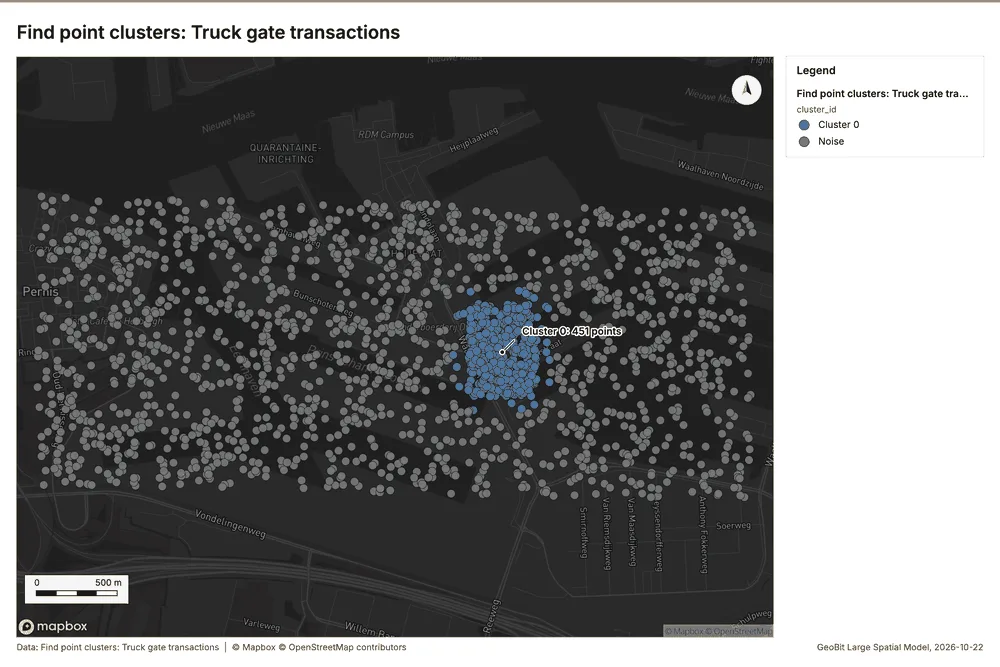
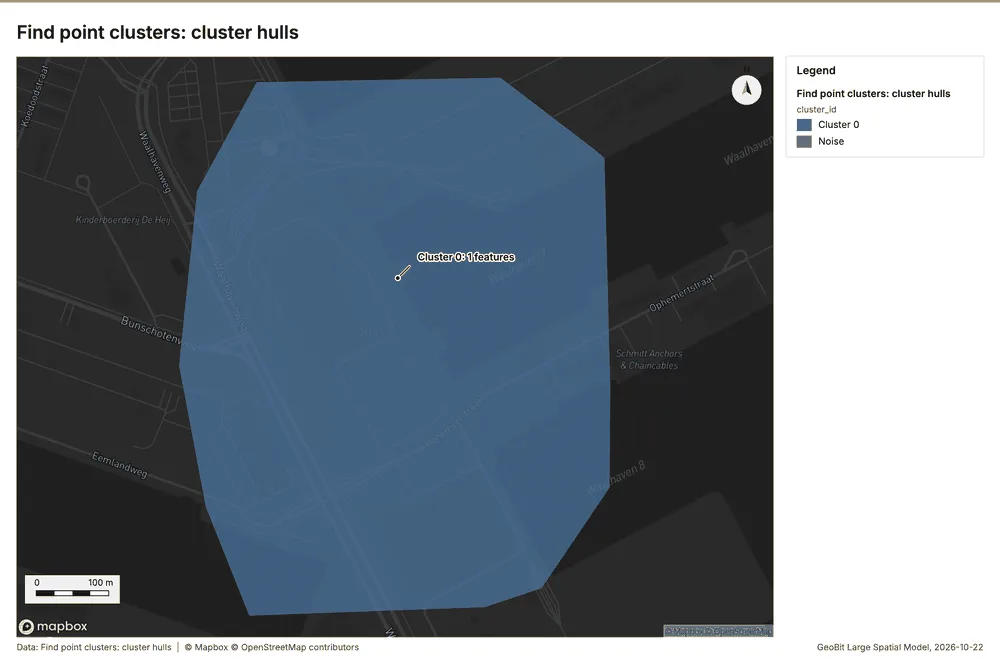
| Find point clusters: cluster hulls | layer, Polygon | 1 | 122 | ||
| Find outliers: Yard zones | layer, Polygon | 30 | 123 | ||
| Terminal performance report, September 2026 | document | 124 |
Timeline
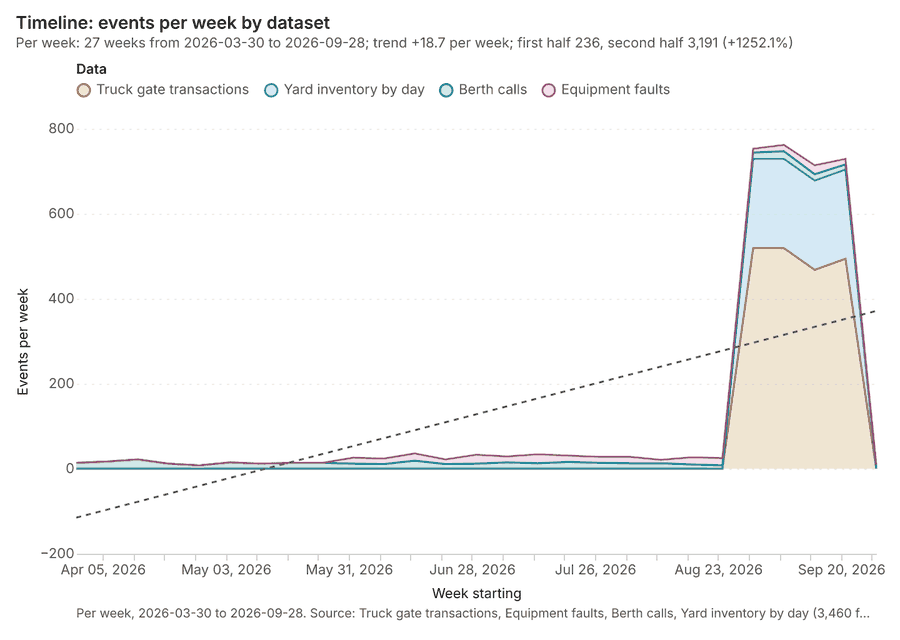
The timeline counts 3,460 dated events in Truck gate transactions, Equipment faults, Berth calls and 1 more per week, from week of 2026-03-30 to week of 2026-09-28 12345. By dataset: Truck gate transactions 2,000; Yard inventory by day 840; Berth calls 360; Equipment faults 260 1. The trend is +18.7 events per week; the second half of the weeks has 3,191 against 236 in the first (+1252.1%) 1.
Busiest weeks
Quietest weeks
Space time hot spots
What this analysis is. Emerging hot spots: Where hot spots are new, consecutive, intensifying, persistent, diminishing, sporadic, oscillating or historical over time 6. In ArcGIS it is Emerging Hot Spot Analysis or Create Space Time Cube 6.
Why it was run on this data. Equipment faults carry dates in 'date': emerging hot spot analysis finds new, intensifying and fading hot spots per week 7.
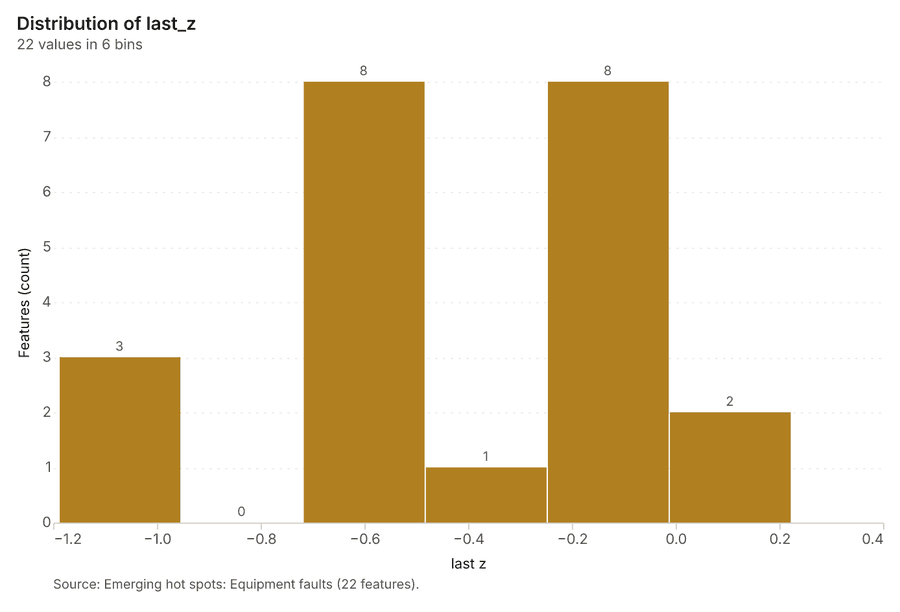
What it found. The gp_space_time_hot_spots tool was executed using the Equipment faults data 9. The analysis generated a result containing 22 features 8.
| Result | Value |
|---|---|
| result, count | 22 |
| result, elapsed ms | 4 |
| result, resolution | 8 |
| result, features used | 260 |
| result, time neighbors | 0 |
| billing, cost | 0.113 |
| billing, list price | 0.113 |
| billing, upstream cost | 0 |
Findings
- Evidenced: Space time hot spots on Equipment faults: Emerging hot spots: 1 layer saved: Emerging hot spots: Equipment faults (22 features) 89.
- Evidenced: It reported result, count 22; result, elapsed ms 4; result, resolution 8; result, features used 260; result, time neighbors 0; billing, cost 0.113 8.
Tool gp_space_time_hot_spots; parameters {"project": "20fafc67-4c16-4f65-b17e-a469aa483b5a", "features": {"layer": "Equipment faults (790b76cb)"}, "interval": "week", "bin_shape": "h3", "resolution": 8, "time_field": "date"}
Space time hot spots
What this analysis is. Emerging hot spots: Where hot spots are new, consecutive, intensifying, persistent, diminishing, sporadic, oscillating or historical over time 6. In ArcGIS it is Emerging Hot Spot Analysis or Create Space Time Cube 6.
Why it was run on this data. Truck gate transactions carry dates in 'gate_in_at': emerging hot spot analysis finds new, intensifying and fading hot spots per day 10.
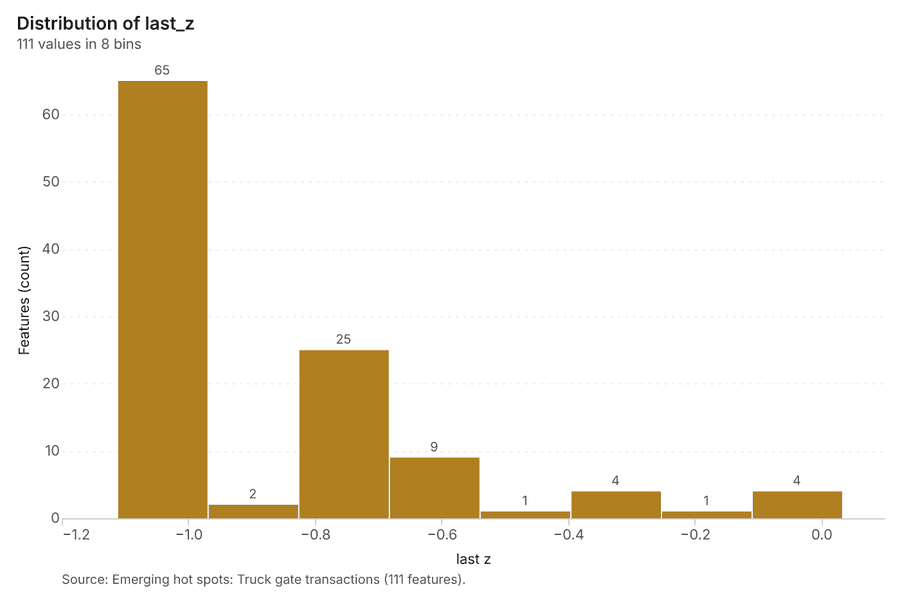
What it found. The analysis utilized the gp_space_time_hot_spots tool on the Truck gate transactions data 12, successfully saving a layer titled "Emerging hot spots: Truck gate transactions
| Result | Value |
|---|---|
| result, count | 111 |
| result, elapsed ms | 21 |
| result, resolution | 9 |
| result, features used | 2,000 |
| result, time neighbors | 0 |
| billing, cost | 0.2 |
| billing, list price | 0.2 |
| billing, upstream cost | 0 |
Findings
- Evidenced: Space time hot spots on Truck gate transactions: Emerging hot spots: 1 layer saved: Emerging hot spots: Truck gate transactions (111 features) 1112.
- Evidenced: It reported result, count 111; result, elapsed ms 21; result, resolution 9; result, features used 2,000; result, time neighbors 0; billing, cost 0.2 11.
Tool gp_space_time_hot_spots; parameters {"agg": "sum", "project": "20fafc67-4c16-4f65-b17e-a469aa483b5a", "features": {"layer": "Truck gate transactions (b9f2750d)"}, "interval": "day", "bin_shape": "h3", "resolution": 9, "time_field": "gate_in_at", "value_field": "turn_time_min"}
Near repeat
What this analysis is. Repeat and near repeat classification: Classify incidents as originators, repeats (same place) or near repeats within a distance and time window, with a Knox test table 13. In ArcGIS it is Repeat and Near Repeat Classification or Near Repeat Calculator 13.
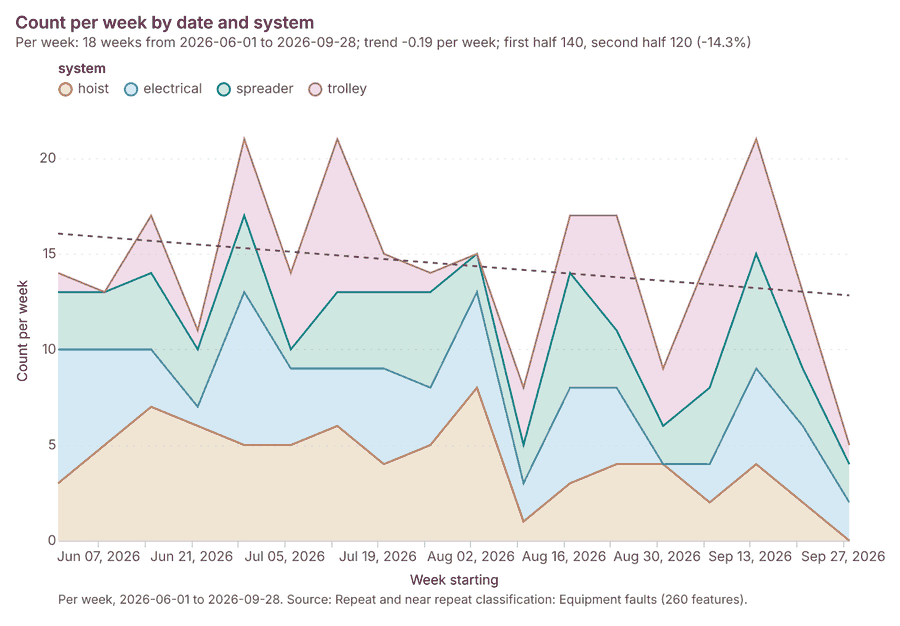
Why it was run on this data. Near repeat analysis tests whether Equipment faults close in space also follow each other within 12 days 14.
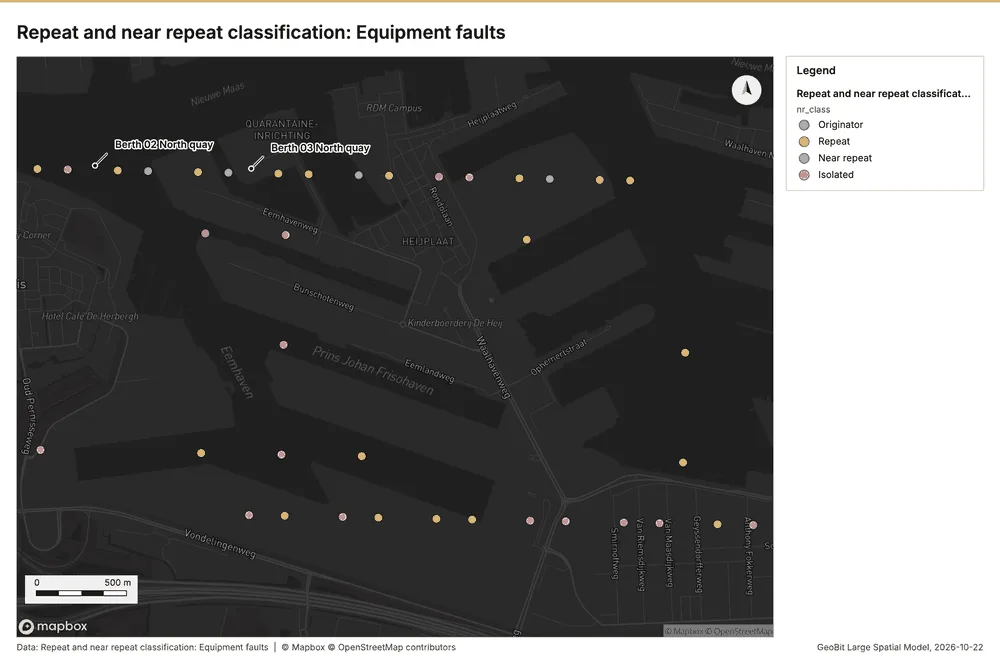
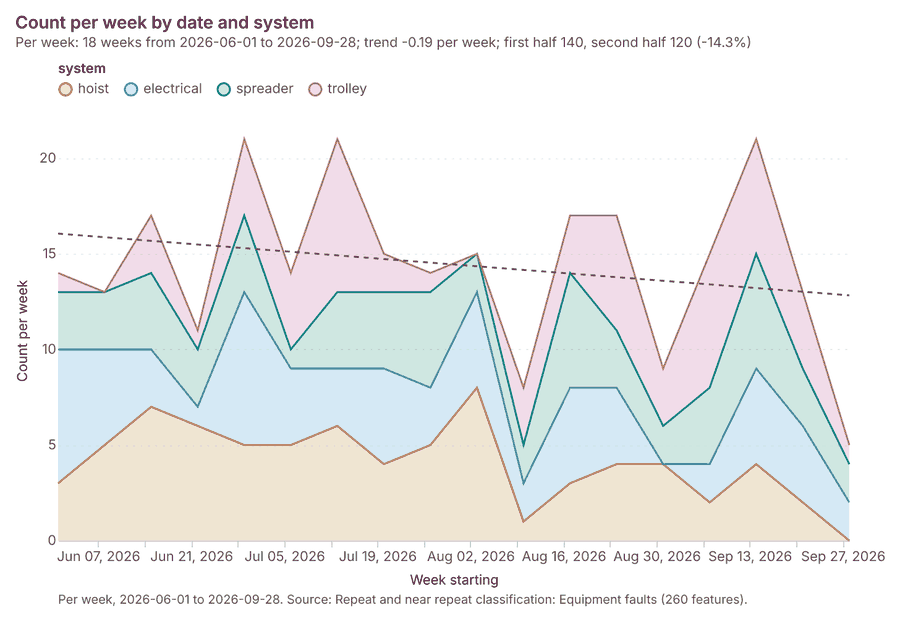
What it found. Near repeat on Equipment faults: Repeat and near repeat classification: 1 layer saved: Repeat and near repeat classification: Equipment faults (260 features) 915. It reported result, days 12; result, count 260; result, chains 51; result, distance m 200; result, elapsed ms 9; result, pairs linked 276 15.
| Result | Value |
|---|---|
| result, days | 12 |
| result, count | 260 |
| result, chains | 51 |
| result, distance m | 200 |
| result, elapsed ms | 9 |
| result, pairs linked | 276 |
| billing, cost | 0.0578 |
| billing, list price | 0.0578 |
| billing, upstream cost | 0 |
Findings
- Evidenced: Near repeat on Equipment faults: Repeat and near repeat classification: 1 layer saved: Repeat and near repeat classification: Equipment faults (260 features) 915.
- Evidenced: It reported result, days 12; result, count 260; result, chains 51; result, distance m 200; result, elapsed ms 9; result, pairs linked 276 15.
Tool gp_near_repeat; parameters {"days": 12, "project": "20fafc67-4c16-4f65-b17e-a469aa483b5a", "features": {"layer": "Equipment faults (790b76cb)"}, "distance_m": 200.0, "time_field": "date"}
Summarize within
What this analysis is. Summarize within: Count and aggregate the features inside each polygon (or bin), proportionally for lines and polygons 16. In ArcGIS it is Summarize Within or Aggregate Points; in QGIS, native:countpointsinpolygon or native:sumlinelengths 16.
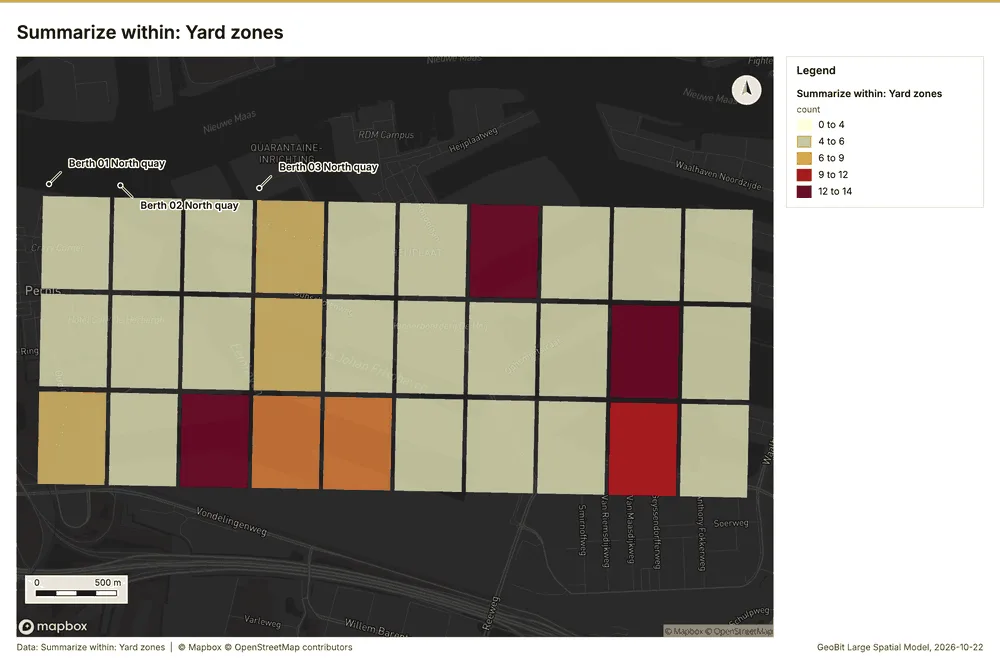
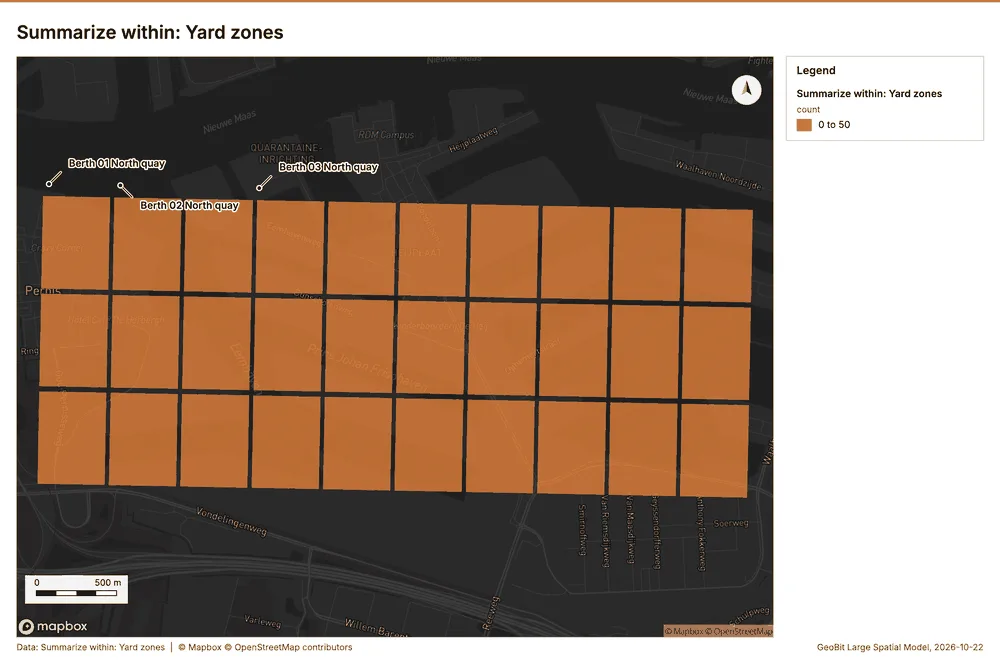
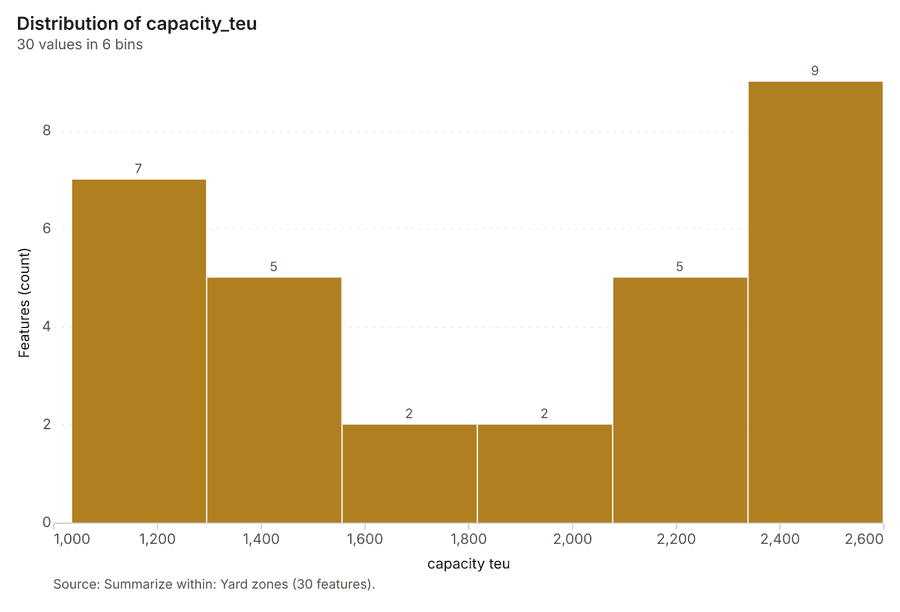
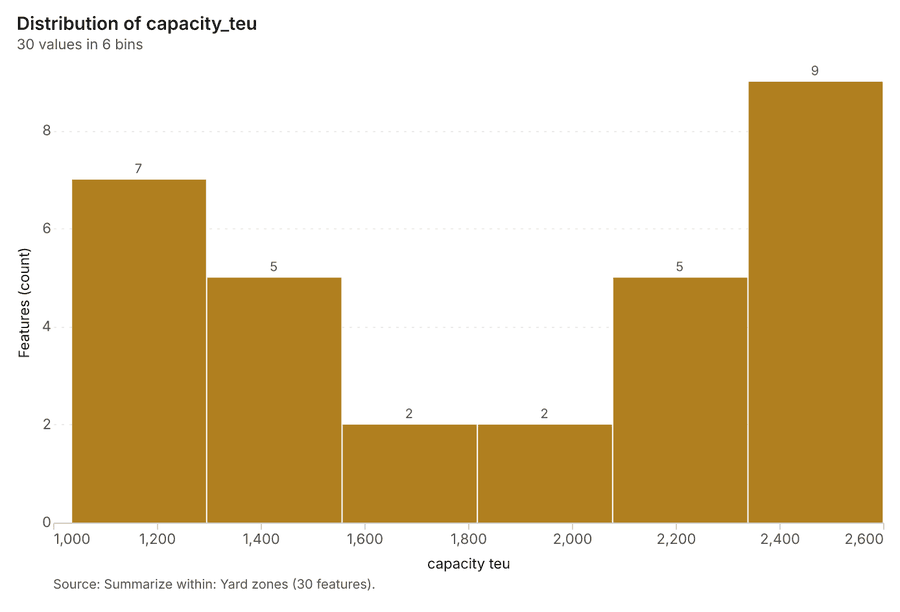
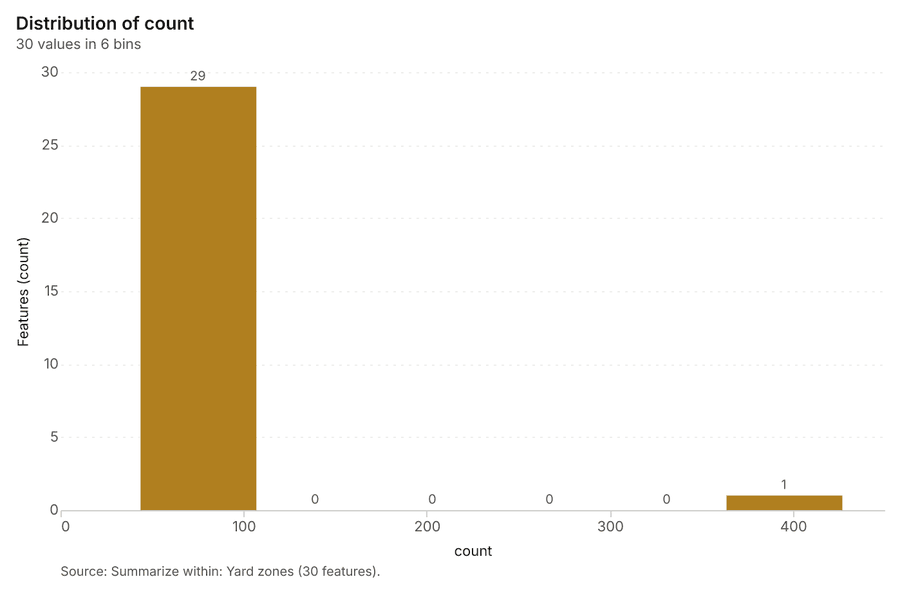
Why it was run on this data. Count Equipment faults inside each feature of Yard zones by system; the counts map as a choropleth (natural breaks, sequential colors) 17.
What it found. Summarize within on Equipment faults, Yard zones: Summarize within: 1 layer saved: Summarize within: Yard zones (30 features) 91819. It reported result, count 30; result, elapsed ms 1; billing, cost 0.01582; billing, list price 0.01582; billing, upstream cost 0 18.
| Result | Value |
|---|---|
| result, count | 30 |
| result, elapsed ms | 1 |
| billing, cost | 0.01582 |
| billing, list price | 0.01582 |
| billing, upstream cost | 0 |
Findings
- Evidenced: Summarize within on Equipment faults, Yard zones: Summarize within: 1 layer saved: Summarize within: Yard zones (30 features) 91819.
- Evidenced: It reported result, count 30; result, elapsed ms 1; billing, cost 0.01582; billing, list price 0.01582; billing, upstream cost 0 18.
Tool gp_summarize_within; parameters {"stats": [{"stat": "sum", "field": "downtime_h"}], "project": "20fafc67-4c16-4f65-b17e-a469aa483b5a", "features": {"layer": "Equipment faults (790b76cb)"}, "group_by": "system", "polygons": {"layer": "Yard zones (0b9931a6)"}}
Summarize within
What this analysis is. Summarize within: Count and aggregate the features inside each polygon (or bin), proportionally for lines and polygons 16. In ArcGIS it is Summarize Within or Aggregate Points; in QGIS, native:countpointsinpolygon or native:sumlinelengths 16.
Why it was run on this data. Count Equipment faults inside each feature of Yard zones by system; the counts map as a choropleth (natural breaks, sequential colors) 17.
What it found. Summarize within on Reefer points, Yard zones: Summarize within: 1 layer saved: Summarize within: Yard zones (30 features) 192021. It reported result, count 30; result, elapsed ms 1; billing, cost 0.0126; billing, list price 0.0126; billing, upstream cost 0 20.
| Result | Value |
|---|---|
| result, count | 30 |
| result, elapsed ms | 1 |
| billing, cost | 0.0126 |
| billing, list price | 0.0126 |
| billing, upstream cost | 0 |
Findings
- Evidenced: Summarize within on Reefer points, Yard zones: Summarize within: 1 layer saved: Summarize within: Yard zones (30 features) 192021.
- Evidenced: It reported result, count 30; result, elapsed ms 1; billing, cost 0.0126; billing, list price 0.0126; billing, upstream cost 0 20.
Tool gp_summarize_within; parameters {"stats": [], "project": "20fafc67-4c16-4f65-b17e-a469aa483b5a", "features": {"layer": "Reefer points (73835122)"}, "group_by": "in_use", "polygons": {"layer": "Yard zones (0b9931a6)"}}
Summarize within
What this analysis is. Summarize within: Count and aggregate the features inside each polygon (or bin), proportionally for lines and polygons 16. In ArcGIS it is Summarize Within or Aggregate Points; in QGIS, native:countpointsinpolygon or native:sumlinelengths 16.
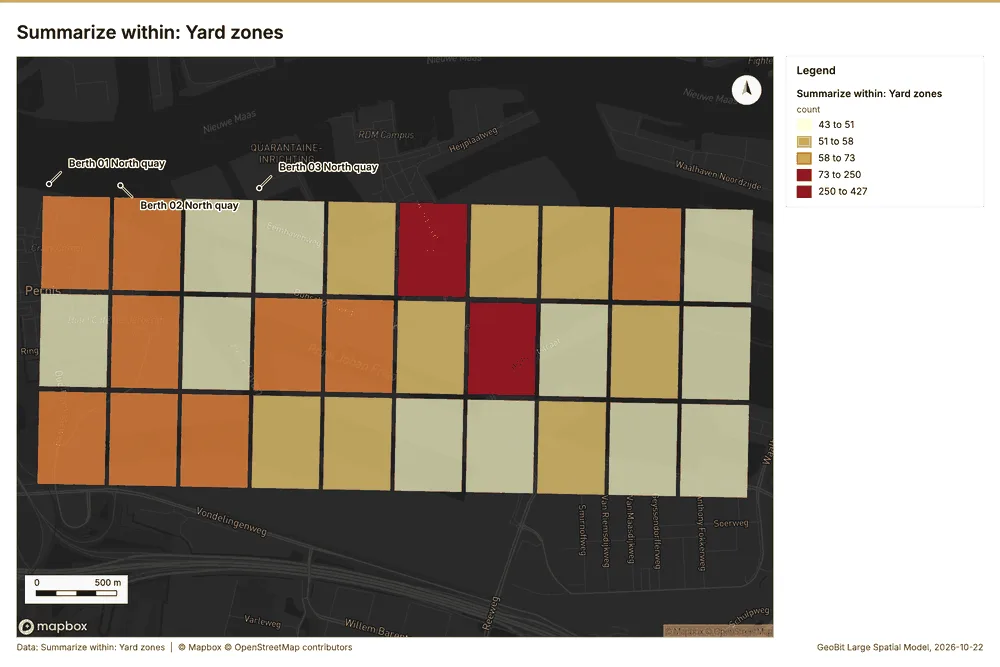
Why it was run on this data. Count Equipment faults inside each feature of Yard zones by system; the counts map as a choropleth (natural breaks, sequential colors) 17.
What it found. Summarize within on Truck gate transactions, Yard zones: Summarize within: 1 layer saved: Summarize within: Yard zones (30 features) 121922. It reported result, count 30; result, elapsed ms 4; billing, cost 0.05062; billing, list price 0.05062; billing, upstream cost 0 22.
| Result | Value |
|---|---|
| result, count | 30 |
| result, elapsed ms | 4 |
| billing, cost | 0.05062 |
| billing, list price | 0.05062 |
| billing, upstream cost | 0 |
Findings
- Evidenced: Summarize within on Truck gate transactions, Yard zones: Summarize within: 1 layer saved: Summarize within: Yard zones (30 features) 121922.
- Evidenced: It reported result, count 30; result, elapsed ms 4; billing, cost 0.05062; billing, list price 0.05062; billing, upstream cost 0 22.
Tool gp_summarize_within; parameters {"stats": [{"stat": "sum", "field": "turn_time_min"}], "project": "20fafc67-4c16-4f65-b17e-a469aa483b5a", "features": {"layer": "Truck gate transactions (b9f2750d)"}, "group_by": "move", "polygons": {"layer": "Yard zones (0b9931a6)"}}
Hot spots
What this analysis is. Hot spot analysis: Getis-Ord Gi* hot and cold spots with z-scores, p-values and confidence bins 23. In ArcGIS it is Find Hot Spots or Hot Spot Analysis (Getis-Ord Gi*); in QGIS, qgis:hotspot (plugin) 23.
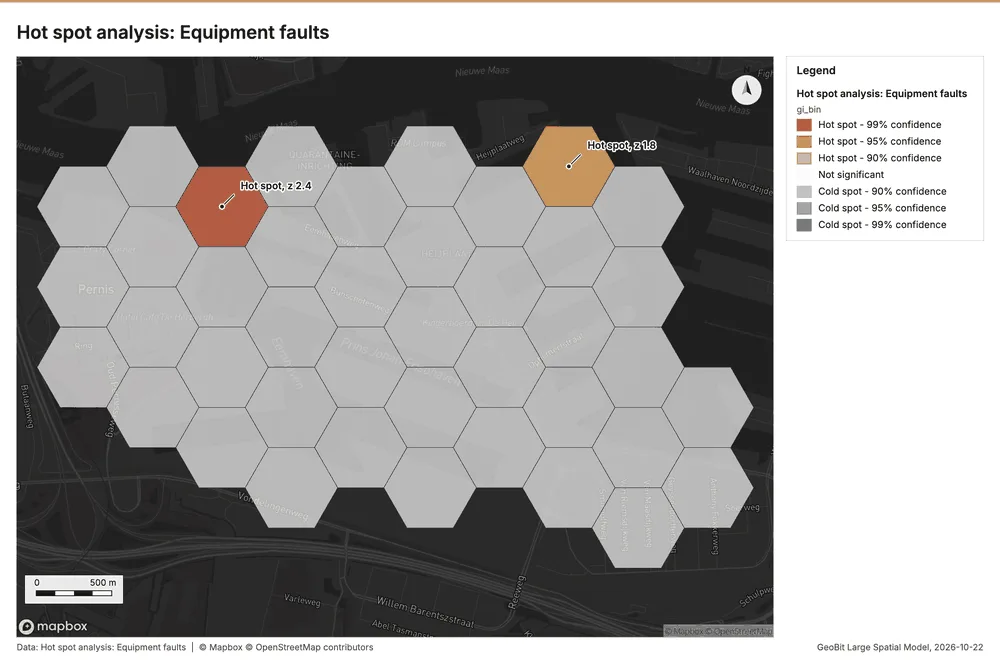
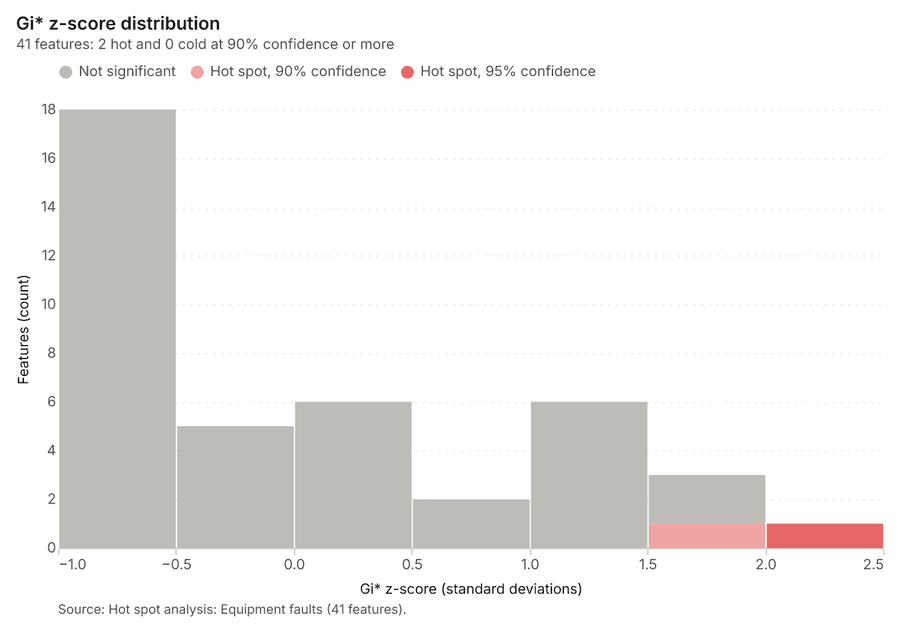
Why it was run on this data. 260 points: Getis-Ord Gi* tests whether the concentrations in Equipment faults are statistically significant 24.
What it found. Hot spot analysis was performed using the Equipment faults layer 9, resulting in 41 features saved 25.
| Result | Value |
|---|---|
| result, bins | 41 |
| result, count | 41 |
| result, elapsed ms | 5 |
| result, cell size m | 500 |
| result, incidents used | 260 |
| result, distance band m | 500 |
| billing, cost | 0.0552 |
| billing, list price | 0.0552 |
| billing, upstream cost | 0 |
Findings
- Evidenced: Hot spots on Equipment faults: Hot spot analysis: 1 layer saved: Hot spot analysis: Equipment faults (41 features) 925.
- Evidenced: It reported result, bins 41; result, count 41; result, elapsed ms 5; result, cell size m 500; result, incidents used 260; result, distance band m 500 25.
Tool gp_hot_spots; parameters {"project": "20fafc67-4c16-4f65-b17e-a469aa483b5a", "features": {"layer": "Equipment faults (790b76cb)"}, "aggregation": "hexagon", "cell_size_m": 500.0, "distance_band_m": 500.0}
Hot spots
What this analysis is. Hot spot analysis: Getis-Ord Gi* hot and cold spots with z-scores, p-values and confidence bins 23. In ArcGIS it is Find Hot Spots or Hot Spot Analysis (Getis-Ord Gi*); in QGIS, qgis:hotspot (plugin) 23.
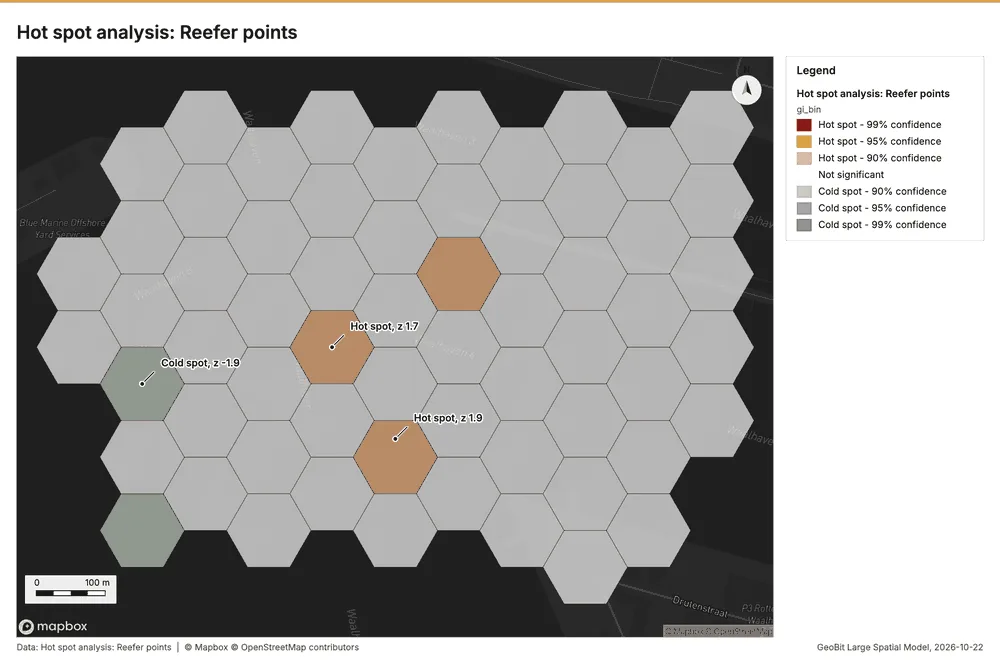
Why it was run on this data. 100 points: Getis-Ord Gi* tests whether the concentrations in Reefer points are statistically significant 26.
What it found. Hot spots on Reefer points: Hot spot analysis: 1 layer saved: Hot spot analysis: Reefer points (62 features) 2127. It reported result, bins 62; result, count 62; result, elapsed ms 4; result, cell size m 100; result, incidents used 100; result, distance band m 200 27.
| Result | Value |
|---|---|
| result, bins | 62 |
| result, count | 62 |
| result, elapsed ms | 4 |
| result, cell size m | 100 |
| result, incidents used | 100 |
| result, distance band m | 200 |
| billing, cost | 0.052 |
| billing, list price | 0.052 |
| billing, upstream cost | 0 |
Findings
- Evidenced: Hot spots on Reefer points: Hot spot analysis: 1 layer saved: Hot spot analysis: Reefer points (62 features) 2127.
- Evidenced: It reported result, bins 62; result, count 62; result, elapsed ms 4; result, cell size m 100; result, incidents used 100; result, distance band m 200 27.
Tool gp_hot_spots; parameters {"project": "20fafc67-4c16-4f65-b17e-a469aa483b5a", "features": {"layer": "Reefer points (73835122)"}, "aggregation": "hexagon", "cell_size_m": 100.0, "distance_band_m": 200.0}
Hot spots
What this analysis is. Hot spot analysis: Getis-Ord Gi* hot and cold spots with z-scores, p-values and confidence bins 23. In ArcGIS it is Find Hot Spots or Hot Spot Analysis (Getis-Ord Gi*); in QGIS, qgis:hotspot (plugin) 23.
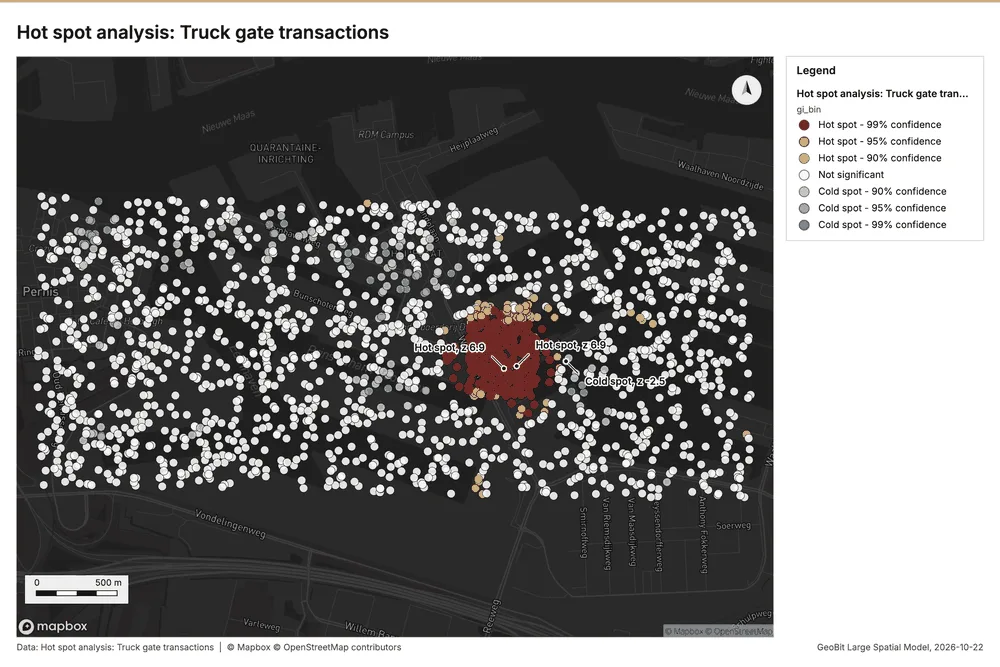
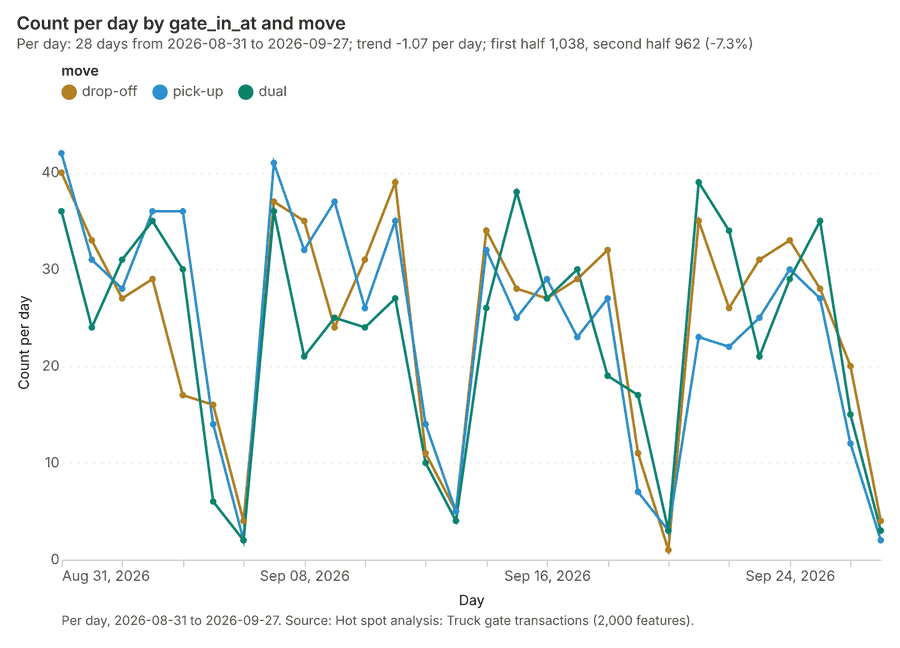
Why it was run on this data. 2000 points: Getis-Ord Gi* tests whether the concentrations in Truck gate transactions are statistically significant 28.
What it found. The hot spot analysis utilized the Truck gate transactions dataset 12 and was run using the gp_hot_spots tool 29.
| Result | Value |
|---|---|
| result, count | 2,000 |
| result, elapsed ms | 37 |
| result, excluded null | 0 |
| result, distance band m | 200 |
| billing, cost | 0.09 |
| billing, list price | 0.09 |
| billing, upstream cost | 0 |
Findings
- Evidenced: Hot spots on Truck gate transactions: Hot spot analysis: 1 layer saved: Hot spot analysis: Truck gate transactions (2000 features) 1229.
- Evidenced: It reported result, count 2,000; result, elapsed ms 37; result, excluded null 0; result, distance band m 200; billing, cost 0.09; billing, list price 0.09 29.
Tool gp_hot_spots; parameters {"field": "turn_time_min", "project": "20fafc67-4c16-4f65-b17e-a469aa483b5a", "features": {"layer": "Truck gate transactions (b9f2750d)"}, "aggregation": "hexagon", "cell_size_m": 100.0, "distance_band_m": 200.0}
Calculate density
What this analysis is. Calculate density: Kernel density per square kilometer on a grid 30. In ArcGIS it is Calculate Density or Kernel Density; in QGIS, native:heatmapkerneldensityestimation 30.
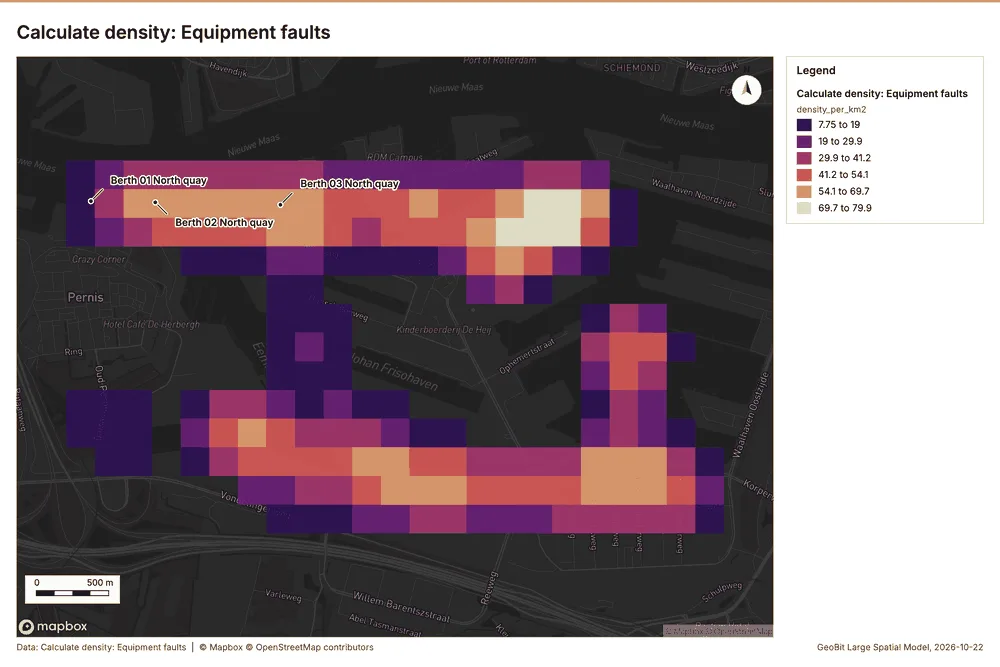
Why it was run on this data. 260 points in Equipment faults: a density surface shows where they concentrate 31.
What it found. Density was calculated utilizing the Equipment faults data 9. The results indicated a total count of 284 features 32. During this analysis, the maximum density recorded was 79.93 per km² 32.
| Result | Value |
|---|---|
| result, count | 284 |
| result, elapsed ms | 11 |
| result, bandwidth m | 500 |
| result, cell size m | 200 |
| result, excluded null | 0 |
| result, max density per km2 | 79.93 |
| billing, cost | 0.0552 |
| billing, list price | 0.0552 |
| billing, upstream cost | 0 |
Findings
- Evidenced: Calculate density on Equipment faults: Calculate density: 1 layer saved: Calculate density: Equipment faults (284 features) 932.
- Evidenced: It reported result, count 284; result, elapsed ms 11; result, bandwidth m 500; result, cell size m 200; result, excluded null 0; result, max density per km2 79.93 32.
Tool gp_calculate_density; parameters {"kernel": "quartic", "project": "20fafc67-4c16-4f65-b17e-a469aa483b5a", "features": {"layer": "Equipment faults (790b76cb)"}, "bandwidth_m": 500.0, "cell_size_m": 200.0}
Calculate density
What this analysis is. Calculate density: Kernel density per square kilometer on a grid 30. In ArcGIS it is Calculate Density or Kernel Density; in QGIS, native:heatmapkerneldensityestimation 30.
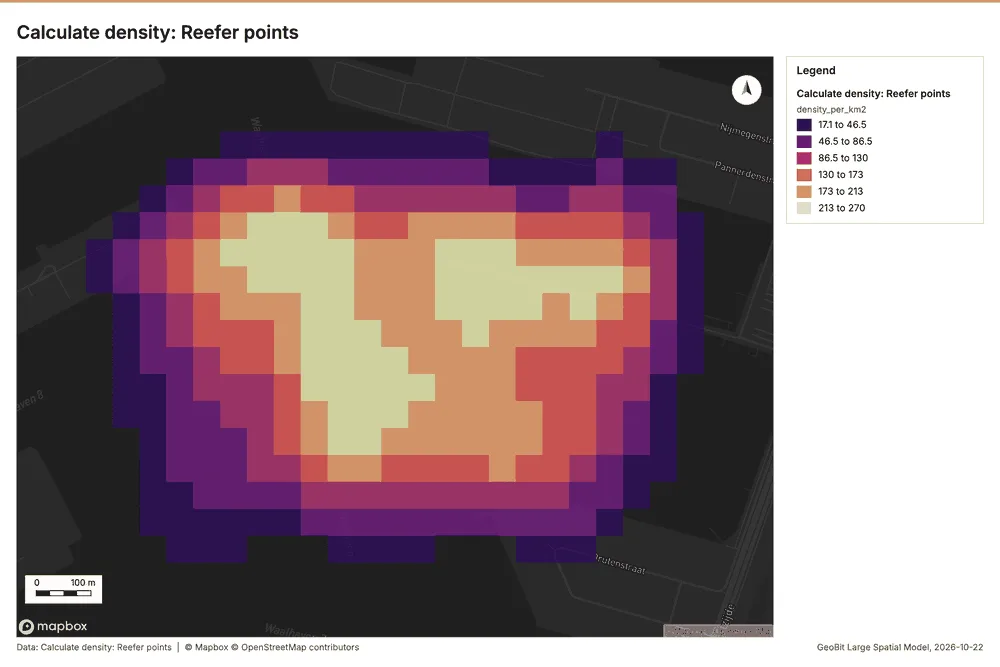
Why it was run on this data. 100 points in Reefer points: a density surface shows where they concentrate 33.
What it found. Calculate density on Reefer points: Calculate density: 1 layer saved: Calculate density: Reefer points (425 features) 2134. It reported result, count 425; result, elapsed ms 17; result, bandwidth m 200; result, cell size m 50; result, excluded null 0; result, max density per km2 270.1 34.
| Result | Value |
|---|---|
| result, count | 425 |
| result, elapsed ms | 17 |
| result, bandwidth m | 200 |
| result, cell size m | 50 |
| result, excluded null | 0 |
| result, max density per km2 | 270.1 |
| billing, cost | 0.052 |
| billing, list price | 0.052 |
| billing, upstream cost | 0 |
Findings
- Evidenced: Calculate density on Reefer points: Calculate density: 1 layer saved: Calculate density: Reefer points (425 features) 2134.
- Evidenced: It reported result, count 425; result, elapsed ms 17; result, bandwidth m 200; result, cell size m 50; result, excluded null 0; result, max density per km2 270.1 34.
Tool gp_calculate_density; parameters {"kernel": "quartic", "project": "20fafc67-4c16-4f65-b17e-a469aa483b5a", "features": {"layer": "Reefer points (73835122)"}, "bandwidth_m": 200.0, "cell_size_m": 50.0}
Calculate density
What this analysis is. Calculate density: Kernel density per square kilometer on a grid 30. In ArcGIS it is Calculate Density or Kernel Density; in QGIS, native:heatmapkerneldensityestimation 30.
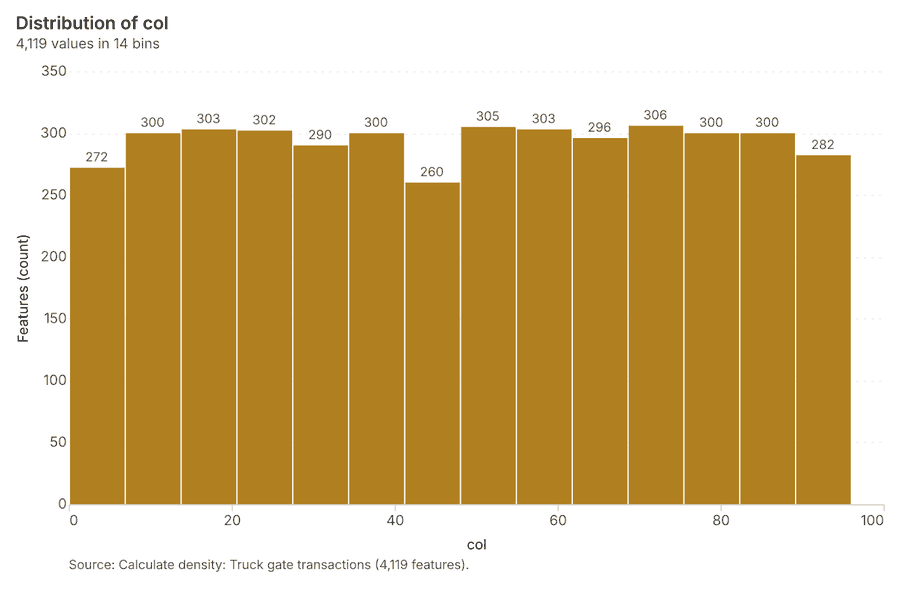
Why it was run on this data. 2000 points in Truck gate transactions: a density surface shows where they concentrate 35.
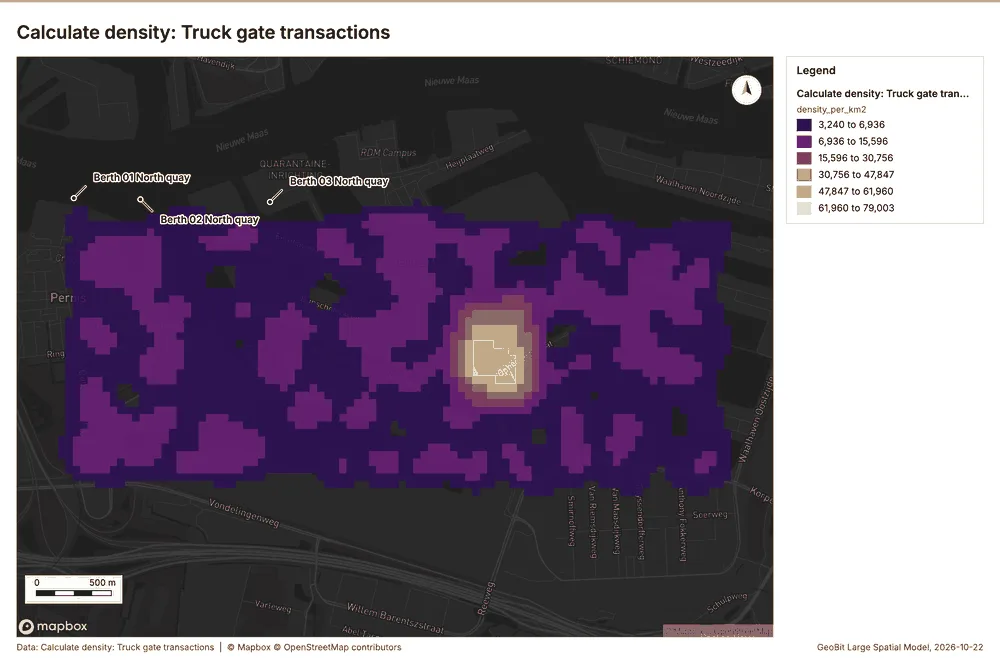
What it found. The density calculation was executed using the Truck gate transactions data 12 via the gp_calculate_density tool 36.
| Result | Value |
|---|---|
| result, count | 4,119 |
| result, elapsed ms | 116 |
| result, bandwidth m | 200 |
| result, cell size m | 50 |
| result, excluded null | 0 |
| result, max density per km2 | 7.9e+04 |
| billing, cost | 0.09 |
| billing, list price | 0.09 |
| billing, upstream cost | 0 |
Findings
- Evidenced: Calculate density on Truck gate transactions: Calculate density: 1 layer saved: Calculate density: Truck gate transactions (4119 features) 1236.
- Evidenced: It reported result, count 4,119; result, elapsed ms 116; result, bandwidth m 200; result, cell size m 50; result, excluded null 0; result, max density per km2 7.9e+04 36.
Tool gp_calculate_density; parameters {"kernel": "quartic", "project": "20fafc67-4c16-4f65-b17e-a469aa483b5a", "features": {"layer": "Truck gate transactions (b9f2750d)"}, "bandwidth_m": 200.0, "cell_size_m": 50.0, "weight_field": "turn_time_min"}
Find point clusters
What this analysis is. Find point clusters: Density-based clusters (DBSCAN, HDBSCAN or OPTICS, optionally space-time) with hulls and noise 37. In ArcGIS it is Find Point Clusters or Density-based Clustering; in QGIS, native:dbscanclustering or native:stdbscanclustering 37.
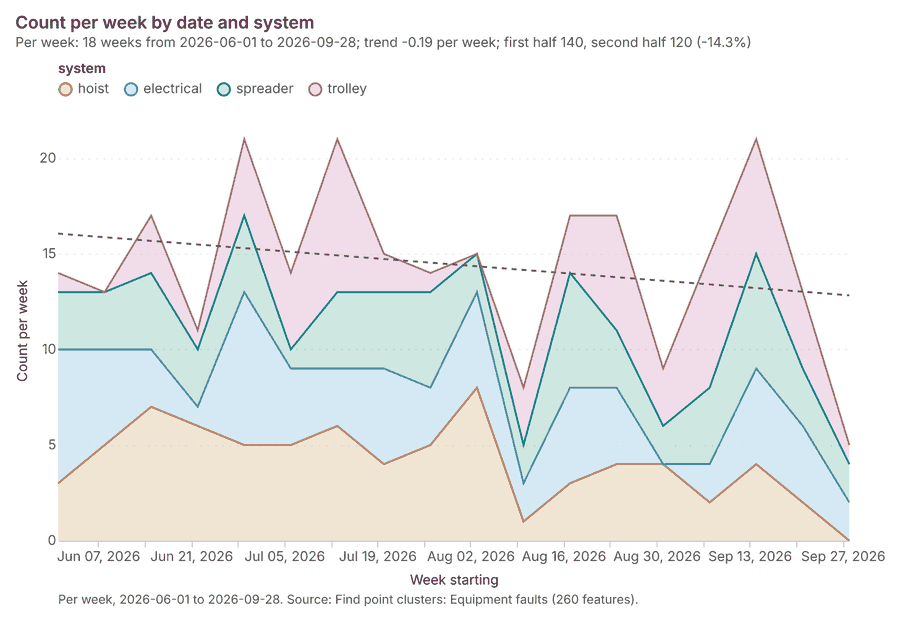
Why it was run on this data. DBSCAN finds dense groups of Equipment faults and separates noise 38.
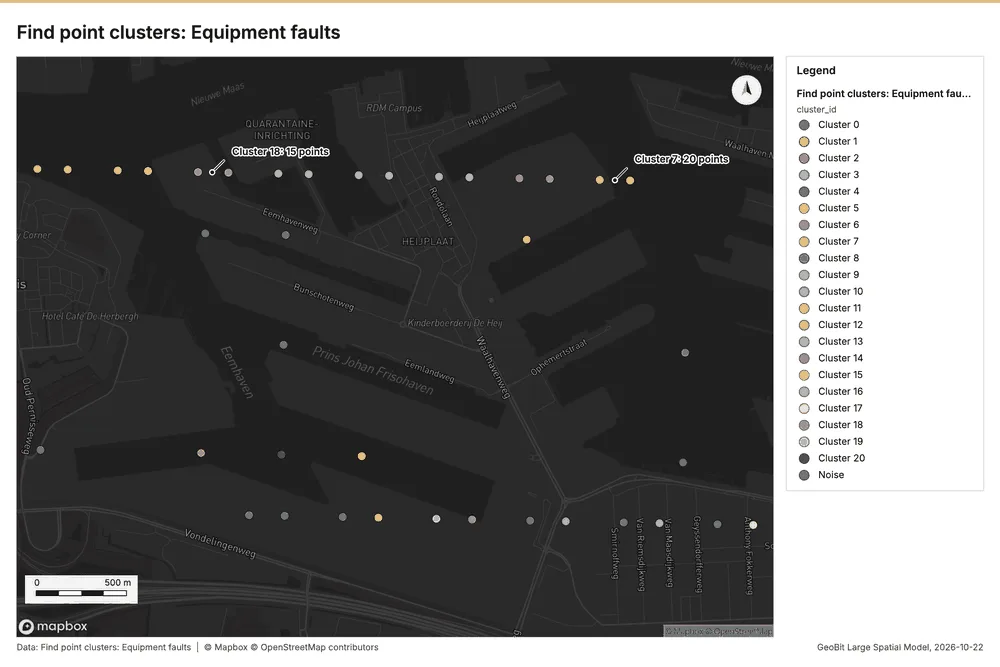
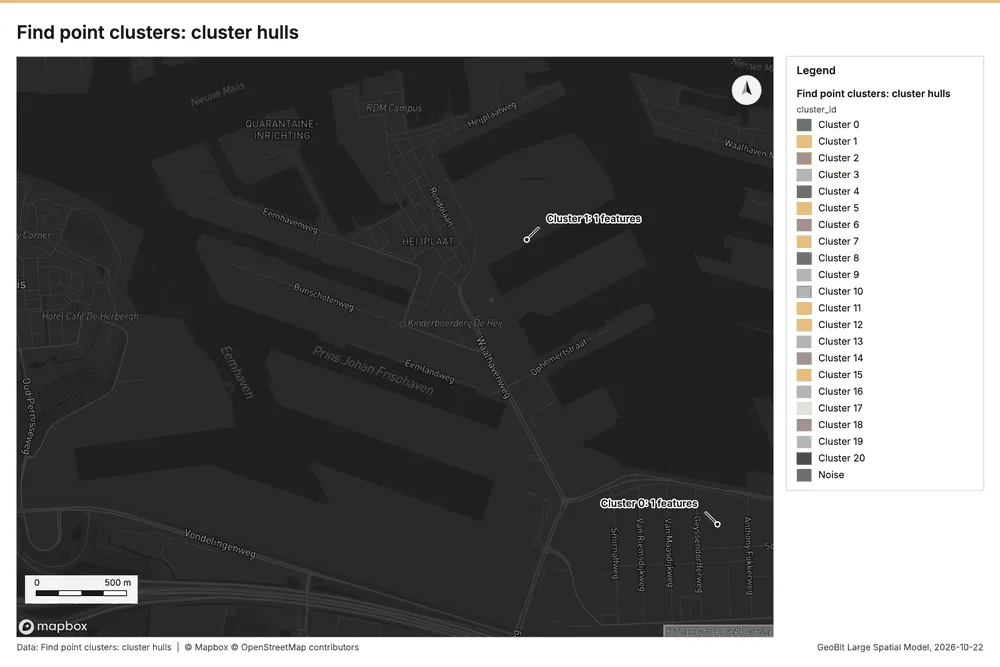
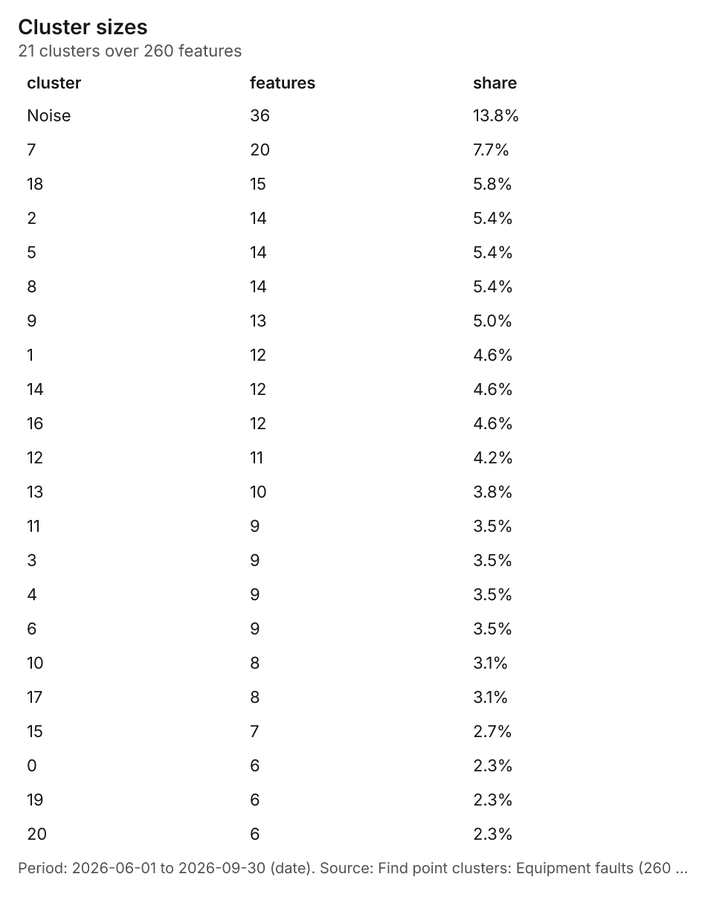
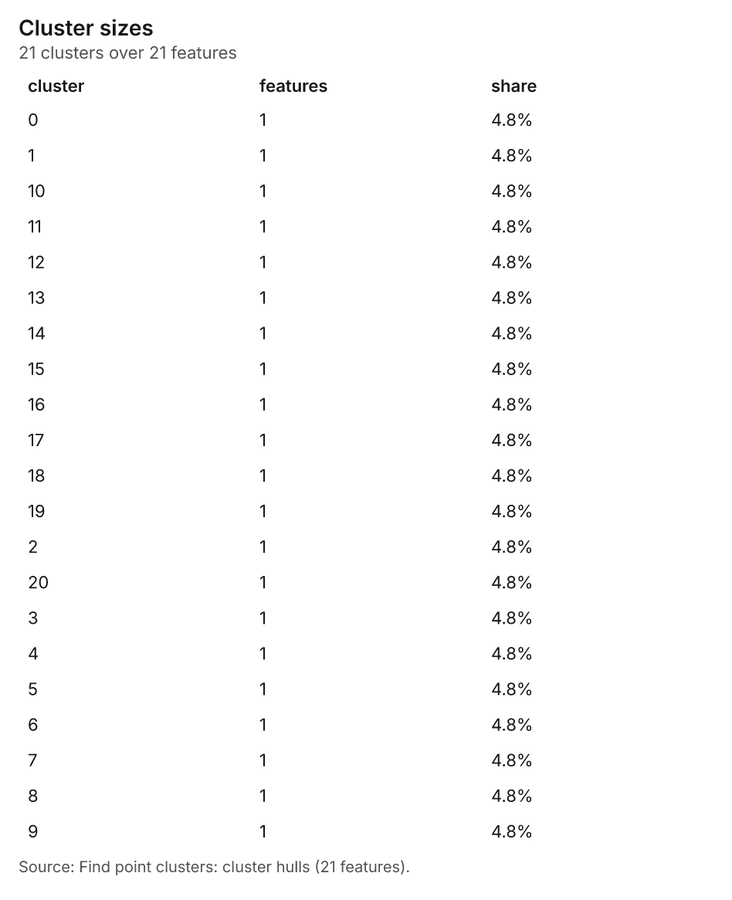
What it found. The cluster analysis produced two layers: Equipment faults with 260 features and cluster hulls with 21 features 39. Using the input Equipment faults layer 9, the process yielded a result count of 260 and a noise count of 36 39. The analysis was completed in 10 ms, with a minimum point requirement of 6 39. The total cost of the operation was 0.0552, matching the list price 39.
| Result | Value |
|---|---|
| result, count | 260 |
| result, noise | 36 |
| result, distance m | 200 |
| result, elapsed ms | 10 |
| result, min points | 6 |
| billing, cost | 0.0552 |
| billing, list price | 0.0552 |
| billing, upstream cost | 0 |
Findings
- Evidenced: Find point clusters on Equipment faults: Find point clusters: 2 layers saved: Find point clusters: Equipment faults (260 features); Find point clusters: cluster hulls (21 features) 939.
- Evidenced: It reported result, count 260; result, noise 36; result, distance m 200; result, elapsed ms 10; result, min points 6; billing, cost 0.0552 39.
Tool gp_find_point_clusters; parameters {"method": "dbscan", "project": "20fafc67-4c16-4f65-b17e-a469aa483b5a", "features": {"layer": "Equipment faults (790b76cb)"}, "distance_m": 200.0, "min_points": 6}
Find point clusters
What this analysis is. Find point clusters: Density-based clusters (DBSCAN, HDBSCAN or OPTICS, optionally space-time) with hulls and noise 37. In ArcGIS it is Find Point Clusters or Density-based Clustering; in QGIS, native:dbscanclustering or native:stdbscanclustering 37.
Why it was run on this data. DBSCAN finds dense groups of Reefer points and separates noise 40.
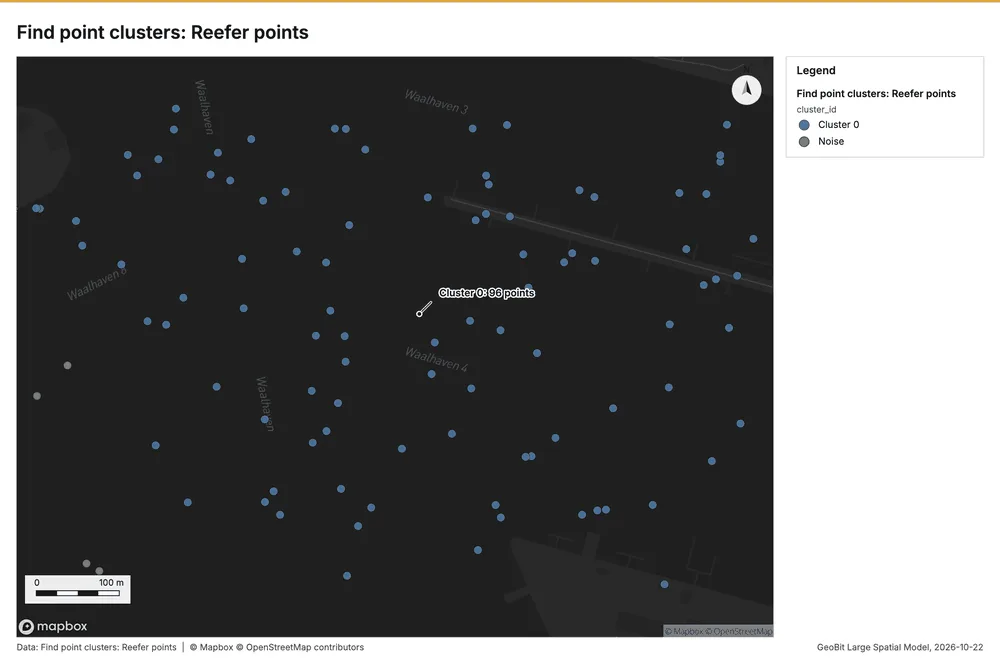
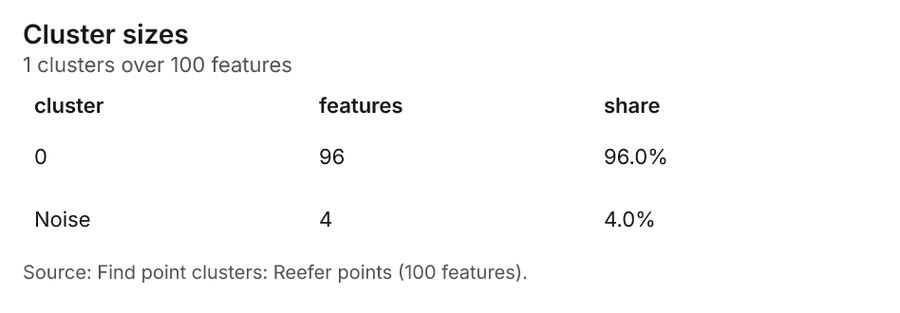
What it found. Find point clusters on Reefer points: Find point clusters: 2 layers saved: Find point clusters: Reefer points (100 features); Find point clusters: cluster hulls (1 feature) 2141. It reported result, count 100; result, noise 4; result, distance m 100; result, elapsed ms 2; result, min points 3; billing, cost 0.052 41.
| Result | Value |
|---|---|
| result, count | 100 |
| result, noise | 4 |
| result, distance m | 100 |
| result, elapsed ms | 2 |
| result, min points | 3 |
| billing, cost | 0.052 |
| billing, list price | 0.052 |
| billing, upstream cost | 0 |
Findings
- Evidenced: Find point clusters on Reefer points: Find point clusters: 2 layers saved: Find point clusters: Reefer points (100 features); Find point clusters: cluster hulls (1 feature) 2141.
- Evidenced: It reported result, count 100; result, noise 4; result, distance m 100; result, elapsed ms 2; result, min points 3; billing, cost 0.052 41.
Tool gp_find_point_clusters; parameters {"method": "dbscan", "project": "20fafc67-4c16-4f65-b17e-a469aa483b5a", "features": {"layer": "Reefer points (73835122)"}, "distance_m": 100.0, "min_points": 3}
Find point clusters
What this analysis is. Find point clusters: Density-based clusters (DBSCAN, HDBSCAN or OPTICS, optionally space-time) with hulls and noise 37. In ArcGIS it is Find Point Clusters or Density-based Clustering; in QGIS, native:dbscanclustering or native:stdbscanclustering 37.
Why it was run on this data. DBSCAN finds dense groups of Truck gate transactions and separates noise 42.
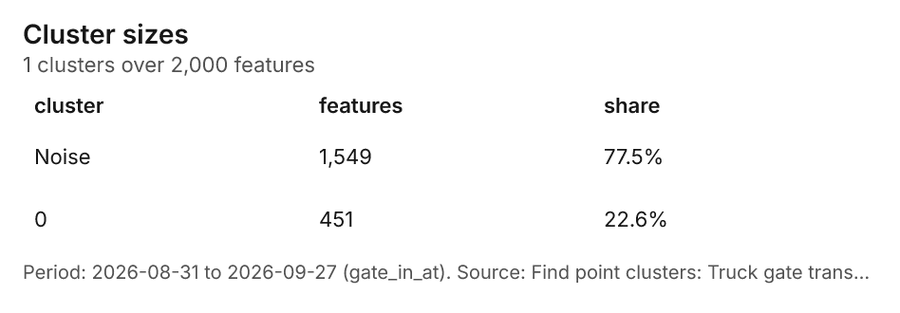
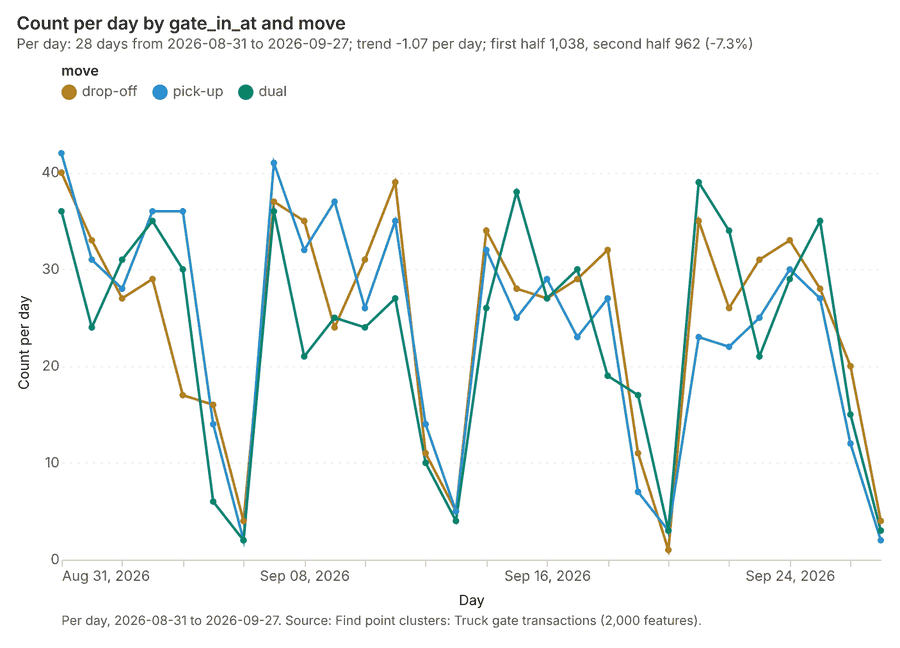
What it found. Find point clusters on Truck gate transactions: Find point clusters: 2 layers saved: Find point clusters: Truck gate transactions (2000 features); Find point clusters: cluster hulls (1 feature) 1243. It reported result, count 2,000; result, noise 1,549; result, distance m 100; result, elapsed ms 163; result, min points 20; billing, cost 0.09 43.
| Result | Value |
|---|---|
| result, count | 2,000 |
| result, noise | 1,549 |
| result, distance m | 100 |
| result, elapsed ms | 163 |
| result, min points | 20 |
| billing, cost | 0.09 |
| billing, list price | 0.09 |
| billing, upstream cost | 0 |
Findings
- Evidenced: Find point clusters on Truck gate transactions: Find point clusters: 2 layers saved: Find point clusters: Truck gate transactions (2000 features); Find point clusters: cluster hulls (1 feature) 1243.
- Evidenced: It reported result, count 2,000; result, noise 1,549; result, distance m 100; result, elapsed ms 163; result, min points 20; billing, cost 0.09 43.
Tool gp_find_point_clusters; parameters {"method": "dbscan", "project": "20fafc67-4c16-4f65-b17e-a469aa483b5a", "features": {"layer": "Truck gate transactions (b9f2750d)"}, "distance_m": 100.0, "min_points": 20}
Outliers
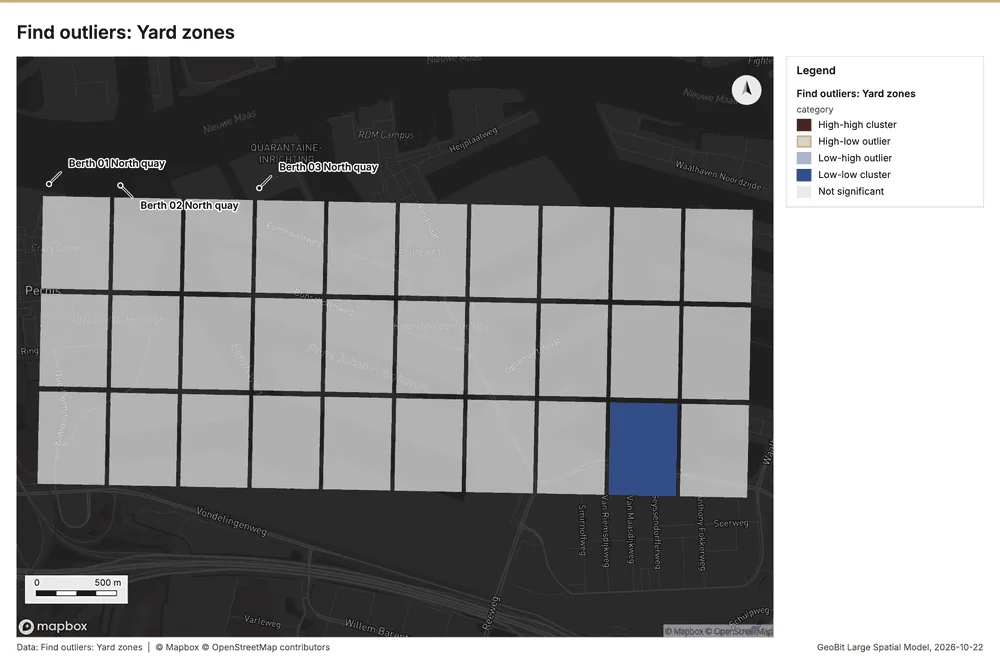
What this analysis is. Find outliers: Anselin local Moran’s I: HH, LL clusters and HL, LH outliers 44. In ArcGIS it is Find Outliers or Cluster and Outlier Analysis (Anselin Local Moran’s I) 44.
Why it was run on this data. Local Moran's I maps clusters and outliers of 'capacity_teu' 45.
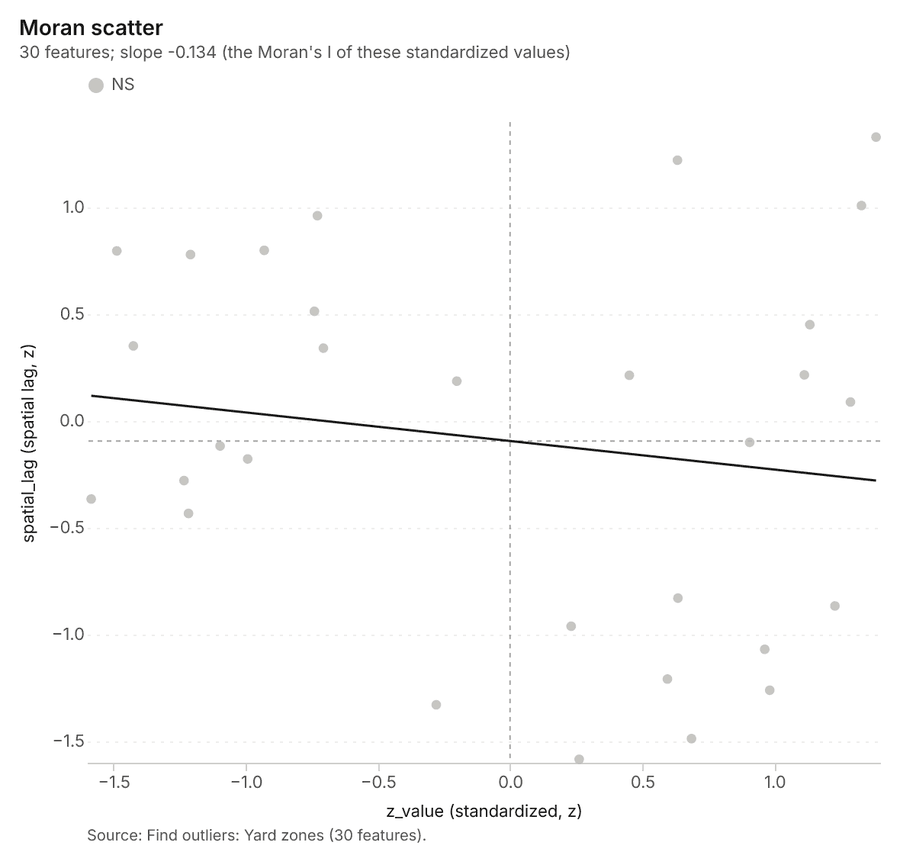
What it found. Outliers on Yard zones: Find outliers: 1 layer saved: Find outliers: Yard zones (30 features) 1946. It reported result, count 30; result, elapsed ms 4; result, permutations 199; result, excluded null 0; result, distance band m 454.7; billing, cost 0.0509 46.
| Result | Value |
|---|---|
| result, count | 30 |
| result, elapsed ms | 4 |
| result, permutations | 199 |
| result, excluded null | 0 |
| result, distance band m | 454.7 |
| billing, cost | 0.0509 |
| billing, list price | 0.0509 |
| billing, upstream cost | 0 |
Findings
- Evidenced: Outliers on Yard zones: Find outliers: 1 layer saved: Find outliers: Yard zones (30 features) 1946.
- Evidenced: It reported result, count 30; result, elapsed ms 4; result, permutations 199; result, excluded null 0; result, distance band m 454.7; billing, cost 0.0509 46.
Tool gp_outliers; parameters {"field": "capacity_teu", "project": "20fafc67-4c16-4f65-b17e-a469aa483b5a", "features": {"layer": "Yard zones (0b9931a6)"}, "aggregation": "hexagon"}
Spatial autocorrelation
What this analysis is. Spatial autocorrelation: Global Moran’s I: is the pattern clustered, dispersed or random 47. In ArcGIS it is Spatial Autocorrelation (Global Moran’s I) 47.
Why it was run on this data. Global Moran's I says whether similar values of 'capacity_teu' sit next to each other 48.
What it found. The spatial autocorrelation analysis was performed on the Yard zones input 19. The analysis used a distance band set at 454.7 meters 49.
| Result | Value |
|---|---|
| result, n | 30 |
| result, p value | 0.515 |
| result, z score | -0.6511 |
| result, morans i | -0.1587 |
| result, variance | 0.03637 |
| result, elapsed ms | 2 |
| result, expected i | -0.03448 |
| result, excluded null | 0 |
| result, distance band m | 454.7 |
| result, p value normality | 0.5042 |
| result, z score normality | -0.668 |
| result, variance normality | 0.03456 |
| billing, cost | 0.02 |
| billing, list price | 0.02 |
| billing, upstream cost | 0 |
Findings
- Evidenced: Spatial autocorrelation on Yard zones: Spatial autocorrelation: done; no map output 1949.
- Evidenced: It reported result, n 30; result, p value 0.515; result, z score -0.6511; result, morans i -0.1587; result, variance 0.03637; result, elapsed ms 2 49.
Tool gp_spatial_autocorrelation; parameters {"field": "capacity_teu", "project": "20fafc67-4c16-4f65-b17e-a469aa483b5a", "features": {"layer": "Yard zones (0b9931a6)"}}
Maps and charts
The run also made 20 map image(s) 5051525354555657585960616263646566676869 and 27 chart(s) 707172737475767778798081828384858687888990919293949596.
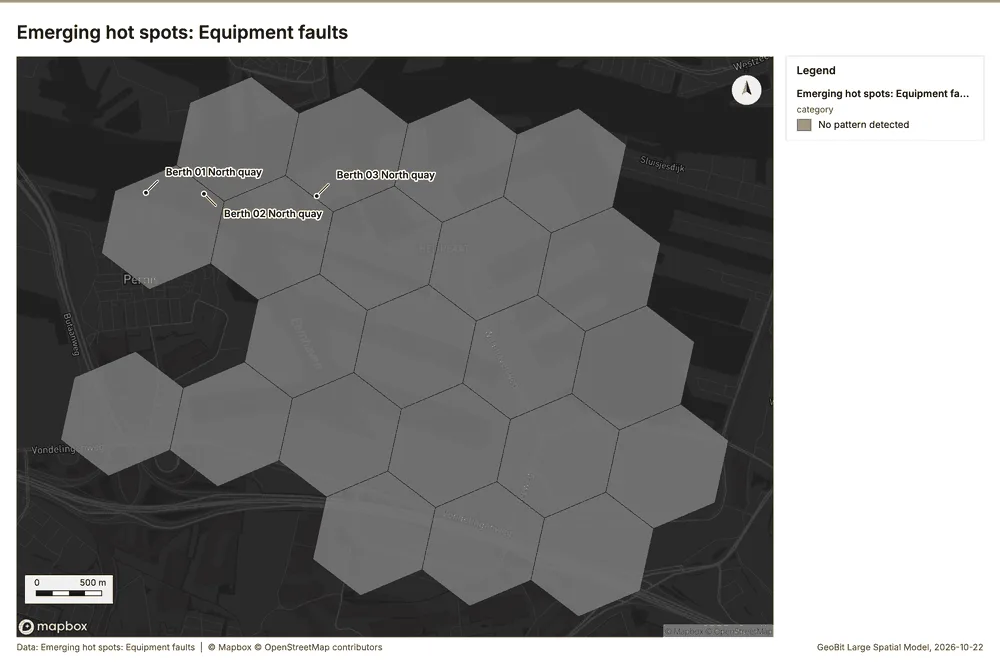
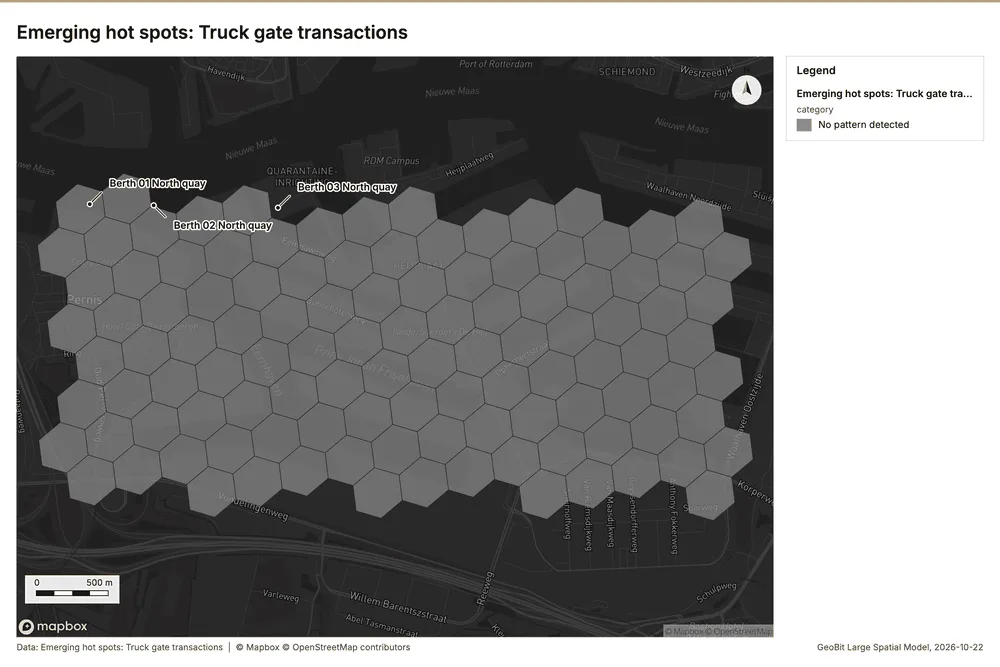
What the map shows. The map displays the results of an emerging hot spots analysis concerning Equipment faults. According to the legend provided, the area is categorized as "No pattern detected." Across the entire mapped region, every grid cell is filled with the uniform gray color, indicating no emerging hot spot was identified. There are no visible clusters, gradients, or localized high-concentration areas of fault occurrences. The analysis suggests that, based on the displayed data, the equipment faults are distributed without a statistically significant pattern. 50
Inferred: read from the image by gemma4:e4b, not evidence.
Changes since the last run
This is the first report of this project.
Sources
- 1Rendering: Chart: Timeline: events per week by dataset. 108 rows id 11047c75-2b19-47cd-a59a-f0cbb048b5c8
- 2Dataset: Truck gate transactions. vector, 2000 rows id 9df2b234-4fbe-485c-b46c-b4c3ecee1bca
- 3Dataset: Equipment faults. vector, 260 rows id 2ac95106-0af7-4a53-9a75-a8bae7f1278e
- 4Dataset: Berth calls. table, 360 rows id 40ffa1b1-7e33-45bd-b8ea-a135c7f8a900
- 5Dataset: Yard inventory by day. table, 840 rows id 708007f4-4b4d-43d1-ac33-89c5e52f4d38
- 6Catalog: Emerging hot spots (operation catalog, gp_space_time_hot_spots). Where hot spots are new, consecutive, intensifying, persistent, diminishing, sporadic, oscillating or historical over time. ArcGIS: Emerging Hot Spot Analysis, Create Space Time Cube. id gp_space_time_hot_spots
- 7Plan: Space time hot spots of Equipment faults (the Start plan's candidate c_b58984834921). Equipment faults carry dates in 'date': emerging hot spot analysis finds new, intensifying and fading hot spots per week. id d9ee6452-a1f6-426a-aaab-e0d1b69d7593:c_b58984834921
- 8Tool result: gp_space_time_hot_spots, step 0. Emerging hot spots: 1 layer saved: Emerging hot spots: Equipment faults (22 features). id e40e3bed-16aa-4055-8346-9c7ae3dd0e1c:0
- 9Layer: Equipment faults. 260 features id 790b76cb-eb78-4e79-8c01-68b3710ce26d
- 10Plan: Space time hot spots of Truck gate transactions (the Start plan's candidate c_eca8ebc5b6ec). Truck gate transactions carry dates in 'gate_in_at': emerging hot spot analysis finds new, intensifying and fading hot spots per day. id d9ee6452-a1f6-426a-aaab-e0d1b69d7593:c_eca8ebc5b6ec
- 11Tool result: gp_space_time_hot_spots, step 1. Emerging hot spots: 1 layer saved: Emerging hot spots: Truck gate transactions (111 features). id e40e3bed-16aa-4055-8346-9c7ae3dd0e1c:1
- 12Layer: Truck gate transactions. 2,000 features id b9f2750d-cff0-415b-a399-c427801b3164
- 13Catalog: Repeat and near repeat classification (operation catalog, gp_near_repeat). Classify incidents as originators, repeats (same place) or near repeats within a distance and time window, with a Knox test table. ArcGIS: Repeat and Near Repeat Classification, Near Repeat Calculator. id gp_near_repeat
- 14Plan: Near repeat of Equipment faults (the Start plan's candidate c_76cc00de2abd). Near repeat analysis tests whether Equipment faults close in space also follow each other within 12 days. id d9ee6452-a1f6-426a-aaab-e0d1b69d7593:c_76cc00de2abd
- 15Tool result: gp_near_repeat, step 2. Repeat and near repeat classification: 1 layer saved: Repeat and near repeat classification: Equipment faults (260 features). id e40e3bed-16aa-4055-8346-9c7ae3dd0e1c:2
- 16Catalog: Summarize within (operation catalog, gp_summarize_within). Count and aggregate the features inside each polygon (or bin), proportionally for lines and polygons. ArcGIS: Summarize Within, Aggregate Points. QGIS: native:countpointsinpolygon, native:sumlinelengths. id gp_summarize_within
- 17Plan: Equipment faults per feature of Yard zones (the Start plan's candidate c_aa826c0e2c95). Count Equipment faults inside each feature of Yard zones by system; the counts map as a choropleth (natural breaks, sequential colors). id d9ee6452-a1f6-426a-aaab-e0d1b69d7593:c_aa826c0e2c95
- 18Tool result: gp_summarize_within, step 0. Summarize within: 1 layer saved: Summarize within: Yard zones (30 features). id b81a9a7d-e780-4bbd-a071-25593dafe30b:0
- 19Layer: Yard zones. 30 features id 0b9931a6-3451-4c38-97e1-e2d0b0d2e6c0
- 20Tool result: gp_summarize_within, step 1. Summarize within: 1 layer saved: Summarize within: Yard zones (30 features). id b81a9a7d-e780-4bbd-a071-25593dafe30b:1
- 21Layer: Reefer points. 100 features id 73835122-ec06-4a26-a127-ab201cf379e6
- 22Tool result: gp_summarize_within, step 2. Summarize within: 1 layer saved: Summarize within: Yard zones (30 features). id b81a9a7d-e780-4bbd-a071-25593dafe30b:2
- 23Catalog: Hot spot analysis (operation catalog, gp_hot_spots). Getis-Ord Gi* hot and cold spots with z-scores, p-values and confidence bins. ArcGIS: Find Hot Spots, Hot Spot Analysis (Getis-Ord Gi*). QGIS: qgis:hotspot (plugin). id gp_hot_spots
- 24Plan: Hot spots of Equipment faults (the Start plan's candidate c_0641eeca6054). 260 points: Getis-Ord Gi* tests whether the concentrations in Equipment faults are statistically significant. id d9ee6452-a1f6-426a-aaab-e0d1b69d7593:c_0641eeca6054
- 25Tool result: gp_hot_spots, step 0. Hot spot analysis: 1 layer saved: Hot spot analysis: Equipment faults (41 features). id d0ec0f48-d207-4e62-856c-316d57d7454a:0
- 26Plan: Hot spots of Reefer points (the Start plan's candidate c_810f1d99b7e9). 100 points: Getis-Ord Gi* tests whether the concentrations in Reefer points are statistically significant. id d9ee6452-a1f6-426a-aaab-e0d1b69d7593:c_810f1d99b7e9
- 27Tool result: gp_hot_spots, step 1. Hot spot analysis: 1 layer saved: Hot spot analysis: Reefer points (62 features). id d0ec0f48-d207-4e62-856c-316d57d7454a:1
- 28Plan: Hot spots of Truck gate transactions (the Start plan's candidate c_e8db5dd726f1). 2000 points: Getis-Ord Gi* tests whether the concentrations in Truck gate transactions are statistically significant. id d9ee6452-a1f6-426a-aaab-e0d1b69d7593:c_e8db5dd726f1
- 29Tool result: gp_hot_spots, step 2. Hot spot analysis: 1 layer saved: Hot spot analysis: Truck gate transactions (2000 features). id d0ec0f48-d207-4e62-856c-316d57d7454a:2
- 30Catalog: Calculate density (operation catalog, gp_calculate_density). Kernel density per square kilometer on a grid. ArcGIS: Calculate Density, Kernel Density. QGIS: native:heatmapkerneldensityestimation. id gp_calculate_density
- 31Plan: Kernel density of Equipment faults (the Start plan's candidate c_0a821ea91d7a). 260 points in Equipment faults: a density surface shows where they concentrate. id d9ee6452-a1f6-426a-aaab-e0d1b69d7593:c_0a821ea91d7a
- 32Tool result: gp_calculate_density, step 0. Calculate density: 1 layer saved: Calculate density: Equipment faults (284 features). id 3f35f607-29ba-44fe-827e-7ba7fd8f461d:0
- 33Plan: Kernel density of Reefer points (the Start plan's candidate c_33d00d793c5e). 100 points in Reefer points: a density surface shows where they concentrate. id d9ee6452-a1f6-426a-aaab-e0d1b69d7593:c_33d00d793c5e
- 34Tool result: gp_calculate_density, step 1. Calculate density: 1 layer saved: Calculate density: Reefer points (425 features). id 3f35f607-29ba-44fe-827e-7ba7fd8f461d:1
- 35Plan: Kernel density of Truck gate transactions (the Start plan's candidate c_95387e3fbe3a). 2000 points in Truck gate transactions: a density surface shows where they concentrate. id d9ee6452-a1f6-426a-aaab-e0d1b69d7593:c_95387e3fbe3a
- 36Tool result: gp_calculate_density, step 2. Calculate density: 1 layer saved: Calculate density: Truck gate transactions (4119 features). id 3f35f607-29ba-44fe-827e-7ba7fd8f461d:2
- 37Catalog: Find point clusters (operation catalog, gp_find_point_clusters). Density-based clusters (DBSCAN, HDBSCAN or OPTICS, optionally space-time) with hulls and noise. ArcGIS: Find Point Clusters, Density-based Clustering. QGIS: native:dbscanclustering, native:stdbscanclustering. id gp_find_point_clusters
- 38Plan: Cluster points of Equipment faults (the Start plan's candidate c_cd3c95b593b8). DBSCAN finds dense groups of Equipment faults and separates noise. id d9ee6452-a1f6-426a-aaab-e0d1b69d7593:c_cd3c95b593b8
- 39Tool result: gp_find_point_clusters, step 0. Find point clusters: 2 layers saved: Find point clusters: Equipment faults (260 features); Find point clusters: cluster hulls (21 features). id b0f8aa2c-db45-4d83-9fff-4f2b75bd614c:0
- 40Plan: Cluster points of Reefer points (the Start plan's candidate c_17c598621b07). DBSCAN finds dense groups of Reefer points and separates noise. id d9ee6452-a1f6-426a-aaab-e0d1b69d7593:c_17c598621b07
- 41Tool result: gp_find_point_clusters, step 1. Find point clusters: 2 layers saved: Find point clusters: Reefer points (100 features); Find point clusters: cluster hulls (1 feature). id b0f8aa2c-db45-4d83-9fff-4f2b75bd614c:1
- 42Plan: Cluster points of Truck gate transactions (the Start plan's candidate c_57a67cafe160). DBSCAN finds dense groups of Truck gate transactions and separates noise. id d9ee6452-a1f6-426a-aaab-e0d1b69d7593:c_57a67cafe160
- 43Tool result: gp_find_point_clusters, step 2. Find point clusters: 2 layers saved: Find point clusters: Truck gate transactions (2000 features); Find point clusters: cluster hulls (1 feature). id b0f8aa2c-db45-4d83-9fff-4f2b75bd614c:2
- 44Catalog: Find outliers (operation catalog, gp_outliers). Anselin local Moran’s I: HH, LL clusters and HL, LH outliers. ArcGIS: Find Outliers, Cluster and Outlier Analysis (Anselin Local Moran’s I). id gp_outliers
- 45Plan: Local morans i of Yard zones (the Start plan's candidate c_429379204dba). Local Moran's I maps clusters and outliers of 'capacity_teu'. id d9ee6452-a1f6-426a-aaab-e0d1b69d7593:c_429379204dba
- 46Tool result: gp_outliers, step 0. Find outliers: 1 layer saved: Find outliers: Yard zones (30 features). id 03a62e3e-7c33-480d-b1a9-3e5ac2c09cdb:0
- 47Catalog: Spatial autocorrelation (operation catalog, gp_spatial_autocorrelation). Global Moran’s I: is the pattern clustered, dispersed or random. ArcGIS: Spatial Autocorrelation (Global Moran’s I). id gp_spatial_autocorrelation
- 48Plan: Global morans i of Yard zones (the Start plan's candidate c_085f774564d9). Global Moran's I says whether similar values of 'capacity_teu' sit next to each other. id d9ee6452-a1f6-426a-aaab-e0d1b69d7593:c_085f774564d9
- 49Tool result: gp_spatial_autocorrelation, step 1. Spatial autocorrelation: done; no map output. id 03a62e3e-7c33-480d-b1a9-3e5ac2c09cdb:1
- 50Rendering: Map: Emerging hot spots: Equipment faults id e6910ca0-d50c-43b0-b7d9-8c5c1f050783
- 51Rendering: Map: Emerging hot spots: Truck gate transactions id 515cea9c-9877-46aa-a13c-4113ce12e73d
- 52Rendering: Map: Repeat and near repeat classification: Equipment faults id fa0dc608-c857-44d6-8678-d5b17e2f6b79
- 53Rendering: Map: Summarize within: Yard zones id af07b588-53b5-4b85-84cb-691b540af342
- 54Rendering: Map: Summarize within: Yard zones id 93c17116-d3e1-468f-b008-1e898a6cce2e
- 55Rendering: Map: Summarize within: Yard zones id 6f8ebf81-81b3-4228-9405-9cc9c04851e0
- 56Rendering: Map: Hot spot analysis: Equipment faults id 4ecf65c6-4ad6-40cb-9995-dcc289441572
- 57Rendering: Map: Hot spot analysis: Reefer points id 302ee063-bdd1-4516-9cf6-ebabd602feb1
- 58Rendering: Map: Hot spot analysis: Truck gate transactions id e879a4aa-940c-43ca-a32a-c85ce2668301
- 59Rendering: Map: Calculate density: Equipment faults id 693d7472-34c3-42d3-ace7-ac7eba5ff23b
- 60Rendering: Map: Calculate density: Reefer points id 757bdb8e-7a55-4deb-8f0a-91f5bd8ff881
- 61Rendering: Map: Calculate density: Truck gate transactions id 19c9a9f7-d4a7-4429-8aa7-9f0a2d99f3e4
- 62Rendering: Map: Find point clusters: Equipment faults id 52740046-11ec-462f-a421-aa7e94c61f6e
- 63Rendering: Map: Find point clusters: cluster hulls id fa3507ae-0db5-4cf6-9c5e-bc2137650c75
- 64Rendering: Map: Find point clusters: Reefer points id 65dc036f-0f6e-487d-9375-a24401305aca
- 65Rendering: Map: Find point clusters: cluster hulls id 3454a201-f985-451b-a1fd-c07dbe2e9fc9
- 66Rendering: Map: Find point clusters: Truck gate transactions id b09daf9c-0715-4cfb-821c-93920274d482
- 67Rendering: Map: Find point clusters: cluster hulls id 834cca38-8129-4ee1-b3fe-8a727e0445f9
- 68Rendering: Map: Yard zones by capacity_teu id ba095b6b-b3ec-4964-8628-46249c0ee3e3
- 69Rendering: Map: Find outliers: Yard zones id a557a74c-a519-4164-b6e1-928a88256d84
- 70Rendering: Chart: Truck gate transactions over time (turn_time_min). 84 rows id 39e5653c-2a28-47d2-b9de-18cc494cf9cf
- 71Rendering: Chart: Equipment faults over time (date). 72 rows id 276d16c9-87e8-4c05-93cf-d80429cf89e5
- 72Rendering: Chart: Berth calls over time (arrival_date). 27 rows id 596dd570-090f-45dc-b0ed-e076304cc527
- 73Rendering: Chart: Yard inventory by day over time (date). 28 rows id 0eda9598-8313-4475-84f5-17eb7bcf7426
- 74Rendering: Chart: Emerging hot spots: Equipment faults. 6 rows id da7da906-ad4c-461a-99be-03b42f884fc5
- 75Rendering: Chart: Emerging hot spots: Truck gate transactions. 8 rows id 3f8f08a0-4024-4c2c-a938-81749cfce26c
- 76Rendering: Chart: Repeat and near repeat classification: Equipment faults. 72 rows id 0d472ba0-f679-4732-98be-c1002dce9ad6
- 77Rendering: Chart: Summarize within: Yard zones. 6 rows id 0d1bd326-7967-4498-8e1d-36b4aea6639f
- 78Rendering: Chart: Summarize within: Yard zones. 6 rows id ffaaddda-e02a-4652-828f-be9cdc5c18a2
- 79Rendering: Chart: Summarize within: Yard zones. 6 rows id 51468063-34ec-4f8c-8b85-da250b575e2c
- 80Rendering: Chart: Hot spot analysis: Equipment faults. 8 rows id e7ce3e63-0873-4cba-a376-1db2b0fa4455
- 81Rendering: Chart: Hot spot analysis: Reefer points. 9 rows id c4cbac5f-1381-44df-a3b8-7d19a8d8d3d5
- 82Rendering: Chart: Hot spot analysis: Truck gate transactions. 24 rows id d4e4896e-0c4a-45d0-ad29-4aa177fac4cc
- 83Rendering: Chart: Calculate density: Equipment faults. 10 rows id ec8258c8-3b83-40cb-8cd4-83e84b2ebd4e
- 84Rendering: Chart: Calculate density: Reefer points. 10 rows id ab819465-a3dc-4df7-8d67-46b82daa5de5
- 85Rendering: Chart: Calculate density: Truck gate transactions. 14 rows id b736ba6f-071f-4510-96b4-0d2855e22868
- 86Rendering: Chart: Find point clusters: Equipment faults. 22 rows id 7aa48a3e-a3df-4cf5-93bb-857225aa546e
- 87Rendering: Chart: Find point clusters: cluster hulls. 21 rows id b0838907-a5b3-4291-a133-b10070ed11e2
- 88Rendering: Chart: Find point clusters: Reefer points. 2 rows id 48f1af69-f4c6-47e6-8abc-8446516aa1d4
- 89Rendering: Chart: Find point clusters: cluster hulls. 1 rows id af3b81f5-c016-4188-b386-92ea2a114c05
- 90Rendering: Chart: Find point clusters: Truck gate transactions. 2 rows id 02ef40c4-d23f-469d-9642-cd2ce224ab92
- 91Rendering: Chart: Find point clusters: cluster hulls. 1 rows id a98e736d-3cef-4702-b752-a48fbdb6aae0
- 92Rendering: Chart: Find outliers: Yard zones. 30 rows id 541a4d8b-35b0-4173-bcb5-dc8e44799584
- 93Rendering: Chart: Find point clusters: Truck gate transactions over time. 84 rows id 0d7f5f66-2a85-42ef-afd5-8e2199b7ce13
- 94Rendering: Chart: Find point clusters: Equipment faults over time. 72 rows id 20cbdbcd-ad36-425d-bf0b-882a13e227c1
- 95Rendering: Chart: Hot spot analysis: Truck gate transactions over time. 84 rows id ec4ea6d1-51eb-4752-a16b-09089bacdbc1
- 96Rendering: Chart: Repeat and near repeat classification: Equipment faults over time. 72 rows id 68dec16f-9994-47b6-adc7-092e4a8fd561
- 97Dataset: Berths. vector, 14 rows id b0a0ad32-bfd0-4c8e-9ddc-69c28f08c5fc
- 98Dataset: Yard zones. vector, 30 rows id 027eb1a0-c68d-4feb-9829-95445b227889
- 99Dataset: Gates. vector, 4 rows id 90230a02-a91e-47db-a1a6-07158b5ac6ff
- 100Dataset: Cranes. vector, 40 rows id 9f1702b0-8b5f-42d9-906b-ccfcb711f325
- 101Dataset: Reefer points. vector, 100 rows id 919ddf4e-8fe1-45fa-8f67-e26838b7ad21
- 102Dataset: Terminal roads. vector, 10 rows id a3a782c1-8c1e-45a2-a7f8-567f739ed72e
- 103Dataset: Terminal performance report. document, ? rows id 472b5c54-0433-4a12-b317-9330dcea7237
- 104Record: Sample: Ports and maritime operations, Rotterdam id 20fafc67-4c16-4f65-b17e-a469aa483b5a
- 105Layer: Emerging hot spots: Equipment faults. 22 features id 9e848a96-211c-42c6-8111-c36d32d9b5ba
- 106Layer: Emerging hot spots: Truck gate transactions. 111 features id a25ac4ad-fb45-40ac-b4b0-8549519e388c
- 107Layer: Repeat and near repeat classification: Equipment faults. 260 features id 05d505e6-94c9-4f7f-a8bd-d670658aae52
- 108Layer: Summarize within: Yard zones. 30 features id 1ab59bc5-6bfa-4c26-a4b5-f2b4101e7e3c
- 109Layer: Summarize within: Yard zones. 30 features id f570abd5-8269-4ef5-997b-152e35b6a60c
- 110Layer: Summarize within: Yard zones. 30 features id 010c891b-7159-4cac-8e7d-1b1db568f2c2
- 111Layer: Hot spot analysis: Equipment faults. 41 features id 4be3ee60-4d27-44b9-84ca-a6ab6f7c118c
- 112Layer: Hot spot analysis: Reefer points. 62 features id ecbf7402-7f8f-4356-841c-ec83c0107fbd
- 113Layer: Hot spot analysis: Truck gate transactions. 2,000 features id 63163d00-359d-492c-ad25-47d7fc65b7fa
- 114Layer: Calculate density: Equipment faults. 284 features id 6bd3f696-e942-4dd9-82b7-890891595182
- 115Layer: Calculate density: Reefer points. 425 features id d1114715-a70e-4df2-9ada-9f59d71f2f47
- 116Layer: Calculate density: Truck gate transactions. 4,119 features id 42c683d3-2380-4817-9147-97b54c2e9c09
- 117Layer: Find point clusters: Equipment faults. 260 features id c93af5f3-3198-4b3f-a55d-c6481bf8bca7
- 118Layer: Find point clusters: cluster hulls. 21 features id 4ad1b5b1-c112-4fa3-a32e-c1b8566e5741
- 119Layer: Find point clusters: Reefer points. 100 features id 4805f4c5-7373-4344-8545-8096d0c57dfc
- 120Layer: Find point clusters: cluster hulls. 1 features id 7547f64d-c473-4777-a154-a4bbd5da8e55
- 121Layer: Find point clusters: Truck gate transactions. 2,000 features id 7942997a-54cb-4243-a85b-1f52e888ea1f
- 122Layer: Find point clusters: cluster hulls. 1 features id a6e216aa-3fe3-415f-8203-97d68a4d585e
- 123Layer: Find outliers: Yard zones. 30 features id 9c813e1c-474b-49f0-b77b-2da7ee92ad72
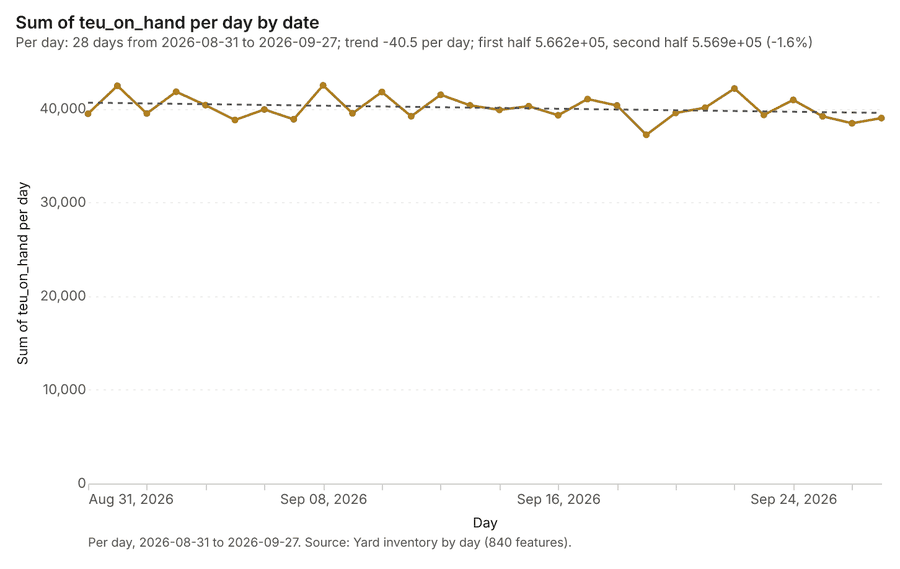
- 124Document: Terminal performance report, September 2026 id 19bbd774-bf04-4db6-8cef-b792a24d56f8
Appendix: the data behind the chartsShow
Figure 1. Timeline: events per week by dataset 1
| period | series | value |
|---|---|---|
| 2026-03-30 | Truck gate transactions | 0 |
| 2026-03-30 | Yard inventory by day | 0 |
| 2026-03-30 | Berth calls | 14 |
| 2026-03-30 | Equipment faults | 0 |
| 2026-04-06 | Truck gate transactions | 0 |
| 2026-04-06 | Yard inventory by day | 0 |
| 2026-04-06 | Berth calls | 17 |
| 2026-04-06 | Equipment faults | 0 |
| 2026-04-13 | Truck gate transactions | 0 |
| 2026-04-13 | Yard inventory by day | 0 |
| 2026-04-13 | Berth calls | 22 |
| 2026-04-13 | Equipment faults | 0 |
| 2026-04-20 | Truck gate transactions | 0 |
| 2026-04-20 | Yard inventory by day | 0 |
| 2026-04-20 | Berth calls | 12 |
| 2026-04-20 | Equipment faults | 0 |
| 2026-04-27 | Truck gate transactions | 0 |
| 2026-04-27 | Yard inventory by day | 0 |
| 2026-04-27 | Berth calls | 8 |
| 2026-04-27 | Equipment faults | 0 |
| 2026-05-04 | Truck gate transactions | 0 |
| 2026-05-04 | Yard inventory by day | 0 |
| 2026-05-04 | Berth calls | 15 |
| 2026-05-04 | Equipment faults | 0 |
| 2026-05-11 | Truck gate transactions | 0 |
| 2026-05-11 | Yard inventory by day | 0 |
| 2026-05-11 | Berth calls | 12 |
| 2026-05-11 | Equipment faults | 0 |
| 2026-05-18 | Truck gate transactions | 0 |
| 2026-05-18 | Yard inventory by day | 0 |
| 2026-05-18 | Berth calls | 14 |
| 2026-05-18 | Equipment faults | 0 |
| 2026-05-25 | Truck gate transactions | 0 |
| 2026-05-25 | Yard inventory by day | 0 |
| 2026-05-25 | Berth calls | 14 |
| 2026-05-25 | Equipment faults | 0 |
| 2026-06-01 | Truck gate transactions | 0 |
| 2026-06-01 | Yard inventory by day | 0 |
| 2026-06-01 | Berth calls | 12 |
| 2026-06-01 | Equipment faults | 14 |
| 2026-06-08 | Truck gate transactions | 0 |
| 2026-06-08 | Yard inventory by day | 0 |
| 2026-06-08 | Berth calls | 11 |
| 2026-06-08 | Equipment faults | 13 |
| 2026-06-15 | Truck gate transactions | 0 |
| 2026-06-15 | Yard inventory by day | 0 |
| 2026-06-15 | Berth calls | 19 |
| 2026-06-15 | Equipment faults | 17 |
| 2026-06-22 | Truck gate transactions | 0 |
| 2026-06-22 | Yard inventory by day | 0 |
| 2026-06-22 | Berth calls | 11 |
| 2026-06-22 | Equipment faults | 11 |
| 2026-06-29 | Truck gate transactions | 0 |
| 2026-06-29 | Yard inventory by day | 0 |
| 2026-06-29 | Berth calls | 12 |
| 2026-06-29 | Equipment faults | 21 |
| 2026-07-06 | Truck gate transactions | 0 |
| 2026-07-06 | Yard inventory by day | 0 |
| 2026-07-06 | Berth calls | 15 |
| 2026-07-06 | Equipment faults | 14 |
| 2026-07-13 | Truck gate transactions | 0 |
| 2026-07-13 | Yard inventory by day | 0 |
| 2026-07-13 | Berth calls | 13 |
| 2026-07-13 | Equipment faults | 21 |
| 2026-07-20 | Truck gate transactions | 0 |
| 2026-07-20 | Yard inventory by day | 0 |
| 2026-07-20 | Berth calls | 16 |
| 2026-07-20 | Equipment faults | 15 |
| 2026-07-27 | Truck gate transactions | 0 |
| 2026-07-27 | Yard inventory by day | 0 |
| 2026-07-27 | Berth calls | 14 |
| 2026-07-27 | Equipment faults | 14 |
| 2026-08-03 | Truck gate transactions | 0 |
| 2026-08-03 | Yard inventory by day | 0 |
| 2026-08-03 | Berth calls | 13 |
| 2026-08-03 | Equipment faults | 15 |
| 2026-08-10 | Truck gate transactions | 0 |
| 2026-08-10 | Yard inventory by day | 0 |
| 2026-08-10 | Berth calls | 13 |
| 2026-08-10 | Equipment faults | 8 |
| 2026-08-17 | Truck gate transactions | 0 |
| 2026-08-17 | Yard inventory by day | 0 |
| 2026-08-17 | Berth calls | 10 |
| 2026-08-17 | Equipment faults | 17 |
| 2026-08-24 | Truck gate transactions | 0 |
| 2026-08-24 | Yard inventory by day | 0 |
| 2026-08-24 | Berth calls | 8 |
| 2026-08-24 | Equipment faults | 17 |
| 2026-08-31 | Truck gate transactions | 519 |
| 2026-08-31 | Yard inventory by day | 210 |
| 2026-08-31 | Berth calls | 15 |
| 2026-08-31 | Equipment faults | 9 |
| 2026-09-07 | Truck gate transactions | 519 |
| 2026-09-07 | Yard inventory by day | 210 |
| 2026-09-07 | Berth calls | 18 |
| 2026-09-07 | Equipment faults | 15 |
| 2026-09-14 | Truck gate transactions | 468 |
| 2026-09-14 | Yard inventory by day | 210 |
| 2026-09-14 | Berth calls | 15 |
| 2026-09-14 | Equipment faults | 21 |
| 2026-09-21 | Truck gate transactions | 494 |
| 2026-09-21 | Yard inventory by day | 210 |
| 2026-09-21 | Berth calls | 12 |
| 2026-09-21 | Equipment faults | 13 |
| 2026-09-28 | Truck gate transactions | 0 |
| 2026-09-28 | Yard inventory by day | 0 |
| 2026-09-28 | Berth calls | 5 |
| 2026-09-28 | Equipment faults | 5 |
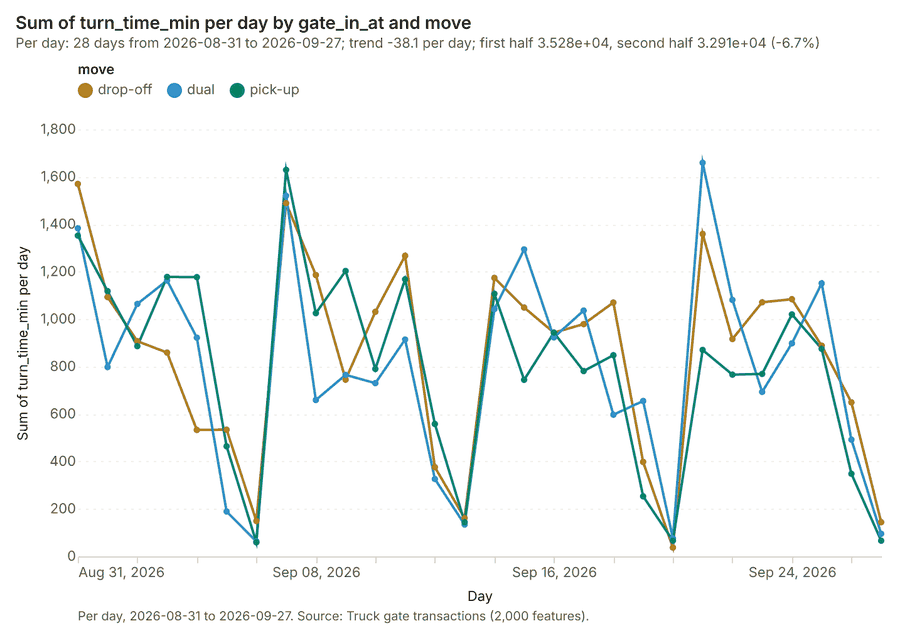
Figure 22. Truck gate transactions over time (turn_time_min) 70
| period | series | value |
|---|---|---|
| 2026-08-31 | drop-off | 1,570 |
| 2026-08-31 | dual | 1,383 |
| 2026-08-31 | pick-up | 1,352 |
| 2026-09-01 | drop-off | 1,093 |
| 2026-09-01 | dual | 798 |
| 2026-09-01 | pick-up | 1,118 |
| 2026-09-02 | drop-off | 907 |
| 2026-09-02 | dual | 1,064 |
| 2026-09-02 | pick-up | 886 |
| 2026-09-03 | drop-off | 859 |
| 2026-09-03 | dual | 1,163 |
| 2026-09-03 | pick-up | 1,178 |
| 2026-09-04 | drop-off | 533 |
| 2026-09-04 | dual | 922 |
| 2026-09-04 | pick-up | 1,177 |
| 2026-09-05 | drop-off | 534 |
| 2026-09-05 | dual | 189 |
| 2026-09-05 | pick-up | 464 |
| 2026-09-06 | drop-off | 149 |
| 2026-09-06 | dual | 63 |
| 2026-09-06 | pick-up | 59 |
| 2026-09-07 | drop-off | 1,489 |
| 2026-09-07 | dual | 1,520 |
| 2026-09-07 | pick-up | 1,629 |
| 2026-09-08 | drop-off | 1,186 |
| 2026-09-08 | dual | 659 |
| 2026-09-08 | pick-up | 1,025 |
| 2026-09-09 | drop-off | 745 |
| 2026-09-09 | dual | 765 |
| 2026-09-09 | pick-up | 1,203 |
| 2026-09-10 | drop-off | 1,031 |
| 2026-09-10 | dual | 730 |
| 2026-09-10 | pick-up | 790 |
| 2026-09-11 | drop-off | 1,267 |
| 2026-09-11 | dual | 914 |
| 2026-09-11 | pick-up | 1,168 |
| 2026-09-12 | drop-off | 376 |
| 2026-09-12 | dual | 326 |
| 2026-09-12 | pick-up | 558 |
| 2026-09-13 | drop-off | 161 |
| 2026-09-13 | dual | 134 |
| 2026-09-13 | pick-up | 144 |
| 2026-09-14 | drop-off | 1,174 |
| 2026-09-14 | dual | 1,042 |
| 2026-09-14 | pick-up | 1,107 |
| 2026-09-15 | drop-off | 1,049 |
| 2026-09-15 | dual | 1,294 |
| 2026-09-15 | pick-up | 744 |
| 2026-09-16 | drop-off | 943 |
| 2026-09-16 | dual | 923 |
| 2026-09-16 | pick-up | 943 |
| 2026-09-17 | drop-off | 979 |
| 2026-09-17 | dual | 1,036 |
| 2026-09-17 | pick-up | 781 |
| 2026-09-18 | drop-off | 1,070 |
| 2026-09-18 | dual | 597 |
| 2026-09-18 | pick-up | 848 |
| 2026-09-19 | drop-off | 398 |
| 2026-09-19 | dual | 655 |
| 2026-09-19 | pick-up | 253 |
| 2026-09-20 | drop-off | 37 |
| 2026-09-20 | dual | 76 |
| 2026-09-20 | pick-up | 66 |
| 2026-09-21 | drop-off | 1,359 |
| 2026-09-21 | dual | 1,659 |
| 2026-09-21 | pick-up | 870 |
| 2026-09-22 | drop-off | 916 |
| 2026-09-22 | dual | 1,081 |
| 2026-09-22 | pick-up | 766 |
| 2026-09-23 | drop-off | 1,071 |
| 2026-09-23 | dual | 693 |
| 2026-09-23 | pick-up | 769 |
| 2026-09-24 | drop-off | 1,084 |
| 2026-09-24 | dual | 898 |
| 2026-09-24 | pick-up | 1,020 |
| 2026-09-25 | drop-off | 888 |
| 2026-09-25 | dual | 1,151 |
| 2026-09-25 | pick-up | 875 |
| 2026-09-26 | drop-off | 649 |
| 2026-09-26 | dual | 492 |
| 2026-09-26 | pick-up | 348 |
| 2026-09-27 | drop-off | 144 |
| 2026-09-27 | dual | 95 |
| 2026-09-27 | pick-up | 66 |
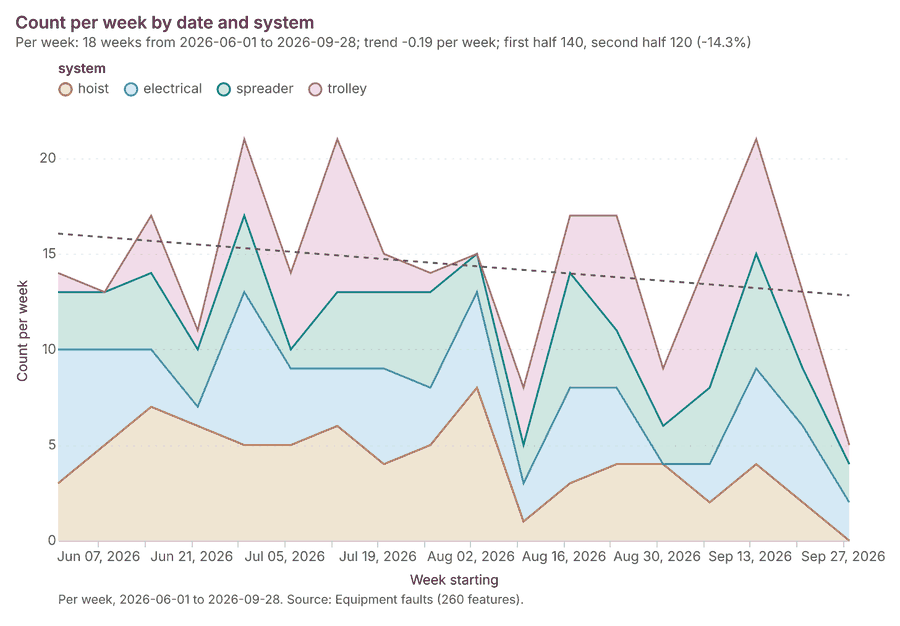
Figure 23. Equipment faults over time (date) 71
| period | series | value |
|---|---|---|
| 2026-06-01 | hoist | 3 |
| 2026-06-01 | electrical | 7 |
| 2026-06-01 | spreader | 3 |
| 2026-06-01 | trolley | 1 |
| 2026-06-08 | hoist | 5 |
| 2026-06-08 | electrical | 5 |
| 2026-06-08 | spreader | 3 |
| 2026-06-08 | trolley | 0 |
| 2026-06-15 | hoist | 7 |
| 2026-06-15 | electrical | 3 |
| 2026-06-15 | spreader | 4 |
| 2026-06-15 | trolley | 3 |
| 2026-06-22 | hoist | 6 |
| 2026-06-22 | electrical | 1 |
| 2026-06-22 | spreader | 3 |
| 2026-06-22 | trolley | 1 |
| 2026-06-29 | hoist | 5 |
| 2026-06-29 | electrical | 8 |
| 2026-06-29 | spreader | 4 |
| 2026-06-29 | trolley | 4 |
| 2026-07-06 | hoist | 5 |
| 2026-07-06 | electrical | 4 |
| 2026-07-06 | spreader | 1 |
| 2026-07-06 | trolley | 4 |
| 2026-07-13 | hoist | 6 |
| 2026-07-13 | electrical | 3 |
| 2026-07-13 | spreader | 4 |
| 2026-07-13 | trolley | 8 |
| 2026-07-20 | hoist | 4 |
| 2026-07-20 | electrical | 5 |
| 2026-07-20 | spreader | 4 |
| 2026-07-20 | trolley | 2 |
| 2026-07-27 | hoist | 5 |
| 2026-07-27 | electrical | 3 |
| 2026-07-27 | spreader | 5 |
| 2026-07-27 | trolley | 1 |
| 2026-08-03 | hoist | 8 |
| 2026-08-03 | electrical | 5 |
| 2026-08-03 | spreader | 2 |
| 2026-08-03 | trolley | 0 |
| 2026-08-10 | hoist | 1 |
| 2026-08-10 | electrical | 2 |
| 2026-08-10 | spreader | 2 |
| 2026-08-10 | trolley | 3 |
| 2026-08-17 | hoist | 3 |
| 2026-08-17 | electrical | 5 |
| 2026-08-17 | spreader | 6 |
| 2026-08-17 | trolley | 3 |
| 2026-08-24 | hoist | 4 |
| 2026-08-24 | electrical | 4 |
| 2026-08-24 | spreader | 3 |
| 2026-08-24 | trolley | 6 |
| 2026-08-31 | hoist | 4 |
| 2026-08-31 | electrical | 0 |
| 2026-08-31 | spreader | 2 |
| 2026-08-31 | trolley | 3 |
| 2026-09-07 | hoist | 2 |
| 2026-09-07 | electrical | 2 |
| 2026-09-07 | spreader | 4 |
| 2026-09-07 | trolley | 7 |
| 2026-09-14 | hoist | 4 |
| 2026-09-14 | electrical | 5 |
| 2026-09-14 | spreader | 6 |
| 2026-09-14 | trolley | 6 |
| 2026-09-21 | hoist | 2 |
| 2026-09-21 | electrical | 4 |
| 2026-09-21 | spreader | 3 |
| 2026-09-21 | trolley | 4 |
| 2026-09-28 | hoist | 0 |
| 2026-09-28 | electrical | 2 |
| 2026-09-28 | spreader | 2 |
| 2026-09-28 | trolley | 1 |
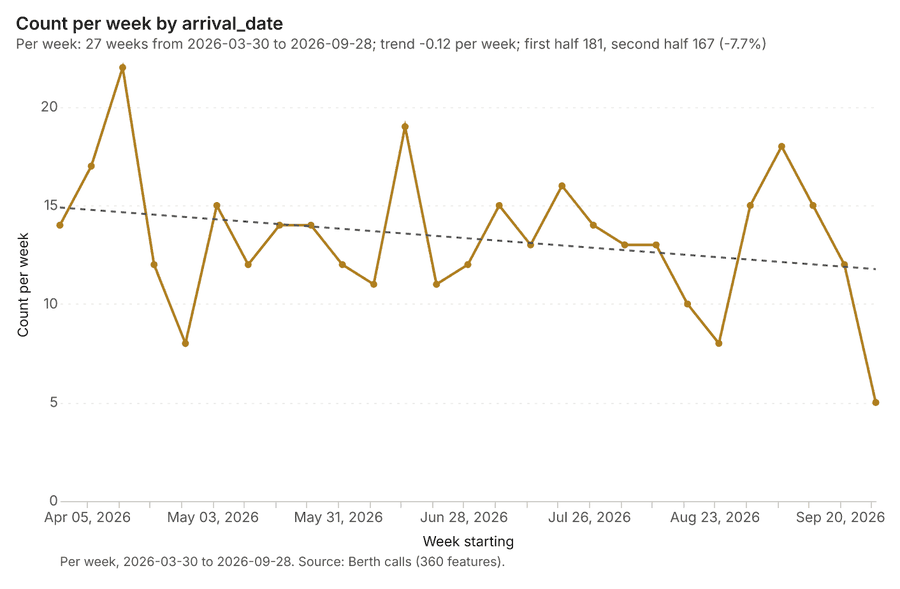
Figure 24. Berth calls over time (arrival_date) 72
| period | value |
|---|---|
| 2026-03-30 | 14 |
| 2026-04-06 | 17 |
| 2026-04-13 | 22 |
| 2026-04-20 | 12 |
| 2026-04-27 | 8 |
| 2026-05-04 | 15 |
| 2026-05-11 | 12 |
| 2026-05-18 | 14 |
| 2026-05-25 | 14 |
| 2026-06-01 | 12 |
| 2026-06-08 | 11 |
| 2026-06-15 | 19 |
| 2026-06-22 | 11 |
| 2026-06-29 | 12 |
| 2026-07-06 | 15 |
| 2026-07-13 | 13 |
| 2026-07-20 | 16 |
| 2026-07-27 | 14 |
| 2026-08-03 | 13 |
| 2026-08-10 | 13 |
| 2026-08-17 | 10 |
| 2026-08-24 | 8 |
| 2026-08-31 | 15 |
| 2026-09-07 | 18 |
| 2026-09-14 | 15 |
| 2026-09-21 | 12 |
| 2026-09-28 | 5 |
Figure 25. Yard inventory by day over time (date) 73
| period | value |
|---|---|
| 2026-08-31 | 3.947e+04 |
| 2026-09-01 | 4.246e+04 |
| 2026-09-02 | 3.95e+04 |
| 2026-09-03 | 4.182e+04 |
| 2026-09-04 | 4.039e+04 |
| 2026-09-05 | 3.88e+04 |
| 2026-09-06 | 3.993e+04 |
| 2026-09-07 | 3.888e+04 |
| 2026-09-08 | 4.25e+04 |
| 2026-09-09 | 3.952e+04 |
| 2026-09-10 | 4.18e+04 |
| 2026-09-11 | 3.92e+04 |
| 2026-09-12 | 4.15e+04 |
| 2026-09-13 | 4.037e+04 |
| 2026-09-14 | 3.989e+04 |
| 2026-09-15 | 4.028e+04 |
| 2026-09-16 | 3.931e+04 |
| 2026-09-17 | 4.104e+04 |
| 2026-09-18 | 4.035e+04 |
| 2026-09-19 | 3.723e+04 |
| 2026-09-20 | 3.956e+04 |
| 2026-09-21 | 4.011e+04 |
| 2026-09-22 | 4.217e+04 |
| 2026-09-23 | 3.935e+04 |
| 2026-09-24 | 4.095e+04 |
| 2026-09-25 | 3.92e+04 |
| 2026-09-26 | 3.846e+04 |
| 2026-09-27 | 3.901e+04 |
Figure 26. Emerging hot spots: Equipment faults 74
| bin_start | bin_end | count |
|---|---|---|
| -1.19 | -0.9547 | 3 |
| -0.9547 | -0.7193 | 0 |
| -0.7193 | -0.484 | 8 |
| -0.484 | -0.2487 | 1 |
| -0.2487 | -0.01333 | 8 |
| -0.01333 | 0.222 | 2 |
Figure 27. Emerging hot spots: Truck gate transactions 75
| bin_start | bin_end | count |
|---|---|---|
| -1.113 | -0.9698 | 65 |
| -0.9698 | -0.8265 | 2 |
| -0.8265 | -0.6833 | 25 |
| -0.6833 | -0.54 | 9 |
| -0.54 | -0.3967 | 1 |
| -0.3967 | -0.2535 | 4 |
| -0.2535 | -0.1103 | 1 |
| -0.1103 | 0.033 | 4 |
Figure 28. Repeat and near repeat classification: Equipment faults 76
| period | series | value |
|---|---|---|
| 2026-06-01 | hoist | 3 |
| 2026-06-01 | electrical | 7 |
| 2026-06-01 | spreader | 3 |
| 2026-06-01 | trolley | 1 |
| 2026-06-08 | hoist | 5 |
| 2026-06-08 | electrical | 5 |
| 2026-06-08 | spreader | 3 |
| 2026-06-08 | trolley | 0 |
| 2026-06-15 | hoist | 7 |
| 2026-06-15 | electrical | 3 |
| 2026-06-15 | spreader | 4 |
| 2026-06-15 | trolley | 3 |
| 2026-06-22 | hoist | 6 |
| 2026-06-22 | electrical | 1 |
| 2026-06-22 | spreader | 3 |
| 2026-06-22 | trolley | 1 |
| 2026-06-29 | hoist | 5 |
| 2026-06-29 | electrical | 8 |
| 2026-06-29 | spreader | 4 |
| 2026-06-29 | trolley | 4 |
| 2026-07-06 | hoist | 5 |
| 2026-07-06 | electrical | 4 |
| 2026-07-06 | spreader | 1 |
| 2026-07-06 | trolley | 4 |
| 2026-07-13 | hoist | 6 |
| 2026-07-13 | electrical | 3 |
| 2026-07-13 | spreader | 4 |
| 2026-07-13 | trolley | 8 |
| 2026-07-20 | hoist | 4 |
| 2026-07-20 | electrical | 5 |
| 2026-07-20 | spreader | 4 |
| 2026-07-20 | trolley | 2 |
| 2026-07-27 | hoist | 5 |
| 2026-07-27 | electrical | 3 |
| 2026-07-27 | spreader | 5 |
| 2026-07-27 | trolley | 1 |
| 2026-08-03 | hoist | 8 |
| 2026-08-03 | electrical | 5 |
| 2026-08-03 | spreader | 2 |
| 2026-08-03 | trolley | 0 |
| 2026-08-10 | hoist | 1 |
| 2026-08-10 | electrical | 2 |
| 2026-08-10 | spreader | 2 |
| 2026-08-10 | trolley | 3 |
| 2026-08-17 | hoist | 3 |
| 2026-08-17 | electrical | 5 |
| 2026-08-17 | spreader | 6 |
| 2026-08-17 | trolley | 3 |
| 2026-08-24 | hoist | 4 |
| 2026-08-24 | electrical | 4 |
| 2026-08-24 | spreader | 3 |
| 2026-08-24 | trolley | 6 |
| 2026-08-31 | hoist | 4 |
| 2026-08-31 | electrical | 0 |
| 2026-08-31 | spreader | 2 |
| 2026-08-31 | trolley | 3 |
| 2026-09-07 | hoist | 2 |
| 2026-09-07 | electrical | 2 |
| 2026-09-07 | spreader | 4 |
| 2026-09-07 | trolley | 7 |
| 2026-09-14 | hoist | 4 |
| 2026-09-14 | electrical | 5 |
| 2026-09-14 | spreader | 6 |
| 2026-09-14 | trolley | 6 |
| 2026-09-21 | hoist | 2 |
| 2026-09-21 | electrical | 4 |
| 2026-09-21 | spreader | 3 |
| 2026-09-21 | trolley | 4 |
| 2026-09-28 | hoist | 0 |
| 2026-09-28 | electrical | 2 |
| 2026-09-28 | spreader | 2 |
| 2026-09-28 | trolley | 1 |
Figure 29. Summarize within: Yard zones 77
| bin_start | bin_end | count |
|---|---|---|
| 1,034 | 1,295 | 7 |
| 1,295 | 1,556 | 5 |
| 1,556 | 1,816 | 2 |
| 1,816 | 2,077 | 2 |
| 2,077 | 2,338 | 5 |
| 2,338 | 2,599 | 9 |
Figure 30. Summarize within: Yard zones 78
| bin_start | bin_end | count |
|---|---|---|
| 1,034 | 1,295 | 7 |
| 1,295 | 1,556 | 5 |
| 1,556 | 1,816 | 2 |
| 1,816 | 2,077 | 2 |
| 2,077 | 2,338 | 5 |
| 2,338 | 2,599 | 9 |
Figure 31. Summarize within: Yard zones 79
| bin_start | bin_end | count |
|---|---|---|
| 43 | 107 | 29 |
| 107 | 171 | 0 |
| 171 | 235 | 0 |
| 235 | 299 | 0 |
| 299 | 363 | 0 |
| 363 | 427 | 1 |
Figure 32. Hot spot analysis: Equipment faults 80
| bin_start | bin_end | band | band_label | count |
|---|---|---|---|---|
| -1 | -0.5 | not_significant | Not significant | 18 |
| -0.5 | 0 | not_significant | Not significant | 5 |
| 0 | 0.5 | not_significant | Not significant | 6 |
| 0.5 | 1 | not_significant | Not significant | 2 |
| 1 | 1.5 | not_significant | Not significant | 6 |
| 1.5 | 2 | hot_90 | Hot spot, 90% confidence | 1 |
| 1.5 | 2 | not_significant | Not significant | 2 |
| 2 | 2.5 | hot_95 | Hot spot, 95% confidence | 1 |
Figure 33. Hot spot analysis: Reefer points 81
| bin_start | bin_end | band | band_label | count |
|---|---|---|---|---|
| -2 | -1.5 | cold_90 | Cold spot, 90% confidence | 2 |
| -1.5 | -1 | not_significant | Not significant | 4 |
| -1 | -0.5 | not_significant | Not significant | 11 |
| -0.5 | 0 | not_significant | Not significant | 4 |
| 0 | 0.5 | not_significant | Not significant | 17 |
| 0.5 | 1 | not_significant | Not significant | 11 |
| 1 | 1.5 | not_significant | Not significant | 9 |
| 1.5 | 2 | hot_90 | Hot spot, 90% confidence | 3 |
| 1.5 | 2 | not_significant | Not significant | 1 |
Figure 34. Hot spot analysis: Truck gate transactions 82
| bin_start | bin_end | band | band_label | count |
|---|---|---|---|---|
| -2.5 | -2 | cold_95 | Cold spot, 95% confidence | 34 |
| -2 | -1.5 | cold_90 | Cold spot, 90% confidence | 94 |
| -2 | -1.5 | cold_95 | Cold spot, 95% confidence | 9 |
| -2 | -1.5 | not_significant | Not significant | 50 |
| -1.5 | -1 | not_significant | Not significant | 246 |
| -1 | -0.5 | not_significant | Not significant | 383 |
| -0.5 | 0 | not_significant | Not significant | 325 |
| 0 | 0.5 | not_significant | Not significant | 224 |
| 0.5 | 1 | not_significant | Not significant | 101 |
| 1 | 1.5 | not_significant | Not significant | 62 |
| 1.5 | 2 | hot_90 | Hot spot, 90% confidence | 36 |
| 1.5 | 2 | hot_95 | Hot spot, 95% confidence | 3 |
| 1.5 | 2 | not_significant | Not significant | 14 |
| 2 | 2.5 | hot_95 | Hot spot, 95% confidence | 39 |
| 2.5 | 3 | hot_95 | Hot spot, 95% confidence | 5 |
| 2.5 | 3 | hot_99 | Hot spot, 99% confidence | 24 |
| 3 | 3.5 | hot_99 | Hot spot, 99% confidence | 32 |
| 3.5 | 4 | hot_99 | Hot spot, 99% confidence | 39 |
| 4 | 4.5 | hot_99 | Hot spot, 99% confidence | 54 |
| 4.5 | 5 | hot_99 | Hot spot, 99% confidence | 66 |
| 5 | 5.5 | hot_99 | Hot spot, 99% confidence | 55 |
| 5.5 | 6 | hot_99 | Hot spot, 99% confidence | 64 |
| 6 | 6.5 | hot_99 | Hot spot, 99% confidence | 32 |
| 6.5 | 7 | hot_99 | Hot spot, 99% confidence | 9 |
Figure 35. Calculate density: Equipment faults 83
| bin_start | bin_end | count |
|---|---|---|
| 0 | 2.4 | 26 |
| 2.4 | 4.8 | 18 |
| 4.8 | 7.2 | 37 |
| 7.2 | 9.6 | 30 |
| 9.6 | 12 | 30 |
| 12 | 14.4 | 34 |
| 14.4 | 16.8 | 24 |
| 16.8 | 19.2 | 42 |
| 19.2 | 21.6 | 26 |
| 21.6 | 24 | 17 |
Figure 36. Calculate density: Reefer points 84
| bin_start | bin_end | count |
|---|---|---|
| 0 | 2.4 | 35 |
| 2.4 | 4.8 | 34 |
| 4.8 | 7.2 | 57 |
| 7.2 | 9.6 | 35 |
| 9.6 | 12 | 38 |
| 12 | 14.4 | 55 |
| 14.4 | 16.8 | 36 |
| 16.8 | 19.2 | 56 |
| 19.2 | 21.6 | 37 |
| 21.6 | 24 | 42 |
Figure 37. Calculate density: Truck gate transactions 85
| bin_start | bin_end | count |
|---|---|---|
| 0 | 6.857 | 272 |
| 6.857 | 13.71 | 300 |
| 13.71 | 20.57 | 303 |
| 20.57 | 27.43 | 302 |
| 27.43 | 34.29 | 290 |
| 34.29 | 41.14 | 300 |
| 41.14 | 48 | 260 |
| 48 | 54.86 | 305 |
| 54.86 | 61.71 | 303 |
| 61.71 | 68.57 | 296 |
| 68.57 | 75.43 | 306 |
| 75.43 | 82.29 | 300 |
| 82.29 | 89.14 | 300 |
| 89.14 | 96 | 282 |
Figure 38. Find point clusters: Equipment faults 86
| cluster | features | fraction | share |
|---|---|---|---|
| Noise | 36 | 0.1385 | 13.8% |
| 7 | 20 | 0.07692 | 7.7% |
| 18 | 15 | 0.05769 | 5.8% |
| 2 | 14 | 0.05385 | 5.4% |
| 5 | 14 | 0.05385 | 5.4% |
| 8 | 14 | 0.05385 | 5.4% |
| 9 | 13 | 0.05 | 5.0% |
| 1 | 12 | 0.04615 | 4.6% |
| 14 | 12 | 0.04615 | 4.6% |
| 16 | 12 | 0.04615 | 4.6% |
| 12 | 11 | 0.04231 | 4.2% |
| 13 | 10 | 0.03846 | 3.8% |
| 11 | 9 | 0.03461 | 3.5% |
| 3 | 9 | 0.03461 | 3.5% |
| 4 | 9 | 0.03461 | 3.5% |
| 6 | 9 | 0.03461 | 3.5% |
| 10 | 8 | 0.03077 | 3.1% |
| 17 | 8 | 0.03077 | 3.1% |
| 15 | 7 | 0.02692 | 2.7% |
| 0 | 6 | 0.02308 | 2.3% |
| 19 | 6 | 0.02308 | 2.3% |
| 20 | 6 | 0.02308 | 2.3% |
Figure 39. Find point clusters: cluster hulls 87
| cluster | features | fraction | share |
|---|---|---|---|
| 0 | 1 | 0.04762 | 4.8% |
| 1 | 1 | 0.04762 | 4.8% |
| 10 | 1 | 0.04762 | 4.8% |
| 11 | 1 | 0.04762 | 4.8% |
| 12 | 1 | 0.04762 | 4.8% |
| 13 | 1 | 0.04762 | 4.8% |
| 14 | 1 | 0.04762 | 4.8% |
| 15 | 1 | 0.04762 | 4.8% |
| 16 | 1 | 0.04762 | 4.8% |
| 17 | 1 | 0.04762 | 4.8% |
| 18 | 1 | 0.04762 | 4.8% |
| 19 | 1 | 0.04762 | 4.8% |
| 2 | 1 | 0.04762 | 4.8% |
| 20 | 1 | 0.04762 | 4.8% |
| 3 | 1 | 0.04762 | 4.8% |
| 4 | 1 | 0.04762 | 4.8% |
| 5 | 1 | 0.04762 | 4.8% |
| 6 | 1 | 0.04762 | 4.8% |
| 7 | 1 | 0.04762 | 4.8% |
| 8 | 1 | 0.04762 | 4.8% |
| 9 | 1 | 0.04762 | 4.8% |
Figure 40. Find point clusters: Reefer points 88
| cluster | features | fraction | share |
|---|---|---|---|
| 0 | 96 | 0.96 | 96.0% |
| Noise | 4 | 0.04 | 4.0% |
Figure 41. Find point clusters: cluster hulls 89
| cluster | features | fraction | share |
|---|---|---|---|
| 0 | 1 | 1 | 100.0% |
Figure 42. Find point clusters: Truck gate transactions 90
| cluster | features | fraction | share |
|---|---|---|---|
| Noise | 1,549 | 0.7745 | 77.5% |
| 0 | 451 | 0.2255 | 22.6% |
Figure 43. Find point clusters: cluster hulls 91
| cluster | features | fraction | share |
|---|---|---|---|
| 0 | 1 | 1 | 100.0% |
Figure 44. Find outliers: Yard zones 92
| value | lag | type |
|---|---|---|
| 1.134 | 0.4513 | NS |
| 0.4513 | 0.2142 | NS |
| -0.7057 | 0.3413 | NS |
| 0.2313 | -0.9608 | NS |
| -1.216 | -0.4326 | NS |
| -1.096 | -0.1168 | NS |
| 0.9823 | -1.26 | NS |
| -1.425 | 0.3517 | NS |
| -0.2789 | -1.329 | NS |
| -1.233 | -0.2789 | NS |
| 0.6865 | -1.487 | NS |
| -1.487 | 0.7965 | NS |
| 0.9065 | -0.0997 | NS |
| 1.288 | 0.089 | NS |
| -0.7284 | 0.9615 | NS |
| 0.6352 | -0.829 | NS |
| -0.9295 | 0.7993 | NS |
| 0.9634 | -1.069 | NS |
| -1.208 | 0.7794 | NS |
| 0.5954 | -1.208 | NS |
| 1.384 | 1.329 | NS |
| 1.329 | 1.009 | NS |
| 0.6333 | 1.221 | NS |
| 1.113 | 0.2161 | NS |
| -0.2012 | 0.1867 | NS |
| -0.7398 | 0.5139 | NS |
| 1.229 | -0.8659 | NS |
| -0.9921 | -0.1775 | NS |
| -1.584 | -0.3652 | NS |
| 0.2616 | -1.584 | NS |
Figure 45. Find point clusters: Truck gate transactions over time 93
| period | series | value |
|---|---|---|
| 2026-08-31 | drop-off | 40 |
| 2026-08-31 | pick-up | 42 |
| 2026-08-31 | dual | 36 |
| 2026-09-01 | drop-off | 33 |
| 2026-09-01 | pick-up | 31 |
| 2026-09-01 | dual | 24 |
| 2026-09-02 | drop-off | 27 |
| 2026-09-02 | pick-up | 28 |
| 2026-09-02 | dual | 31 |
| 2026-09-03 | drop-off | 29 |
| 2026-09-03 | pick-up | 36 |
| 2026-09-03 | dual | 35 |
| 2026-09-04 | drop-off | 17 |
| 2026-09-04 | pick-up | 36 |
| 2026-09-04 | dual | 30 |
| 2026-09-05 | drop-off | 16 |
| 2026-09-05 | pick-up | 14 |
| 2026-09-05 | dual | 6 |
| 2026-09-06 | drop-off | 4 |
| 2026-09-06 | pick-up | 2 |
| 2026-09-06 | dual | 2 |
| 2026-09-07 | drop-off | 37 |
| 2026-09-07 | pick-up | 41 |
| 2026-09-07 | dual | 36 |
| 2026-09-08 | drop-off | 35 |
| 2026-09-08 | pick-up | 32 |
| 2026-09-08 | dual | 21 |
| 2026-09-09 | drop-off | 24 |
| 2026-09-09 | pick-up | 37 |
| 2026-09-09 | dual | 25 |
| 2026-09-10 | drop-off | 31 |
| 2026-09-10 | pick-up | 26 |
| 2026-09-10 | dual | 24 |
| 2026-09-11 | drop-off | 39 |
| 2026-09-11 | pick-up | 35 |
| 2026-09-11 | dual | 27 |
| 2026-09-12 | drop-off | 11 |
| 2026-09-12 | pick-up | 14 |
| 2026-09-12 | dual | 10 |
| 2026-09-13 | drop-off | 5 |
| 2026-09-13 | pick-up | 5 |
| 2026-09-13 | dual | 4 |
| 2026-09-14 | drop-off | 34 |
| 2026-09-14 | pick-up | 32 |
| 2026-09-14 | dual | 26 |
| 2026-09-15 | drop-off | 28 |
| 2026-09-15 | pick-up | 25 |
| 2026-09-15 | dual | 38 |
| 2026-09-16 | drop-off | 27 |
| 2026-09-16 | pick-up | 29 |
| 2026-09-16 | dual | 27 |
| 2026-09-17 | drop-off | 29 |
| 2026-09-17 | pick-up | 23 |
| 2026-09-17 | dual | 30 |
| 2026-09-18 | drop-off | 32 |
| 2026-09-18 | pick-up | 27 |
| 2026-09-18 | dual | 19 |
| 2026-09-19 | drop-off | 11 |
| 2026-09-19 | pick-up | 7 |
| 2026-09-19 | dual | 17 |
| 2026-09-20 | drop-off | 1 |
| 2026-09-20 | pick-up | 3 |
| 2026-09-20 | dual | 3 |
| 2026-09-21 | drop-off | 35 |
| 2026-09-21 | pick-up | 23 |
| 2026-09-21 | dual | 39 |
| 2026-09-22 | drop-off | 26 |
| 2026-09-22 | pick-up | 22 |
| 2026-09-22 | dual | 34 |
| 2026-09-23 | drop-off | 31 |
| 2026-09-23 | pick-up | 25 |
| 2026-09-23 | dual | 21 |
| 2026-09-24 | drop-off | 33 |
| 2026-09-24 | pick-up | 30 |
| 2026-09-24 | dual | 29 |
| 2026-09-25 | drop-off | 28 |
| 2026-09-25 | pick-up | 27 |
| 2026-09-25 | dual | 35 |
| 2026-09-26 | drop-off | 20 |
| 2026-09-26 | pick-up | 12 |
| 2026-09-26 | dual | 15 |
| 2026-09-27 | drop-off | 4 |
| 2026-09-27 | pick-up | 2 |
| 2026-09-27 | dual | 3 |
Figure 46. Find point clusters: Equipment faults over time 94
| period | series | value |
|---|---|---|
| 2026-06-01 | hoist | 3 |
| 2026-06-01 | electrical | 7 |
| 2026-06-01 | spreader | 3 |
| 2026-06-01 | trolley | 1 |
| 2026-06-08 | hoist | 5 |
| 2026-06-08 | electrical | 5 |
| 2026-06-08 | spreader | 3 |
| 2026-06-08 | trolley | 0 |
| 2026-06-15 | hoist | 7 |
| 2026-06-15 | electrical | 3 |
| 2026-06-15 | spreader | 4 |
| 2026-06-15 | trolley | 3 |
| 2026-06-22 | hoist | 6 |
| 2026-06-22 | electrical | 1 |
| 2026-06-22 | spreader | 3 |
| 2026-06-22 | trolley | 1 |
| 2026-06-29 | hoist | 5 |
| 2026-06-29 | electrical | 8 |
| 2026-06-29 | spreader | 4 |
| 2026-06-29 | trolley | 4 |
| 2026-07-06 | hoist | 5 |
| 2026-07-06 | electrical | 4 |
| 2026-07-06 | spreader | 1 |
| 2026-07-06 | trolley | 4 |
| 2026-07-13 | hoist | 6 |
| 2026-07-13 | electrical | 3 |
| 2026-07-13 | spreader | 4 |
| 2026-07-13 | trolley | 8 |
| 2026-07-20 | hoist | 4 |
| 2026-07-20 | electrical | 5 |
| 2026-07-20 | spreader | 4 |
| 2026-07-20 | trolley | 2 |
| 2026-07-27 | hoist | 5 |
| 2026-07-27 | electrical | 3 |
| 2026-07-27 | spreader | 5 |
| 2026-07-27 | trolley | 1 |
| 2026-08-03 | hoist | 8 |
| 2026-08-03 | electrical | 5 |
| 2026-08-03 | spreader | 2 |
| 2026-08-03 | trolley | 0 |
| 2026-08-10 | hoist | 1 |
| 2026-08-10 | electrical | 2 |
| 2026-08-10 | spreader | 2 |
| 2026-08-10 | trolley | 3 |
| 2026-08-17 | hoist | 3 |
| 2026-08-17 | electrical | 5 |
| 2026-08-17 | spreader | 6 |
| 2026-08-17 | trolley | 3 |
| 2026-08-24 | hoist | 4 |
| 2026-08-24 | electrical | 4 |
| 2026-08-24 | spreader | 3 |
| 2026-08-24 | trolley | 6 |
| 2026-08-31 | hoist | 4 |
| 2026-08-31 | electrical | 0 |
| 2026-08-31 | spreader | 2 |
| 2026-08-31 | trolley | 3 |
| 2026-09-07 | hoist | 2 |
| 2026-09-07 | electrical | 2 |
| 2026-09-07 | spreader | 4 |
| 2026-09-07 | trolley | 7 |
| 2026-09-14 | hoist | 4 |
| 2026-09-14 | electrical | 5 |
| 2026-09-14 | spreader | 6 |
| 2026-09-14 | trolley | 6 |
| 2026-09-21 | hoist | 2 |
| 2026-09-21 | electrical | 4 |
| 2026-09-21 | spreader | 3 |
| 2026-09-21 | trolley | 4 |
| 2026-09-28 | hoist | 0 |
| 2026-09-28 | electrical | 2 |
| 2026-09-28 | spreader | 2 |
| 2026-09-28 | trolley | 1 |
Figure 47. Hot spot analysis: Truck gate transactions over time 95
| period | series | value |
|---|---|---|
| 2026-08-31 | drop-off | 40 |
| 2026-08-31 | pick-up | 42 |
| 2026-08-31 | dual | 36 |
| 2026-09-01 | drop-off | 33 |
| 2026-09-01 | pick-up | 31 |
| 2026-09-01 | dual | 24 |
| 2026-09-02 | drop-off | 27 |
| 2026-09-02 | pick-up | 28 |
| 2026-09-02 | dual | 31 |
| 2026-09-03 | drop-off | 29 |
| 2026-09-03 | pick-up | 36 |
| 2026-09-03 | dual | 35 |
| 2026-09-04 | drop-off | 17 |
| 2026-09-04 | pick-up | 36 |
| 2026-09-04 | dual | 30 |
| 2026-09-05 | drop-off | 16 |
| 2026-09-05 | pick-up | 14 |
| 2026-09-05 | dual | 6 |
| 2026-09-06 | drop-off | 4 |
| 2026-09-06 | pick-up | 2 |
| 2026-09-06 | dual | 2 |
| 2026-09-07 | drop-off | 37 |
| 2026-09-07 | pick-up | 41 |
| 2026-09-07 | dual | 36 |
| 2026-09-08 | drop-off | 35 |
| 2026-09-08 | pick-up | 32 |
| 2026-09-08 | dual | 21 |
| 2026-09-09 | drop-off | 24 |
| 2026-09-09 | pick-up | 37 |
| 2026-09-09 | dual | 25 |
| 2026-09-10 | drop-off | 31 |
| 2026-09-10 | pick-up | 26 |
| 2026-09-10 | dual | 24 |
| 2026-09-11 | drop-off | 39 |
| 2026-09-11 | pick-up | 35 |
| 2026-09-11 | dual | 27 |
| 2026-09-12 | drop-off | 11 |
| 2026-09-12 | pick-up | 14 |
| 2026-09-12 | dual | 10 |
| 2026-09-13 | drop-off | 5 |
| 2026-09-13 | pick-up | 5 |
| 2026-09-13 | dual | 4 |
| 2026-09-14 | drop-off | 34 |
| 2026-09-14 | pick-up | 32 |
| 2026-09-14 | dual | 26 |
| 2026-09-15 | drop-off | 28 |
| 2026-09-15 | pick-up | 25 |
| 2026-09-15 | dual | 38 |
| 2026-09-16 | drop-off | 27 |
| 2026-09-16 | pick-up | 29 |
| 2026-09-16 | dual | 27 |
| 2026-09-17 | drop-off | 29 |
| 2026-09-17 | pick-up | 23 |
| 2026-09-17 | dual | 30 |
| 2026-09-18 | drop-off | 32 |
| 2026-09-18 | pick-up | 27 |
| 2026-09-18 | dual | 19 |
| 2026-09-19 | drop-off | 11 |
| 2026-09-19 | pick-up | 7 |
| 2026-09-19 | dual | 17 |
| 2026-09-20 | drop-off | 1 |
| 2026-09-20 | pick-up | 3 |
| 2026-09-20 | dual | 3 |
| 2026-09-21 | drop-off | 35 |
| 2026-09-21 | pick-up | 23 |
| 2026-09-21 | dual | 39 |
| 2026-09-22 | drop-off | 26 |
| 2026-09-22 | pick-up | 22 |
| 2026-09-22 | dual | 34 |
| 2026-09-23 | drop-off | 31 |
| 2026-09-23 | pick-up | 25 |
| 2026-09-23 | dual | 21 |
| 2026-09-24 | drop-off | 33 |
| 2026-09-24 | pick-up | 30 |
| 2026-09-24 | dual | 29 |
| 2026-09-25 | drop-off | 28 |
| 2026-09-25 | pick-up | 27 |
| 2026-09-25 | dual | 35 |
| 2026-09-26 | drop-off | 20 |
| 2026-09-26 | pick-up | 12 |
| 2026-09-26 | dual | 15 |
| 2026-09-27 | drop-off | 4 |
| 2026-09-27 | pick-up | 2 |
| 2026-09-27 | dual | 3 |
Figure 48. Repeat and near repeat classification: Equipment faults over time 96
| period | series | value |
|---|---|---|
| 2026-06-01 | hoist | 3 |
| 2026-06-01 | electrical | 7 |
| 2026-06-01 | spreader | 3 |
| 2026-06-01 | trolley | 1 |
| 2026-06-08 | hoist | 5 |
| 2026-06-08 | electrical | 5 |
| 2026-06-08 | spreader | 3 |
| 2026-06-08 | trolley | 0 |
| 2026-06-15 | hoist | 7 |
| 2026-06-15 | electrical | 3 |
| 2026-06-15 | spreader | 4 |
| 2026-06-15 | trolley | 3 |
| 2026-06-22 | hoist | 6 |
| 2026-06-22 | electrical | 1 |
| 2026-06-22 | spreader | 3 |
| 2026-06-22 | trolley | 1 |
| 2026-06-29 | hoist | 5 |
| 2026-06-29 | electrical | 8 |
| 2026-06-29 | spreader | 4 |
| 2026-06-29 | trolley | 4 |
| 2026-07-06 | hoist | 5 |
| 2026-07-06 | electrical | 4 |
| 2026-07-06 | spreader | 1 |
| 2026-07-06 | trolley | 4 |
| 2026-07-13 | hoist | 6 |
| 2026-07-13 | electrical | 3 |
| 2026-07-13 | spreader | 4 |
| 2026-07-13 | trolley | 8 |
| 2026-07-20 | hoist | 4 |
| 2026-07-20 | electrical | 5 |
| 2026-07-20 | spreader | 4 |
| 2026-07-20 | trolley | 2 |
| 2026-07-27 | hoist | 5 |
| 2026-07-27 | electrical | 3 |
| 2026-07-27 | spreader | 5 |
| 2026-07-27 | trolley | 1 |
| 2026-08-03 | hoist | 8 |
| 2026-08-03 | electrical | 5 |
| 2026-08-03 | spreader | 2 |
| 2026-08-03 | trolley | 0 |
| 2026-08-10 | hoist | 1 |
| 2026-08-10 | electrical | 2 |
| 2026-08-10 | spreader | 2 |
| 2026-08-10 | trolley | 3 |
| 2026-08-17 | hoist | 3 |
| 2026-08-17 | electrical | 5 |
| 2026-08-17 | spreader | 6 |
| 2026-08-17 | trolley | 3 |
| 2026-08-24 | hoist | 4 |
| 2026-08-24 | electrical | 4 |
| 2026-08-24 | spreader | 3 |
| 2026-08-24 | trolley | 6 |
| 2026-08-31 | hoist | 4 |
| 2026-08-31 | electrical | 0 |
| 2026-08-31 | spreader | 2 |
| 2026-08-31 | trolley | 3 |
| 2026-09-07 | hoist | 2 |
| 2026-09-07 | electrical | 2 |
| 2026-09-07 | spreader | 4 |
| 2026-09-07 | trolley | 7 |
| 2026-09-14 | hoist | 4 |
| 2026-09-14 | electrical | 5 |
| 2026-09-14 | spreader | 6 |
| 2026-09-14 | trolley | 6 |
| 2026-09-21 | hoist | 2 |
| 2026-09-21 | electrical | 4 |
| 2026-09-21 | spreader | 3 |
| 2026-09-21 | trolley | 4 |
| 2026-09-28 | hoist | 0 |
| 2026-09-28 | electrical | 2 |
| 2026-09-28 | spreader | 2 |
| 2026-09-28 | trolley | 1 |
GeoBit Large Spatial Model. Findings are labeled Evidenced (computed by a tool), Inferred (a reading or reasoning) or Unverified (no evidence yet).