Sample: Public health, Kampala: report
Project: Sample: Public health, Kampala
Goal: Describe the project Sample: Public health, Kampala: run the analyses that tell the most about its data, draw every result, and write a cited report.
Run: 12778c77-4c3f-4379-9aca-c9e85676282e (running, 19 agent run(s))
Generated: 2026-10-19T04:37:18Z, version 1
Model cost: USD 0.0000 over 0 model call(s)
Data used
| Data | Kind | Rows | Time span | Summary | Source |
|---|---|---|---|---|---|
| Health sub-districts | vector, Polygon | 18 | 18 polygon (area) features; 'population' 18,870 to 128,117 (mean 4.538e+04); 'households' 4,102 to 27,851 (mean 9866); named by 'name' (e.g. Eastfield sub-district, Westbrook sub-district, Millbrook sub-district); total area 90.07 km2; extent 32.5362,0.2729 to 32.6260,0.3543. Areas (Health sub-districts) with population to compare and map. | 150 | |
| Cases | vector, Point | 2,290 | 2025-10-01 to 2026-09-30 | 2,290 point features; dated by 'onset_date' from 2025-10-01 to 2026-09-30; 'disease' has 3 values (top: malaria 1700, cholera 330, typhoid 260); 'age_group' has 4 values (top: 15-49 797, 0-4 660, 5-14 580); extent 32.5366,0.2735 to 32.6255,0.3539. Dated point events by disease: where and when Cases happen. | 2 |
| Clinics | vector, Point | 35 | 35 point features; 'level' has 4 values (top: HC III 19, HC II 10, HC IV 5); 'beds' 1 to 120 (mean 17.37); 'staff' 6 to 113 (mean 56.8); named by 'name' (e.g. Canal Side HC III, Station Quarter HC III, Brickfield HC III); extent 32.5409,0.2790 to 32.6190,0.3514. Point locations of Clinics by level. | 151 | |
| Water points | vector, Point | 150 | 150 point features; 'type' has 4 values (top: protected spring 43, unprotected well 39, borehole 35); 'functional' has 2 values (top: True 133, False 17); extent 32.5387,0.2747 to 32.6248,0.3534. Point locations of Water points by type. | 152 | |
| Community health worker visits | vector, Point | 1,000 | 2026-04-01 to 2026-09-30 | 1,000 point features; dated by 'visited_at' from 2026-04-01 to 2026-09-30; 'purpose' has 4 values (top: bed net check 257, referral 256, case follow-up 244); 'fever_found' has 2 values (top: False 813, True 187); extent 32.5375,0.2740 to 32.6255,0.3539. Dated point events by purpose: where and when Community health worker visits happen. | 3 |
| Outbreak response teams | vector, Point | 6 | 6 point features; 'focus' has 2 values (top: cholera 4, malaria 2); 'members' 4 to 9 (mean 7.333); named by 'name' (e.g. Rapid response team 1, Rapid response team 2, Rapid response team 3); extent 32.5429,0.2770 to 32.6146,0.3071. Point locations of Outbreak response teams by focus. | 153 | |
| Vaccination sessions | vector, Point | 200 | 2026-01-05 to 2026-09-29 | 200 point features; dated by 'held_on' from 2026-01-05 to 2026-09-29; 'vaccine' has 4 values (top: measles 61, polio 55, cholera OCV 43); 'district_code' has 18 values (top: HSD07 32, HSD15 23, HSD06 22); 'doses' 44 to 477 (mean 146.5); extent 32.5374,0.2745 to 32.6254,0.3530. Dated point events by vaccine: where and when Vaccination sessions happen. | 4 |
| Weekly cases by sub-district | table | 936 | 2025-10-06 to 2026-09-28 | Table of 936 rows and 5 columns without geometry; dated by 'week_start' from 2025-10-06 to 2026-09-28; 'area_code' has 18 values (top: HSD01 52, HSD02 52, HSD03 52); 'cases' 0 to 115 (mean 2.429); 'tests' 5 to 340 (mean 24.62); 'positivity_pct' 0 to 34.8 (mean 8.224). A table of Weekly cases by sub-district without locations. | 5 |
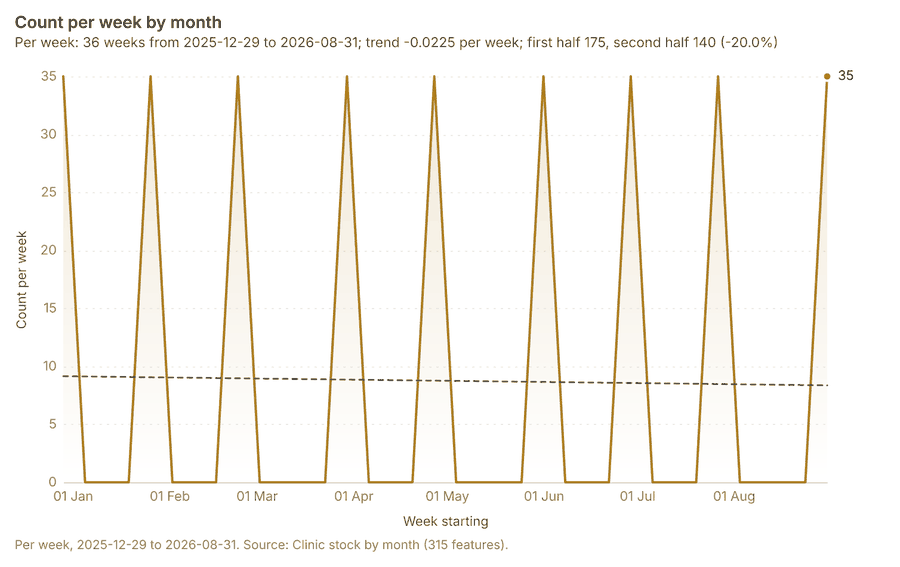
| Clinic stock by month | table | 315 | 2026-01-01 to 2026-09-01 | Table of 315 rows and 6 columns without geometry; dated by 'month' from 2026-01-01 to 2026-09-01; 'rdt_kits' 0 to 400 (mean 213.3); 'act_doses' 4 to 600 (mean 307.4); 'ors_sachets' 3 to 900 (mean 446.3). A table of Clinic stock by month without locations. | 6 |
| Epidemiological situation report | document | 1-page pdf document 'Epidemiological situation report'; language en; mentions 6 place(s): Parkside sub-district (2), 0.29731, 32.59548 (1), Parkside (1), Rapid response team 1 (1), Eastfield sub-district (1). A document about Parkside sub-district, 0.29731, 32.59548, Parkside; it names organizations Malaria; event terms cholera, outbreak. | 154 | ||
| Sample: Public health, Kampala | record | 155 | |||
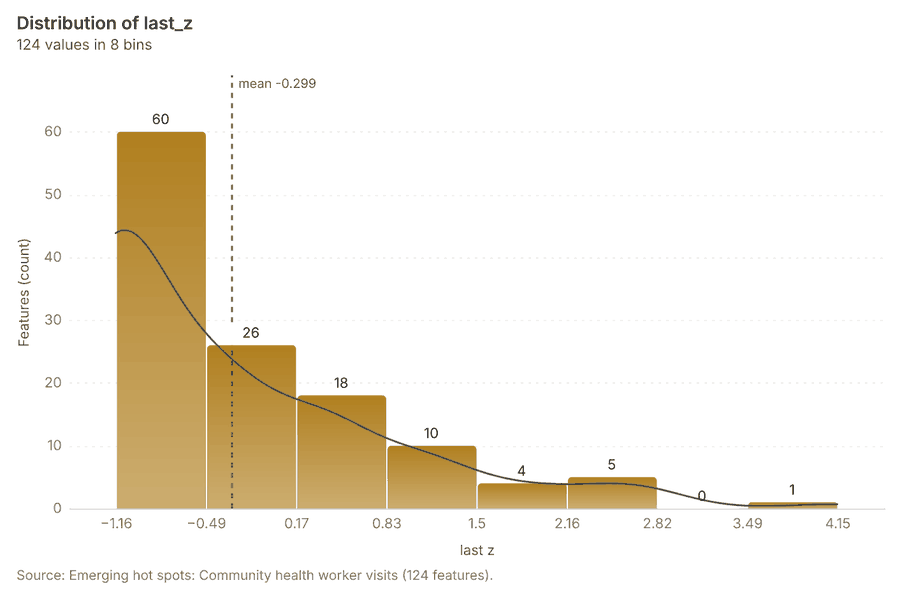
| Emerging hot spots: Community health worker visits | layer, Polygon | 124 | 156 | ||
| Emerging hot spots: Vaccination sessions | layer, Polygon | 24 | 157 | ||
| Emerging hot spots: Cases | layer, Polygon | 125 | 158 | ||
| Hot spot analysis: Community health worker visits | layer, Polygon | 390 | 159 | ||
| Hot spot analysis: Cases | layer, Polygon | 2,259 | 98 | ||
| Hot spot analysis: Vaccination sessions | layer, Polygon | 99 | 160 | ||
| Summarize within: Health sub-districts | layer, Polygon | 18 | 161 | ||
| Summarize within: Health sub-districts | layer, Polygon | 18 | 88 | ||
| Summarize within: Health sub-districts | layer, Polygon | 18 | 162 | ||
| Period change: Community health worker visits (week of 2026-09-21 to week of 2026-09-28) | layer, Polygon | 14 | 10 | ||
| Period change: Vaccination sessions (week of 2026-06-29 to week of 2026-07-06) | layer, Polygon | 10 | 12 | ||
| Period change: Cases (week of 2026-05-18 to week of 2026-05-25) | layer, Polygon | 18 | 14 | ||
| Calculate density: Community health worker visits | layer, Polygon | 2,452 | 93 | ||
| Calculate density: Cases | layer, Polygon | 2,508 | 124 | ||
| Calculate density: Vaccination sessions | layer, Polygon | 616 | 163 | ||
| Find point clusters: Community health worker visits | layer, Point | 1,000 | 164 | ||
| Find point clusters: Cases | layer, Point | 2,290 | 165 | ||
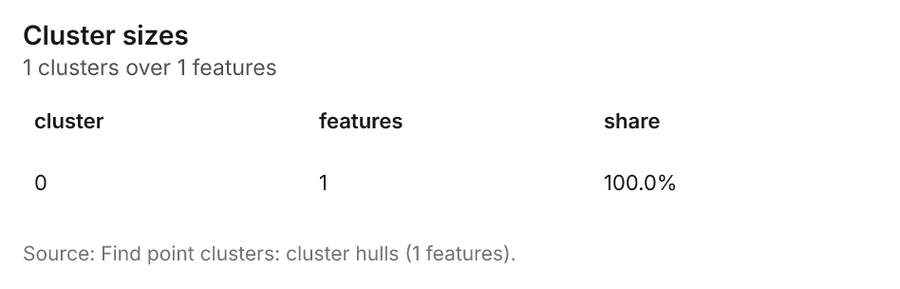
| Find point clusters: cluster hulls | layer, Polygon | 1 | 104 | ||
| Find outliers: Health sub-districts | layer, Polygon | 18 | 166 | ||
| Change beside the counts per health sub-district | layer, Polygon | 18 | 89 | ||
| Dense areas of community health worker visits | layer, MultiPolygon | 5 | 111 | ||
| Change of vaccination sessions where density is high | layer, Polygon | 10 | 94 | ||
| Hot cells of cases per health sub-district | layer, Polygon | 18 | 99 | ||
| Nearest outbreak response team to each cluster of cases | layer, Polygon | 1 | 105 | ||
| Change of vaccination sessions per health sub-district | layer, Polygon | 18 | 114 | ||
| Outbreak response teams within 250 m of each cluster of cases | layer, Polygon | 1 | 119 | ||
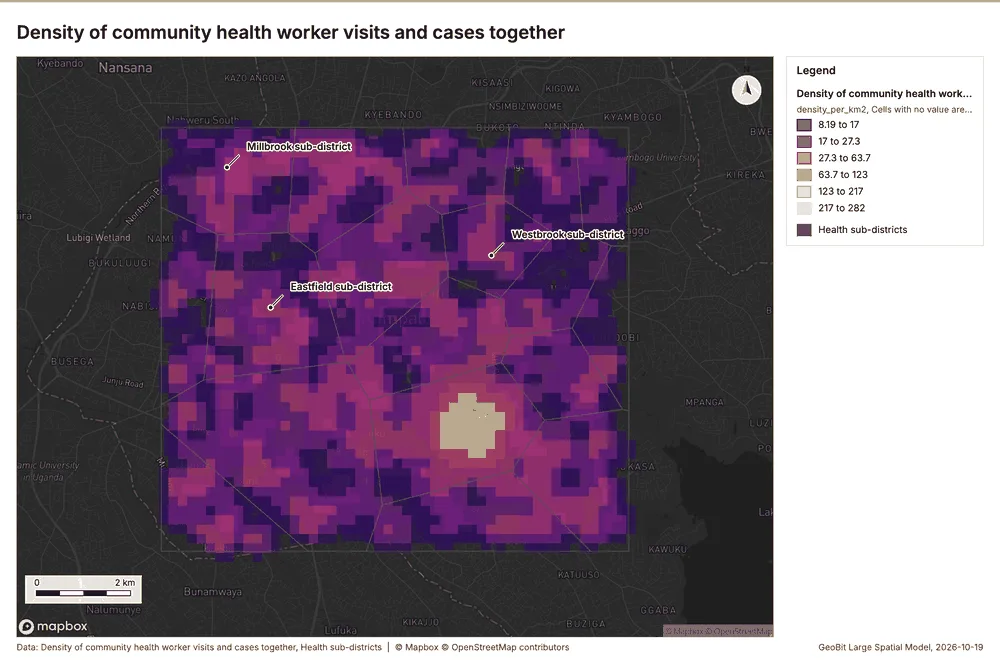
| Density of community health worker visits and cases together | layer, Polygon | 4,960 | 125 |
Timeline
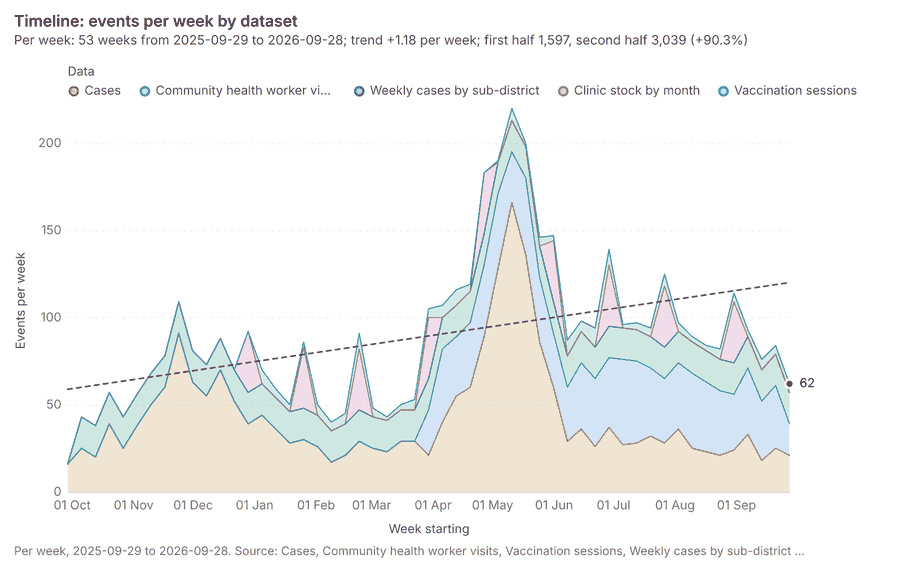
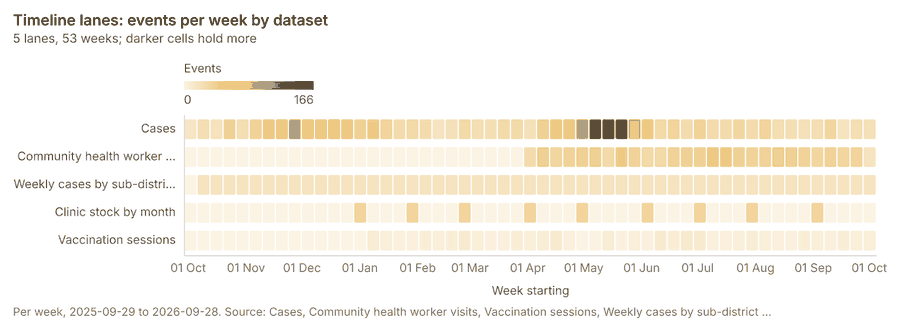
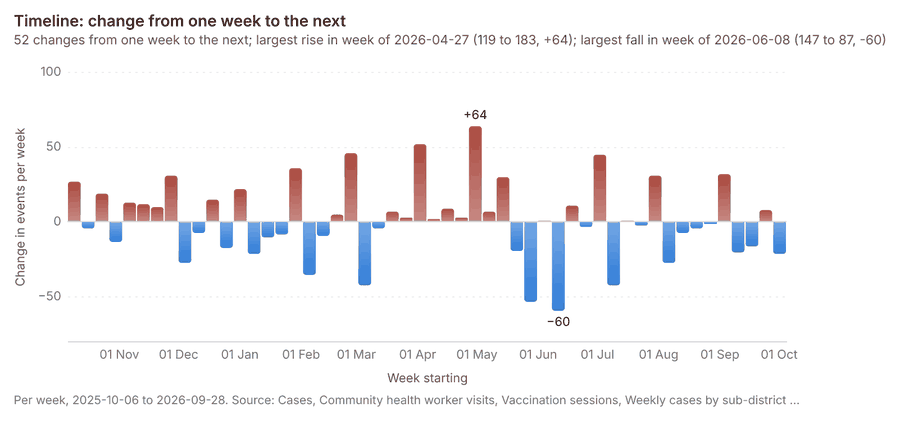
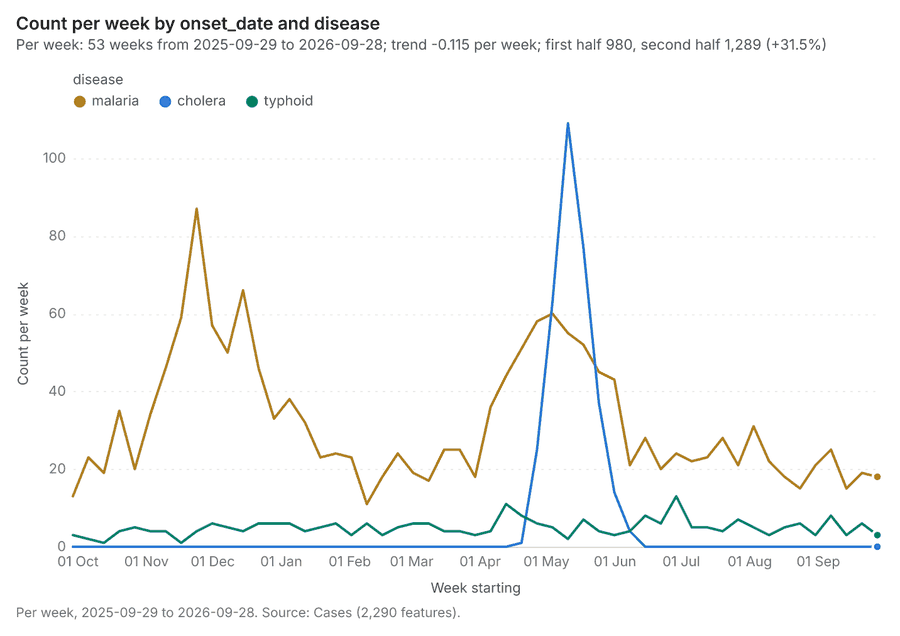
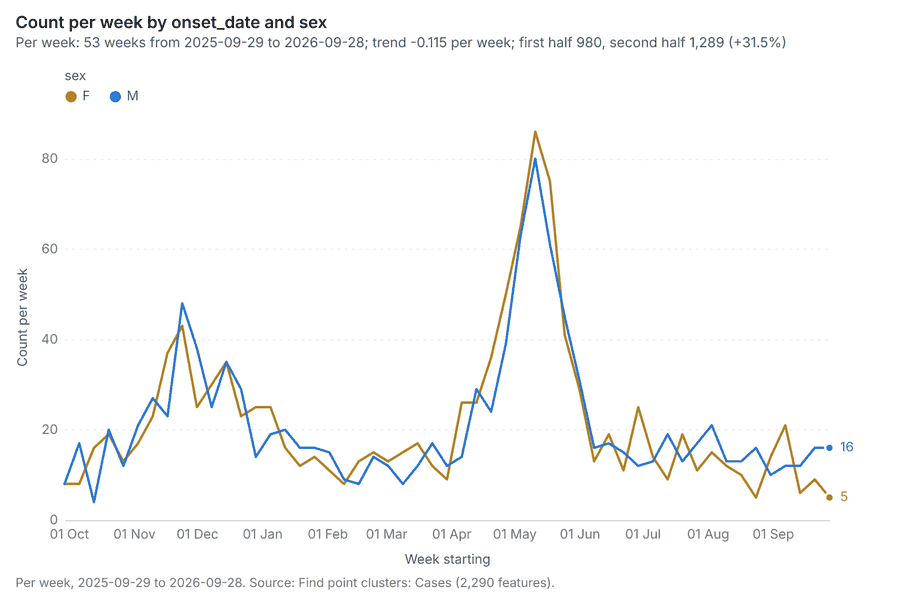
The timeline counts 4,741 dated events in Cases, Community health worker visits, Vaccination sessions and 2 more per week, from week of 2025-09-29 to week of 2026-09-28 123456. By dataset: Cases 2,290; Community health worker visits 1,000; Weekly cases by sub-district 936; Clinic stock by month 315; Vaccination sessions 200 17. The trend is +1.18 events per week; the second half of the weeks has 3,039 against 1,597 in the first (+90.3%) 1. Week over week, the largest rise was from week of 2026-04-20 to week of 2026-04-27 (119 to 183, +64) and the largest fall was from week of 2026-06-01 to week of 2026-06-08 (147 to 87, -60) 18. The count fell from 36 in week of 2026-09-21 to 18 in week of 2026-09-28 (-50.0%), beyond what chance would give (p = 0.0198) 910. Between the two, the largest rise was in Riverside sub-district (1 to 3, +2) and the largest fall in Canal Side sub-district (5 to 1, -4) 910. The count fell from 9 in week of 2026-06-29 to 2 in week of 2026-07-06 (-77.8%), within what chance would give (p = 0.0654) 1112. Between the two, the largest rise was in Canal Side sub-district (0 to 1, +1) and the largest fall in Fernhill sub-district (2 to 0, -2) 1112. The count fell from 136 in week of 2026-05-18 to 86 in week of 2026-05-25 (-36.8%), beyond what chance would give (p = 0.000963) 1314. Between the two, the largest rise was in Foundry Row sub-district (5 to 8, +3) and the largest fall in Parkside sub-district (77 to 39, -38) 1314.
Busiest weeks
Quietest weeks
Overview
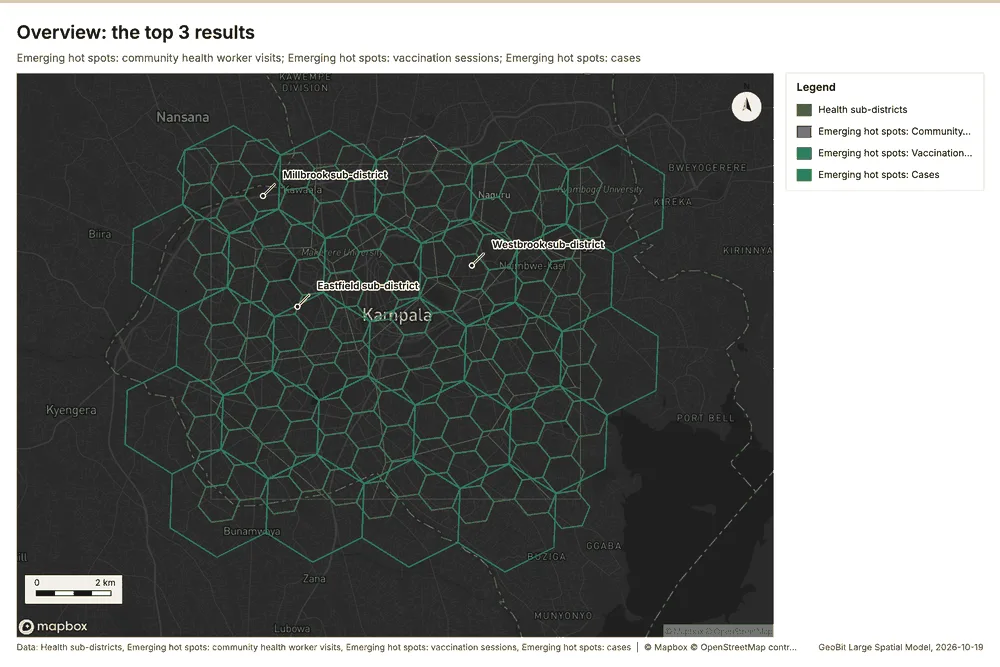
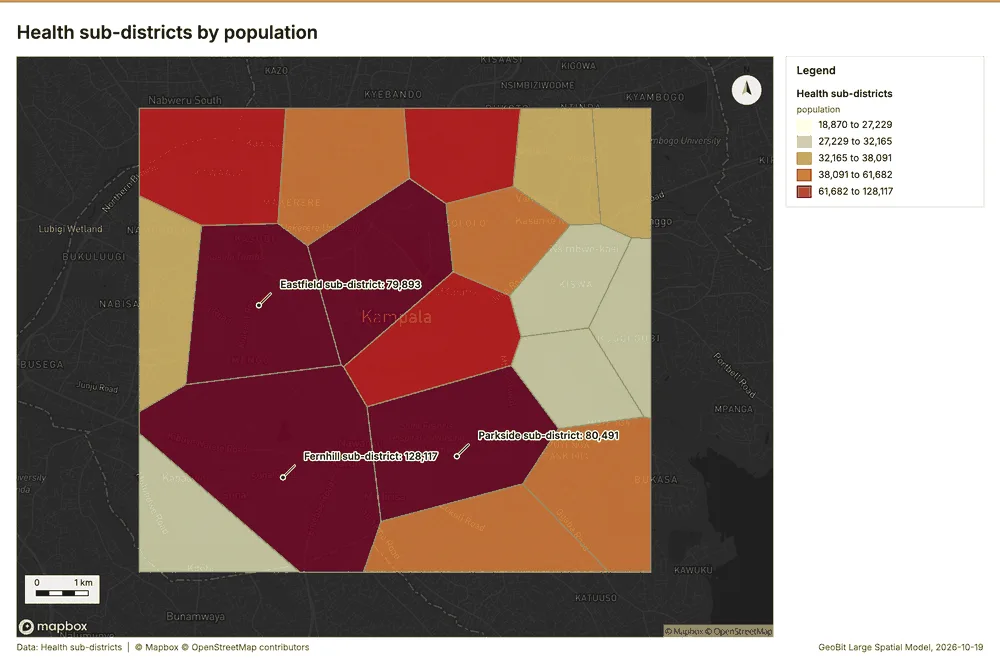
Overview: the top 3 results in the report's order, each in one distinct color, over Health sub-districts as context 15.
Spatial structure
Health sub-districts are 18 areas of 5.004 km2 on average, covering 100 percent of their extent, with no overlap 16. Cases are clustered (nearest-neighbor ratio 0.90, z = -9.4; features lie 87.9 m apart on average against 98 m if random) 17. Cases are dated by 'onset_date' from 2025-10-01 to 2026-09-30 at a week grain 17. Over time the pattern changes: the earlier half is random (ratio 0.9714) and the later half clustered (ratio 0.8894); the center moved 783 m 17. Clinics are evenly spread (dispersed) (nearest-neighbor ratio 1.58, z = +6.6; features lie 1.115 km apart on average against 705 m if random) 18. Water points are spread at random (nearest-neighbor ratio 0.96, z = -0.9; features lie 359 m apart on average against 373 m if random) 19. Community health worker visits are clustered (nearest-neighbor ratio 0.95, z = -3.3; features lie 139 m apart on average against 147 m if random) 20. Outbreak response teams are evenly spread (dispersed) (nearest-neighbor ratio 1.55, z = +2.6; features lie 1.635 km apart on average against 1.052 km if random) 21. Vaccination sessions are spread at random (nearest-neighbor ratio 1.00, z = +0.1; features lie 327 m apart on average against 326 m if random) 22. Vaccination sessions are dated by 'held_on' from 2026-01-05 to 2026-09-29 at a week grain 22. Over time the pattern changes: the earlier half is random (ratio 1.0941) and the later half dispersed (ratio 1.122); the center moved 259 m 22. 100 percent of Cases lie inside Health sub-districts (2290 of 2290) 1617. 100 percent of Clinics lie inside Health sub-districts (35 of 35) 1618. 100 percent of Community health worker visits lie inside Health sub-districts (1000 of 1000) 1620. 100 percent of Outbreak response teams lie inside Health sub-districts (6 of 6) 1621. 100 percent of Vaccination sessions lie inside Health sub-districts (200 of 200) 1622. 100 percent of Water points lie inside Health sub-districts (150 of 150) 1619. Outbreak response teams lie 35.3 m from the nearest of Cases (median); 83 percent lie within 100 m 1721. Water points lie 71.9 m from the nearest of Cases (median); 71 percent lie within 100 m 1719. Community health worker visits lie 77.4 m from the nearest of Cases (median); 62 percent lie within 100 m 1720. Vaccination sessions lie 79.5 m from the nearest of Cases (median); 64 percent lie within 100 m 1722.
| Result | Value |
|---|---|
| layers profiled | 7 |
| clustered point layers | 2 |
| dispersed point layers | 2 |
| random point layers | 2 |
Findings
- Evidenced: Health sub-districts are 18 areas of 5.004 km2 on average, covering 100 percent of their extent, with no overlap 16.
- Evidenced: Cases are clustered (nearest-neighbor ratio 0.90, z = -9.4; features lie 87.9 m apart on average against 98 m if random) 17.
- Evidenced: Cases are dated by 'onset_date' from 2025-10-01 to 2026-09-30 at a week grain 17.
- Evidenced: Over time the pattern changes: the earlier half is random (ratio 0.9714) and the later half clustered (ratio 0.8894); the center moved 783 m 17.
- Evidenced: Clinics are evenly spread (dispersed) (nearest-neighbor ratio 1.58, z = +6.6; features lie 1.115 km apart on average against 705 m if random) 18.
- Evidenced: Water points are spread at random (nearest-neighbor ratio 0.96, z = -0.9; features lie 359 m apart on average against 373 m if random) 19.
- Evidenced: Community health worker visits are clustered (nearest-neighbor ratio 0.95, z = -3.3; features lie 139 m apart on average against 147 m if random) 20.
- Evidenced: Outbreak response teams are evenly spread (dispersed) (nearest-neighbor ratio 1.55, z = +2.6; features lie 1.635 km apart on average against 1.052 km if random) 21.
- Evidenced: Vaccination sessions are spread at random (nearest-neighbor ratio 1.00, z = +0.1; features lie 327 m apart on average against 326 m if random) 22.
- Evidenced: Vaccination sessions are dated by 'held_on' from 2026-01-05 to 2026-09-29 at a week grain 22.
- Evidenced: Over time the pattern changes: the earlier half is random (ratio 1.0941) and the later half dispersed (ratio 1.122); the center moved 259 m 22.
- Evidenced: 100 percent of Cases lie inside Health sub-districts (2290 of 2290) 1617.
- Evidenced: 100 percent of Clinics lie inside Health sub-districts (35 of 35) 1618.
- Evidenced: 100 percent of Community health worker visits lie inside Health sub-districts (1000 of 1000) 1620.
- Evidenced: 100 percent of Outbreak response teams lie inside Health sub-districts (6 of 6) 1621.
- Evidenced: 100 percent of Vaccination sessions lie inside Health sub-districts (200 of 200) 1622.
- Evidenced: 100 percent of Water points lie inside Health sub-districts (150 of 150) 1619.
- Evidenced: Outbreak response teams lie 35.3 m from the nearest of Cases (median); 83 percent lie within 100 m 1721.
- Evidenced: Water points lie 71.9 m from the nearest of Cases (median); 71 percent lie within 100 m 1719.
- Evidenced: Community health worker visits lie 77.4 m from the nearest of Cases (median); 62 percent lie within 100 m 1720.
- Evidenced: Vaccination sessions lie 79.5 m from the nearest of Cases (median); 64 percent lie within 100 m 1722.
Space time hot spots
What this analysis is. Emerging hot spots: Where hot spots are new, consecutive, intensifying, persistent, diminishing, sporadic, oscillating or historical over time 23. In ArcGIS it is Emerging Hot Spot Analysis or Create Space Time Cube 23.
Why it was run on this data. Community health worker visits carry dates in 'visited_at': emerging hot spot analysis finds new, intensifying and fading hot spots per week 24.
What it found. Space time hot spots on Community health worker visits: Emerging hot spots: 1 layer saved: Emerging hot spots: Community health worker visits (124 features) 2025. It reported result, count 124; result, elapsed ms 17; result, resolution 8; result, features used 1,000; result, time neighbors 0; billing, cost 0.15 25.
| Result | Value |
|---|---|
| result, count | 124 |
| result, elapsed ms | 17 |
| result, resolution | 8 |
| result, features used | 1,000 |
| result, time neighbors | 0 |
| billing, cost | 0.15 |
| billing, list price | 0.15 |
| billing, upstream cost | 0 |
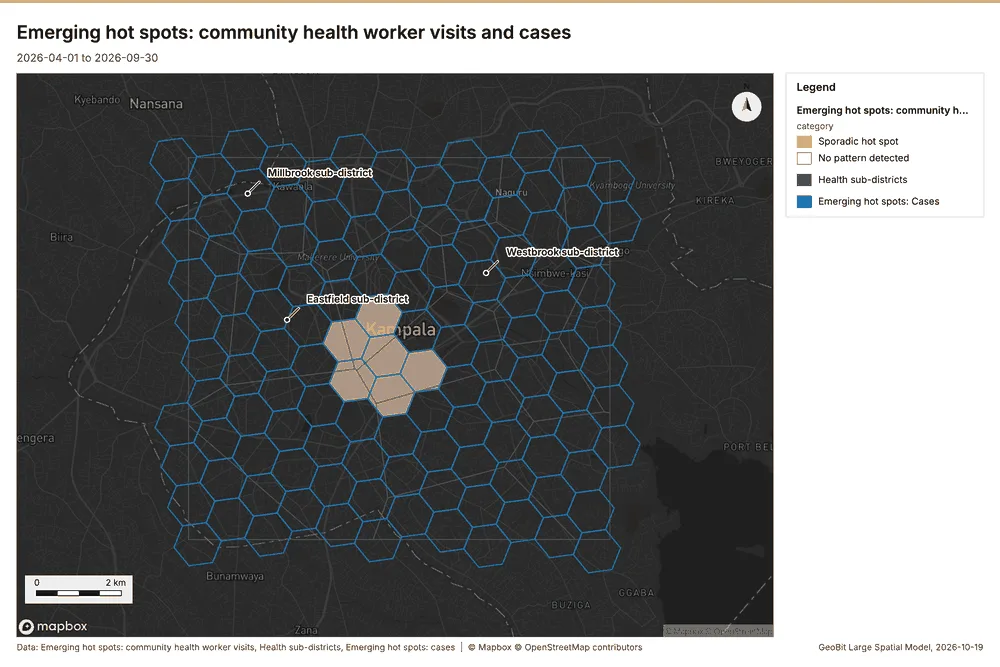
What the map shows. The map draws Emerging hot spots: community health worker visits by category in 2 classes: Sporadic hot spot, No pattern detected 26. The map draws Health sub-districts with one symbol 26. The map draws Emerging hot spots: cases with one symbol 26. It draws 267 features 26. It covers longitude 32.5 to 32.661 and latitude 0.252 to 0.372, at about 1:74,770 26.
Findings
- Evidenced: Space time hot spots on Community health worker visits: Emerging hot spots: 1 layer saved: Emerging hot spots: Community health worker visits (124 features) 2025.
- Evidenced: It reported result, count 124; result, elapsed ms 17; result, resolution 8; result, features used 1,000; result, time neighbors 0; billing, cost 0.15 25.
Tool gp_space_time_hot_spots; parameters {"project": "2612067c-badd-4310-9678-8f580d5e3d32", "features": {"layer": "Community health worker visits (4d70d1ce)"}, "interval": "week", "bin_shape": "h3", "resolution": 8, "time_field": "visited_at"}
Space time hot spots
What this analysis is. Emerging hot spots: Where hot spots are new, consecutive, intensifying, persistent, diminishing, sporadic, oscillating or historical over time 23. In ArcGIS it is Emerging Hot Spot Analysis or Create Space Time Cube 23.
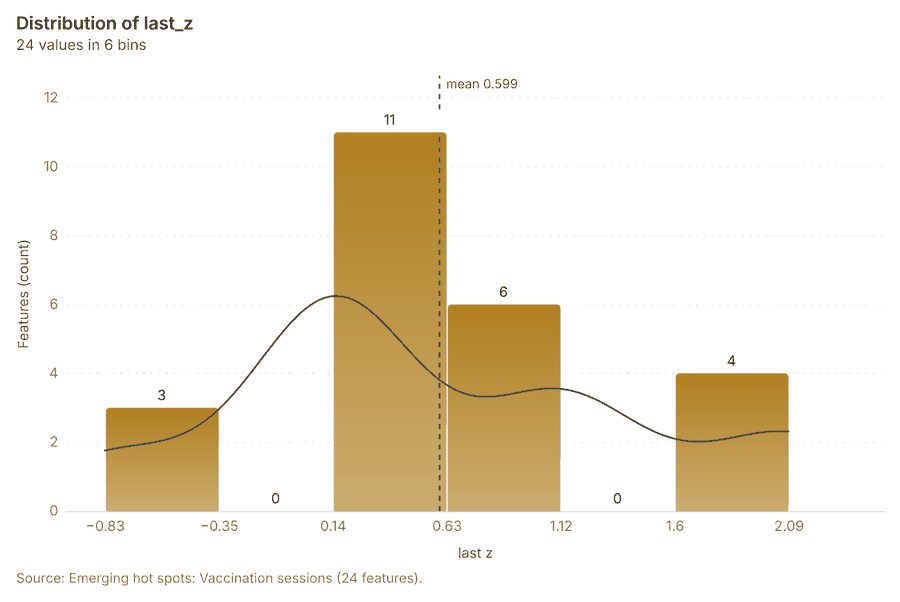
Why it was run on this data. Vaccination sessions carry dates in 'held_on': emerging hot spot analysis finds new, intensifying and fading hot spots per week 27. Measured: the pattern of Vaccination sessions changes over time (earlier half random, later half dispersed; the center moved 259 m) 27.
What it found. The analysis of vaccination sessions using the gp_space_time_hot_spots tool resulted in the generation of 24 features, saving the output as "Emerging hot spots: Vaccination sessions" 28. This computation had an elapsed time of 5 milliseconds 28. The process utilized 200 features and had a resolution of 7 28. The total cost incurred for this operation was 0.11 28.
| Result | Value |
|---|---|
| result, count | 24 |
| result, elapsed ms | 5 |
| result, resolution | 7 |
| result, features used | 200 |
| result, time neighbors | 0 |
| billing, cost | 0.11 |
| billing, list price | 0.11 |
| billing, upstream cost | 0 |
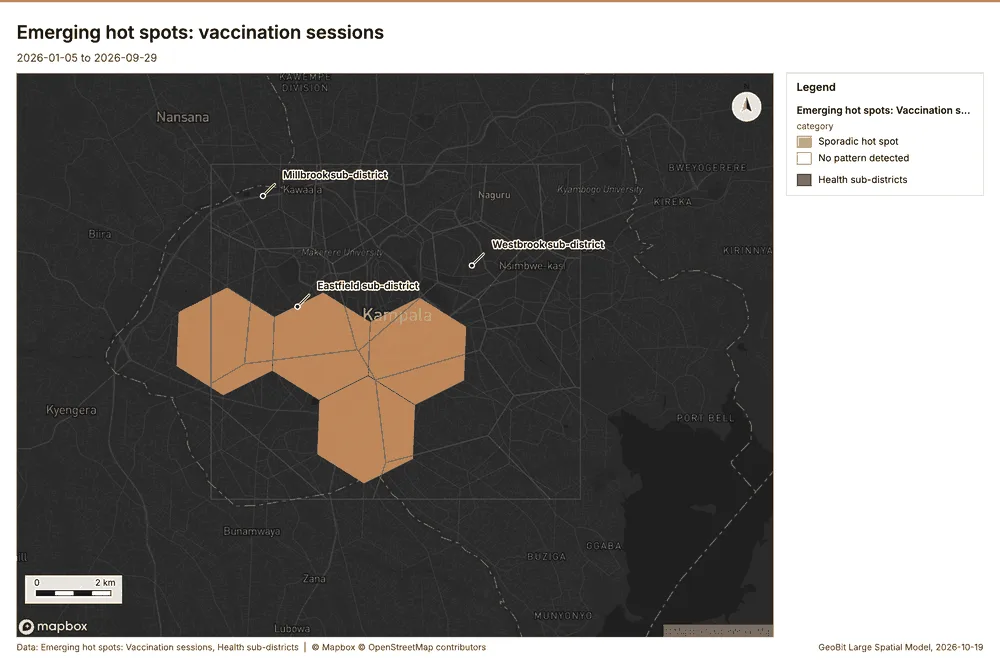
What the map shows. The map draws Emerging hot spots: Vaccination sessions by category in 2 classes: Sporadic hot spot, No pattern detected 29. The map draws Health sub-districts with one symbol 29. It draws 42 features 29. It covers longitude 32.489 to 32.673 and latitude 0.239 to 0.376, at about 1:85,295 29.
Findings
- Evidenced: Space time hot spots on Vaccination sessions: Emerging hot spots: 1 layer saved: Emerging hot spots: Vaccination sessions (24 features) 2228.
- Evidenced: It reported result, count 24; result, elapsed ms 5; result, resolution 7; result, features used 200; result, time neighbors 0; billing, cost 0.11 28.
Tool gp_space_time_hot_spots; parameters {"project": "2612067c-badd-4310-9678-8f580d5e3d32", "features": {"layer": "Vaccination sessions (6798c97c)"}, "interval": "week", "bin_shape": "h3", "resolution": 7, "time_field": "held_on"}
Space time hot spots
What this analysis is. Emerging hot spots: Where hot spots are new, consecutive, intensifying, persistent, diminishing, sporadic, oscillating or historical over time 23. In ArcGIS it is Emerging Hot Spot Analysis or Create Space Time Cube 23.
Why it was run on this data. Cases carry dates in 'onset_date': emerging hot spot analysis finds new, intensifying and fading hot spots per week 30. Measured: the pattern of Cases changes over time (earlier half random, later half clustered; the center moved 783 m) 30.
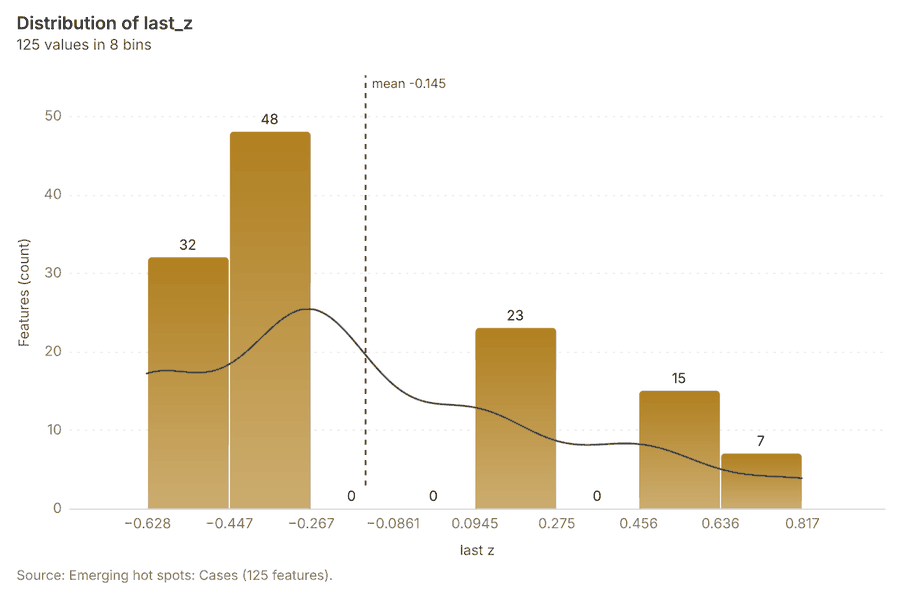
What it found. Space time hot spots on Cases: Emerging hot spots: 1 layer saved: Emerging hot spots: Cases (125 features) 1731. It reported result, count 125; result, elapsed ms 26; result, resolution 8; result, features used 2,290; result, time neighbors 0; billing, cost 0.2145 31.
| Result | Value |
|---|---|
| result, count | 125 |
| result, elapsed ms | 26 |
| result, resolution | 8 |
| result, features used | 2,290 |
| result, time neighbors | 0 |
| billing, cost | 0.2145 |
| billing, list price | 0.2145 |
| billing, upstream cost | 0 |
What the map shows. Drawn with space time hot spots on the map Emerging hot spots: community health worker visits and cases 26.
Findings
- Evidenced: Space time hot spots on Cases: Emerging hot spots: 1 layer saved: Emerging hot spots: Cases (125 features) 1731.
- Evidenced: It reported result, count 125; result, elapsed ms 26; result, resolution 8; result, features used 2,290; result, time neighbors 0; billing, cost 0.2145 31.
Tool gp_space_time_hot_spots; parameters {"project": "2612067c-badd-4310-9678-8f580d5e3d32", "features": {"layer": "Cases (03c8f72b)"}, "interval": "week", "bin_shape": "h3", "resolution": 8, "time_field": "onset_date"}
Hot spots
What this analysis is. Hot spot analysis: Getis-Ord Gi* hot and cold spots with z-scores, p-values and confidence bins 32. In ArcGIS it is Find Hot Spots or Hot Spot Analysis (Getis-Ord Gi*); in QGIS, qgis:hotspot (plugin) 32.
Why it was run on this data. 1000 points: Getis-Ord Gi* tests whether the concentrations in Community health worker visits are statistically significant 33. Measured: Community health worker visits are clustered (nearest-neighbor ratio 0.95, z = -3.3), median spacing 124 m 33. Cells of 500 m and a band of 1000 m from the measured spacing 33.
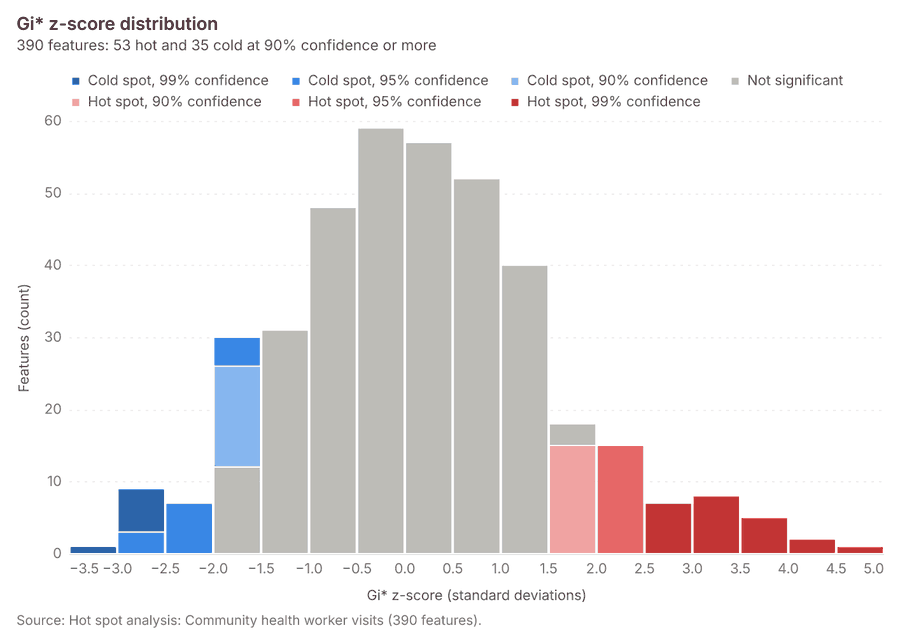
What it found. Hot spots on Community health worker visits: Hot spot analysis: 1 layer saved: Hot spot analysis: Community health worker visits (390 features) 2034. It reported result, bins 390; result, count 390; result, elapsed ms 17; result, cell size m 500; result, incidents used 1,000; result, distance band m 1,000 34.
| Result | Value |
|---|---|
| result, bins | 390 |
| result, count | 390 |
| result, elapsed ms | 17 |
| result, cell size m | 500 |
| result, incidents used | 1,000 |
| result, distance band m | 1,000 |
| billing, cost | 0.07 |
| billing, list price | 0.07 |
| billing, upstream cost | 0 |
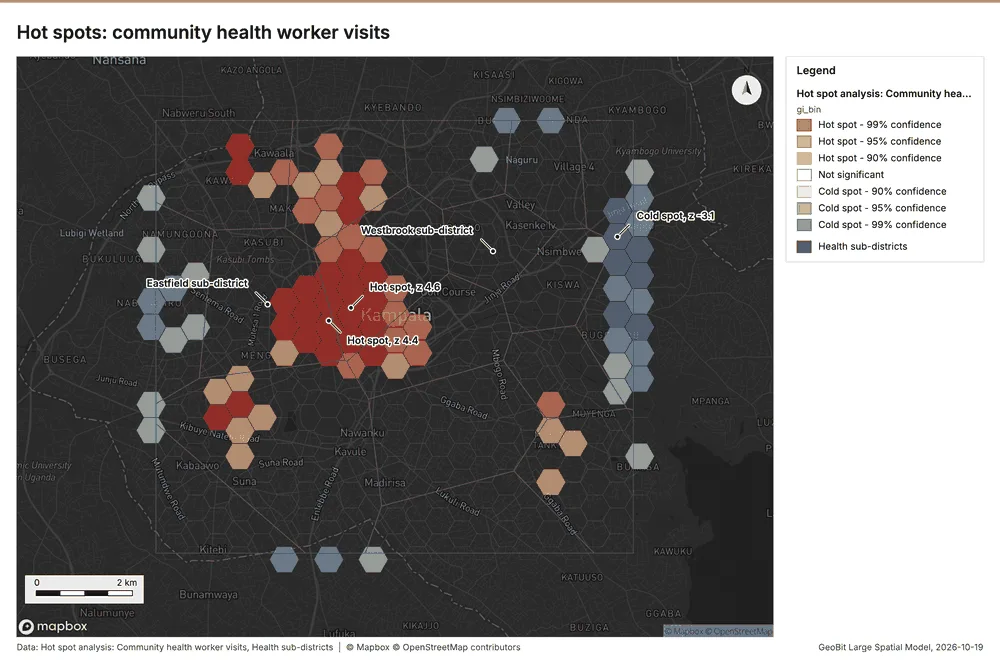
What the map shows. The map draws Hot spot analysis: Community health worker visits by gi_bin in 7 classes: Hot spot - 99% confidence, Hot spot - 95% confidence, Hot spot - 90% confidence, Not significant, Cold spot - 90% confidence, Cold spot - 95% confidence and 1 more 35. The map draws Health sub-districts with one symbol 35. It draws 408 features 35. It covers longitude 32.51 to 32.652 and latitude 0.257 to 0.366, at about 1:66,000 35.
Findings
- Evidenced: Hot spots on Community health worker visits: Hot spot analysis: 1 layer saved: Hot spot analysis: Community health worker visits (390 features) 2034.
- Evidenced: It reported result, bins 390; result, count 390; result, elapsed ms 17; result, cell size m 500; result, incidents used 1,000; result, distance band m 1,000 34.
Tool gp_hot_spots; parameters {"project": "2612067c-badd-4310-9678-8f580d5e3d32", "features": {"layer": "Community health worker visits (4d70d1ce)"}, "aggregation": "hexagon", "cell_size_m": 500.0, "distance_band_m": 1000.0}
Hot spots
What this analysis is. Hot spot analysis: Getis-Ord Gi* hot and cold spots with z-scores, p-values and confidence bins 32. In ArcGIS it is Find Hot Spots or Hot Spot Analysis (Getis-Ord Gi*); in QGIS, qgis:hotspot (plugin) 32.
Why it was run on this data. 2290 points: Getis-Ord Gi* tests whether the concentrations in Cases are statistically significant 36. Measured: Cases are clustered (nearest-neighbor ratio 0.90, z = -9.4), median spacing 75.6 m 36. Cells of 200 m and a band of 500 m from the measured spacing 36.
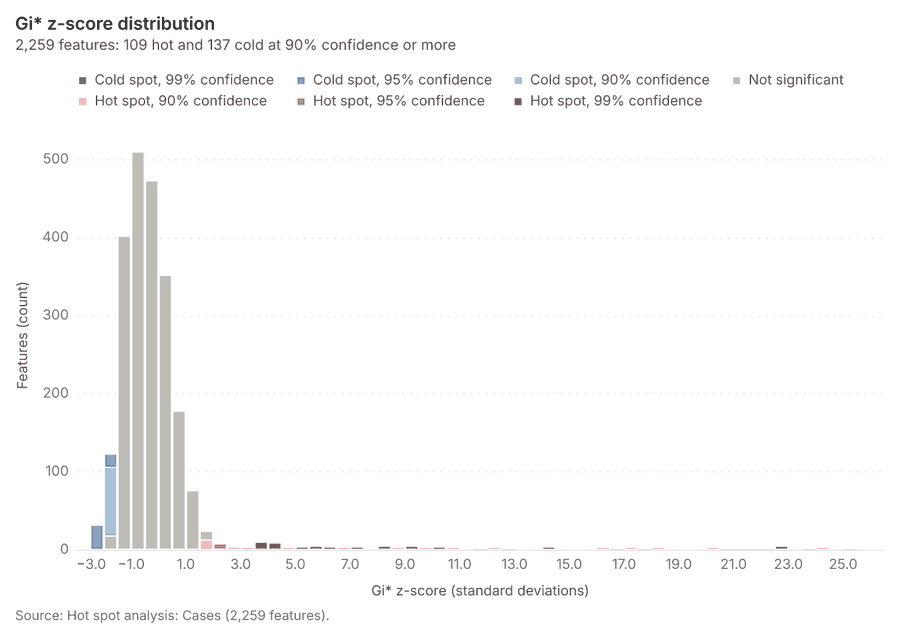
What it found. Hot spots on Cases: Hot spot analysis: 1 layer saved: Hot spot analysis: Cases (2259 features) 1737. It reported result, bins 2,259; result, count 2,259; result, elapsed ms 75; result, cell size m 200; result, incidents used 2,290; result, distance band m 500 37.
| Result | Value |
|---|---|
| result, bins | 2,259 |
| result, count | 2,259 |
| result, elapsed ms | 75 |
| result, cell size m | 200 |
| result, incidents used | 2,290 |
| result, distance band m | 500 |
| billing, cost | 0.0958 |
| billing, list price | 0.0958 |
| billing, upstream cost | 0 |
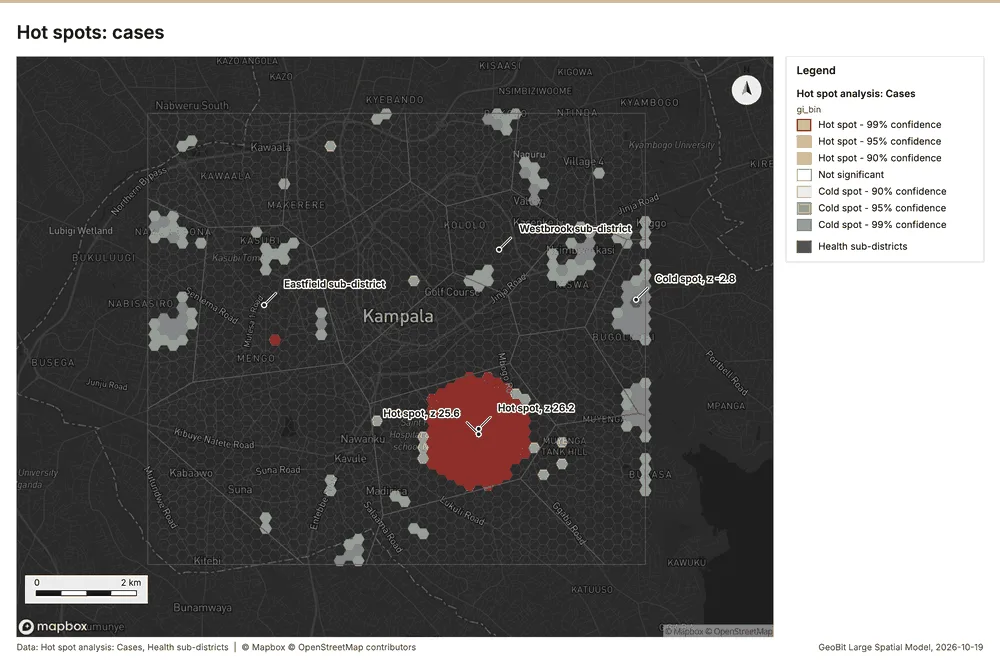
What the map shows. The map draws Hot spot analysis: Cases by gi_bin in 7 classes: Hot spot - 99% confidence, Hot spot - 95% confidence, Hot spot - 90% confidence, Not significant, Cold spot - 90% confidence, Cold spot - 95% confidence and 1 more 38. The map draws Health sub-districts with one symbol 38. It draws 2,277 features 38. It covers longitude 32.512 to 32.649 and latitude 0.26 to 0.365, at about 1:63,311 38.
Findings
- Evidenced: Hot spots on Cases: Hot spot analysis: 1 layer saved: Hot spot analysis: Cases (2259 features) 1737.
- Evidenced: It reported result, bins 2,259; result, count 2,259; result, elapsed ms 75; result, cell size m 200; result, incidents used 2,290; result, distance band m 500 37.
Tool gp_hot_spots; parameters {"project": "2612067c-badd-4310-9678-8f580d5e3d32", "features": {"layer": "Cases (03c8f72b)"}, "aggregation": "hexagon", "cell_size_m": 200.0, "distance_band_m": 500.0}
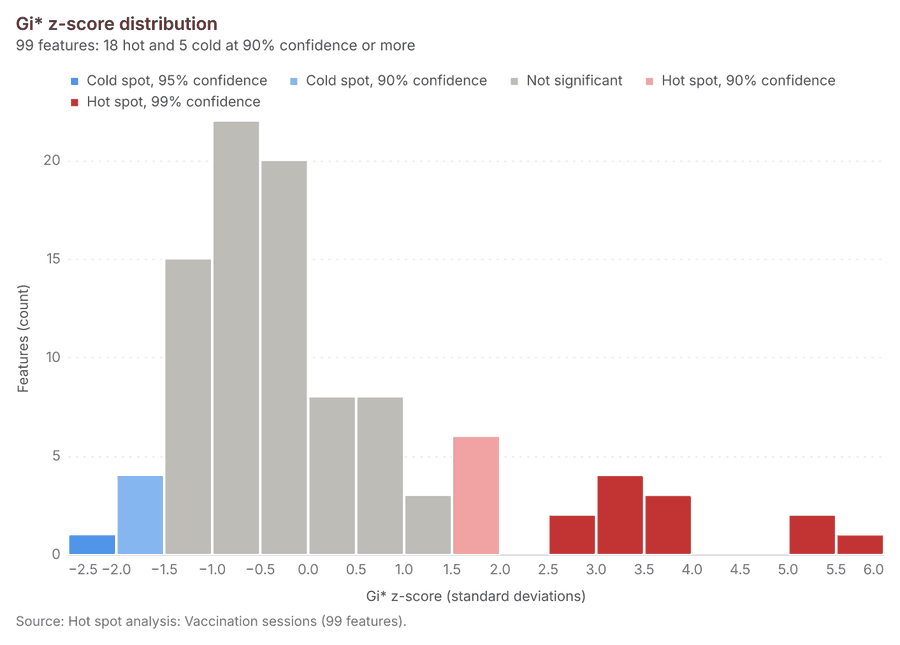
Hot spots
What this analysis is. Hot spot analysis: Getis-Ord Gi* hot and cold spots with z-scores, p-values and confidence bins 32. In ArcGIS it is Find Hot Spots or Hot Spot Analysis (Getis-Ord Gi*); in QGIS, qgis:hotspot (plugin) 32.
Why it was run on this data. 200 points: Getis-Ord Gi* tests whether the concentrations in Vaccination sessions are statistically significant 39.
What it found. Hot spots on Vaccination sessions: Hot spot analysis: 1 layer saved: Hot spot analysis: Vaccination sessions (99 features) 2240. It reported result, bins 99; result, count 99; result, elapsed ms 5; result, cell size m 1,000; result, incidents used 200; result, distance band m 2,000 40.
| Result | Value |
|---|---|
| result, bins | 99 |
| result, count | 99 |
| result, elapsed ms | 5 |
| result, cell size m | 1,000 |
| result, incidents used | 200 |
| result, distance band m | 2,000 |
| billing, cost | 0.054 |
| billing, list price | 0.054 |
| billing, upstream cost | 0 |
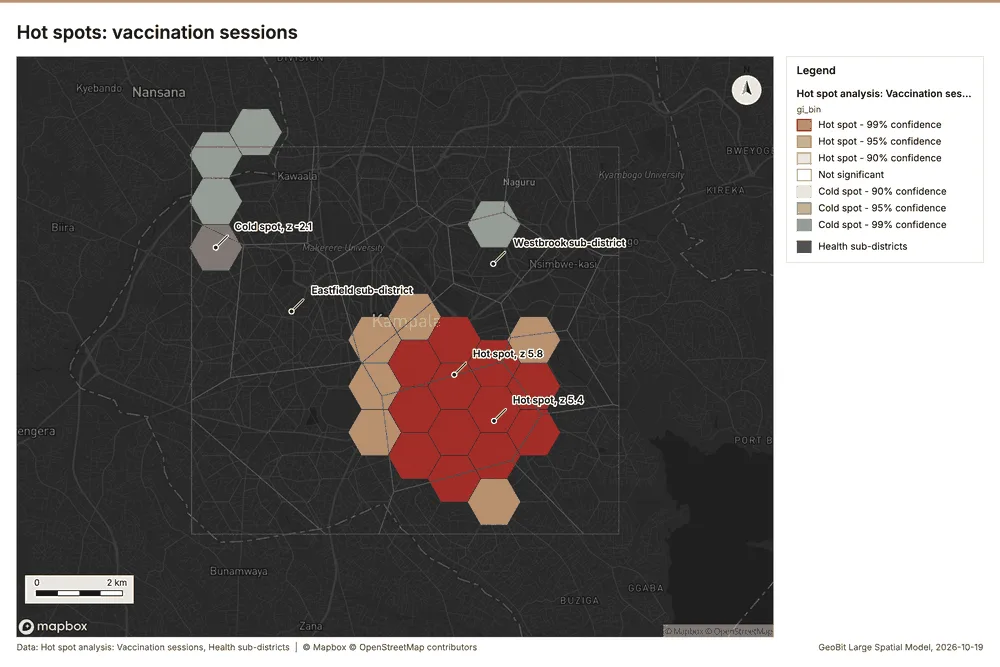
What the map shows. The map draws Hot spot analysis: Vaccination sessions by gi_bin in 7 classes: Hot spot - 99% confidence, Hot spot - 95% confidence, Hot spot - 90% confidence, Not significant, Cold spot - 90% confidence, Cold spot - 95% confidence and 1 more 41. The map draws Health sub-districts with one symbol 41. It draws 117 features 41. It covers longitude 32.499 to 32.659 and latitude 0.251 to 0.373, at about 1:73,740 41.
Findings
- Evidenced: Hot spots on Vaccination sessions: Hot spot analysis: 1 layer saved: Hot spot analysis: Vaccination sessions (99 features) 2240.
- Evidenced: It reported result, bins 99; result, count 99; result, elapsed ms 5; result, cell size m 1,000; result, incidents used 200; result, distance band m 2,000 40.
Tool gp_hot_spots; parameters {"project": "2612067c-badd-4310-9678-8f580d5e3d32", "features": {"layer": "Vaccination sessions (6798c97c)"}, "aggregation": "hexagon", "cell_size_m": 1000.0, "distance_band_m": 2000.0}
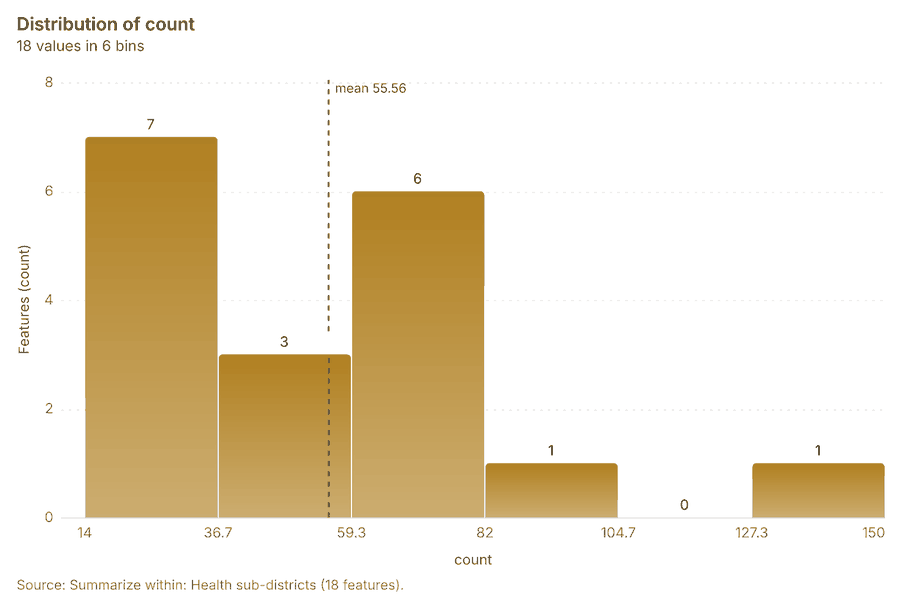
Summarize within
What this analysis is. Summarize within: Count and aggregate the features inside each polygon (or bin), proportionally for lines and polygons 42. In ArcGIS it is Summarize Within or Aggregate Points; in QGIS, native:countpointsinpolygon or native:sumlinelengths 42.
Why it was run on this data. Count Community health worker visits inside each feature of Health sub-districts by purpose; the counts map as a choropleth (natural breaks, sequential colors) 43.
What it found. Summarize within on Community health worker visits, Health sub-districts: Summarize within: 1 layer saved: Summarize within: Health sub-districts (18 features) 162044. It reported result, count 18; result, elapsed ms 2; billing, cost 0.03036; billing, list price 0.03036; billing, upstream cost 0 44.
| Result | Value |
|---|---|
| result, count | 18 |
| result, elapsed ms | 2 |
| billing, cost | 0.03036 |
| billing, list price | 0.03036 |
| billing, upstream cost | 0 |
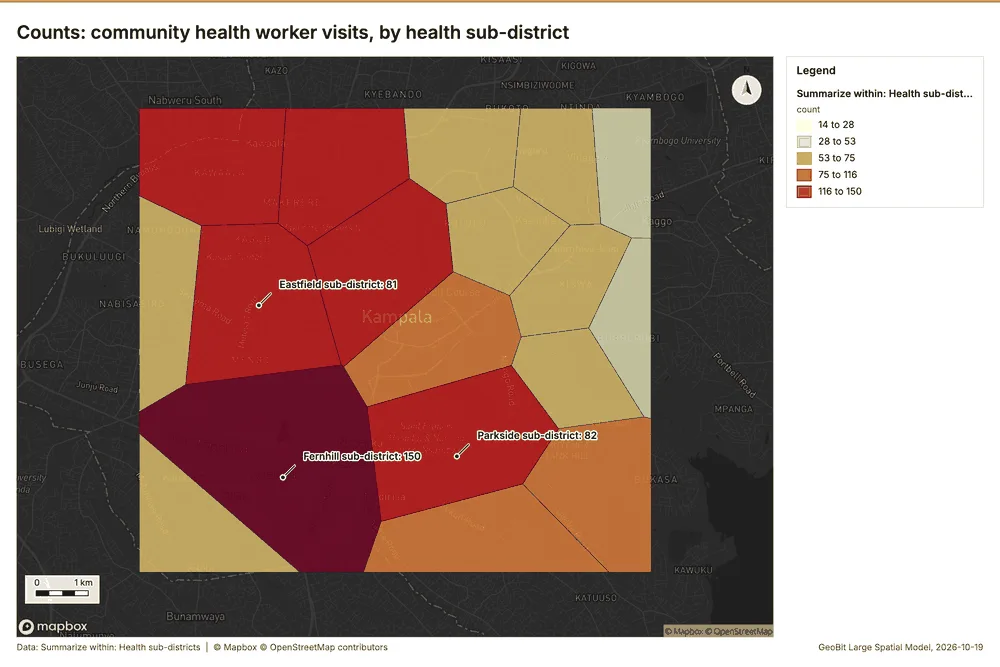
What the map shows. The map draws Summarize within: Health sub-districts by count in 5 classes: 14 to 28, 28 to 53, 53 to 75, 75 to 116, 116 to 150 45. It draws 18 features 45. It covers longitude 32.515 to 32.648 and latitude 0.261 to 0.363, at about 1:61,580 45.
Findings
- Evidenced: Summarize within on Community health worker visits, Health sub-districts: Summarize within: 1 layer saved: Summarize within: Health sub-districts (18 features) 162044.
- Evidenced: It reported result, count 18; result, elapsed ms 2; billing, cost 0.03036; billing, list price 0.03036; billing, upstream cost 0 44.
Tool gp_summarize_within; parameters {"stats": [], "project": "2612067c-badd-4310-9678-8f580d5e3d32", "features": {"layer": "Community health worker visits (4d70d1ce)"}, "group_by": "purpose", "polygons": {"layer": "Health sub-districts (433b88cc)"}}
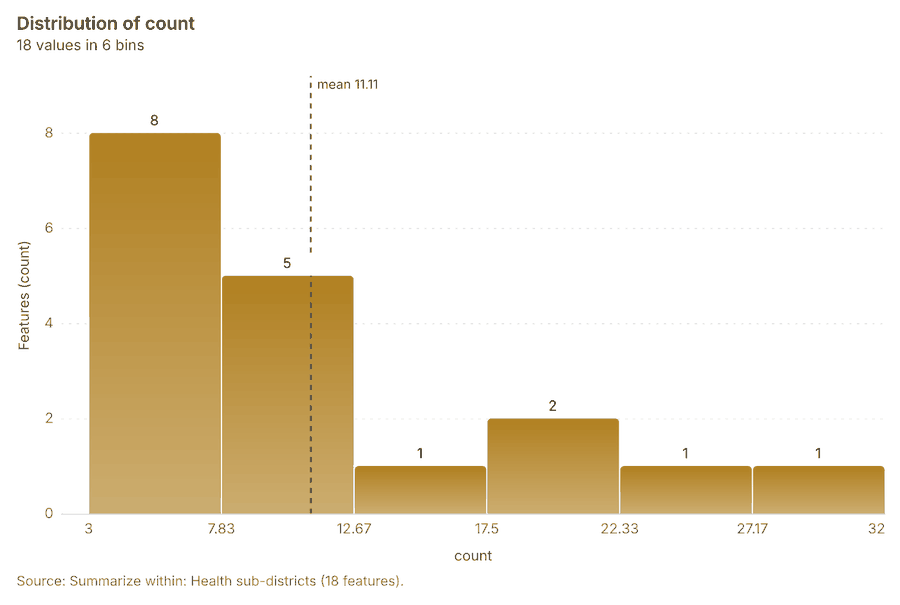
Summarize within
What this analysis is. Summarize within: Count and aggregate the features inside each polygon (or bin), proportionally for lines and polygons 42. In ArcGIS it is Summarize Within or Aggregate Points; in QGIS, native:countpointsinpolygon or native:sumlinelengths 42.
Why it was run on this data. Count Community health worker visits inside each feature of Health sub-districts by purpose; the counts map as a choropleth (natural breaks, sequential colors) 43.
What it found. Summarize within on Vaccination sessions, Health sub-districts: Summarize within: 1 layer saved: Summarize within: Health sub-districts (18 features) 162246. It reported result, count 18; result, elapsed ms 0; billing, cost 0.01438; billing, list price 0.01438; billing, upstream cost 0 46.
| Result | Value |
|---|---|
| result, count | 18 |
| result, elapsed ms | 0 |
| billing, cost | 0.01438 |
| billing, list price | 0.01438 |
| billing, upstream cost | 0 |
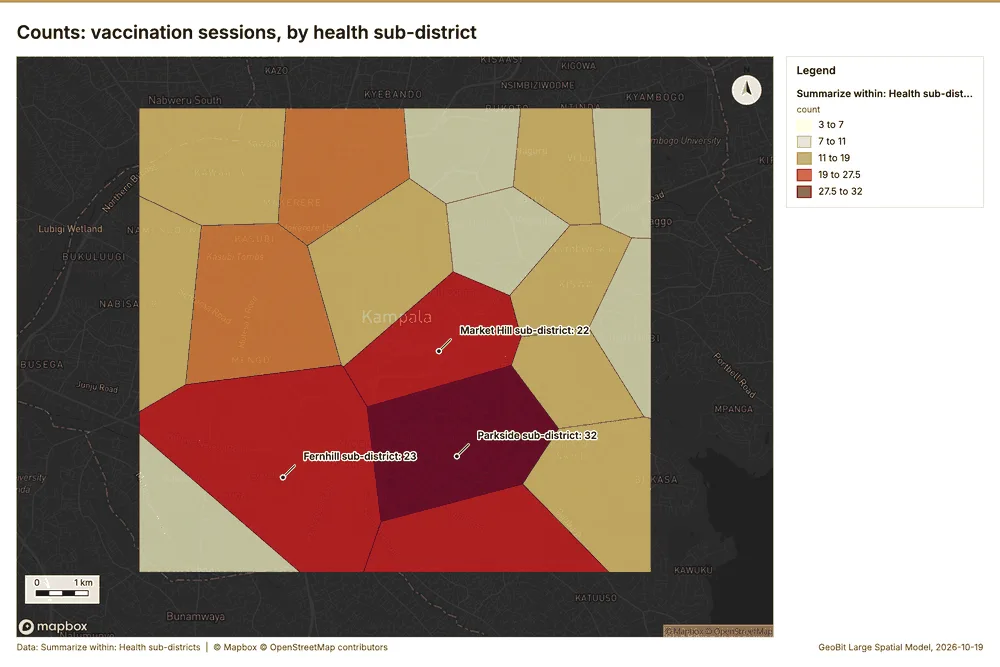
What the map shows. The map draws Summarize within: Health sub-districts by count in 5 classes: 3 to 7, 7 to 11, 11 to 19, 19 to 27.5, 27.5 to 32 47. It draws 18 features 47. It covers longitude 32.515 to 32.648 and latitude 0.261 to 0.363, at about 1:61,580 47.
Findings
- Evidenced: Summarize within on Vaccination sessions, Health sub-districts: Summarize within: 1 layer saved: Summarize within: Health sub-districts (18 features) 162246.
- Evidenced: It reported result, count 18; result, elapsed ms 0; billing, cost 0.01438; billing, list price 0.01438; billing, upstream cost 0 46.
Tool gp_summarize_within; parameters {"stats": [{"stat": "sum", "field": "doses"}], "project": "2612067c-badd-4310-9678-8f580d5e3d32", "features": {"layer": "Vaccination sessions (6798c97c)"}, "group_by": "vaccine", "polygons": {"layer": "Health sub-districts (433b88cc)"}}
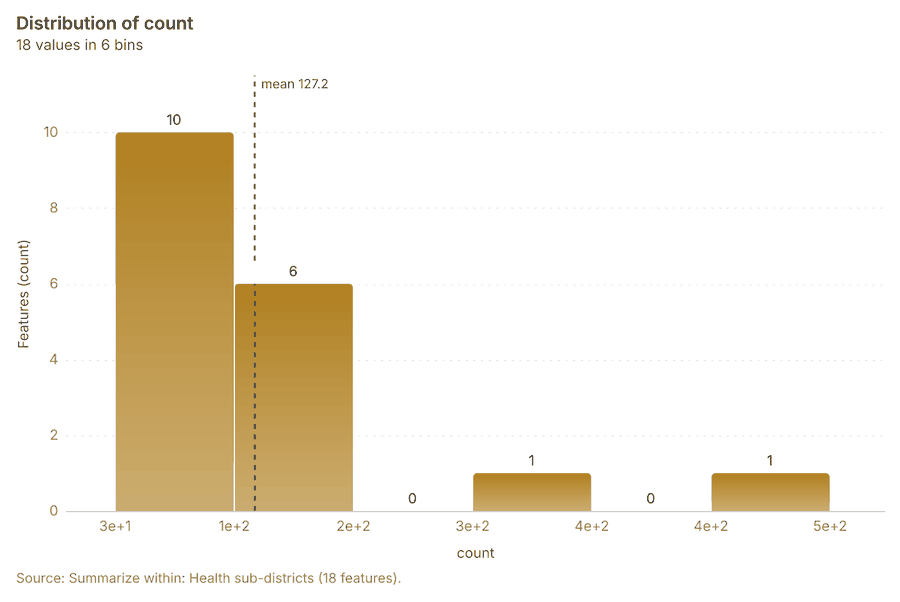
Summarize within
What this analysis is. Summarize within: Count and aggregate the features inside each polygon (or bin), proportionally for lines and polygons 42. In ArcGIS it is Summarize Within or Aggregate Points; in QGIS, native:countpointsinpolygon or native:sumlinelengths 42.
Why it was run on this data. Count Community health worker visits inside each feature of Health sub-districts by purpose; the counts map as a choropleth (natural breaks, sequential colors) 43.
What it found. The gp_summarize_within function summarized Health sub-districts, which contained 18 features 48.
| Result | Value |
|---|---|
| result, count | 18 |
| result, elapsed ms | 3 |
| billing, cost | 0.05616 |
| billing, list price | 0.05616 |
| billing, upstream cost | 0 |
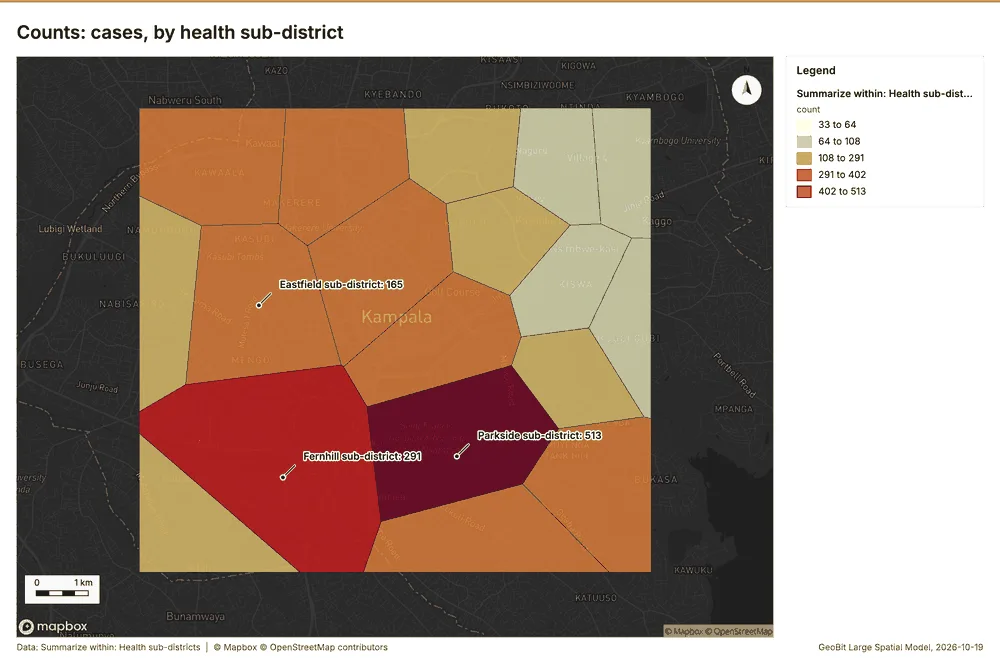
What the map shows. The map draws Summarize within: Health sub-districts by count in 5 classes: 33 to 64, 64 to 108, 108 to 291, 291 to 402, 402 to 513 49. It draws 18 features 49. It covers longitude 32.515 to 32.648 and latitude 0.261 to 0.363, at about 1:61,580 49.
Findings
- Evidenced: Summarize within on Cases, Health sub-districts: Summarize within: 1 layer saved: Summarize within: Health sub-districts (18 features) 161748.
- Evidenced: It reported result, count 18; result, elapsed ms 3; billing, cost 0.05616; billing, list price 0.05616; billing, upstream cost 0 48.
Tool gp_summarize_within; parameters {"stats": [], "project": "2612067c-badd-4310-9678-8f580d5e3d32", "features": {"layer": "Cases (03c8f72b)"}, "group_by": "disease", "polygons": {"layer": "Health sub-districts (433b88cc)"}}
Period change
What this analysis is. Period change: Counts or sums per period (week over week, month over month, any two periods, or before and after a date), per area, per H3 cell or in total, with the places of largest rise and fall and a significance note 50. In ArcGIS it is Summarize Percent Change (Crime Analysis) or Change Point Detection 50.
Why it was run on this data. Community health worker visits carry dates in 'visited_at' over 26 weeks: the count per week, week over week, with the places of largest rise and fall per feature of Health sub-districts and whether the change is beyond chance 51.
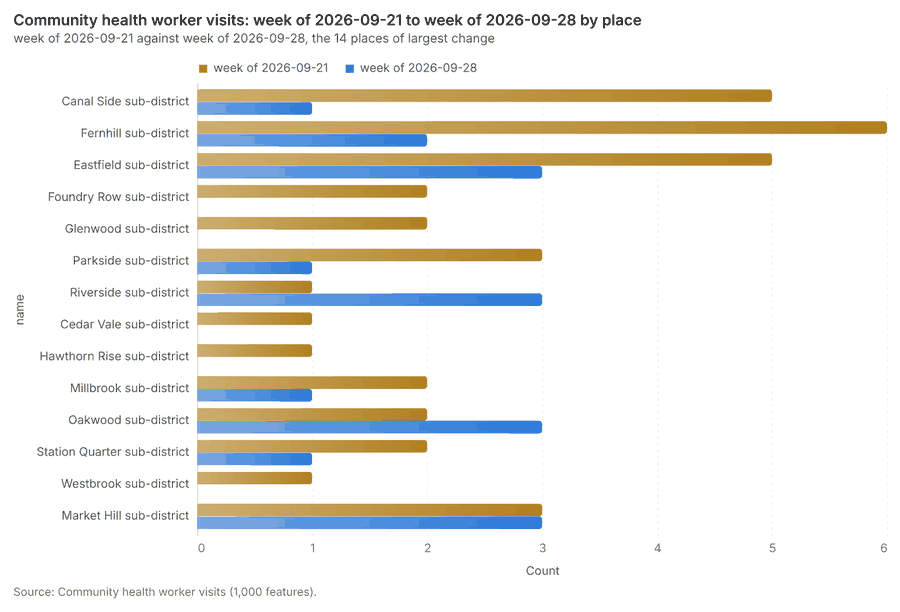
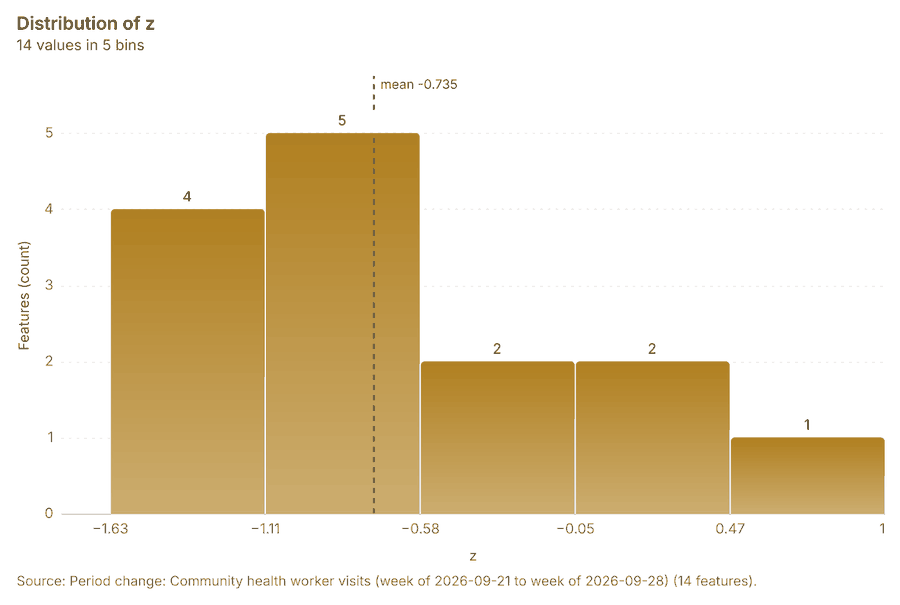
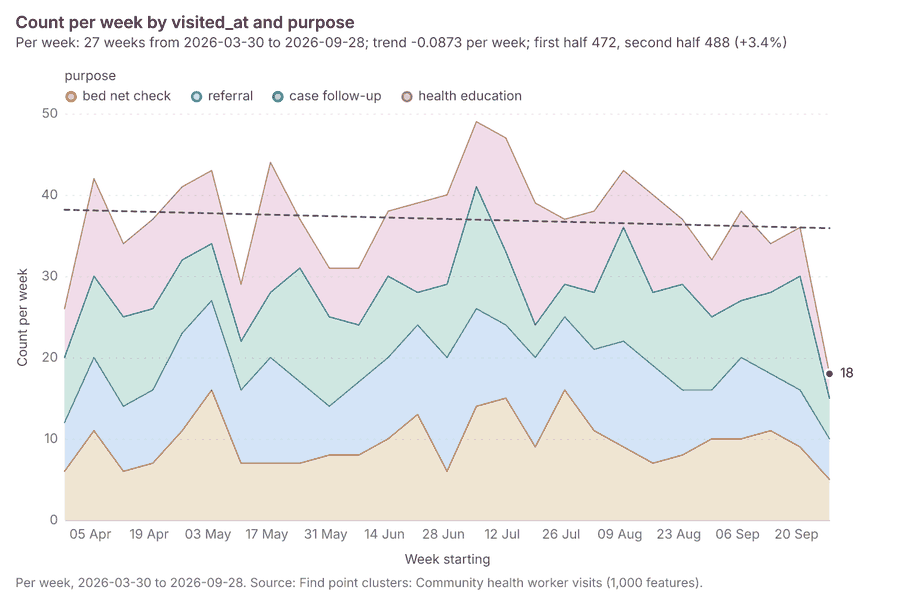
What it found. Period change on Health sub-districts, Community health worker visits produced Period change: Community health worker visits (week of 2026-09-21 to week of 2026-09-28) (14 features) 9101620. Community health worker visits: count per week shows a trend of -0.0873 per week; the second half of its weeks has 488 against 472 in the first (+3.4%) 53. The chart Community health worker visits: week of 2026-09-21 to week of 2026-09-28 by place is drawn from 28 rows 54. The chart Period change: Community health worker visits (week of 2026-09-21 to week of 2026-09-28) is drawn from 5 rows 55.
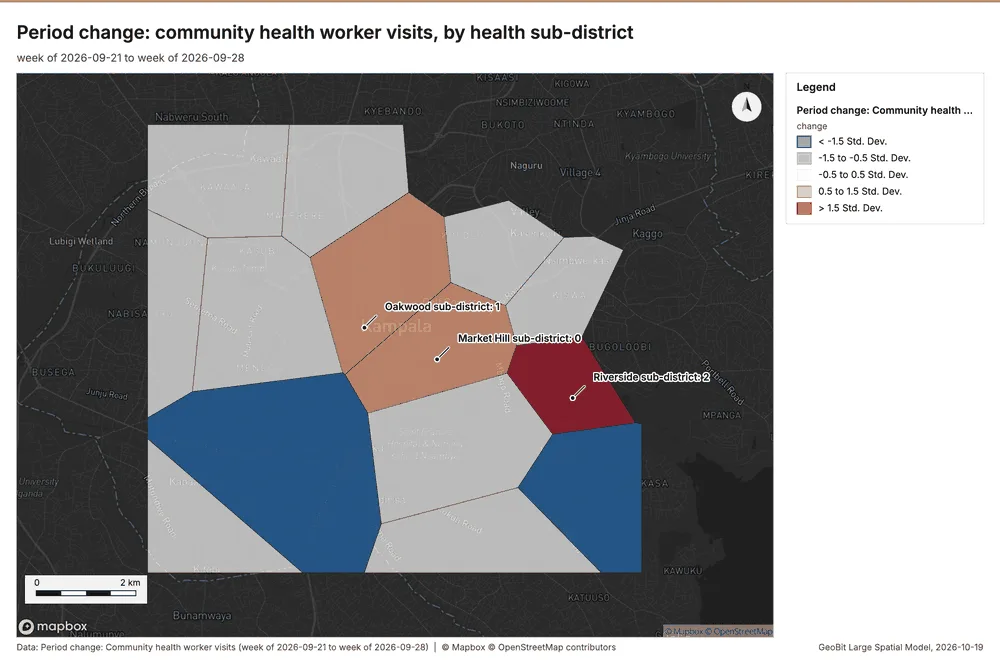
What the map shows. The map draws Period change: Community health worker visits (week of 2026-09-21 to week of 2026-09-28) by change in 5 classes: < -1.5 Std; Dev, -1.5 to -0.5 Std; Dev, -0.5 to 0.5 Std; Dev, 0.5 to 1.5 Std; Dev, > 1.5 Std; Dev 52. It draws 14 features 52. It covers longitude 32.512 to 32.65 and latitude 0.261 to 0.364, at about 1:63,751 52.
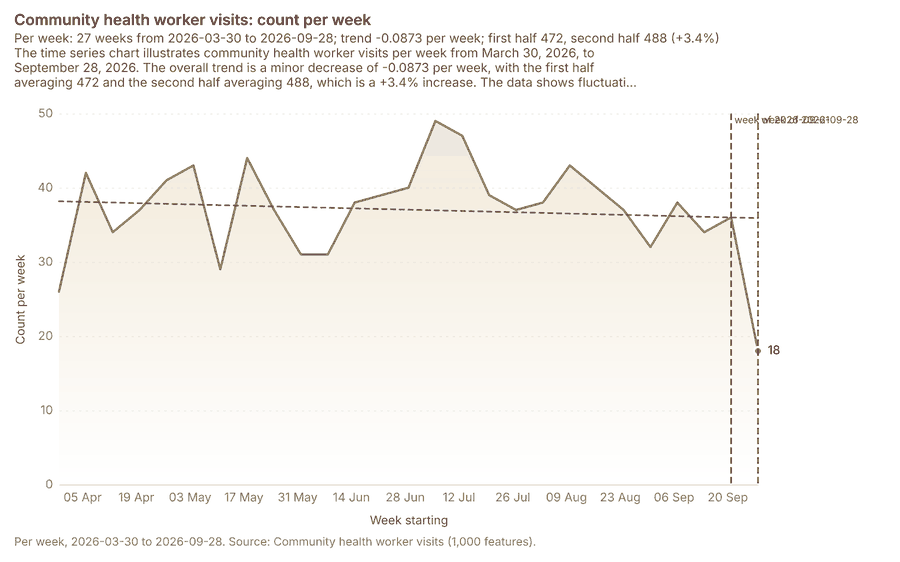
What the chart shows. The time series chart illustrates community health worker visits per week from March 30, 2026, to September 28, 2026 53. The overall trend is a minor decrease of -0.0873 per week, with the first half averaging 472 and the second half averaging 488, which is a +3.4% increase 53. The data shows fluctuations throughout the period, with the count reaching a peak of approximately 48 around the week of July 6 and a noticeable drop to 18 in the final week of September 28 53. The analysis highlights a specific fall from 36 in the week of September 21 to 18 in the week of September 28 (a -50.0% change), which is stated as unlikely to be chance (p = 0.0198) 53.
Inferred: read from the image by gemma4:e4b, not evidence.
Findings
- Evidenced: Period change on Health sub-districts, Community health worker visits produced Period change: Community health worker visits (week of 2026-09-21 to week of 2026-09-28) (14 features) 9101620.
- Evidenced: Community health worker visits: count per week shows a trend of -0.0873 per week; the second half of its weeks has 488 against 472 in the first (+3.4%) 53.
- Evidenced: The chart Community health worker visits: week of 2026-09-21 to week of 2026-09-28 by place is drawn from 28 rows 54.
- Evidenced: The chart Period change: Community health worker visits (week of 2026-09-21 to week of 2026-09-28) is drawn from 5 rows 55.
Tool gp_period_change; parameters {"by": "area", "areas": {"layer": "Health sub-districts (433b88cc)"}, "period": "week", "project": "2612067c-badd-4310-9678-8f580d5e3d32", "features": {"layer": "Community health worker visits (4d70d1ce)"}, "area_field": "name", "time_field": "visited_at"}
Period change
What this analysis is. Period change: Counts or sums per period (week over week, month over month, any two periods, or before and after a date), per area, per H3 cell or in total, with the places of largest rise and fall and a significance note 50. In ArcGIS it is Summarize Percent Change (Crime Analysis) or Change Point Detection 50.
Why it was run on this data. Community health worker visits carry dates in 'visited_at' over 26 weeks: the count per week, week over week, with the places of largest rise and fall per feature of Health sub-districts and whether the change is beyond chance 51.
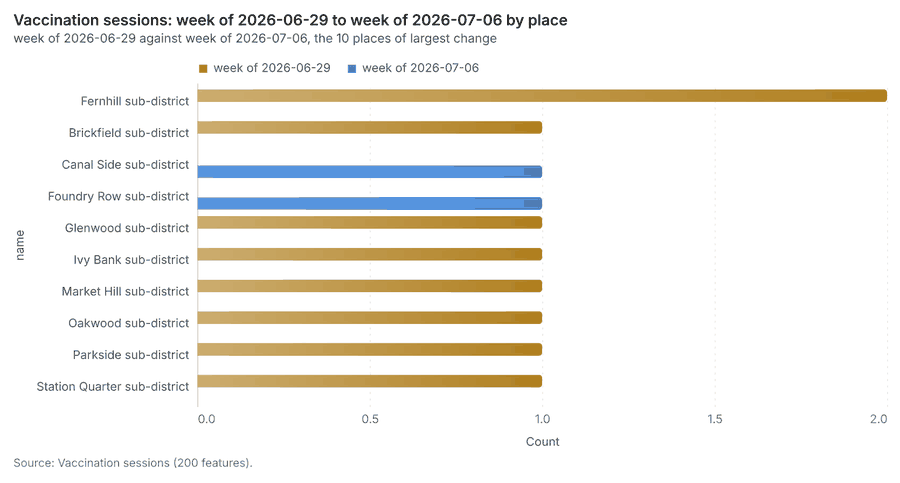
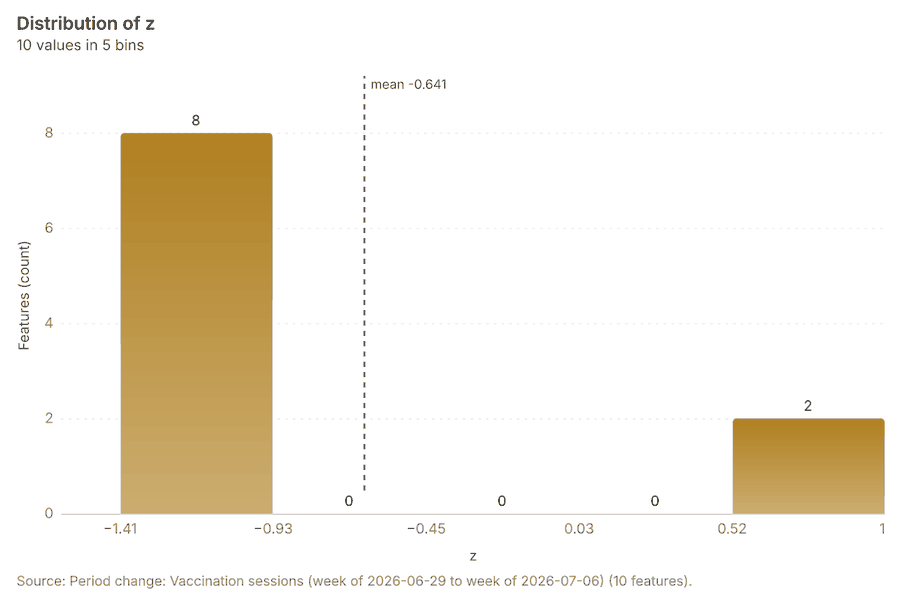
What it found. Period change on Health sub-districts, Vaccination sessions produced Period change: Vaccination sessions (week of 2026-06-29 to week of 2026-07-06) (10 features) 11121622. Vaccination sessions: count per week shows a trend of -0.00587 per week; the second half of its weeks has 103 against 95 in the first (+8.4%) 57. The chart Vaccination sessions: week of 2026-06-29 to week of 2026-07-06 by place is drawn from 20 rows 58. The chart Period change: Vaccination sessions (week of 2026-06-29 to week of 2026-07-06) is drawn from 5 rows 59.
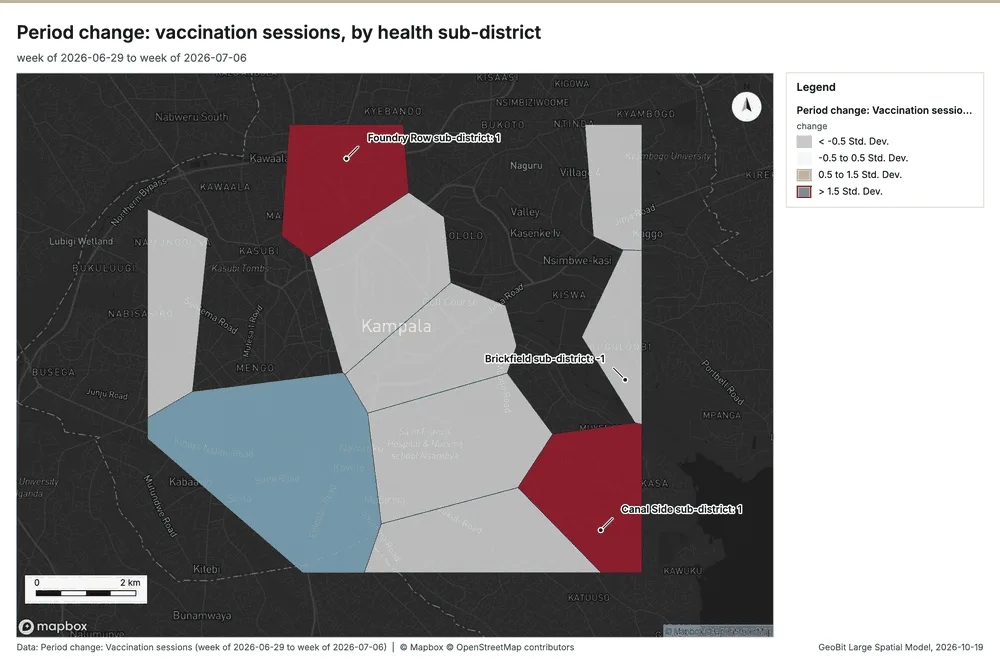
What the map shows. The map draws Period change: Vaccination sessions (week of 2026-06-29 to week of 2026-07-06) by change in 4 classes: < -0.5 Std; Dev, -0.5 to 0.5 Std; Dev, 0.5 to 1.5 Std; Dev, > 1.5 Std; Dev 56. It draws 10 features 56. It covers longitude 32.512 to 32.65 and latitude 0.261 to 0.364, at about 1:63,751 56.
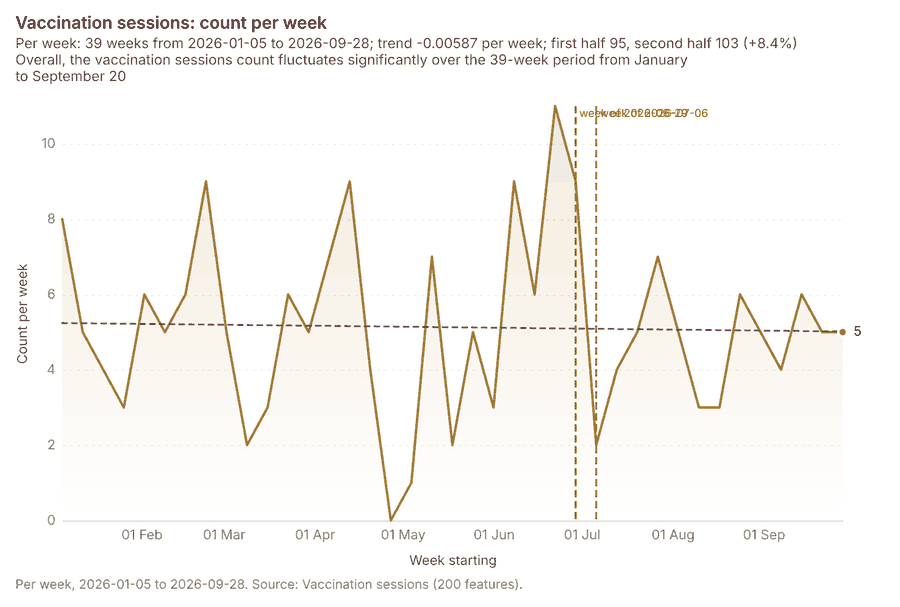
What the chart shows. Overall, the vaccination sessions count fluctuates significantly over the 39-week period from January to September 20 57.
Inferred: read from the image by gemma4:e4b, not evidence.
Findings
- Evidenced: Period change on Health sub-districts, Vaccination sessions produced Period change: Vaccination sessions (week of 2026-06-29 to week of 2026-07-06) (10 features) 11121622.
- Evidenced: Vaccination sessions: count per week shows a trend of -0.00587 per week; the second half of its weeks has 103 against 95 in the first (+8.4%) 57.
- Evidenced: The chart Vaccination sessions: week of 2026-06-29 to week of 2026-07-06 by place is drawn from 20 rows 58.
- Evidenced: The chart Period change: Vaccination sessions (week of 2026-06-29 to week of 2026-07-06) is drawn from 5 rows 59.
Tool gp_period_change; parameters {"by": "area", "areas": {"layer": "Health sub-districts (433b88cc)"}, "period": "week", "project": "2612067c-badd-4310-9678-8f580d5e3d32", "features": {"layer": "Vaccination sessions (6798c97c)"}, "area_field": "name", "time_field": "held_on"}
Period change
What this analysis is. Period change: Counts or sums per period (week over week, month over month, any two periods, or before and after a date), per area, per H3 cell or in total, with the places of largest rise and fall and a significance note 50. In ArcGIS it is Summarize Percent Change (Crime Analysis) or Change Point Detection 50.
Why it was run on this data. Community health worker visits carry dates in 'visited_at' over 26 weeks: the count per week, week over week, with the places of largest rise and fall per feature of Health sub-districts and whether the change is beyond chance 51.
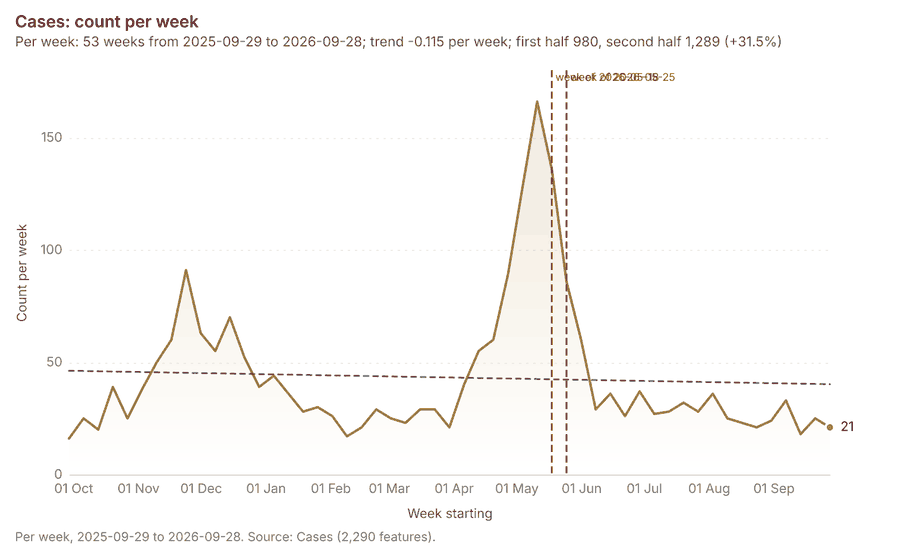
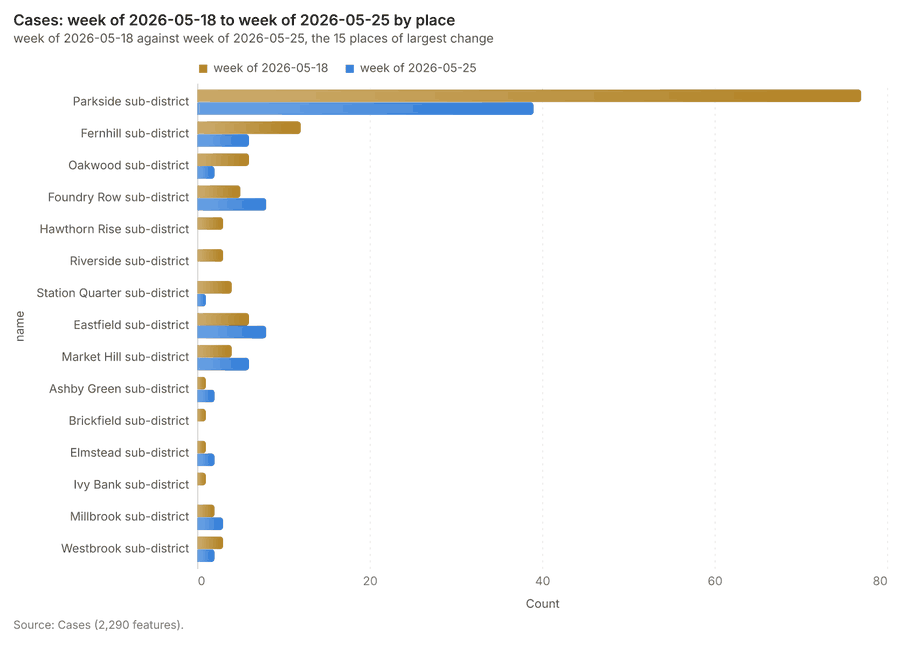
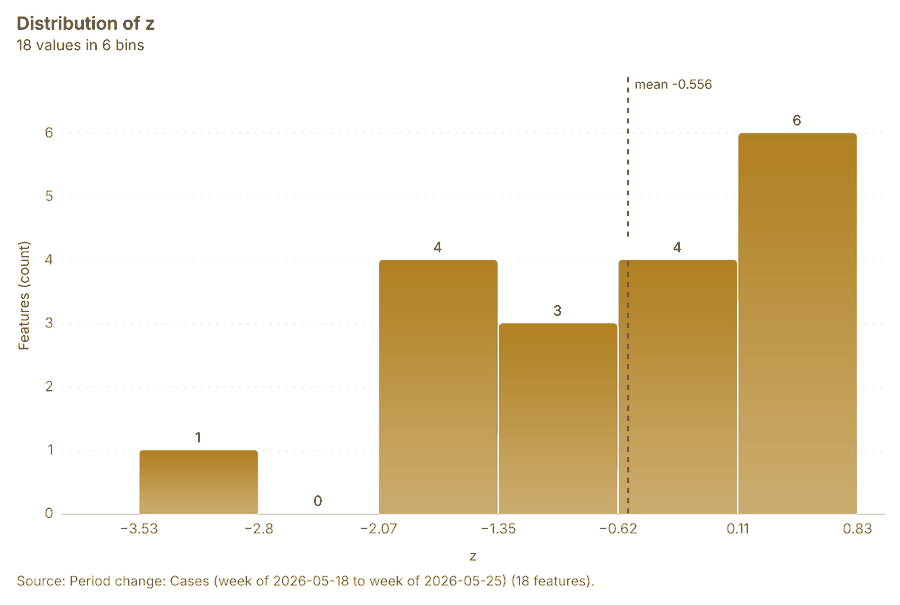
What it found. Period change on Health sub-districts, Cases produced Period change: Cases (week of 2026-05-18 to week of 2026-05-25) (18 features) 13141617. Cases: count per week shows a trend of -0.115 per week; the second half of its weeks has 1,289 against 980 in the first (+31.5%) 61. The chart Cases: week of 2026-05-18 to week of 2026-05-25 by place is drawn from 30 rows 62. The chart Period change: Cases (week of 2026-05-18 to week of 2026-05-25) is drawn from 6 rows 63.
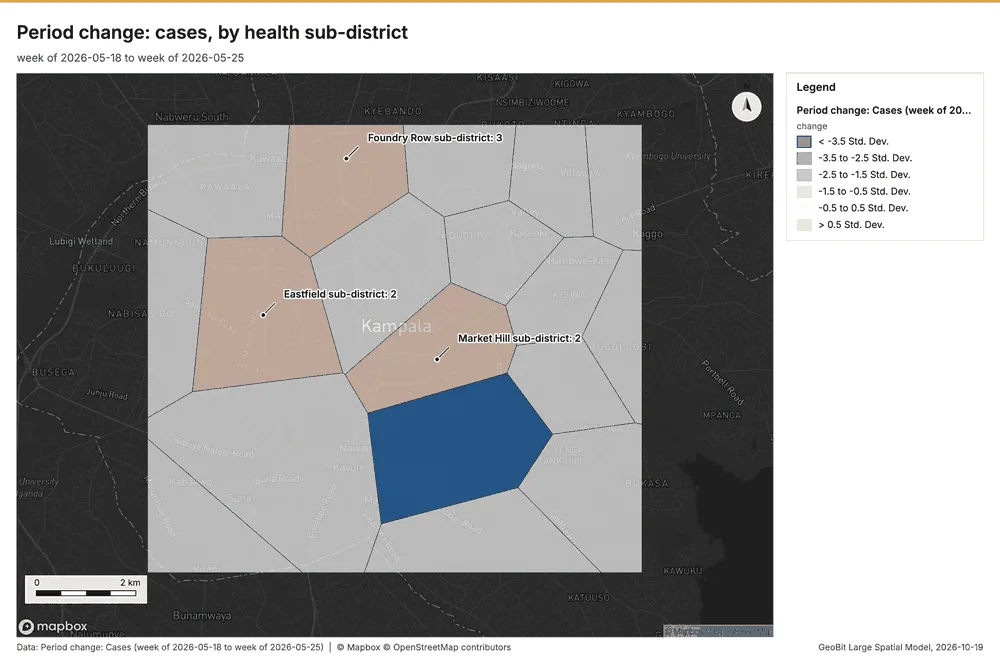
What the map shows. The map draws Period change: Cases (week of 2026-05-18 to week of 2026-05-25) by change in 6 classes: < -3.5 Std; Dev, -3.5 to -2.5 Std; Dev, -2.5 to -1.5 Std; Dev, -1.5 to -0.5 Std; Dev, -0.5 to 0.5 Std; Dev, > 0.5 Std; Dev 60. It draws 18 features 60. It covers longitude 32.512 to 32.65 and latitude 0.261 to 0.364, at about 1:63,751 60.
Findings
- Evidenced: Period change on Health sub-districts, Cases produced Period change: Cases (week of 2026-05-18 to week of 2026-05-25) (18 features) 13141617.
- Evidenced: Cases: count per week shows a trend of -0.115 per week; the second half of its weeks has 1,289 against 980 in the first (+31.5%) 61.
- Evidenced: The chart Cases: week of 2026-05-18 to week of 2026-05-25 by place is drawn from 30 rows 62.
- Evidenced: The chart Period change: Cases (week of 2026-05-18 to week of 2026-05-25) is drawn from 6 rows 63.
Tool gp_period_change; parameters {"by": "area", "areas": {"layer": "Health sub-districts (433b88cc)"}, "period": "week", "project": "2612067c-badd-4310-9678-8f580d5e3d32", "features": {"layer": "Cases (03c8f72b)"}, "area_field": "name", "time_field": "onset_date"}
Calculate density
What this analysis is. Calculate density: Kernel density per square kilometer on a grid 64. In ArcGIS it is Calculate Density or Kernel Density; in QGIS, native:heatmapkerneldensityestimation 64.
Why it was run on this data. 1000 points in Community health worker visits: a density surface shows where they concentrate 65. Measured: Community health worker visits are clustered (nearest-neighbor ratio 0.95, z = -3.3), median spacing 124 m 65.
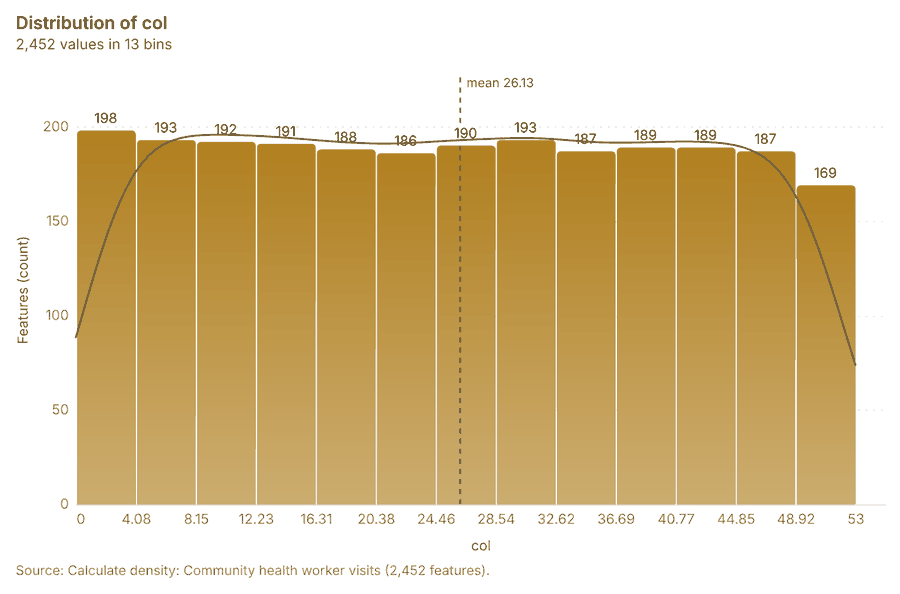
What it found. Calculate density on Community health worker visits: Calculate density: 1 layer saved: Calculate density: Community health worker visits (2452 features) 2066. It reported result, count 2,452; result, elapsed ms 43; result, bandwidth m 500; result, cell size m 200; result, excluded null 0; result, max density per km2 34.43 66.
| Result | Value |
|---|---|
| result, count | 2,452 |
| result, elapsed ms | 43 |
| result, bandwidth m | 500 |
| result, cell size m | 200 |
| result, excluded null | 0 |
| result, max density per km2 | 34.43 |
| billing, cost | 0.07 |
| billing, list price | 0.07 |
| billing, upstream cost | 0 |
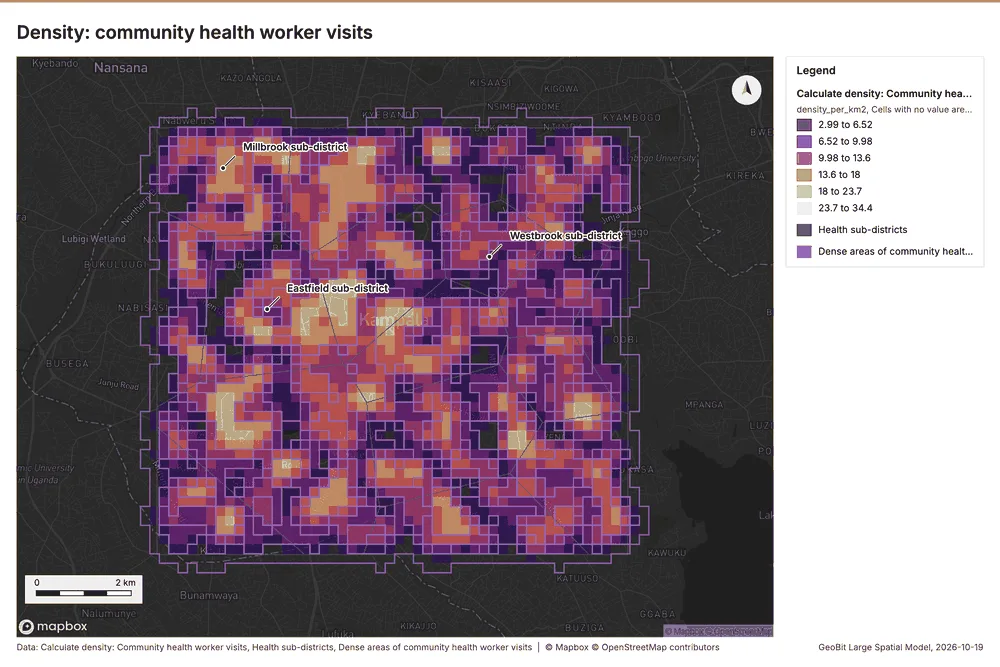
What the map shows. The map draws Calculate density: Community health worker visits by density_per_km2 in 6 classes: 2.99 to 6.52, 6.52 to 9.98, 9.98 to 13.6, 13.6 to 18, 18 to 23.7, 23.7 to 34.4 67. The map draws Health sub-districts with one symbol 67. The map draws Dense areas of community health worker visits with one symbol 67. It draws 2,475 features 67. It covers longitude 32.509 to 32.654 and latitude 0.257 to 0.368, at about 1:66,921 67.
Findings
- Evidenced: Calculate density on Community health worker visits: Calculate density: 1 layer saved: Calculate density: Community health worker visits (2452 features) 2066.
- Evidenced: It reported result, count 2,452; result, elapsed ms 43; result, bandwidth m 500; result, cell size m 200; result, excluded null 0; result, max density per km2 34.43 66.
A model draft was discarded because a sentence did not cite a source of this section.
Tool gp_calculate_density; parameters {"kernel": "quartic", "project": "2612067c-badd-4310-9678-8f580d5e3d32", "features": {"layer": "Community health worker visits (4d70d1ce)"}, "bandwidth_m": 500.0, "cell_size_m": 200.0}
Calculate density
What this analysis is. Calculate density: Kernel density per square kilometer on a grid 64. In ArcGIS it is Calculate Density or Kernel Density; in QGIS, native:heatmapkerneldensityestimation 64.
Why it was run on this data. 2290 points in Cases: a density surface shows where they concentrate 68. Measured: Cases are clustered (nearest-neighbor ratio 0.90, z = -9.4), median spacing 75.6 m 68.
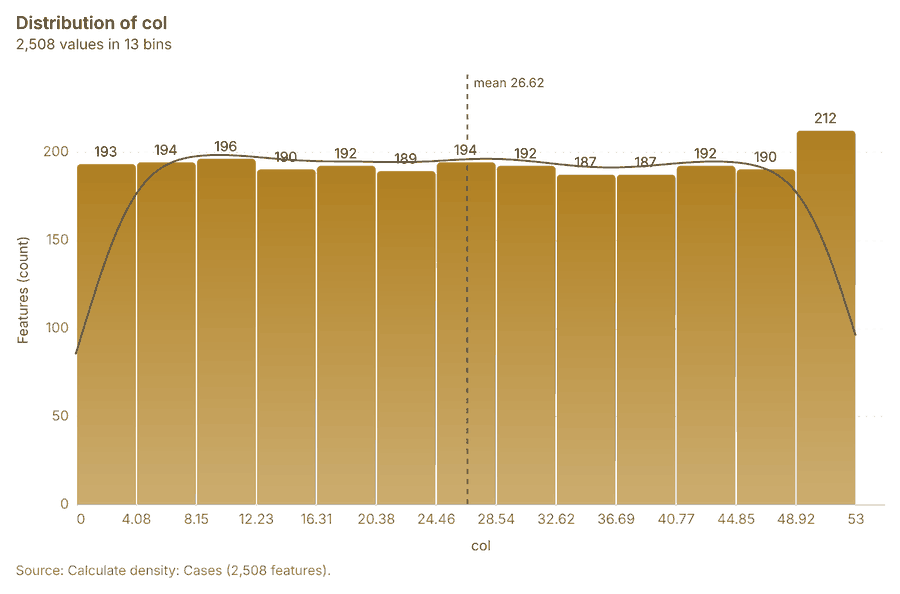
What it found. The density was calculated using the Cases input 17 and processed 2,508 features 69.
| Result | Value |
|---|---|
| result, count | 2,508 |
| result, elapsed ms | 49 |
| result, bandwidth m | 500 |
| result, cell size m | 200 |
| result, excluded null | 0 |
| result, max density per km2 | 282 |
| billing, cost | 0.0958 |
| billing, list price | 0.0958 |
| billing, upstream cost | 0 |
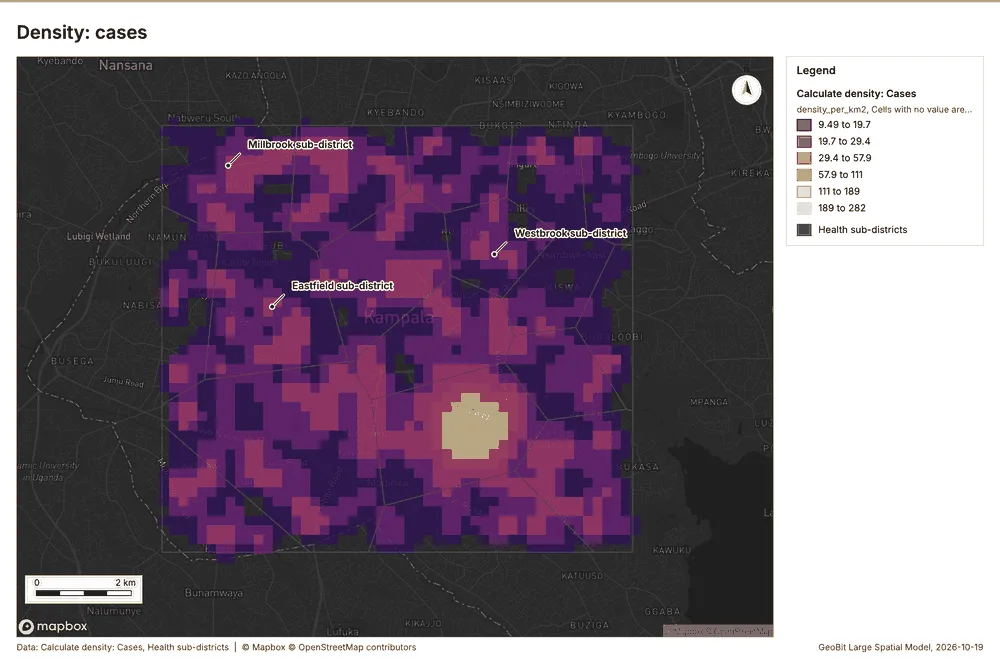
What the map shows. The map draws Calculate density: Cases by density_per_km2 in 6 classes: 9.49 to 19.7, 19.7 to 29.4, 29.4 to 57.9, 57.9 to 111, 111 to 189, 189 to 282 70. The map draws Health sub-districts with one symbol 70. It draws 2,526 features 70. It covers longitude 32.508 to 32.653 and latitude 0.257 to 0.367, at about 1:66,921 70.
Findings
- Evidenced: Calculate density on Cases: Calculate density: 1 layer saved: Calculate density: Cases (2508 features) 1769.
- Evidenced: It reported result, count 2,508; result, elapsed ms 49; result, bandwidth m 500; result, cell size m 200; result, excluded null 0; result, max density per km2 282 69.
Tool gp_calculate_density; parameters {"kernel": "quartic", "project": "2612067c-badd-4310-9678-8f580d5e3d32", "features": {"layer": "Cases (03c8f72b)"}, "bandwidth_m": 500.0, "cell_size_m": 200.0}
Calculate density
What this analysis is. Calculate density: Kernel density per square kilometer on a grid 64. In ArcGIS it is Calculate Density or Kernel Density; in QGIS, native:heatmapkerneldensityestimation 64.
Why it was run on this data. 200 points in Vaccination sessions: a density surface shows where they concentrate 71.
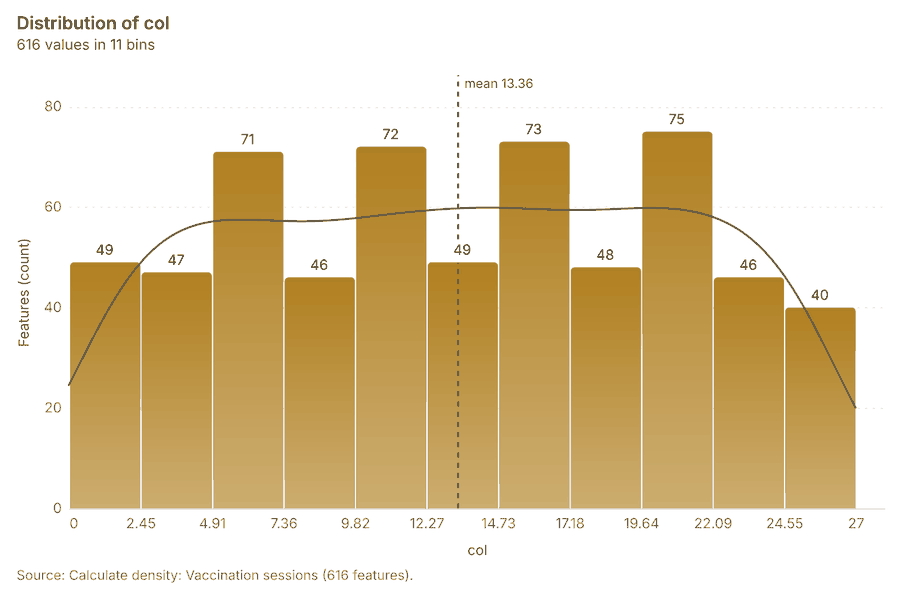
What it found. Calculate density on Vaccination sessions: Calculate density: 1 layer saved: Calculate density: Vaccination sessions (616 features) 2272. It reported result, count 616; result, elapsed ms 105; result, bandwidth m 2,000; result, cell size m 500; result, excluded null 0; result, max density per km2 5.525 72.
| Result | Value |
|---|---|
| result, count | 616 |
| result, elapsed ms | 105 |
| result, bandwidth m | 2,000 |
| result, cell size m | 500 |
| result, excluded null | 0 |
| result, max density per km2 | 5.525 |
| billing, cost | 0.054 |
| billing, list price | 0.054 |
| billing, upstream cost | 0 |
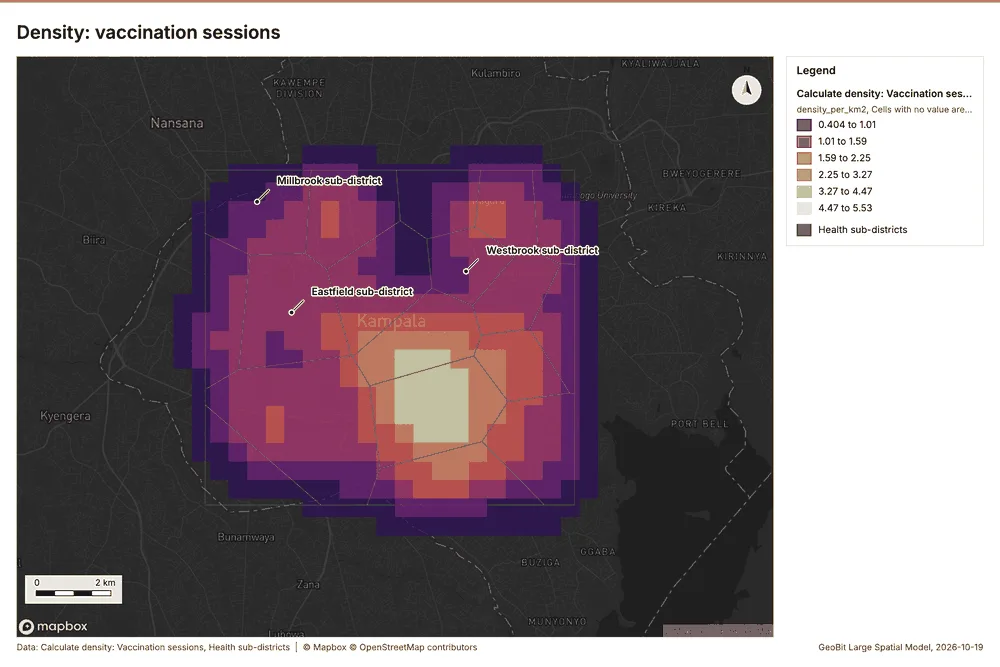
What the map shows. The map draws Calculate density: Vaccination sessions by density_per_km2 in 6 classes: 0.404 to 1.01, 1.01 to 1.59, 1.59 to 2.25, 2.25 to 3.27, 3.27 to 4.47, 4.47 to 5.53 73. The map draws Health sub-districts with one symbol 73. It draws 634 features 73. It covers longitude 32.49 to 32.674 and latitude 0.241 to 0.382, at about 1:85,295 73.
Findings
- Evidenced: Calculate density on Vaccination sessions: Calculate density: 1 layer saved: Calculate density: Vaccination sessions (616 features) 2272.
- Evidenced: It reported result, count 616; result, elapsed ms 105; result, bandwidth m 2,000; result, cell size m 500; result, excluded null 0; result, max density per km2 5.525 72.
Tool gp_calculate_density; parameters {"kernel": "quartic", "project": "2612067c-badd-4310-9678-8f580d5e3d32", "features": {"layer": "Vaccination sessions (6798c97c)"}, "bandwidth_m": 2000.0, "cell_size_m": 500.0}
Find point clusters
What this analysis is. Find point clusters: Density-based clusters (DBSCAN, HDBSCAN or OPTICS, optionally space-time) with hulls and noise 74. In ArcGIS it is Find Point Clusters or Density-based Clustering; in QGIS, native:dbscanclustering or native:stdbscanclustering 74.
Why it was run on this data. DBSCAN finds dense groups of Community health worker visits and separates noise 75. Measured: Community health worker visits are clustered (nearest-neighbor ratio 0.95, z = -3.3), median spacing 124 m 75. DBSCAN at 200 m (twice the measured spacing) 75.
What it found. Find point clusters on Community health worker visits: Find point clusters: 1 layer saved: Find point clusters: Community health worker visits (1000 features) 2076. It reported result, count 1,000; result, noise 1,000; result, distance m 200; result, elapsed ms 576; result, min points 20; billing, cost 0.07 76.
| Result | Value |
|---|---|
| result, count | 1,000 |
| result, noise | 1,000 |
| result, distance m | 200 |
| result, elapsed ms | 576 |
| result, min points | 20 |
| billing, cost | 0.07 |
| billing, list price | 0.07 |
| billing, upstream cost | 0 |
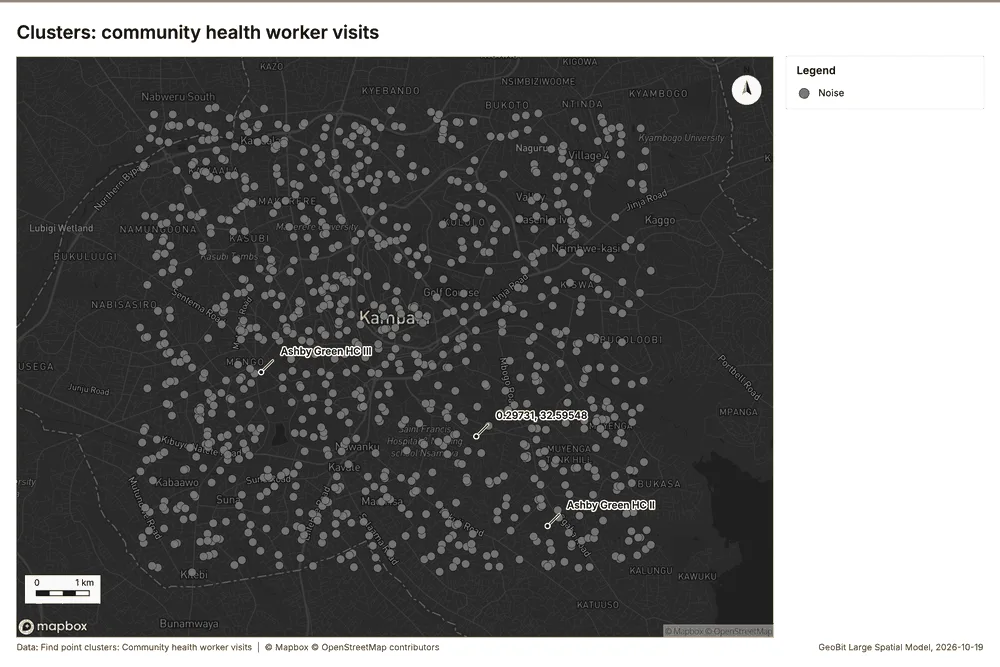
What the map shows. The map draws Find point clusters: Community health worker visits with one symbol 77. It draws 1,000 features 77. It covers longitude 32.516 to 32.647 and latitude 0.263 to 0.363, at about 1:60,312 77.
Findings
- Evidenced: Find point clusters on Community health worker visits: Find point clusters: 1 layer saved: Find point clusters: Community health worker visits (1000 features) 2076.
- Evidenced: It reported result, count 1,000; result, noise 1,000; result, distance m 200; result, elapsed ms 576; result, min points 20; billing, cost 0.07 76.
Tool gp_find_point_clusters; parameters {"method": "dbscan", "project": "2612067c-badd-4310-9678-8f580d5e3d32", "features": {"layer": "Community health worker visits (4d70d1ce)"}, "distance_m": 200.0, "min_points": 20}
Find point clusters
What this analysis is. Find point clusters: Density-based clusters (DBSCAN, HDBSCAN or OPTICS, optionally space-time) with hulls and noise 74. In ArcGIS it is Find Point Clusters or Density-based Clustering; in QGIS, native:dbscanclustering or native:stdbscanclustering 74.
Why it was run on this data. DBSCAN finds dense groups of Cases and separates noise 78. Measured: Cases are clustered (nearest-neighbor ratio 0.90, z = -9.4), median spacing 75.6 m 78. DBSCAN at 200 m (twice the measured spacing) 78.
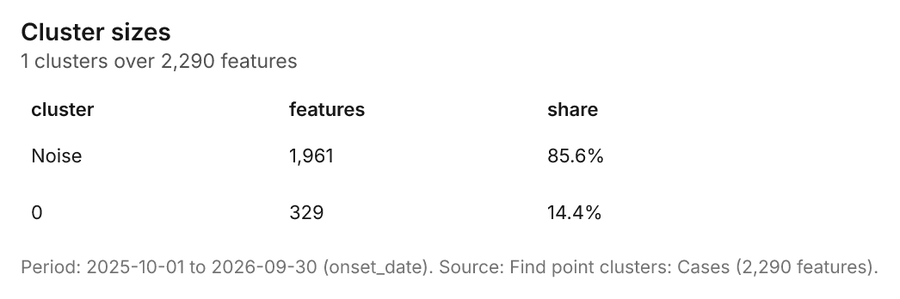
What it found. Find point clusters on Cases: Find point clusters: 2 layers saved: Find point clusters: Cases (2290 features); Find point clusters: cluster hulls (1 feature) 1779. It reported result, count 2,290; result, noise 1,961; result, distance m 200; result, elapsed ms 24; result, min points 20; billing, cost 0.0958 79.
| Result | Value |
|---|---|
| result, count | 2,290 |
| result, noise | 1,961 |
| result, distance m | 200 |
| result, elapsed ms | 24 |
| result, min points | 20 |
| billing, cost | 0.0958 |
| billing, list price | 0.0958 |
| billing, upstream cost | 0 |
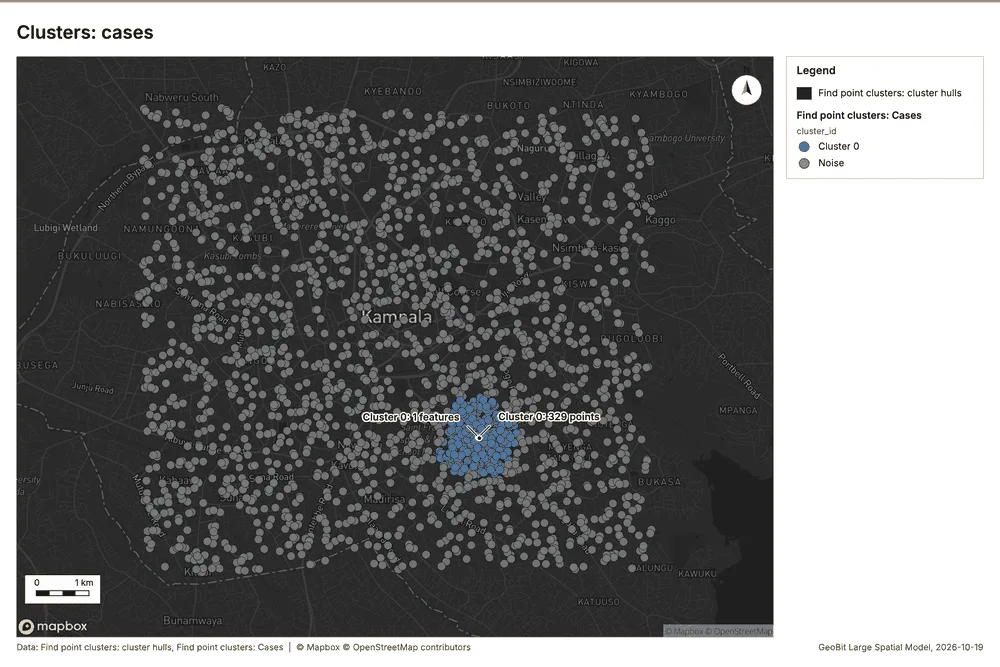
What the map shows. The map draws Find point clusters: cluster hulls with one symbol 80. The map draws Find point clusters: Cases by cluster_id in 2 classes: Cluster 0, Noise 80. It draws 2,291 features 80. It covers longitude 32.516 to 32.647 and latitude 0.262 to 0.363, at about 1:60,732 80.
Findings
- Evidenced: Find point clusters on Cases: Find point clusters: 2 layers saved: Find point clusters: Cases (2290 features); Find point clusters: cluster hulls (1 feature) 1779.
- Evidenced: It reported result, count 2,290; result, noise 1,961; result, distance m 200; result, elapsed ms 24; result, min points 20; billing, cost 0.0958 79.
Tool gp_find_point_clusters; parameters {"method": "dbscan", "project": "2612067c-badd-4310-9678-8f580d5e3d32", "features": {"layer": "Cases (03c8f72b)"}, "distance_m": 200.0, "min_points": 20}
Outliers
What this analysis is. Find outliers: Anselin local Moran’s I: HH, LL clusters and HL, LH outliers 81. In ArcGIS it is Find Outliers or Cluster and Outlier Analysis (Anselin Local Moran’s I) 81.
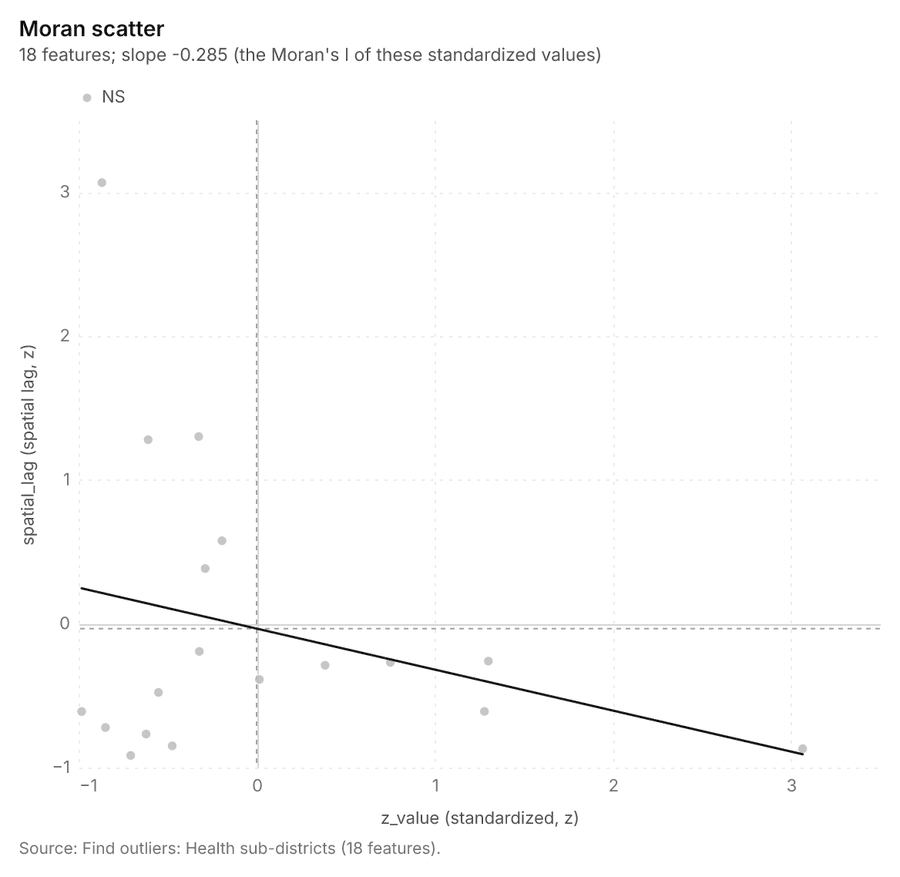
Why it was run on this data. Local Moran's I maps clusters and outliers of 'population' 82. Measured: Health sub-districts have 39 neighboring pairs (4.33 neighbors per area, 0 isolated), so neighbors can be compared 82.
What it found. The outlier analysis process used Health sub-districts as input data 16. The operation, which saved 1 layer for Health sub-districts, successfully analyzed 18 features 83.
| Result | Value |
|---|---|
| result, count | 18 |
| result, elapsed ms | 2 |
| result, permutations | 199 |
| result, excluded null | 0 |
| result, distance band m | 2,467 |
| billing, cost | 0.05054 |
| billing, list price | 0.05054 |
| billing, upstream cost | 0 |
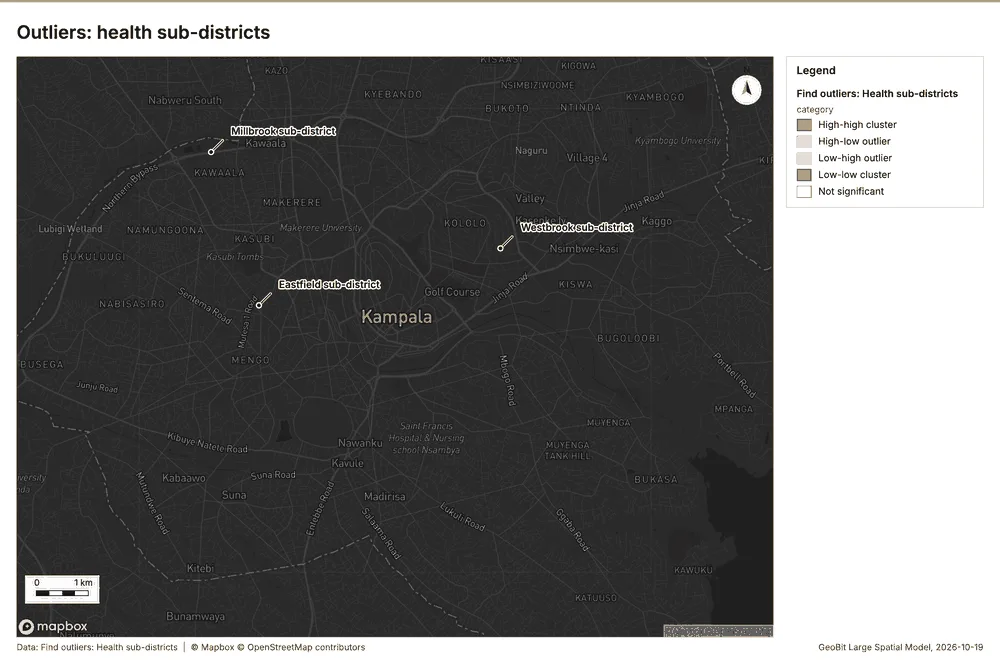
What the map shows. The map draws Find outliers: Health sub-districts by category in 5 classes: High-high cluster, High-low outlier, Low-high outlier, Low-low cluster, Not significant 84. It draws 18 features 84. It covers longitude 32.515 to 32.648 and latitude 0.261 to 0.363, at about 1:61,580 84.
Findings
- Evidenced: Outliers on Health sub-districts: Find outliers: 1 layer saved: Find outliers: Health sub-districts (18 features) 1683.
- Evidenced: It reported result, count 18; result, elapsed ms 2; result, permutations 199; result, excluded null 0; result, distance band m 2,467; billing, cost 0.05054 83.
Tool gp_outliers; parameters {"field": "population", "project": "2612067c-badd-4310-9678-8f580d5e3d32", "features": {"layer": "Health sub-districts (433b88cc)"}, "aggregation": "hexagon"}
What follows from the results
Change beside the counts per health sub-district, from Period change: Cases (week of 2026-05-18 to week of 2026-05-25) and Summarize within: Health sub-districts: the busiest area, Parkside sub-district (32 in all), changed by -38 871346. Change of vaccination sessions where density is high, from Period change: Vaccination sessions (week of 2026-06-29 to week of 2026-07-06) and Calculate density: Community health worker visits: the largest rise (+1, Canal Side sub-district) is where density averages 10.88 per square kilometer 921166. Hot cells of cases per health sub-district, from Hot spot analysis: Cases: 8 of 18 areas hold hot spot cells; Parkside sub-district holds the most (103) 9737. Nearest outbreak response team to each cluster of cases, from Find point clusters: cluster hulls: the 1 clusters lie 0 to 0 m from the nearest facility (Rapid response team 1 and others) 10379. Dense areas of community health worker visits, from Calculate density: Community health worker visits: the densest of five classes joins 491 cells into one area 11066. Change of vaccination sessions per health sub-district, from Period change: Vaccination sessions (week of 2026-06-29 to week of 2026-07-06): Canal Side sub-district rose the most (+1) and Fernhill sub-district fell the most (-2) 11311. Outbreak response teams within 250 m of each cluster of cases, from Find point clusters: cluster hulls: 1 of 1 clusters have one within 250 m 11879. Density of community health worker visits and cases together, from Calculate density: Community health worker visits and Calculate density: Cases: 4960 features from 2 sources 1236669.
Findings
- Evidenced: Change beside the counts per health sub-district, from Period change: Cases (week of 2026-05-18 to week of 2026-05-25) and Summarize within: Health sub-districts: the busiest area, Parkside sub-district (32 in all), changed by -38 871346.
- Evidenced: Change of vaccination sessions where density is high, from Period change: Vaccination sessions (week of 2026-06-29 to week of 2026-07-06) and Calculate density: Community health worker visits: the largest rise (+1, Canal Side sub-district) is where density averages 10.88 per square kilometer 921166.
- Evidenced: Hot cells of cases per health sub-district, from Hot spot analysis: Cases: 8 of 18 areas hold hot spot cells; Parkside sub-district holds the most (103) 9737.
- Evidenced: Nearest outbreak response team to each cluster of cases, from Find point clusters: cluster hulls: the 1 clusters lie 0 to 0 m from the nearest facility (Rapid response team 1 and others) 10379.
- Evidenced: Dense areas of community health worker visits, from Calculate density: Community health worker visits: the densest of five classes joins 491 cells into one area 11066.
- Evidenced: Change of vaccination sessions per health sub-district, from Period change: Vaccination sessions (week of 2026-06-29 to week of 2026-07-06): Canal Side sub-district rose the most (+1) and Fernhill sub-district fell the most (-2) 11311.
- Evidenced: Outbreak response teams within 250 m of each cluster of cases, from Find point clusters: cluster hulls: 1 of 1 clusters have one within 250 m 11879.
- Evidenced: Density of community health worker visits and cases together, from Calculate density: Community health worker visits and Calculate density: Cases: 4960 features from 2 sources 1236669.
Change beside the counts per health sub-district
What this analysis is. Spatial join: Attach attributes (or aggregates) of matching features from another layer, by location, distance, time and attributes 85. In ArcGIS it is Join Features or Spatial Join; in QGIS, native:joinattributesbylocation or native:joinbylocationsummary 85.
Why it was run on this data. It was run toward the goal "Describe the project Sample: Public health, Kampala: run the analyses that tell the most about its data, draw every result, and write a cited report" 86.
What it found. Spatial join on Summarize within: Health sub-districts, Period change: Cases (week of 2026-05-18 to week of 2026-05-25) produced Change beside the counts per health sub-district (18 features) 14878889. It reported result, count 18; result, elapsed ms 1; billing, cost 0.01074; billing, list price 0.01074; billing, upstream cost 0 87. The chart Change beside the counts per health sub-district is drawn from 6 rows 91.
| Result | Value |
|---|---|
| result, count | 18 |
| result, elapsed ms | 1 |
| billing, cost | 0.01074 |
| billing, list price | 0.01074 |
| billing, upstream cost | 0 |
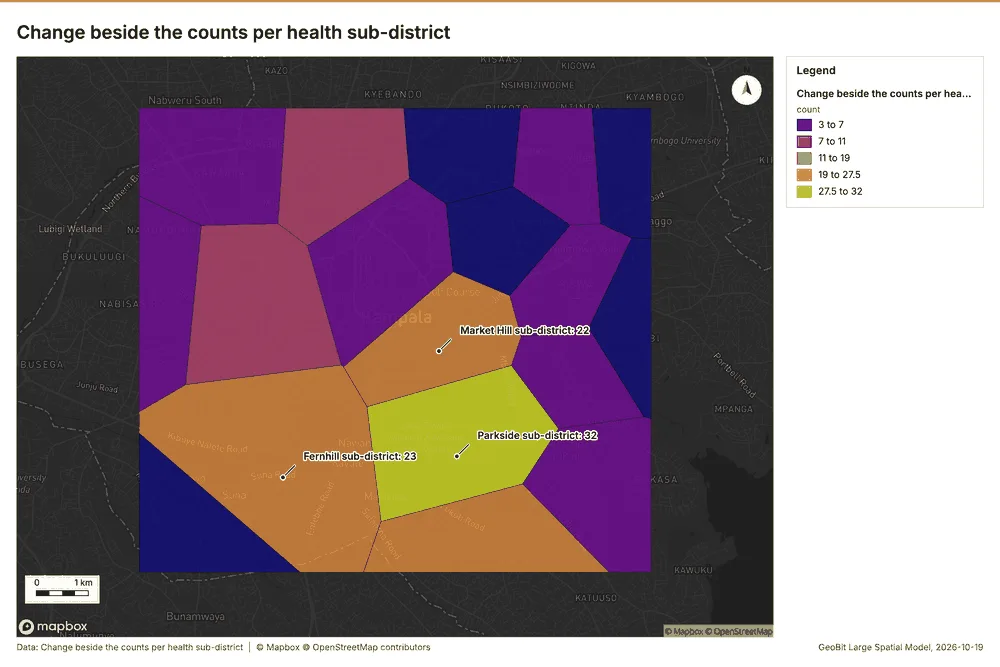
What the map shows. The map draws Change beside the counts per health sub-district by count in 5 classes: 3 to 7, 7 to 11, 11 to 19, 19 to 27.5, 27.5 to 32 90. It draws 18 features 90. It covers longitude 32.515 to 32.648 and latitude 0.261 to 0.363, at about 1:61,580 90.
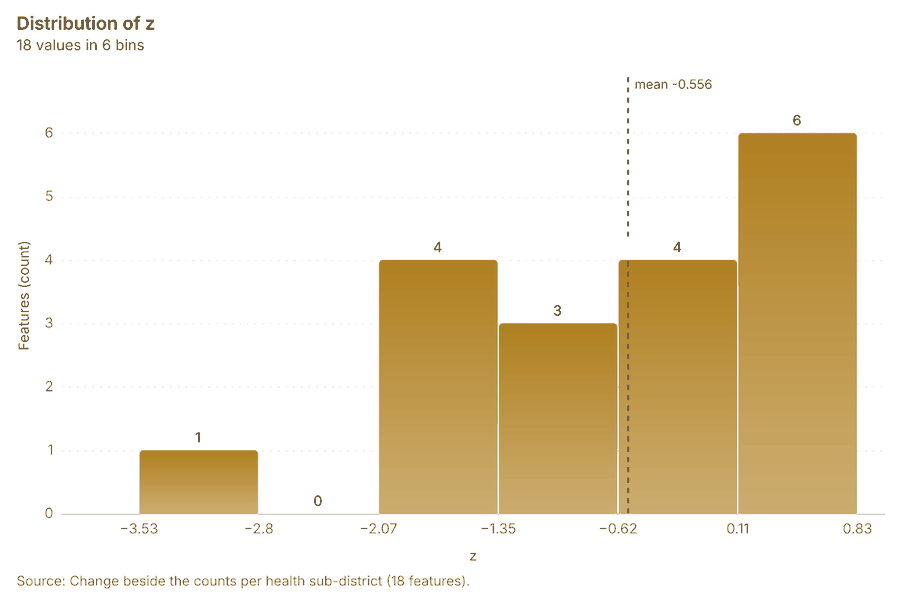
Findings
- Evidenced: Spatial join on Summarize within: Health sub-districts, Period change: Cases (week of 2026-05-18 to week of 2026-05-25) produced Change beside the counts per health sub-district (18 features) 14878889.
- Evidenced: It reported result, count 18; result, elapsed ms 1; billing, cost 0.01074; billing, list price 0.01074; billing, upstream cost 0 87.
- Evidenced: The chart Change beside the counts per health sub-district is drawn from 6 rows 91.
Tool gp_spatial_join; parameters {"join": {"layer": "Summarize within: Health sub-districts (9220b574)"}, "fields": ["count"], "target": {"layer": "Period change: Cases (week of 2026-05-18 to week of 2026-05-25) (66f934f7)"}, "project": "2612067c-badd-4310-9678-8f580d5e3d32", "predicate": "largest_overlap", "output_name": "Change beside the counts per health sub-district"}
Change of vaccination sessions where density is high
What this analysis is. Spatial join: Attach attributes (or aggregates) of matching features from another layer, by location, distance, time and attributes 85. In ArcGIS it is Join Features or Spatial Join; in QGIS, native:joinattributesbylocation or native:joinbylocationsummary 85.
Why it was run on this data. It was run toward the goal "Describe the project Sample: Public health, Kampala: run the analyses that tell the most about its data, draw every result, and write a cited report" 86.
What it found. The analysis utilized a spatial join 92, integrating data derived from Calculate density: Community health worker visits 93 and the specific period change for Vaccination sessions (week of 2026-06-
| Result | Value |
|---|---|
| result, count | 10 |
| result, elapsed ms | 3 |
| billing, cost | 0.05926 |
| billing, list price | 0.05926 |
| billing, upstream cost | 0 |
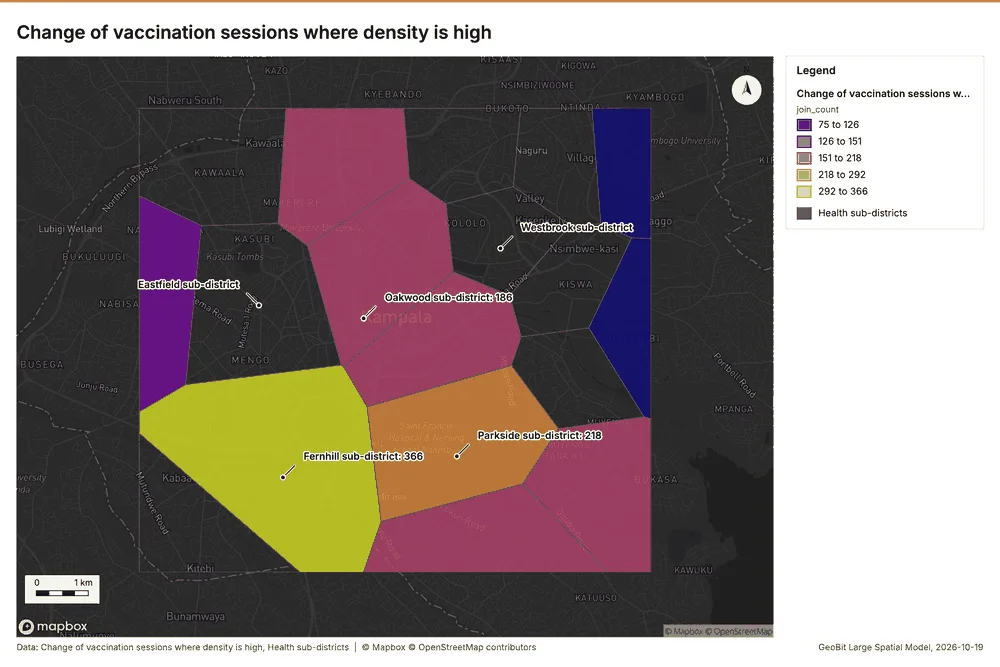
What the map shows. The map draws Change of vaccination sessions where density is high by join_count in 5 classes: 75 to 126, 126 to 151, 151 to 218, 218 to 292, 292 to 366 95. The map draws Health sub-districts with one symbol 95. It draws 28 features 95. It covers longitude 32.515 to 32.648 and latitude 0.261 to 0.363, at about 1:61,580 95.
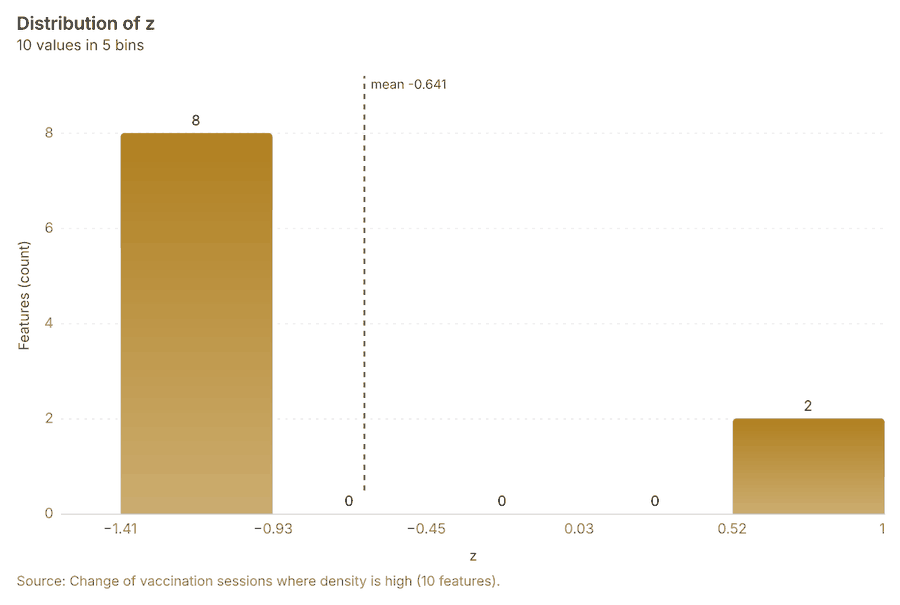
Findings
- Evidenced: Spatial join on Calculate density: Community health worker visits, Period change: Vaccination sessions (week of 2026-06-29 to week of 2026-07-06) produced Change of vaccination sessions where density is high (10 features) 12929394.
- Evidenced: It reported result, count 10; result, elapsed ms 3; billing, cost 0.05926; billing, list price 0.05926; billing, upstream cost 0 92.
- Evidenced: The chart Change of vaccination sessions where density is high is drawn from 5 rows 96.
Tool gp_spatial_join; parameters {"join": {"layer": "Calculate density: Community health worker visits (3aeb4280)"}, "stats": [{"agg": "mean", "field": "density_per_km2"}], "target": {"layer": "Period change: Vaccination sessions (week of 2026-06-29 to week of 2026-07-06) (3345972d)"}, "project": "2612067c-badd-4310-9678-8f580d5e3d32", "predicate": "intersects", "output_name": "Change of vaccination sessions where density is high
Hot cells of cases per health sub-district
What this analysis is. Summarize within: Count and aggregate the features inside each polygon (or bin), proportionally for lines and polygons 42. In ArcGIS it is Summarize Within or Aggregate Points; in QGIS, native:countpointsinpolygon or native:sumlinelengths 42.
Why it was run on this data. Count Community health worker visits inside each feature of Health sub-districts by purpose; the counts map as a choropleth (natural breaks, sequential colors) 43.
What it found. Summarize within on Hot spot analysis: Cases, Health sub-districts produced Hot cells of cases per health sub-district (18 features) 16979899. It reported result, count 18; result, elapsed ms 38; billing, cost 0.05554; billing, list price 0.05554; billing, upstream cost 0 97. The chart Hot cells of cases per health sub-district is drawn from 6 rows 101.
| Result | Value |
|---|---|
| result, count | 18 |
| result, elapsed ms | 38 |
| billing, cost | 0.05554 |
| billing, list price | 0.05554 |
| billing, upstream cost | 0 |
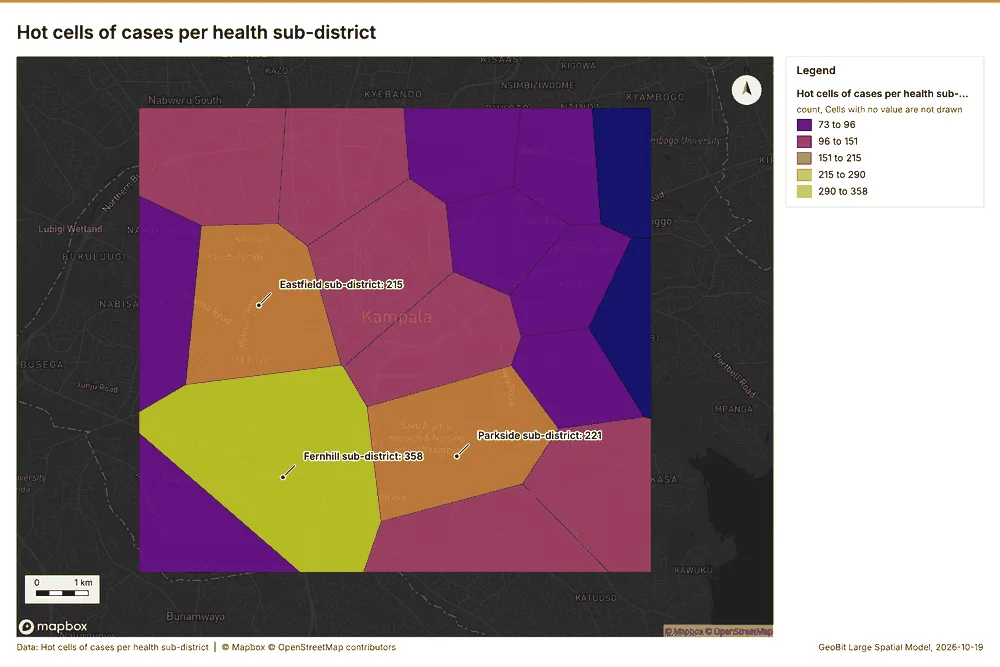
What the map shows. The map draws Hot cells of cases per health sub-district by count in 5 classes: 73 to 96, 96 to 151, 151 to 215, 215 to 290, 290 to 358 100. It draws 18 features 100. It covers longitude 32.515 to 32.648 and latitude 0.261 to 0.363, at about 1:61,580 100.
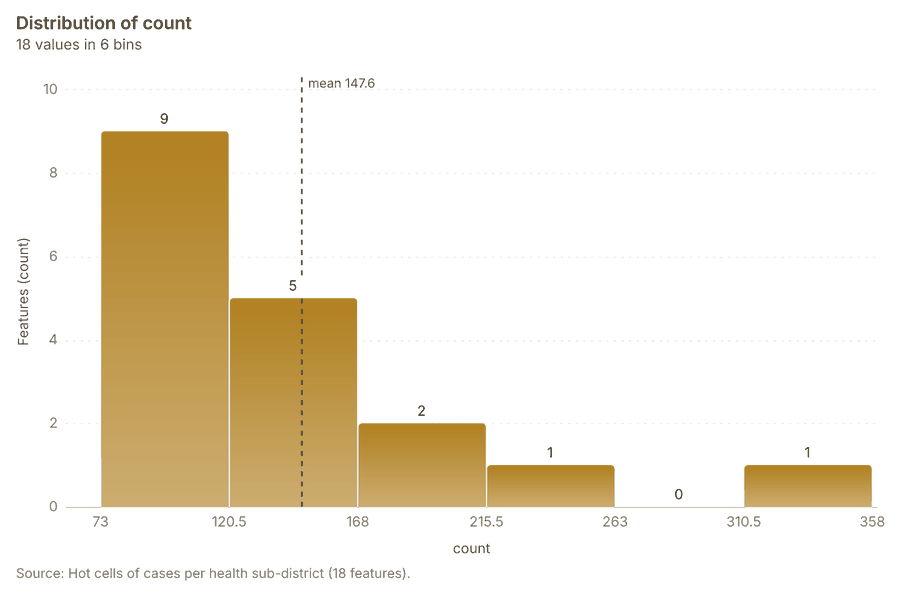
Findings
- Evidenced: Summarize within on Hot spot analysis: Cases, Health sub-districts produced Hot cells of cases per health sub-district (18 features) 16979899.
- Evidenced: It reported result, count 18; result, elapsed ms 38; billing, cost 0.05554; billing, list price 0.05554; billing, upstream cost 0 97.
- Evidenced: The chart Hot cells of cases per health sub-district is drawn from 6 rows 101.
Tool gp_summarize_within; parameters {"project": "2612067c-badd-4310-9678-8f580d5e3d32", "features": {"layer": "Hot spot analysis: Cases (7dc9eb55)"}, "group_by": "gi_bin", "polygons": {"layer": "Health sub-districts (433b88cc)"}, "output_name": "Hot cells of cases per health sub-district"}
Nearest outbreak response team to each cluster of cases
What this analysis is. Find nearest: The k nearest features for each input, with geodesic distance and bearing 102. In ArcGIS it is Find Nearest or Near; in QGIS, native:joinbynearest or native:nearestneighbouranalysis 102.
Why it was run on this data. It was run toward the goal "Describe the project Sample: Public health, Kampala: run the analyses that tell the most about its data, draw every result, and write a cited report" 86.
What it found. The gp_find_nearest tool was executed using the Outbreak response teams input data 21. This analysis used the cluster hulls from 104 to determine the nearest outbreak response team to each cluster of cases 105. The operation generated one result, completing in 2 103 milliseconds and incurring a cost of 0.01014 103. A chart detailing the nearest outbreak response team to each cluster of cases was generated, containing 1 row 107.
| Result | Value |
|---|---|
| result, count | 1 |
| result, elapsed ms | 2 |
| billing, cost | 0.01014 |
| billing, list price | 0.01014 |
| billing, upstream cost | 0 |
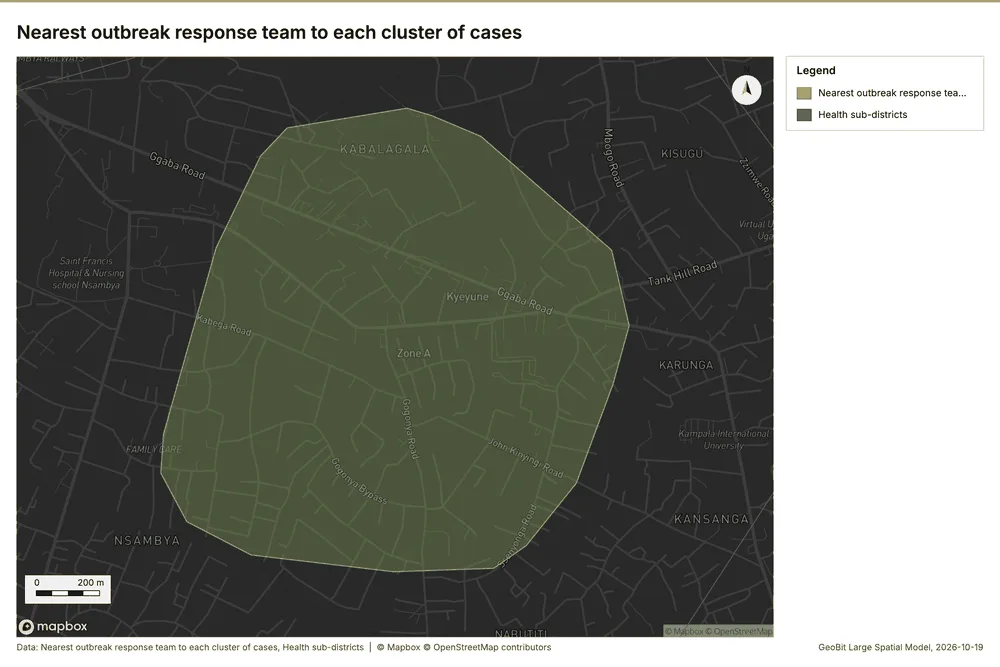
What the map shows. The map draws Nearest outbreak response team to each cluster of cases with one symbol 106. The map draws Health sub-districts with one symbol 106. It draws 19 features 106. It covers longitude 32.585 to 32.606 and latitude 0.289 to 0.305, at about 1:10,087 106.
Findings
- Evidenced: Find nearest on Outbreak response teams, Find point clusters: cluster hulls produced Nearest outbreak response team to each cluster of cases (1 features) 21103104105.
- Evidenced: It reported result, count 1; result, elapsed ms 2; billing, cost 0.01014; billing, list price 0.01014; billing, upstream cost 0 103.
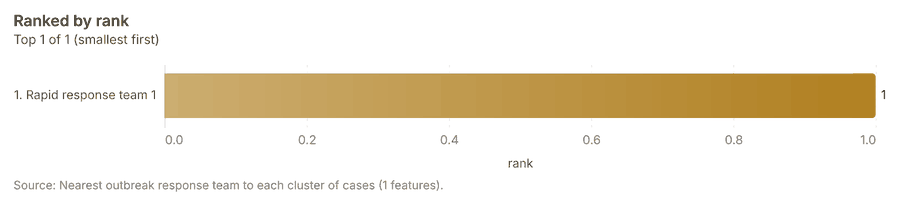
- Evidenced: The chart Nearest outbreak response team to each cluster of cases is drawn from 1 rows 107.
Tool gp_find_nearest; parameters {"k": 1, "to": {"layer": "Outbreak response teams (1b8f0e74)"}, "from": {"layer": "Find point clusters: cluster hulls (53d9a3e2)"}, "project": "2612067c-badd-4310-9678-8f580d5e3d32", "output_name": "Nearest outbreak response team to each cluster of cases"}
Dense areas of community health worker visits
What this analysis is. Pipeline: Run up to 20 GIS operations in one engine call; a step's params may use "$id" (an earlier step's result) or "$id.key", and layer references 108. Every step's map outputs are saved as styled layers 108.
Why it was run on this data. Health sub-districts holds population in 'population': Community health worker visits per 10,000 people in each feature compares features of different size; mapped as a choropleth (natural breaks, sequential colors) 109.
What it found. A pipeline of 2 steps (classify_field > dissolve) was executed, saving 1 layer 110.
| Result | Value |
|---|---|
| result, count | 5 |
| result, elapsed ms | 46 |
| billing, cost | 0.06905 |
| billing, list price | 0.06905 |
| billing, upstream cost | 0 |
| list price | 0.06905 |
What the map shows. Drawn with calculate density on the map Density: community health worker visits 67.
Findings
- Evidenced: Pipeline on Calculate density: Community health worker visits produced Dense areas of community health worker visits (5 features) 93110111.
- Evidenced: It reported result, count 5; result, elapsed ms 46; billing, cost 0.06905; billing, list price 0.06905; billing, upstream cost 0; list price 0.06905 110.
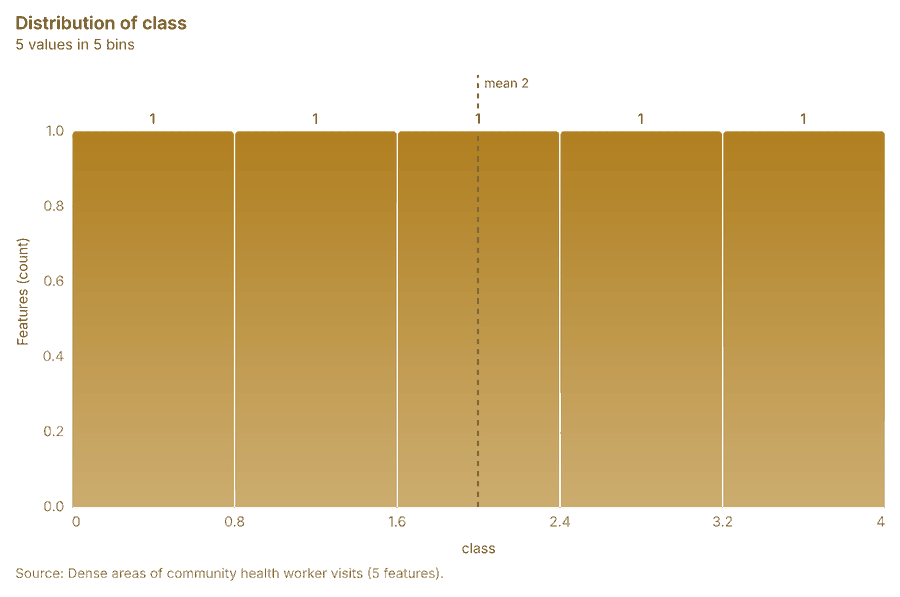
- Evidenced: The chart Dense areas of community health worker visits is drawn from 5 rows 112.
Tool gp_pipeline; parameters {"save": "final", "steps": [{"id": "classes", "params": {"field": "density_per_km2", "method": "quantile", "classes": 5, "features": {"layer": "Calculate density: Community health worker visits (3aeb4280)"}}, "operation": "classify_field"}, {"id": "areas", "params": {"by": ["class"], "features": "$classes"}, "operation": "dissolve"}], "project": "2612067c-badd-4310-9678-8f580d5e3d32", "output_name
Change of vaccination sessions per health sub-district
What this analysis is. Summarize within: Count and aggregate the features inside each polygon (or bin), proportionally for lines and polygons 42. In ArcGIS it is Summarize Within or Aggregate Points; in QGIS, native:countpointsinpolygon or native:sumlinelengths 42.
Why it was run on this data. Count Community health worker visits inside each feature of Health sub-districts by purpose; the counts map as a choropleth (natural breaks, sequential colors) 43.
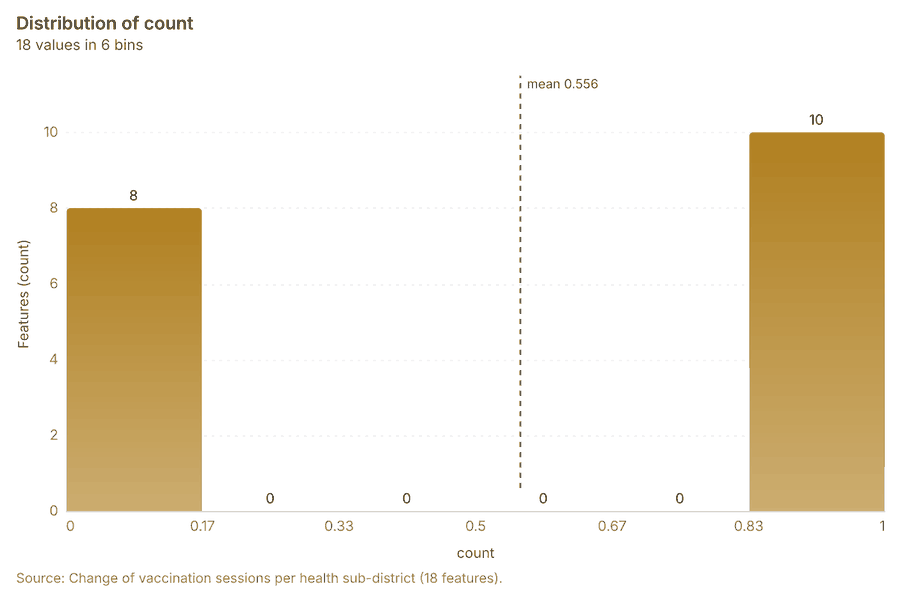
What it found. The analysis utilized the input of 'Health sub-districts' 16 and a 'Period change: Vaccination sessions (week of 2026-06-29 to week of 2026-07-06)' 12 to generate the 'Change of vaccination sessions per health sub-district' 114 using the gp_summarize_within tool 113. This resulted in a count of 18 features for the layer 113. Furthermore, the chart displaying the change in vaccination sessions is drawn from 6 rows 116.
| Result | Value |
|---|---|
| result, count | 18 |
| result, elapsed ms | 1 |
| billing, cost | 0.01058 |
| billing, list price | 0.01058 |
| billing, upstream cost | 0 |
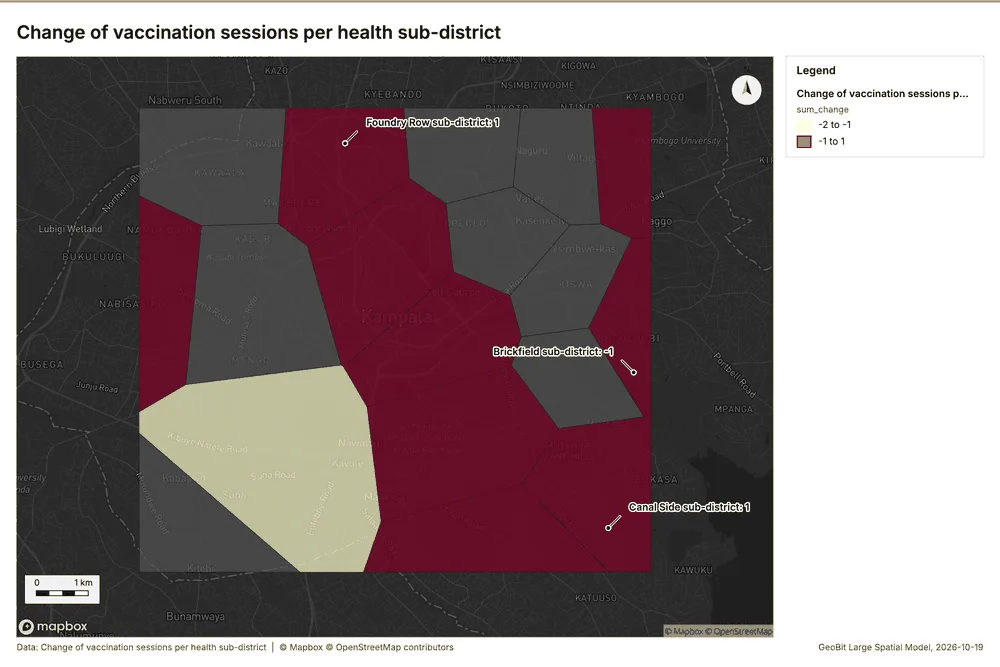
What the map shows. The map draws Change of vaccination sessions per health sub-district by sum_change in 2 classes: -2 to -1, -1 to 1 115. It draws 18 features 115. It covers longitude 32.515 to 32.648 and latitude 0.261 to 0.363, at about 1:61,580 115.
Findings
- Evidenced: Summarize within on Period change: Vaccination sessions (week of 2026-06-29 to week of 2026-07-06), Health sub-districts produced Change of vaccination sessions per health sub-district (18 features) 1216113114.
- Evidenced: It reported result, count 18; result, elapsed ms 1; billing, cost 0.01058; billing, list price 0.01058; billing, upstream cost 0 113.
- Evidenced: The chart Change of vaccination sessions per health sub-district is drawn from 6 rows 116.
Tool gp_summarize_within; parameters {"stats": [{"agg": "sum", "field": "change"}], "project": "2612067c-badd-4310-9678-8f580d5e3d32", "features": {"layer": "Period change: Vaccination sessions (week of 2026-06-29 to week of 2026-07-06) (3345972d)"}, "polygons": {"layer": "Health sub-districts (433b88cc)"}, "output_name": "Change of vaccination sessions per health sub-district"}
Outbreak response teams within 250 m of each cluster of cases
What this analysis is. Pipeline: Run up to 20 GIS operations in one engine call; a step's params may use "$id" (an earlier step's result) or "$id.key", and layer references 108. Every step's map outputs are saved as styled layers 108.
Why it was run on this data. Health sub-districts holds population in 'population': Outbreak response teams per 10,000 people in each feature compares features of different size; mapped as a choropleth (natural breaks, sequential colors) 117.
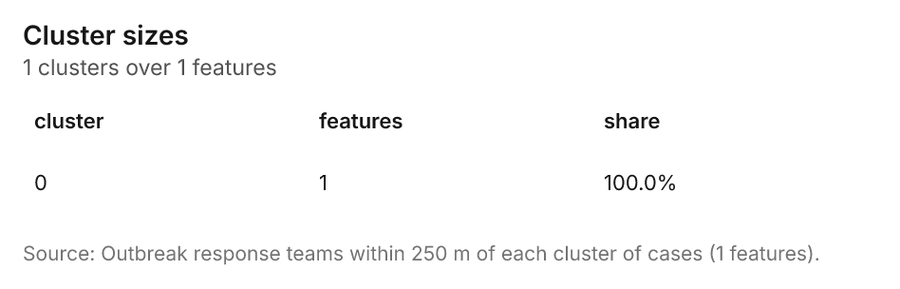
What it found. Pipeline on Find point clusters: cluster hulls, Outbreak response teams produced Outbreak response teams within 250 m of each cluster of cases (1 features) 21104118119. It reported result, count 1; result, elapsed ms 0; billing, cost 0.02015; billing, list price 0.02015; billing, upstream cost 0; list price 0.02015 118. The chart Outbreak response teams within 250 m of each cluster of cases is drawn from 1 rows 121.
| Result | Value |
|---|---|
| result, count | 1 |
| result, elapsed ms | 0 |
| billing, cost | 0.02015 |
| billing, list price | 0.02015 |
| billing, upstream cost | 0 |
| list price | 0.02015 |
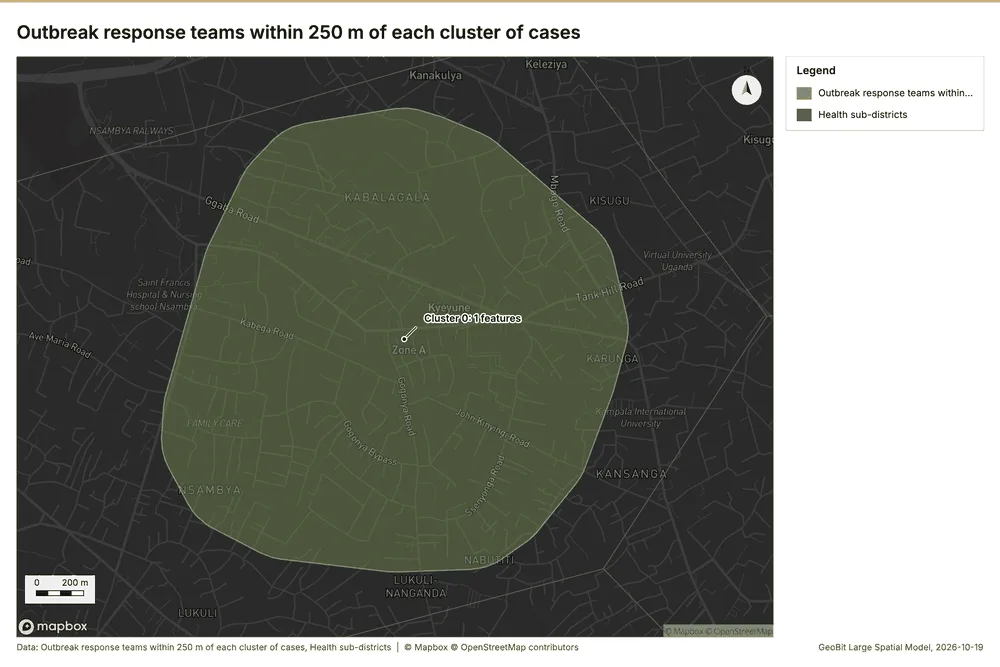
What the map shows. The map draws Outbreak response teams within 250 m of each cluster of cases with one symbol 120. The map draws Health sub-districts with one symbol 120. It draws 19 features 120. It covers longitude 32.581 to 32.61 and latitude 0.286 to 0.308, at about 1:13,495 120.
Findings
- Evidenced: Pipeline on Find point clusters: cluster hulls, Outbreak response teams produced Outbreak response teams within 250 m of each cluster of cases (1 features) 21104118119.
- Evidenced: It reported result, count 1; result, elapsed ms 0; billing, cost 0.02015; billing, list price 0.02015; billing, upstream cost 0; list price 0.02015 118.
- Evidenced: The chart Outbreak response teams within 250 m of each cluster of cases is drawn from 1 rows 121.
Tool gp_pipeline; parameters {"save": "final", "steps": [{"id": "buffer", "params": {"features": {"layer": "Find point clusters: cluster hulls (53d9a3e2)"}, "distance_m": 250}, "operation": "buffer"}, {"id": "count", "params": {"features": {"layer": "Outbreak response teams (1b8f0e74)"}, "polygons": "$buffer"}, "operation": "summarize_within"}], "project": "2612067c-badd-4310-9678-8f580d5e3d32", "output_name": "Outbreak respo
Density of community health worker visits and cases together
What this analysis is. Merge layers: Append several layers into one 122. In ArcGIS it is Merge Layers or Merge; in QGIS, native:mergevectorlayers 122.
Why it was run on this data. It was run toward the goal "Describe the project Sample: Public health, Kampala: run the analyses that tell the most about its data, draw every result, and write a cited report" 86.
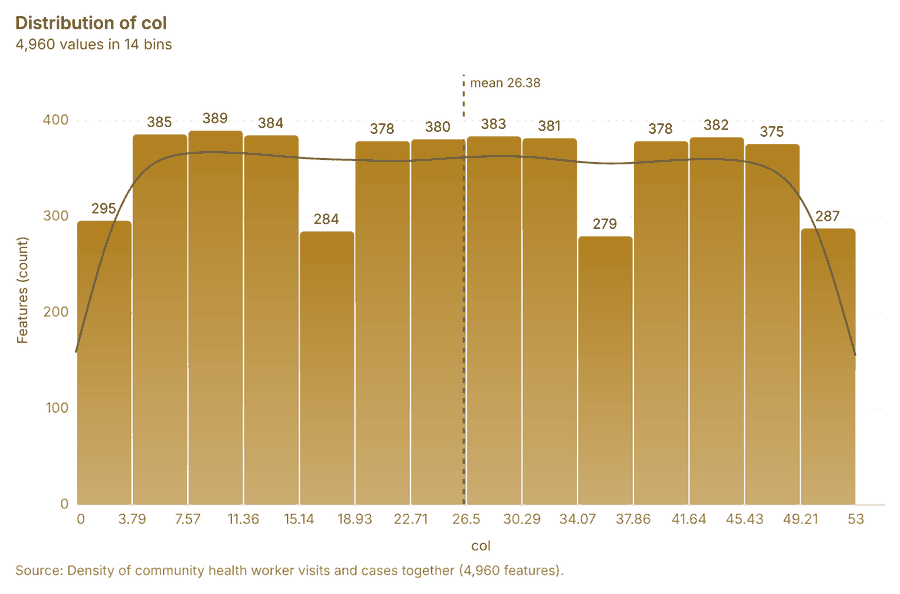
What it found. The gp_merge_layers tool combined inputs for Community health worker visits 93 and Cases 124 to create the merged layer 123.
| Result | Value |
|---|---|
| result, count | 4,960 |
| result, elapsed ms | 109 |
| billing, cost | 0.01 |
| billing, list price | 0.01 |
| billing, upstream cost | 0 |
Findings
- Evidenced: Merge layers on Calculate density: Community health worker visits, Calculate density: Cases produced Density of community health worker visits and cases together (4,960 features) 93123124125.
- Evidenced: It reported result, count 4,960; result, elapsed ms 109; billing, cost 0.01; billing, list price 0.01; billing, upstream cost 0 123.
- Evidenced: The chart Density of community health worker visits and cases together is drawn from 14 rows 126.
Tool gp_merge_layers; parameters {"layers": [{"layer": "Calculate density: Community health worker visits (3aeb4280)"}, {"layer": "Calculate density: Cases (b48a2b54)"}], "project": "2612067c-badd-4310-9678-8f580d5e3d32", "output_name": "Density of community health worker visits and cases together", "source_field": "source"}
Maps and charts
The run also made 1 map image(s) 127 and 19 chart(s) 128129130131132133134135136137138139140141142143144145146.
More maps
1 more map(s), beyond the 24 the report body holds, in the composer's order: Density of community health worker visits and cases together 147.
Documents
What the documents name. Epidemiological situation report (1 page, 1 page(s) from the text layer) names 1 organization, 4 event terms, 6 places and 1 quantity 148. Organizations named in Epidemiological situation report: Malaria (page 1, line 5) 149. Event terms in Epidemiological situation report: cholera (page 1, line 3, 2 mentions), outbreak (page 1, line 3, 2 mentions) 149. Places named in Epidemiological situation report: Parkside sub-district (page 1, line 3, 2 mentions), 029731, 3259548 (page 1, line 3), Rapid response team 1 (page 1, line 11), Eastfield sub-district (page 1, line 12) 149.
| Result | Value |
|---|---|
| Documents | 1 |
| Entities | 12 |
| Organizations | 1 |
| Event terms | 4 |
| Places | 6 |
| Quantities | 1 |
Findings
- Evidenced: Epidemiological situation report (1 page, 1 page(s) from the text layer) names 1 organization, 4 event terms, 6 places and 1 quantity.
- Evidenced: Organizations named in Epidemiological situation report: Malaria (page 1, line 5).
- Evidenced: Event terms in Epidemiological situation report: cholera (page 1, line 3, 2 mentions), outbreak (page 1, line 3, 2 mentions).
- Evidenced: Places named in Epidemiological situation report: Parkside sub-district (page 1, line 3, 2 mentions), 029731, 3259548 (page 1, line 3), Rapid response team 1 (page 1, line 11), Eastfield sub-district (page 1, line 12).
Changes since the last run
89 number(s) changed since the report of 2026-10-19T04:03:52Z.
| Analysis | Measure | Before | After | Change |
|---|---|---|---|---|
| Space time hot spots | result, count | 24 | 124 | 100 |
| Space time hot spots | result, elapsed ms | 4 | 17 | 13 |
| Space time hot spots | result, resolution | 7 | 8 | 1 |
| Space time hot spots | result, features used | 200 | 1,000 | 800 |
| Space time hot spots | billing, cost | 0.11 | 0.15 | 0.04 |
| Space time hot spots | billing, list price | 0.11 | 0.15 | 0.04 |
| Space time hot spots | result, elapsed ms | 4 | 5 | 1 |
| Space time hot spots | result, count | 24 | 125 | 101 |
| Space time hot spots | result, elapsed ms | 4 | 26 | 22 |
| Space time hot spots | result, resolution | 7 | 8 | 1 |
| Space time hot spots | result, features used | 200 | 2,290 | 2,090 |
| Space time hot spots | billing, cost | 0.11 | 0.2145 | 0.1045 |
| Space time hot spots | billing, list price | 0.11 | 0.2145 | 0.1045 |
| Hot spots | result, bins | 93 | 390 | 297 |
| Hot spots | result, count | 93 | 390 | 297 |
| Hot spots | result, elapsed ms | 4 | 17 | 13 |
| Hot spots | result, cell size m | 1,000 | 500 | -500 |
| Hot spots | result, incidents used | 150 | 1,000 | 850 |
| Hot spots | result, distance band m | 2,000 | 1,000 | -1,000 |
| Hot spots | billing, cost | 0.053 | 0.07 | 0.017 |
| Hot spots | billing, list price | 0.053 | 0.07 | 0.017 |
| Hot spots | result, bins | 93 | 2,259 | 2,166 |
| Hot spots | result, count | 93 | 2,259 | 2,166 |
| Hot spots | result, elapsed ms | 4 | 75 | 71 |
| Hot spots | result, cell size m | 1,000 | 200 | -800 |
| Hot spots | result, incidents used | 150 | 2,290 | 2,140 |
| Hot spots | result, distance band m | 2,000 | 500 | -1,500 |
| Hot spots | billing, cost | 0.053 | 0.0958 | 0.0428 |
| Hot spots | billing, list price | 0.053 | 0.0958 | 0.0428 |
| Hot spots | result, bins | 93 | 99 | 6 |
| Hot spots | result, count | 93 | 99 | 6 |
| Hot spots | result, elapsed ms | 4 | 5 | 1 |
| Hot spots | result, incidents used | 150 | 200 | 50 |
| Hot spots | billing, cost | 0.053 | 0.054 | 0.001 |
| Hot spots | billing, list price | 0.053 | 0.054 | 0.001 |
| Summarize within | result, elapsed ms | 1 | 2 | 1 |
| Summarize within | billing, cost | 0.01058 | 0.03036 | 0.01978 |
| Summarize within | billing, list price | 0.01058 | 0.03036 | 0.01978 |
| Summarize within | result, elapsed ms | 1 | 0 | -1 |
| Summarize within | billing, cost | 0.01058 | 0.01438 | 0.0038 |
| Summarize within | billing, list price | 0.01058 | 0.01438 | 0.0038 |
| Summarize within | result, elapsed ms | 1 | 3 | 2 |
| Summarize within | billing, cost | 0.01058 | 0.05616 | 0.04558 |
| Summarize within | billing, list price | 0.01058 | 0.05616 | 0.04558 |
| Calculate density | result, count | 558 | 2,452 | 1,894 |
| Calculate density | result, elapsed ms | 11 | 43 | 32 |
| Calculate density | result, bandwidth m | 2,000 | 500 | -1,500 |
| Calculate density | result, cell size m | 500 | 200 | -300 |
| Calculate density | result, max density per km2 | 6.956 | 34.43 | 27.47 |
| Calculate density | billing, cost | 0.053 | 0.07 | 0.017 |
| Calculate density | billing, list price | 0.053 | 0.07 | 0.017 |
| Calculate density | result, count | 558 | 2,508 | 1,950 |
| Calculate density | result, elapsed ms | 11 | 49 | 38 |
| Calculate density | result, bandwidth m | 2,000 | 500 | -1,500 |
| Calculate density | result, cell size m | 500 | 200 | -300 |
| Calculate density | result, max density per km2 | 6.956 | 282 | 275.1 |
| Calculate density | billing, cost | 0.053 | 0.0958 | 0.0428 |
| Calculate density | billing, list price | 0.053 | 0.0958 | 0.0428 |
| Calculate density | result, count | 558 | 616 | 58 |
| Calculate density | result, elapsed ms | 11 | 105 | 94 |
| Calculate density | result, max density per km2 | 6.956 | 5.525 | -1.431 |
| Calculate density | billing, cost | 0.053 | 0.054 | 0.001 |
| Calculate density | billing, list price | 0.053 | 0.054 | 0.001 |
| Find point clusters | result, count | 2,290 | 1,000 | -1,290 |
| Find point clusters | result, noise | 1,961 | 1,000 | -961 |
| Find point clusters | result, elapsed ms | 23 | 576 | 553 |
| Find point clusters | billing, cost | 0.0958 | 0.07 | -0.0258 |
| Find point clusters | billing, list price | 0.0958 | 0.07 | -0.0258 |
| Find point clusters | result, elapsed ms | 23 | 24 | 1 |
| Change beside the counts per health sub-district | result, count | 10 | 18 | 8 |
| Change beside the counts per health sub-district | result, elapsed ms | 2 | 1 | -1 |
| Change beside the counts per health sub-district | billing, cost | 0.06038 | 0.01074 | -0.04964 |
| Change beside the counts per health sub-district | billing, list price | 0.06038 | 0.01074 | -0.04964 |
| Change of vaccination sessions where density is high | result, elapsed ms | 2 | 3 | 1 |
| Change of vaccination sessions where density is high | billing, cost | 0.06038 | 0.05926 | -0.00112 |
| Change of vaccination sessions where density is high | billing, list price | 0.06038 | 0.05926 | -0.00112 |
| Hot cells of cases per health sub-district | result, elapsed ms | 1 | 38 | 37 |
| Hot cells of cases per health sub-district | billing, cost | 0.01058 | 0.05554 | 0.04496 |
| Hot cells of cases per health sub-district | billing, list price | 0.01058 | 0.05554 | 0.04496 |
| Dense areas of community health worker visits | result, count | 1 | 5 | 4 |
| Dense areas of community health worker visits | result, elapsed ms | 0 | 46 | 46 |
| Dense areas of community health worker visits | billing, cost | 0.02015 | 0.06905 | 0.0489 |
| Dense areas of community health worker visits | billing, list price | 0.02015 | 0.06905 | 0.0489 |
| Dense areas of community health worker visits | list price | 0.02015 | 0.06905 | 0.0489 |
| Density of community health worker visits and cases together | result, count | 2,352 | 4,960 | 2,608 |
| Density of community health worker visits and cases together | result, elapsed ms | 58 | 109 | 51 |
| Documents | Entities | 1 | 12 | 11 |
| Documents | Event terms | 1 | 4 | 3 |
| Documents | Places | 1 | 6 | 5 |
New findings:
- Calculate density on Vaccination sessions: Calculate density: 1 layer saved: Calculate density: Vaccination sessions (616 features).
- Change beside the counts per health sub-district, from Period change: Cases (week of 2026-05-18 to week of 2026-05-25) and Summarize within: Health sub-districts: the busiest area, Parkside sub-district (32 in all), changed by -38 871346.
- Change of vaccination sessions per health sub-district, from Period change: Vaccination sessions (week of 2026-06-29 to week of 2026-07-06): Canal Side sub-district rose the most (+1) and Fernhill sub-district fell the most (-2) 11311.
- Change of vaccination sessions where density is high, from Period change: Vaccination sessions (week of 2026-06-29 to week of 2026-07-06) and Calculate density: Community health worker visits: the largest rise (+1, Canal Side sub-district) is where density averages 10.88 per square kilometer 921166.
- Dense areas of community health worker visits, from Calculate density: Community health worker visits: the densest of five classes joins 491 cells into one area 11066.
- Density of community health worker visits and cases together, from Calculate density: Community health worker visits and Calculate density: Cases: 4960 features from 2 sources 1236669.
- Hot spots on Vaccination sessions: Hot spot analysis: 1 layer saved: Hot spot analysis: Vaccination sessions (99 features).
- It reported result, bins 2,259; result, count 2,259; result, elapsed ms 75; result, cell size m 200; result, incidents used 2,290; result, distance band m 500.
- It reported result, bins 99; result, count 99; result, elapsed ms 5; result, cell size m 1,000; result, incidents used 200; result, distance band m 2,000.
- It reported result, count 1,000; result, noise 1,000; result, distance m 200; result, elapsed ms 576; result, min points 20; billing, cost 0.07.
- It reported result, count 10; result, elapsed ms 3; billing, cost 0.05926; billing, list price 0.05926; billing, upstream cost 0.
- It reported result, count 125; result, elapsed ms 26; result, resolution 8; result, features used 2,290; result, time neighbors 0; billing, cost 0.2145.
- It reported result, count 18; result, elapsed ms 0; billing, cost 0.01438; billing, list price 0.01438; billing, upstream cost 0.
- It reported result, count 18; result, elapsed ms 38; billing, cost 0.05554; billing, list price 0.05554; billing, upstream cost 0.
- It reported result, count 2,290; result, noise 1,961; result, distance m 200; result, elapsed ms 24; result, min points 20; billing, cost 0.0958.
- It reported result, count 2,452; result, elapsed ms 43; result, bandwidth m 500; result, cell size m 200; result, excluded null 0; result, max density per km2 34.43.
- It reported result, count 2,508; result, elapsed ms 49; result, bandwidth m 500; result, cell size m 200; result, excluded null 0; result, max density per km2 282.
- It reported result, count 24; result, elapsed ms 5; result, resolution 7; result, features used 200; result, time neighbors 0; billing, cost 0.11.
- It reported result, count 4,960; result, elapsed ms 109; billing, cost 0.01; billing, list price 0.01; billing, upstream cost 0.
- It reported result, count 5; result, elapsed ms 46; billing, cost 0.06905; billing, list price 0.06905; billing, upstream cost 0; list price 0.06905.
- It reported result, count 616; result, elapsed ms 105; result, bandwidth m 2,000; result, cell size m 500; result, excluded null 0; result, max density per km2 5.525.
- Merge layers on Calculate density: Community health worker visits, Calculate density: Cases produced Density of community health worker visits and cases together (4,960 features).
- Outbreak response teams within 250 m of each cluster of cases, from Find point clusters: cluster hulls: 1 of 1 clusters have one within 250 m 11879.
- Pipeline on Calculate density: Community health worker visits produced Dense areas of community health worker visits (5 features).
- Spatial join on Calculate density: Community health worker visits, Period change: Vaccination sessions (week of 2026-06-29 to week of 2026-07-06) produced Change of vaccination sessions where density is high (10 features).
- Summarize within on Vaccination sessions, Health sub-districts: Summarize within: 1 layer saved: Summarize within: Health sub-districts (18 features).
- The chart Dense areas of community health worker visits is drawn from 5 rows.
- The chart Density of community health worker visits and cases together is drawn from 14 rows.
Sources
- 1Rendering: Chart: Timeline: events per week by dataset. 265 rows id 9ed316de-c13f-4c96-9941-d0ab254813c6
- 2Dataset: Cases. vector, 2290 rows id 59cb2ed5-709d-4ca6-94aa-fd8eb621eb37
- 3Dataset: Community health worker visits. vector, 1000 rows id 44c21bd2-0729-457b-ba05-d7a36b9885ed
- 4Dataset: Vaccination sessions. vector, 200 rows id 46c023c6-ea3b-4a1d-9a6c-130a334b6790
- 5Dataset: Weekly cases by sub-district. table, 936 rows id 1ce22bbc-4659-446b-a2ab-9d6f1bfe6418
- 6Dataset: Clinic stock by month. table, 315 rows id 930b3eee-3ebe-4aff-8fa0-a2c38a029a36
- 7Rendering: Chart: Timeline lanes: events per week by dataset. 265 rows id dc67edf4-bf01-4d54-a054-9cccf4719256
- 8Rendering: Chart: Timeline: change from one week to the next. 52 rows id b08e07a6-2857-423d-9faf-2edf4b6db093
- 9Tool result: gp_period_change, step 0. The count fell from 36 in week of 2026-09-21 to 18 in week of 2026-09-28 (-50.0%); a change this large is unlikely to be chance (p = 0.0198). id da0d02de-5858-490e-a2a5-d4daf11b4a77:0
- 10Layer: Period change: Community health worker visits (week of 2026-09-21 to week of 2026-09-28) id 3bec1b01-80c0-4802-8f6f-e05ccd607485
- 11Tool result: gp_period_change, step 1. The count fell from 9 in week of 2026-06-29 to 2 in week of 2026-07-06 (-77.8%); a change this small is within what chance would give (p = 0.0654). id da0d02de-5858-490e-a2a5-d4daf11b4a77:1
- 12Layer: Period change: Vaccination sessions (week of 2026-06-29 to week of 2026-07-06) id 3345972d-58bd-4b02-b103-633f6c7a1c21
- 13Tool result: gp_period_change, step 2. The count fell from 136 in week of 2026-05-18 to 86 in week of 2026-05-25 (-36.8%); a change this large is unlikely to be chance (p = 0.000963). id da0d02de-5858-490e-a2a5-d4daf11b4a77:2
- 14Layer: Period change: Cases (week of 2026-05-18 to week of 2026-05-25) id 66f934f7-4d7f-4b71-bfe5-db9cf372b64d
- 15Rendering: Map: Overview: the top 3 results. view longitude 32.48887 to 32.67295, latitude 0.23939 to 0.37643 id 56c16576-ebcf-441b-9376-fc19268f64e4
- 16Layer: Health sub-districts. spatial profile id 433b88cc-cf57-4d48-b158-220cc8b77697
- 17Layer: Cases. spatial profile id 03c8f72b-99c1-4176-8f56-aabff1d062b7
- 18Layer: Clinics. spatial profile id ac5b28b9-59c1-40e0-b7bd-1b0014ea13e0
- 19Layer: Water points. spatial profile id c63bde31-7c18-420e-894d-3e824a409c2d
- 20Layer: Community health worker visits. spatial profile id 4d70d1ce-8162-42eb-b3d7-d864edf2721e
- 21Layer: Outbreak response teams. spatial profile id 1b8f0e74-8ce3-4ca6-bbf8-e76348e17d6e
- 22Layer: Vaccination sessions. spatial profile id 6798c97c-ff1d-462f-b9b0-5baab95708a5
- 23Catalog: Emerging hot spots (operation catalog, gp_space_time_hot_spots). Where hot spots are new, consecutive, intensifying, persistent, diminishing, sporadic, oscillating or historical over time. ArcGIS: Emerging Hot Spot Analysis, Create Space Time Cube. id gp_space_time_hot_spots
- 24Plan: Space time hot spots of Community health worker visits (the Start plan's candidate c_70590e6d2eeb). Community health worker visits carry dates in 'visited_at': emerging hot spot analysis finds new, intensifying and fading hot spots per week. id 502cfe77-e27d-4781-888d-59ecc8241e24:c_70590e6d2eeb
- 25Tool result: gp_space_time_hot_spots, step 0. Emerging hot spots: 1 layer saved: Emerging hot spots: Community health worker visits (124 features). id ca57d695-3247-4efe-bf1e-0e4a458c66f4:0
- 26Rendering: Map: Emerging hot spots: community health worker visits and cases. view longitude 32.49952 to 32.66088, latitude 0.25211 to 0.37225 id 7e95523d-3393-400e-8c04-5e9bb1751ad0
- 27Plan: Space time hot spots of Vaccination sessions (the Start plan's candidate c_136a5b017678). Vaccination sessions carry dates in 'held_on': emerging hot spot analysis finds new, intensifying and fading hot spots per week. Measured: the pattern of Vaccination sessions changes over time (earlier half random, later half dispersed; the center moved 259 m). id 502cfe77-e27d-4781-888d-59ecc8241e24:c_136a5b017678
- 28Tool result: gp_space_time_hot_spots, step 1. Emerging hot spots: 1 layer saved: Emerging hot spots: Vaccination sessions (24 features). id ca57d695-3247-4efe-bf1e-0e4a458c66f4:1
- 29Rendering: Map: Emerging hot spots: vaccination sessions. view longitude 32.48887 to 32.67295, latitude 0.23939 to 0.37643 id 56aebece-6125-4fb6-b449-86d97ba94702
- 30Plan: Space time hot spots of Cases (the Start plan's candidate c_24319662e98f). Cases carry dates in 'onset_date': emerging hot spot analysis finds new, intensifying and fading hot spots per week. Measured: the pattern of Cases changes over time (earlier half random, later half clustered; the center moved 783 m). id 502cfe77-e27d-4781-888d-59ecc8241e24:c_24319662e98f
- 31Tool result: gp_space_time_hot_spots, step 2. Emerging hot spots: 1 layer saved: Emerging hot spots: Cases (125 features). id ca57d695-3247-4efe-bf1e-0e4a458c66f4:2
- 32Catalog: Hot spot analysis (operation catalog, gp_hot_spots). Getis-Ord Gi* hot and cold spots with z-scores, p-values and confidence bins. ArcGIS: Find Hot Spots, Hot Spot Analysis (Getis-Ord Gi*). QGIS: qgis:hotspot (plugin). id gp_hot_spots
- 33Plan: Hot spots of Community health worker visits (the Start plan's candidate c_6211f60c8ad6). 1000 points: Getis-Ord Gi* tests whether the concentrations in Community health worker visits are statistically significant. Measured: Community health worker visits are clustered (nearest-neighbor ratio 0.95, z = -3.3), median spacing 124 m. Cells of 500 m and a band of 1000 m from the measured spacing. id 502cfe77-e27d-4781-888d-59ecc8241e24:c_6211f60c8ad6
- 34Tool result: gp_hot_spots, step 0. Hot spot analysis: 1 layer saved: Hot spot analysis: Community health worker visits (390 features). id c2d5c745-9aa1-4cd9-a0a8-2ff3ab77a62a:0
- 35Rendering: Map: Hot spots: community health worker visits. view longitude 32.50994 to 32.65238, latitude 0.25713 to 0.36631 id 98052aef-9d4d-4f54-ba5f-c8b6a1168787
- 36Plan: Hot spots of Cases (the Start plan's candidate c_9fb20ef66d1e). 2290 points: Getis-Ord Gi* tests whether the concentrations in Cases are statistically significant. Measured: Cases are clustered (nearest-neighbor ratio 0.90, z = -9.4), median spacing 75.6 m. Cells of 200 m and a band of 500 m from the measured spacing. id 502cfe77-e27d-4781-888d-59ecc8241e24:c_9fb20ef66d1e
- 37Tool result: gp_hot_spots, step 1. Hot spot analysis: 1 layer saved: Hot spot analysis: Cases (2259 features). id c2d5c745-9aa1-4cd9-a0a8-2ff3ab77a62a:1
- 38Rendering: Map: Hot spots: cases. view longitude 32.5125 to 32.64913, latitude 0.25979 to 0.36453 id a56eeb41-2edc-432a-88c7-a24c0f5a72b3
- 39Plan: Hot spots of Vaccination sessions (the Start plan's candidate c_e1e27b62d2c9). 200 points: Getis-Ord Gi* tests whether the concentrations in Vaccination sessions are statistically significant. id 502cfe77-e27d-4781-888d-59ecc8241e24:c_e1e27b62d2c9
- 40Tool result: gp_hot_spots, step 2. Hot spot analysis: 1 layer saved: Hot spot analysis: Vaccination sessions (99 features). id c2d5c745-9aa1-4cd9-a0a8-2ff3ab77a62a:2
- 41Rendering: Map: Hot spots: vaccination sessions. view longitude 32.49938 to 32.65852, latitude 0.25127 to 0.37325 id 68ed8d3d-fda0-438d-87ed-17c5d6d517d1
- 42Catalog: Summarize within (operation catalog, gp_summarize_within). Count and aggregate the features inside each polygon (or bin), proportionally for lines and polygons. ArcGIS: Summarize Within, Aggregate Points. QGIS: native:countpointsinpolygon, native:sumlinelengths. id gp_summarize_within
- 43Plan: Community health worker visits per feature of Health sub-districts (the Start plan's candidate c_f0b17dbbc715). Count Community health worker visits inside each feature of Health sub-districts by purpose; the counts map as a choropleth (natural breaks, sequential colors). id 502cfe77-e27d-4781-888d-59ecc8241e24:c_f0b17dbbc715
- 44Tool result: gp_summarize_within, step 0. Summarize within: 1 layer saved: Summarize within: Health sub-districts (18 features). id a98160db-9f77-4a98-acfd-a879b8f97de9:0
- 45Rendering: Map: Counts: community health worker visits, by health sub-district. view longitude 32.51464 to 32.64754, latitude 0.26149 to 0.36336 id 3b9b93aa-6cb9-420c-beb3-f36bcbea491e
- 46Tool result: gp_summarize_within, step 1. Summarize within: 1 layer saved: Summarize within: Health sub-districts (18 features). id a98160db-9f77-4a98-acfd-a879b8f97de9:1
- 47Rendering: Map: Counts: vaccination sessions, by health sub-district. view longitude 32.51464 to 32.64754, latitude 0.26149 to 0.36336 id 72daafcb-45d3-43a7-bc54-d22b2cc6e843
- 48Tool result: gp_summarize_within, step 2. Summarize within: 1 layer saved: Summarize within: Health sub-districts (18 features). id a98160db-9f77-4a98-acfd-a879b8f97de9:2
- 49Rendering: Map: Counts: cases, by health sub-district. view longitude 32.51464 to 32.64754, latitude 0.26149 to 0.36336 id 2135f78f-d2ac-433f-9d8a-6e3d45ba6e33
- 50Catalog: Period change (analysis catalog, gp_period_change). Counts or sums per period (week over week, month over month, any two periods, or before and after a date), per area, per H3 cell or in total, with the places of largest rise and fall and a significance note. ArcGIS: Summarize Percent Change (Crime Analysis), Change Point Detection. id gp_period_change
- 51Plan: Community health worker visits: change per week per feature of Health sub-districts (the Start plan's candidate c_a2fcbe1fcdab). Community health worker visits carry dates in 'visited_at' over 26 weeks: the count per week, week over week, with the places of largest rise and fall per feature of Health sub-districts and whether the change is beyond chance. id 502cfe77-e27d-4781-888d-59ecc8241e24:c_a2fcbe1fcdab
- 52Rendering: Map: Period change: community health worker visits, by health sub-district. view longitude 32.51235 to 32.64994, latitude 0.26121 to 0.36364 id 1ba857b6-25f9-4a1e-9809-7dabd1dba73f
- 53Rendering: Chart: Community health worker visits: count per week. 27 rows id 38a7f1b5-f586-4a93-acb8-4706829d7084
- 54Rendering: Chart: Community health worker visits: week of 2026-09-21 to week of 2026-09-28 by place. 28 rows id cc02c36d-d7ba-4b30-b17f-b4d59c59a182
- 55Rendering: Chart: Period change: Community health worker visits (week of 2026-09-21 to week of 2026-09-28). 5 rows id 5a1e5aac-b54b-49dd-82a1-6de54c6f280a
- 56Rendering: Map: Period change: vaccination sessions, by health sub-district. view longitude 32.51235 to 32.64994, latitude 0.26121 to 0.36364 id 4021c7ee-ffb3-49da-9404-41221d96a7a2
- 57Rendering: Chart: Vaccination sessions: count per week. 39 rows id f56fc17e-709a-4ed7-a297-d2fd6e33d067
- 58Rendering: Chart: Vaccination sessions: week of 2026-06-29 to week of 2026-07-06 by place. 20 rows id 293fe134-01c3-4c24-b991-e34d182657c7
- 59Rendering: Chart: Period change: Vaccination sessions (week of 2026-06-29 to week of 2026-07-06). 5 rows id a076831a-6ae4-47aa-8be1-9a5d36f509fa
- 60Rendering: Map: Period change: cases, by health sub-district. view longitude 32.51235 to 32.64994, latitude 0.26121 to 0.36364 id c02c2da5-7128-4cbe-bc4c-1af8118de764
- 61Rendering: Chart: Cases: count per week. 53 rows id a232e499-3702-4315-b7d3-da9d00e71897
- 62Rendering: Chart: Cases: week of 2026-05-18 to week of 2026-05-25 by place. 30 rows id c86a0c4a-b1af-4354-b292-8496363ee353
- 63Rendering: Chart: Period change: Cases (week of 2026-05-18 to week of 2026-05-25). 6 rows id 916d1401-e116-42e0-b939-a730c5fff396
- 64Catalog: Calculate density (operation catalog, gp_calculate_density). Kernel density per square kilometer on a grid. ArcGIS: Calculate Density, Kernel Density. QGIS: native:heatmapkerneldensityestimation. id gp_calculate_density
- 65Plan: Kernel density of Community health worker visits (the Start plan's candidate c_224143430356). 1000 points in Community health worker visits: a density surface shows where they concentrate. Measured: Community health worker visits are clustered (nearest-neighbor ratio 0.95, z = -3.3), median spacing 124 m. id 502cfe77-e27d-4781-888d-59ecc8241e24:c_224143430356
- 66Tool result: gp_calculate_density, step 0. Calculate density: 1 layer saved: Calculate density: Community health worker visits (2452 features). id 12155ea1-761a-4dfb-bea9-c367f910d998:0
- 67Rendering: Map: Density: community health worker visits. view longitude 32.50938 to 32.65381, latitude 0.25717 to 0.36787 id c4802079-26fd-4077-ab26-93b7925b6482
- 68Plan: Kernel density of Cases (the Start plan's candidate c_070749f5aead). 2290 points in Cases: a density surface shows where they concentrate. Measured: Cases are clustered (nearest-neighbor ratio 0.90, z = -9.4), median spacing 75.6 m. id 502cfe77-e27d-4781-888d-59ecc8241e24:c_070749f5aead
- 69Tool result: gp_calculate_density, step 1. Calculate density: 1 layer saved: Calculate density: Cases (2508 features). id 12155ea1-761a-4dfb-bea9-c367f910d998:1
- 70Rendering: Map: Density: cases. view longitude 32.50843 to 32.65285, latitude 0.25669 to 0.3674 id 06af517c-f53b-4797-a57c-3a39a0f27a0d
- 71Plan: Kernel density of Vaccination sessions (the Start plan's candidate c_e0476445813b). 200 points in Vaccination sessions: a density surface shows where they concentrate. id 502cfe77-e27d-4781-888d-59ecc8241e24:c_e0476445813b
- 72Tool result: gp_calculate_density, step 2. Calculate density: 1 layer saved: Calculate density: Vaccination sessions (616 features). id 12155ea1-761a-4dfb-bea9-c367f910d998:2
- 73Rendering: Map: Density: vaccination sessions. view longitude 32.49029 to 32.67437, latitude 0.24081 to 0.3819 id 8e8a277d-768e-4e3d-b59e-c64d53beeb67
- 74Catalog: Find point clusters (operation catalog, gp_find_point_clusters). Density-based clusters (DBSCAN, HDBSCAN or OPTICS, optionally space-time) with hulls and noise. ArcGIS: Find Point Clusters, Density-based Clustering. QGIS: native:dbscanclustering, native:stdbscanclustering. id gp_find_point_clusters
- 75Plan: Cluster points of Community health worker visits (the Start plan's candidate c_b85a20a2f1a4). DBSCAN finds dense groups of Community health worker visits and separates noise. Measured: Community health worker visits are clustered (nearest-neighbor ratio 0.95, z = -3.3), median spacing 124 m. DBSCAN at 200 m (twice the measured spacing). id 502cfe77-e27d-4781-888d-59ecc8241e24:c_b85a20a2f1a4
- 76Tool result: gp_find_point_clusters, step 0. Find point clusters: 1 layer saved: Find point clusters: Community health worker visits (1000 features). id 77bbbd8a-81ae-4bc9-b0c3-23aaf5f1fa0f:0
- 77Rendering: Map: Clusters: community health worker visits. view longitude 32.51641 to 32.64657, latitude 0.26283 to 0.3626 id 8bb4310d-659d-4524-a471-aaae6fdb36c0
- 78Plan: Cluster points of Cases (the Start plan's candidate c_c6803ff2f7da). DBSCAN finds dense groups of Cases and separates noise. Measured: Cases are clustered (nearest-neighbor ratio 0.90, z = -9.4), median spacing 75.6 m. DBSCAN at 200 m (twice the measured spacing). id 502cfe77-e27d-4781-888d-59ecc8241e24:c_c6803ff2f7da
- 79Tool result: gp_find_point_clusters, step 1. Find point clusters: 2 layers saved: Find point clusters: Cases (2290 features); Find point clusters: cluster hulls (1 feature). id 77bbbd8a-81ae-4bc9-b0c3-23aaf5f1fa0f:1
- 80Rendering: Map: Clusters: cases. view longitude 32.51557 to 32.64664, latitude 0.26229 to 0.36275 id 48c33ecb-0323-4a65-a670-4a31e60946af
- 81Catalog: Find outliers (operation catalog, gp_outliers). Anselin local Moran’s I: HH, LL clusters and HL, LH outliers. ArcGIS: Find Outliers, Cluster and Outlier Analysis (Anselin Local Moran’s I). id gp_outliers
- 82Plan: Local morans i of Health sub-districts (the Start plan's candidate c_39aa394b7122). Local Moran's I maps clusters and outliers of 'population'. Measured: Health sub-districts have 39 neighboring pairs (4.33 neighbors per area, 0 isolated), so neighbors can be compared. id 502cfe77-e27d-4781-888d-59ecc8241e24:c_39aa394b7122
- 83Tool result: gp_outliers, step 0. Find outliers: 1 layer saved: Find outliers: Health sub-districts (18 features). id 97423338-c177-4702-bebb-f1beb57bfaff:0
- 84Rendering: Map: Outliers: health sub-districts. view longitude 32.51464 to 32.64754, latitude 0.26149 to 0.36336 id b07c4b22-dbfb-4024-b401-a4a40ee5d0c0
- 85Catalog: Spatial join (operation catalog, gp_spatial_join). Attach attributes (or aggregates) of matching features from another layer, by location, distance, time and attributes. ArcGIS: Join Features, Spatial Join. QGIS: native:joinattributesbylocation, native:joinbylocationsummary, native:joinbynearest. id gp_spatial_join
- 86Plan: The run's goal. Describe the project Sample: Public health, Kampala: run the analyses that tell the most about its data, draw every result, and write a cited report. id 12778c77-4c3f-4379-9aca-c9e85676282e:goal
- 87Tool result: gp_spatial_join, step 0. Spatial join: 1 layer saved: Change beside the counts per health sub-district (18 features). id a1498fe0-e6b0-47ea-b178-eea9d9489b4e:0
- 88Layer: Summarize within: Health sub-districts. 18 features id 9220b574-337c-44ac-8245-9bddea6ca9e7
- 89Layer: Change beside the counts per health sub-district. 18 features id 329bcab2-5a7e-47ff-9e3a-70ab2bfb87e9
- 90Rendering: Map: Change beside the counts per health sub-district. view longitude 32.51464 to 32.64754, latitude 0.26149 to 0.36336 id 1a975715-964d-4cea-a9d4-e1f36f7402f9
- 91Rendering: Chart: Change beside the counts per health sub-district. 6 rows id d8232fd5-0620-44d0-a014-35f7ff7c1ccb
- 92Tool result: gp_spatial_join, step 0. Spatial join: 1 layer saved: Change of vaccination sessions where density is high (10 features). id dcf7086a-4b87-4442-bf12-c3721d1867e7:0
- 93Layer: Calculate density: Community health worker visits. 2,452 features id 3aeb4280-7dc5-445b-bbe5-0f612cf31e62
- 94Layer: Change of vaccination sessions where density is high. 10 features id 9cf2f4e1-0c98-47a0-8eda-017184bee6f6
- 95Rendering: Map: Change of vaccination sessions where density is high. view longitude 32.51464 to 32.64754, latitude 0.26149 to 0.36336 id 2e0eef15-a319-4b25-8746-f0ab62d6c9ad
- 96Rendering: Chart: Change of vaccination sessions where density is high. 5 rows id 339db613-2509-4201-bb54-b9cf3018c42e
- 97Tool result: gp_summarize_within, step 0. Summarize within: 1 layer saved: Hot cells of cases per health sub-district (18 features). id cbaa2d66-7e86-4062-a268-8ceebb34226f:0
- 98Layer: Hot spot analysis: Cases. 2,259 features id 7dc9eb55-076a-4811-89ea-633c6eba1ad4
- 99Layer: Hot cells of cases per health sub-district. 18 features id c90fa521-67fb-47d1-b4be-789822f3c247
- 100Rendering: Map: Hot cells of cases per health sub-district. view longitude 32.51464 to 32.64754, latitude 0.26149 to 0.36336 id c1fd9863-16f7-454b-b2e4-46156c47d93d
- 101Rendering: Chart: Hot cells of cases per health sub-district. 6 rows id d428d2a4-23ca-4584-9e0e-18e6da6305ec
- 102Catalog: Find nearest (operation catalog, gp_find_nearest). The k nearest features for each input, with geodesic distance and bearing. ArcGIS: Find Nearest, Near, Generate Near Table. QGIS: native:joinbynearest, native:nearestneighbouranalysis. id gp_find_nearest
- 103Tool result: gp_find_nearest, step 0. Find nearest: 1 layer saved: Nearest outbreak response team to each cluster of cases (1 feature). id bf6d2133-da41-4a20-84bf-87e492f1da5b:0
- 104Layer: Find point clusters: cluster hulls. 1 features id 53d9a3e2-2347-4fc0-bb22-fd75844c6cc8
- 105Layer: Nearest outbreak response team to each cluster of cases. 1 features id b7c1c4f9-ecec-44aa-bf5a-a330316e549f
- 106Rendering: Map: Nearest outbreak response team to each cluster of cases. view longitude 32.5846 to 32.60637, latitude 0.28861 to 0.3053 id 561b2c9d-1c47-4350-a8f1-2ace1078c213
- 107Rendering: Chart: Nearest outbreak response team to each cluster of cases. 1 rows id 3762f5c3-d6af-4f5c-847a-dcb0fcf4fbe1
- 108Catalog: Pipeline (tool description, gp_pipeline). Run up to 20 GIS operations in one engine call; a step's params may use "$id" (an earlier step's result) or "$id.key", and layer references. Every step's map outputs are saved as styled layers. Never calls Mapbox. id gp_pipeline
- 109Plan: Community health worker visits per 10,000 people per feature of Health sub-districts (the Start plan's candidate c_9273635ebf24). Health sub-districts holds population in 'population': Community health worker visits per 10,000 people in each feature compares features of different size; mapped as a choropleth (natural breaks, sequential colors). id 502cfe77-e27d-4781-888d-59ecc8241e24:c_9273635ebf24
- 110Tool result: gp_pipeline, step 0. Pipeline of 2 steps (classify_field > dissolve): 1 layer saved. id 228e478a-4ba9-4d74-976e-e45efd5229c7:0
- 111Layer: Dense areas of community health worker visits. 5 features id 3c9ccc18-20ed-47f2-ac66-234751a0679d
- 112Rendering: Chart: Dense areas of community health worker visits. 5 rows id 42cf1971-6f22-441e-aa1a-a1326ec273d8
- 113Tool result: gp_summarize_within, step 0. Summarize within: 1 layer saved: Change of vaccination sessions per health sub-district (18 features). id 17676f2a-994e-4660-9745-0a3db803f8a8:0
- 114Layer: Change of vaccination sessions per health sub-district. 18 features id f4ad8c88-5019-4a59-a2a0-054c153f32be
- 115Rendering: Map: Change of vaccination sessions per health sub-district. view longitude 32.51464 to 32.64754, latitude 0.26149 to 0.36336 id 5b65b748-4632-4299-9ce1-4f8eb9a0301e
- 116Rendering: Chart: Change of vaccination sessions per health sub-district. 6 rows id 7d5f7fc8-f8d9-41e4-be37-e2cea1f883b7
- 117Plan: Outbreak response teams per 10,000 people per feature of Health sub-districts (the Start plan's candidate c_9a76ebe60c76). Health sub-districts holds population in 'population': Outbreak response teams per 10,000 people in each feature compares features of different size; mapped as a choropleth (natural breaks, sequential colors). id 502cfe77-e27d-4781-888d-59ecc8241e24:c_9a76ebe60c76
- 118Tool result: gp_pipeline, step 0. Pipeline of 2 steps (buffer > summarize_within): 1 layer saved. id 8ab3e530-5833-406a-81af-1fb4eae27c2f:0
- 119Layer: Outbreak response teams within 250 m of each cluster of cases. 1 features id b7e12b85-5a4c-4d51-b141-8bb6248100da
- 120Rendering: Map: Outbreak response teams within 250 m of each cluster of cases. view longitude 32.58093 to 32.61005, latitude 0.28573 to 0.30805 id 2a7e6b94-090d-4ceb-9543-bf0e2eaad33c
- 121Rendering: Chart: Outbreak response teams within 250 m of each cluster of cases. 1 rows id 8d19bda1-77d2-4fd7-9777-e6693a0dd643
- 122Catalog: Merge layers (operation catalog, gp_merge_layers). Append several layers into one. ArcGIS: Merge Layers, Merge. QGIS: native:mergevectorlayers. id gp_merge_layers
- 123Tool result: gp_merge_layers, step 0. Merge layers: 1 layer saved: Density of community health worker visits and cases together (4960 features). id 1e12b18a-4e3f-4064-82dd-a2dfd4e27abc:0
- 124Layer: Calculate density: Cases. 2,508 features id b48a2b54-e6f8-464b-bc6d-b3f70448006d
- 125Layer: Density of community health worker visits and cases together. 4,960 features id 39d58f96-c415-42fe-bd1d-212d8c37be6e
- 126Rendering: Chart: Density of community health worker visits and cases together. 14 rows id 2adbb49c-d53c-48e7-a48f-ad1f6f209cf5
- 127Rendering: Map: Health sub-districts by population id 5ef70e51-0bfd-4073-a856-905f5169fec3
- 128Rendering: Chart: Cases over time (onset_date). 159 rows id 2767bc98-56c4-42c3-b1d6-bd12a2987bec
- 129Rendering: Chart: Clinic stock by month over time (month). 36 rows id f8cfe58c-5392-477f-95a8-16f1c3223752
- 130Rendering: Chart: Emerging hot spots: Community health worker visits. 8 rows id d847a912-2ac6-45dd-9ff7-e69e54f5091b
- 131Rendering: Chart: Emerging hot spots: Vaccination sessions. 6 rows id e41e6ccc-7233-4910-b880-fa8e491bc99b
- 132Rendering: Chart: Emerging hot spots: Cases. 8 rows id 8d0dd7bd-fa8d-46d4-a605-510c07477368
- 133Rendering: Chart: Hot spot analysis: Community health worker visits. 21 rows id 2f9efce8-7875-4dac-b005-38853d079029
- 134Rendering: Chart: Hot spot analysis: Cases. 53 rows id fa55dd0e-666e-4751-b2b2-9e1f0b859733
- 135Rendering: Chart: Hot spot analysis: Vaccination sessions. 14 rows id b1e62dd9-e001-4d7a-b5e6-ab1dc1f840cc
- 136Rendering: Chart: Summarize within: Health sub-districts. 6 rows id 9f7e951b-937a-4c91-a27e-78f52dcc8881
- 137Rendering: Chart: Summarize within: Health sub-districts. 6 rows id c229b3e5-c6e5-4952-a2f7-694aa2209b3f
- 138Rendering: Chart: Summarize within: Health sub-districts. 6 rows id 5e8cdc54-af5b-4a64-8630-d8cc680b09a0
- 139Rendering: Chart: Calculate density: Community health worker visits. 13 rows id fde12f1f-a5aa-4aeb-bf82-9263e56dca6f
- 140Rendering: Chart: Calculate density: Cases. 13 rows id d3819a7e-df6e-410c-a08e-5dc99421b7b4
- 141Rendering: Chart: Calculate density: Vaccination sessions. 11 rows id e67f7ebe-6edb-44cb-992b-568211369e6d
- 142Rendering: Chart: Find point clusters: Cases. 2 rows id 9446f731-3ec5-4204-a55f-680b73096a9b
- 143Rendering: Chart: Find point clusters: cluster hulls. 1 rows id 47f73bfc-cea9-49b5-a8c8-0daf229197af
- 144Rendering: Chart: Find outliers: Health sub-districts. 18 rows id 80bc5037-fe96-47f6-9f2d-09b7e0b01cee
- 145Rendering: Chart: Find point clusters: Cases over time. 106 rows id eda4bec9-eaa5-497f-855f-0e9893628d6b
- 146Rendering: Chart: Find point clusters: Community health worker visits over time. 108 rows id b48c3ed5-295d-4fff-a7f2-8068c4ce4536
- 147Rendering: Map: Density of community health worker visits and cases together. view longitude 32.50837 to 32.6538, latitude 0.25641 to 0.36789 id 88c9d95c-3e1b-4a51-8f51-669e638423ad
- 148Document: Epidemiological situation report. 1 page(s), 1 page(s) from the text layer id cb6fd9c4-f91e-4a89-a40d-68bf28554744
- 149Document page: Epidemiological situation report, page 1. Malaria cases rose after both rainy seasons, three weeks after the rain peaks. id cb6fd9c4-f91e-4a89-a40d-68bf28554744:1
- 150Dataset: Health sub-districts. vector, 18 rows id 9bb4e797-2cc2-4974-b5ec-02ddc0a96670
- 151Dataset: Clinics. vector, 35 rows id 668e992e-3b51-4493-9704-d33893bb3dfc
- 152Dataset: Water points. vector, 150 rows id 899479cd-15fb-482f-8652-6656bfa10bfb
- 153Dataset: Outbreak response teams. vector, 6 rows id af26ec39-903c-46e8-8314-2dea85af0098
- 154Dataset: Epidemiological situation report. document, ? rows id 33a668e1-f7f4-454b-ac70-576cd982e98f
- 155Record: Sample: Public health, Kampala id 2612067c-badd-4310-9678-8f580d5e3d32
- 156Layer: Emerging hot spots: Community health worker visits. 124 features id 32cd91ad-60ea-4d7e-a96f-48417549e7e1
- 157Layer: Emerging hot spots: Vaccination sessions. 24 features id 99a03e93-7113-48b6-b8ad-aa357667356c
- 158Layer: Emerging hot spots: Cases. 125 features id fd743779-7b6c-495f-9c0d-b1ac9a8dafa4
- 159Layer: Hot spot analysis: Community health worker visits. 390 features id e0bdc602-6847-43ba-83b2-d2832f74b413
- 160Layer: Hot spot analysis: Vaccination sessions. 99 features id dc4def90-dea3-4ca0-88dd-5778b14b932b
- 161Layer: Summarize within: Health sub-districts. 18 features id def8ac79-eb53-495e-af55-828f67a5b5a2
- 162Layer: Summarize within: Health sub-districts. 18 features id f4259241-f5e4-42fa-9481-0cf7434aa6d5
- 163Layer: Calculate density: Vaccination sessions. 616 features id c49f160e-369f-44fa-b91b-296dc8ea18ee
- 164Layer: Find point clusters: Community health worker visits. 1,000 features id 97d77c9e-c58d-4c5a-af88-3874d12ef032
- 165Layer: Find point clusters: Cases. 2,290 features id f97a47bc-a875-42e7-891d-ba3d7809245f
- 166Layer: Find outliers: Health sub-districts. 18 features id 2d5379dc-e698-4b04-b2db-6504a49d353d
Appendix: the data behind the chartsShow
Figure 1. Timeline: events per week by dataset 1
| period | series | value |
|---|---|---|
| 2025-09-29 | Cases | 16 |
| 2025-09-29 | Community health worker visits | 0 |
| 2025-09-29 | Weekly cases by sub-district | 0 |
| 2025-09-29 | Clinic stock by month | 0 |
| 2025-09-29 | Vaccination sessions | 0 |
| 2025-10-06 | Cases | 25 |
| 2025-10-06 | Community health worker visits | 0 |
| 2025-10-06 | Weekly cases by sub-district | 18 |
| 2025-10-06 | Clinic stock by month | 0 |
| 2025-10-06 | Vaccination sessions | 0 |
| 2025-10-13 | Cases | 20 |
| 2025-10-13 | Community health worker visits | 0 |
| 2025-10-13 | Weekly cases by sub-district | 18 |
| 2025-10-13 | Clinic stock by month | 0 |
| 2025-10-13 | Vaccination sessions | 0 |
| 2025-10-20 | Cases | 39 |
| 2025-10-20 | Community health worker visits | 0 |
| 2025-10-20 | Weekly cases by sub-district | 18 |
| 2025-10-20 | Clinic stock by month | 0 |
| 2025-10-20 | Vaccination sessions | 0 |
| 2025-10-27 | Cases | 25 |
| 2025-10-27 | Community health worker visits | 0 |
| 2025-10-27 | Weekly cases by sub-district | 18 |
| 2025-10-27 | Clinic stock by month | 0 |
| 2025-10-27 | Vaccination sessions | 0 |
| 2025-11-03 | Cases | 38 |
| 2025-11-03 | Community health worker visits | 0 |
| 2025-11-03 | Weekly cases by sub-district | 18 |
| 2025-11-03 | Clinic stock by month | 0 |
| 2025-11-03 | Vaccination sessions | 0 |
| 2025-11-10 | Cases | 50 |
| 2025-11-10 | Community health worker visits | 0 |
| 2025-11-10 | Weekly cases by sub-district | 18 |
| 2025-11-10 | Clinic stock by month | 0 |
| 2025-11-10 | Vaccination sessions | 0 |
| 2025-11-17 | Cases | 60 |
| 2025-11-17 | Community health worker visits | 0 |
| 2025-11-17 | Weekly cases by sub-district | 18 |
| 2025-11-17 | Clinic stock by month | 0 |
| 2025-11-17 | Vaccination sessions | 0 |
| 2025-11-24 | Cases | 91 |
| 2025-11-24 | Community health worker visits | 0 |
| 2025-11-24 | Weekly cases by sub-district | 18 |
| 2025-11-24 | Clinic stock by month | 0 |
| 2025-11-24 | Vaccination sessions | 0 |
| 2025-12-01 | Cases | 63 |
| 2025-12-01 | Community health worker visits | 0 |
| 2025-12-01 | Weekly cases by sub-district | 18 |
| 2025-12-01 | Clinic stock by month | 0 |
| 2025-12-01 | Vaccination sessions | 0 |
| 2025-12-08 | Cases | 55 |
| 2025-12-08 | Community health worker visits | 0 |
| 2025-12-08 | Weekly cases by sub-district | 18 |
| 2025-12-08 | Clinic stock by month | 0 |
| 2025-12-08 | Vaccination sessions | 0 |
| 2025-12-15 | Cases | 70 |
| 2025-12-15 | Community health worker visits | 0 |
| 2025-12-15 | Weekly cases by sub-district | 18 |
| 2025-12-15 | Clinic stock by month | 0 |
| 2025-12-15 | Vaccination sessions | 0 |
| 2025-12-22 | Cases | 52 |
| 2025-12-22 | Community health worker visits | 0 |
| 2025-12-22 | Weekly cases by sub-district | 18 |
| 2025-12-22 | Clinic stock by month | 0 |
| 2025-12-22 | Vaccination sessions | 0 |
| 2025-12-29 | Cases | 39 |
| 2025-12-29 | Community health worker visits | 0 |
| 2025-12-29 | Weekly cases by sub-district | 18 |
| 2025-12-29 | Clinic stock by month | 35 |
| 2025-12-29 | Vaccination sessions | 0 |
| 2026-01-05 | Cases | 44 |
| 2026-01-05 | Community health worker visits | 0 |
| 2026-01-05 | Weekly cases by sub-district | 18 |
| 2026-01-05 | Clinic stock by month | 0 |
| 2026-01-05 | Vaccination sessions | 8 |
| 2026-01-12 | Cases | 36 |
| 2026-01-12 | Community health worker visits | 0 |
| 2026-01-12 | Weekly cases by sub-district | 18 |
| 2026-01-12 | Clinic stock by month | 0 |
| 2026-01-12 | Vaccination sessions | 5 |
| 2026-01-19 | Cases | 28 |
| 2026-01-19 | Community health worker visits | 0 |
| 2026-01-19 | Weekly cases by sub-district | 18 |
| 2026-01-19 | Clinic stock by month | 0 |
| 2026-01-19 | Vaccination sessions | 4 |
| 2026-01-26 | Cases | 30 |
| 2026-01-26 | Community health worker visits | 0 |
| 2026-01-26 | Weekly cases by sub-district | 18 |
| 2026-01-26 | Clinic stock by month | 35 |
| 2026-01-26 | Vaccination sessions | 3 |
| 2026-02-02 | Cases | 26 |
| 2026-02-02 | Community health worker visits | 0 |
| 2026-02-02 | Weekly cases by sub-district | 18 |
| 2026-02-02 | Clinic stock by month | 0 |
| 2026-02-02 | Vaccination sessions | 6 |
| 2026-02-09 | Cases | 17 |
| 2026-02-09 | Community health worker visits | 0 |
| 2026-02-09 | Weekly cases by sub-district | 18 |
| 2026-02-09 | Clinic stock by month | 0 |
| 2026-02-09 | Vaccination sessions | 5 |
| 2026-02-16 | Cases | 21 |
| 2026-02-16 | Community health worker visits | 0 |
| 2026-02-16 | Weekly cases by sub-district | 18 |
| 2026-02-16 | Clinic stock by month | 0 |
| 2026-02-16 | Vaccination sessions | 6 |
| 2026-02-23 | Cases | 29 |
| 2026-02-23 | Community health worker visits | 0 |
| 2026-02-23 | Weekly cases by sub-district | 18 |
| 2026-02-23 | Clinic stock by month | 35 |
| 2026-02-23 | Vaccination sessions | 9 |
| 2026-03-02 | Cases | 25 |
| 2026-03-02 | Community health worker visits | 0 |
| 2026-03-02 | Weekly cases by sub-district | 18 |
| 2026-03-02 | Clinic stock by month | 0 |
| 2026-03-02 | Vaccination sessions | 5 |
| 2026-03-09 | Cases | 23 |
| 2026-03-09 | Community health worker visits | 0 |
| 2026-03-09 | Weekly cases by sub-district | 18 |
| 2026-03-09 | Clinic stock by month | 0 |
| 2026-03-09 | Vaccination sessions | 2 |
| 2026-03-16 | Cases | 29 |
| 2026-03-16 | Community health worker visits | 0 |
| 2026-03-16 | Weekly cases by sub-district | 18 |
| 2026-03-16 | Clinic stock by month | 0 |
| 2026-03-16 | Vaccination sessions | 3 |
| 2026-03-23 | Cases | 29 |
| 2026-03-23 | Community health worker visits | 0 |
| 2026-03-23 | Weekly cases by sub-district | 18 |
| 2026-03-23 | Clinic stock by month | 0 |
| 2026-03-23 | Vaccination sessions | 6 |
| 2026-03-30 | Cases | 21 |
| 2026-03-30 | Community health worker visits | 26 |
| 2026-03-30 | Weekly cases by sub-district | 18 |
| 2026-03-30 | Clinic stock by month | 35 |
| 2026-03-30 | Vaccination sessions | 5 |
| 2026-04-06 | Cases | 40 |
| 2026-04-06 | Community health worker visits | 42 |
| 2026-04-06 | Weekly cases by sub-district | 18 |
| 2026-04-06 | Clinic stock by month | 0 |
| 2026-04-06 | Vaccination sessions | 7 |
| 2026-04-13 | Cases | 55 |
| 2026-04-13 | Community health worker visits | 34 |
| 2026-04-13 | Weekly cases by sub-district | 18 |
| 2026-04-13 | Clinic stock by month | 0 |
| 2026-04-13 | Vaccination sessions | 9 |
| 2026-04-20 | Cases | 60 |
| 2026-04-20 | Community health worker visits | 37 |
| 2026-04-20 | Weekly cases by sub-district | 18 |
| 2026-04-20 | Clinic stock by month | 0 |
| 2026-04-20 | Vaccination sessions | 4 |
| 2026-04-27 | Cases | 89 |
| 2026-04-27 | Community health worker visits | 41 |
| 2026-04-27 | Weekly cases by sub-district | 18 |
| 2026-04-27 | Clinic stock by month | 35 |
| 2026-04-27 | Vaccination sessions | 0 |
| 2026-05-04 | Cases | 128 |
| 2026-05-04 | Community health worker visits | 43 |
| 2026-05-04 | Weekly cases by sub-district | 18 |
| 2026-05-04 | Clinic stock by month | 0 |
| 2026-05-04 | Vaccination sessions | 1 |
| 2026-05-11 | Cases | 166 |
| 2026-05-11 | Community health worker visits | 29 |
| 2026-05-11 | Weekly cases by sub-district | 18 |
| 2026-05-11 | Clinic stock by month | 0 |
| 2026-05-11 | Vaccination sessions | 7 |
| 2026-05-18 | Cases | 136 |
| 2026-05-18 | Community health worker visits | 44 |
| 2026-05-18 | Weekly cases by sub-district | 18 |
| 2026-05-18 | Clinic stock by month | 0 |
| 2026-05-18 | Vaccination sessions | 2 |
| 2026-05-25 | Cases | 86 |
| 2026-05-25 | Community health worker visits | 37 |
| 2026-05-25 | Weekly cases by sub-district | 18 |
| 2026-05-25 | Clinic stock by month | 0 |
| 2026-05-25 | Vaccination sessions | 5 |
| 2026-06-01 | Cases | 60 |
| 2026-06-01 | Community health worker visits | 31 |
| 2026-06-01 | Weekly cases by sub-district | 18 |
| 2026-06-01 | Clinic stock by month | 35 |
| 2026-06-01 | Vaccination sessions | 3 |
| 2026-06-08 | Cases | 29 |
| 2026-06-08 | Community health worker visits | 31 |
| 2026-06-08 | Weekly cases by sub-district | 18 |
| 2026-06-08 | Clinic stock by month | 0 |
| 2026-06-08 | Vaccination sessions | 9 |
| 2026-06-15 | Cases | 36 |
| 2026-06-15 | Community health worker visits | 38 |
| 2026-06-15 | Weekly cases by sub-district | 18 |
| 2026-06-15 | Clinic stock by month | 0 |
| 2026-06-15 | Vaccination sessions | 6 |
| 2026-06-22 | Cases | 26 |
| 2026-06-22 | Community health worker visits | 39 |
| 2026-06-22 | Weekly cases by sub-district | 18 |
| 2026-06-22 | Clinic stock by month | 0 |
| 2026-06-22 | Vaccination sessions | 11 |
| 2026-06-29 | Cases | 37 |
| 2026-06-29 | Community health worker visits | 40 |
| 2026-06-29 | Weekly cases by sub-district | 18 |
| 2026-06-29 | Clinic stock by month | 35 |
| 2026-06-29 | Vaccination sessions | 9 |
| 2026-07-06 | Cases | 27 |
| 2026-07-06 | Community health worker visits | 49 |
| 2026-07-06 | Weekly cases by sub-district | 18 |
| 2026-07-06 | Clinic stock by month | 0 |
| 2026-07-06 | Vaccination sessions | 2 |
| 2026-07-13 | Cases | 28 |
| 2026-07-13 | Community health worker visits | 47 |
| 2026-07-13 | Weekly cases by sub-district | 18 |
| 2026-07-13 | Clinic stock by month | 0 |
| 2026-07-13 | Vaccination sessions | 4 |
| 2026-07-20 | Cases | 32 |
| 2026-07-20 | Community health worker visits | 39 |
| 2026-07-20 | Weekly cases by sub-district | 18 |
| 2026-07-20 | Clinic stock by month | 0 |
| 2026-07-20 | Vaccination sessions | 5 |
| 2026-07-27 | Cases | 28 |
| 2026-07-27 | Community health worker visits | 37 |
| 2026-07-27 | Weekly cases by sub-district | 18 |
| 2026-07-27 | Clinic stock by month | 35 |
| 2026-07-27 | Vaccination sessions | 7 |
| 2026-08-03 | Cases | 36 |
| 2026-08-03 | Community health worker visits | 38 |
| 2026-08-03 | Weekly cases by sub-district | 18 |
| 2026-08-03 | Clinic stock by month | 0 |
| 2026-08-03 | Vaccination sessions | 5 |
| 2026-08-10 | Cases | 25 |
| 2026-08-10 | Community health worker visits | 43 |
| 2026-08-10 | Weekly cases by sub-district | 18 |
| 2026-08-10 | Clinic stock by month | 0 |
| 2026-08-10 | Vaccination sessions | 3 |
| 2026-08-17 | Cases | 23 |
| 2026-08-17 | Community health worker visits | 40 |
| 2026-08-17 | Weekly cases by sub-district | 18 |
| 2026-08-17 | Clinic stock by month | 0 |
| 2026-08-17 | Vaccination sessions | 3 |
| 2026-08-24 | Cases | 21 |
| 2026-08-24 | Community health worker visits | 37 |
| 2026-08-24 | Weekly cases by sub-district | 18 |
| 2026-08-24 | Clinic stock by month | 0 |
| 2026-08-24 | Vaccination sessions | 6 |
| 2026-08-31 | Cases | 24 |
| 2026-08-31 | Community health worker visits | 32 |
| 2026-08-31 | Weekly cases by sub-district | 18 |
| 2026-08-31 | Clinic stock by month | 35 |
| 2026-08-31 | Vaccination sessions | 5 |
| 2026-09-07 | Cases | 33 |
| 2026-09-07 | Community health worker visits | 38 |
| 2026-09-07 | Weekly cases by sub-district | 18 |
| 2026-09-07 | Clinic stock by month | 0 |
| 2026-09-07 | Vaccination sessions | 4 |
| 2026-09-14 | Cases | 18 |
| 2026-09-14 | Community health worker visits | 34 |
| 2026-09-14 | Weekly cases by sub-district | 18 |
| 2026-09-14 | Clinic stock by month | 0 |
| 2026-09-14 | Vaccination sessions | 6 |
| 2026-09-21 | Cases | 25 |
| 2026-09-21 | Community health worker visits | 36 |
| 2026-09-21 | Weekly cases by sub-district | 18 |
| 2026-09-21 | Clinic stock by month | 0 |
| 2026-09-21 | Vaccination sessions | 5 |
| 2026-09-28 | Cases | 21 |
| 2026-09-28 | Community health worker visits | 18 |
| 2026-09-28 | Weekly cases by sub-district | 18 |
| 2026-09-28 | Clinic stock by month | 0 |
| 2026-09-28 | Vaccination sessions | 5 |
Figure 2. Timeline lanes: events per week by dataset 7
| lane | period | period_end | value |
|---|---|---|---|
| Cases | 2025-09-29 | 2025-10-06 | 16 |
| Cases | 2025-10-06 | 2025-10-13 | 25 |
| Cases | 2025-10-13 | 2025-10-20 | 20 |
| Cases | 2025-10-20 | 2025-10-27 | 39 |
| Cases | 2025-10-27 | 2025-11-03 | 25 |
| Cases | 2025-11-03 | 2025-11-10 | 38 |
| Cases | 2025-11-10 | 2025-11-17 | 50 |
| Cases | 2025-11-17 | 2025-11-24 | 60 |
| Cases | 2025-11-24 | 2025-12-01 | 91 |
| Cases | 2025-12-01 | 2025-12-08 | 63 |
| Cases | 2025-12-08 | 2025-12-15 | 55 |
| Cases | 2025-12-15 | 2025-12-22 | 70 |
| Cases | 2025-12-22 | 2025-12-29 | 52 |
| Cases | 2025-12-29 | 2026-01-05 | 39 |
| Cases | 2026-01-05 | 2026-01-12 | 44 |
| Cases | 2026-01-12 | 2026-01-19 | 36 |
| Cases | 2026-01-19 | 2026-01-26 | 28 |
| Cases | 2026-01-26 | 2026-02-02 | 30 |
| Cases | 2026-02-02 | 2026-02-09 | 26 |
| Cases | 2026-02-09 | 2026-02-16 | 17 |
| Cases | 2026-02-16 | 2026-02-23 | 21 |
| Cases | 2026-02-23 | 2026-03-02 | 29 |
| Cases | 2026-03-02 | 2026-03-09 | 25 |
| Cases | 2026-03-09 | 2026-03-16 | 23 |
| Cases | 2026-03-16 | 2026-03-23 | 29 |
| Cases | 2026-03-23 | 2026-03-30 | 29 |
| Cases | 2026-03-30 | 2026-04-06 | 21 |
| Cases | 2026-04-06 | 2026-04-13 | 40 |
| Cases | 2026-04-13 | 2026-04-20 | 55 |
| Cases | 2026-04-20 | 2026-04-27 | 60 |
| Cases | 2026-04-27 | 2026-05-04 | 89 |
| Cases | 2026-05-04 | 2026-05-11 | 128 |
| Cases | 2026-05-11 | 2026-05-18 | 166 |
| Cases | 2026-05-18 | 2026-05-25 | 136 |
| Cases | 2026-05-25 | 2026-06-01 | 86 |
| Cases | 2026-06-01 | 2026-06-08 | 60 |
| Cases | 2026-06-08 | 2026-06-15 | 29 |
| Cases | 2026-06-15 | 2026-06-22 | 36 |
| Cases | 2026-06-22 | 2026-06-29 | 26 |
| Cases | 2026-06-29 | 2026-07-06 | 37 |
| Cases | 2026-07-06 | 2026-07-13 | 27 |
| Cases | 2026-07-13 | 2026-07-20 | 28 |
| Cases | 2026-07-20 | 2026-07-27 | 32 |
| Cases | 2026-07-27 | 2026-08-03 | 28 |
| Cases | 2026-08-03 | 2026-08-10 | 36 |
| Cases | 2026-08-10 | 2026-08-17 | 25 |
| Cases | 2026-08-17 | 2026-08-24 | 23 |
| Cases | 2026-08-24 | 2026-08-31 | 21 |
| Cases | 2026-08-31 | 2026-09-07 | 24 |
| Cases | 2026-09-07 | 2026-09-14 | 33 |
| Cases | 2026-09-14 | 2026-09-21 | 18 |
| Cases | 2026-09-21 | 2026-09-28 | 25 |
| Cases | 2026-09-28 | 2026-10-05 | 21 |
| Community health worker visits | 2025-09-29 | 2025-10-06 | 0 |
| Community health worker visits | 2025-10-06 | 2025-10-13 | 0 |
| Community health worker visits | 2025-10-13 | 2025-10-20 | 0 |
| Community health worker visits | 2025-10-20 | 2025-10-27 | 0 |
| Community health worker visits | 2025-10-27 | 2025-11-03 | 0 |
| Community health worker visits | 2025-11-03 | 2025-11-10 | 0 |
| Community health worker visits | 2025-11-10 | 2025-11-17 | 0 |
| Community health worker visits | 2025-11-17 | 2025-11-24 | 0 |
| Community health worker visits | 2025-11-24 | 2025-12-01 | 0 |
| Community health worker visits | 2025-12-01 | 2025-12-08 | 0 |
| Community health worker visits | 2025-12-08 | 2025-12-15 | 0 |
| Community health worker visits | 2025-12-15 | 2025-12-22 | 0 |
| Community health worker visits | 2025-12-22 | 2025-12-29 | 0 |
| Community health worker visits | 2025-12-29 | 2026-01-05 | 0 |
| Community health worker visits | 2026-01-05 | 2026-01-12 | 0 |
| Community health worker visits | 2026-01-12 | 2026-01-19 | 0 |
| Community health worker visits | 2026-01-19 | 2026-01-26 | 0 |
| Community health worker visits | 2026-01-26 | 2026-02-02 | 0 |
| Community health worker visits | 2026-02-02 | 2026-02-09 | 0 |
| Community health worker visits | 2026-02-09 | 2026-02-16 | 0 |
| Community health worker visits | 2026-02-16 | 2026-02-23 | 0 |
| Community health worker visits | 2026-02-23 | 2026-03-02 | 0 |
| Community health worker visits | 2026-03-02 | 2026-03-09 | 0 |
| Community health worker visits | 2026-03-09 | 2026-03-16 | 0 |
| Community health worker visits | 2026-03-16 | 2026-03-23 | 0 |
| Community health worker visits | 2026-03-23 | 2026-03-30 | 0 |
| Community health worker visits | 2026-03-30 | 2026-04-06 | 26 |
| Community health worker visits | 2026-04-06 | 2026-04-13 | 42 |
| Community health worker visits | 2026-04-13 | 2026-04-20 | 34 |
| Community health worker visits | 2026-04-20 | 2026-04-27 | 37 |
| Community health worker visits | 2026-04-27 | 2026-05-04 | 41 |
| Community health worker visits | 2026-05-04 | 2026-05-11 | 43 |
| Community health worker visits | 2026-05-11 | 2026-05-18 | 29 |
| Community health worker visits | 2026-05-18 | 2026-05-25 | 44 |
| Community health worker visits | 2026-05-25 | 2026-06-01 | 37 |
| Community health worker visits | 2026-06-01 | 2026-06-08 | 31 |
| Community health worker visits | 2026-06-08 | 2026-06-15 | 31 |
| Community health worker visits | 2026-06-15 | 2026-06-22 | 38 |
| Community health worker visits | 2026-06-22 | 2026-06-29 | 39 |
| Community health worker visits | 2026-06-29 | 2026-07-06 | 40 |
| Community health worker visits | 2026-07-06 | 2026-07-13 | 49 |
| Community health worker visits | 2026-07-13 | 2026-07-20 | 47 |
| Community health worker visits | 2026-07-20 | 2026-07-27 | 39 |
| Community health worker visits | 2026-07-27 | 2026-08-03 | 37 |
| Community health worker visits | 2026-08-03 | 2026-08-10 | 38 |
| Community health worker visits | 2026-08-10 | 2026-08-17 | 43 |
| Community health worker visits | 2026-08-17 | 2026-08-24 | 40 |
| Community health worker visits | 2026-08-24 | 2026-08-31 | 37 |
| Community health worker visits | 2026-08-31 | 2026-09-07 | 32 |
| Community health worker visits | 2026-09-07 | 2026-09-14 | 38 |
| Community health worker visits | 2026-09-14 | 2026-09-21 | 34 |
| Community health worker visits | 2026-09-21 | 2026-09-28 | 36 |
| Community health worker visits | 2026-09-28 | 2026-10-05 | 18 |
| Weekly cases by sub-district | 2025-09-29 | 2025-10-06 | 0 |
| Weekly cases by sub-district | 2025-10-06 | 2025-10-13 | 18 |
| Weekly cases by sub-district | 2025-10-13 | 2025-10-20 | 18 |
| Weekly cases by sub-district | 2025-10-20 | 2025-10-27 | 18 |
| Weekly cases by sub-district | 2025-10-27 | 2025-11-03 | 18 |
| Weekly cases by sub-district | 2025-11-03 | 2025-11-10 | 18 |
| Weekly cases by sub-district | 2025-11-10 | 2025-11-17 | 18 |
| Weekly cases by sub-district | 2025-11-17 | 2025-11-24 | 18 |
| Weekly cases by sub-district | 2025-11-24 | 2025-12-01 | 18 |
| Weekly cases by sub-district | 2025-12-01 | 2025-12-08 | 18 |
| Weekly cases by sub-district | 2025-12-08 | 2025-12-15 | 18 |
| Weekly cases by sub-district | 2025-12-15 | 2025-12-22 | 18 |
| Weekly cases by sub-district | 2025-12-22 | 2025-12-29 | 18 |
| Weekly cases by sub-district | 2025-12-29 | 2026-01-05 | 18 |
| Weekly cases by sub-district | 2026-01-05 | 2026-01-12 | 18 |
| Weekly cases by sub-district | 2026-01-12 | 2026-01-19 | 18 |
| Weekly cases by sub-district | 2026-01-19 | 2026-01-26 | 18 |
| Weekly cases by sub-district | 2026-01-26 | 2026-02-02 | 18 |
| Weekly cases by sub-district | 2026-02-02 | 2026-02-09 | 18 |
| Weekly cases by sub-district | 2026-02-09 | 2026-02-16 | 18 |
| Weekly cases by sub-district | 2026-02-16 | 2026-02-23 | 18 |
| Weekly cases by sub-district | 2026-02-23 | 2026-03-02 | 18 |
| Weekly cases by sub-district | 2026-03-02 | 2026-03-09 | 18 |
| Weekly cases by sub-district | 2026-03-09 | 2026-03-16 | 18 |
| Weekly cases by sub-district | 2026-03-16 | 2026-03-23 | 18 |
| Weekly cases by sub-district | 2026-03-23 | 2026-03-30 | 18 |
| Weekly cases by sub-district | 2026-03-30 | 2026-04-06 | 18 |
| Weekly cases by sub-district | 2026-04-06 | 2026-04-13 | 18 |
| Weekly cases by sub-district | 2026-04-13 | 2026-04-20 | 18 |
| Weekly cases by sub-district | 2026-04-20 | 2026-04-27 | 18 |
| Weekly cases by sub-district | 2026-04-27 | 2026-05-04 | 18 |
| Weekly cases by sub-district | 2026-05-04 | 2026-05-11 | 18 |
| Weekly cases by sub-district | 2026-05-11 | 2026-05-18 | 18 |
| Weekly cases by sub-district | 2026-05-18 | 2026-05-25 | 18 |
| Weekly cases by sub-district | 2026-05-25 | 2026-06-01 | 18 |
| Weekly cases by sub-district | 2026-06-01 | 2026-06-08 | 18 |
| Weekly cases by sub-district | 2026-06-08 | 2026-06-15 | 18 |
| Weekly cases by sub-district | 2026-06-15 | 2026-06-22 | 18 |
| Weekly cases by sub-district | 2026-06-22 | 2026-06-29 | 18 |
| Weekly cases by sub-district | 2026-06-29 | 2026-07-06 | 18 |
| Weekly cases by sub-district | 2026-07-06 | 2026-07-13 | 18 |
| Weekly cases by sub-district | 2026-07-13 | 2026-07-20 | 18 |
| Weekly cases by sub-district | 2026-07-20 | 2026-07-27 | 18 |
| Weekly cases by sub-district | 2026-07-27 | 2026-08-03 | 18 |
| Weekly cases by sub-district | 2026-08-03 | 2026-08-10 | 18 |
| Weekly cases by sub-district | 2026-08-10 | 2026-08-17 | 18 |
| Weekly cases by sub-district | 2026-08-17 | 2026-08-24 | 18 |
| Weekly cases by sub-district | 2026-08-24 | 2026-08-31 | 18 |
| Weekly cases by sub-district | 2026-08-31 | 2026-09-07 | 18 |
| Weekly cases by sub-district | 2026-09-07 | 2026-09-14 | 18 |
| Weekly cases by sub-district | 2026-09-14 | 2026-09-21 | 18 |
| Weekly cases by sub-district | 2026-09-21 | 2026-09-28 | 18 |
| Weekly cases by sub-district | 2026-09-28 | 2026-10-05 | 18 |
| Clinic stock by month | 2025-09-29 | 2025-10-06 | 0 |
| Clinic stock by month | 2025-10-06 | 2025-10-13 | 0 |
| Clinic stock by month | 2025-10-13 | 2025-10-20 | 0 |
| Clinic stock by month | 2025-10-20 | 2025-10-27 | 0 |
| Clinic stock by month | 2025-10-27 | 2025-11-03 | 0 |
| Clinic stock by month | 2025-11-03 | 2025-11-10 | 0 |
| Clinic stock by month | 2025-11-10 | 2025-11-17 | 0 |
| Clinic stock by month | 2025-11-17 | 2025-11-24 | 0 |
| Clinic stock by month | 2025-11-24 | 2025-12-01 | 0 |
| Clinic stock by month | 2025-12-01 | 2025-12-08 | 0 |
| Clinic stock by month | 2025-12-08 | 2025-12-15 | 0 |
| Clinic stock by month | 2025-12-15 | 2025-12-22 | 0 |
| Clinic stock by month | 2025-12-22 | 2025-12-29 | 0 |
| Clinic stock by month | 2025-12-29 | 2026-01-05 | 35 |
| Clinic stock by month | 2026-01-05 | 2026-01-12 | 0 |
| Clinic stock by month | 2026-01-12 | 2026-01-19 | 0 |
| Clinic stock by month | 2026-01-19 | 2026-01-26 | 0 |
| Clinic stock by month | 2026-01-26 | 2026-02-02 | 35 |
| Clinic stock by month | 2026-02-02 | 2026-02-09 | 0 |
| Clinic stock by month | 2026-02-09 | 2026-02-16 | 0 |
| Clinic stock by month | 2026-02-16 | 2026-02-23 | 0 |
| Clinic stock by month | 2026-02-23 | 2026-03-02 | 35 |
| Clinic stock by month | 2026-03-02 | 2026-03-09 | 0 |
| Clinic stock by month | 2026-03-09 | 2026-03-16 | 0 |
| Clinic stock by month | 2026-03-16 | 2026-03-23 | 0 |
| Clinic stock by month | 2026-03-23 | 2026-03-30 | 0 |
| Clinic stock by month | 2026-03-30 | 2026-04-06 | 35 |
| Clinic stock by month | 2026-04-06 | 2026-04-13 | 0 |
| Clinic stock by month | 2026-04-13 | 2026-04-20 | 0 |
| Clinic stock by month | 2026-04-20 | 2026-04-27 | 0 |
| Clinic stock by month | 2026-04-27 | 2026-05-04 | 35 |
| Clinic stock by month | 2026-05-04 | 2026-05-11 | 0 |
| Clinic stock by month | 2026-05-11 | 2026-05-18 | 0 |
| Clinic stock by month | 2026-05-18 | 2026-05-25 | 0 |
| Clinic stock by month | 2026-05-25 | 2026-06-01 | 0 |
| Clinic stock by month | 2026-06-01 | 2026-06-08 | 35 |
| Clinic stock by month | 2026-06-08 | 2026-06-15 | 0 |
| Clinic stock by month | 2026-06-15 | 2026-06-22 | 0 |
| Clinic stock by month | 2026-06-22 | 2026-06-29 | 0 |
| Clinic stock by month | 2026-06-29 | 2026-07-06 | 35 |
| Clinic stock by month | 2026-07-06 | 2026-07-13 | 0 |
| Clinic stock by month | 2026-07-13 | 2026-07-20 | 0 |
| Clinic stock by month | 2026-07-20 | 2026-07-27 | 0 |
| Clinic stock by month | 2026-07-27 | 2026-08-03 | 35 |
| Clinic stock by month | 2026-08-03 | 2026-08-10 | 0 |
| Clinic stock by month | 2026-08-10 | 2026-08-17 | 0 |
| Clinic stock by month | 2026-08-17 | 2026-08-24 | 0 |
| Clinic stock by month | 2026-08-24 | 2026-08-31 | 0 |
| Clinic stock by month | 2026-08-31 | 2026-09-07 | 35 |
| Clinic stock by month | 2026-09-07 | 2026-09-14 | 0 |
| Clinic stock by month | 2026-09-14 | 2026-09-21 | 0 |
| Clinic stock by month | 2026-09-21 | 2026-09-28 | 0 |
| Clinic stock by month | 2026-09-28 | 2026-10-05 | 0 |
| Vaccination sessions | 2025-09-29 | 2025-10-06 | 0 |
| Vaccination sessions | 2025-10-06 | 2025-10-13 | 0 |
| Vaccination sessions | 2025-10-13 | 2025-10-20 | 0 |
| Vaccination sessions | 2025-10-20 | 2025-10-27 | 0 |
| Vaccination sessions | 2025-10-27 | 2025-11-03 | 0 |
| Vaccination sessions | 2025-11-03 | 2025-11-10 | 0 |
| Vaccination sessions | 2025-11-10 | 2025-11-17 | 0 |
| Vaccination sessions | 2025-11-17 | 2025-11-24 | 0 |
| Vaccination sessions | 2025-11-24 | 2025-12-01 | 0 |
| Vaccination sessions | 2025-12-01 | 2025-12-08 | 0 |
| Vaccination sessions | 2025-12-08 | 2025-12-15 | 0 |
| Vaccination sessions | 2025-12-15 | 2025-12-22 | 0 |
| Vaccination sessions | 2025-12-22 | 2025-12-29 | 0 |
| Vaccination sessions | 2025-12-29 | 2026-01-05 | 0 |
| Vaccination sessions | 2026-01-05 | 2026-01-12 | 8 |
| Vaccination sessions | 2026-01-12 | 2026-01-19 | 5 |
| Vaccination sessions | 2026-01-19 | 2026-01-26 | 4 |
| Vaccination sessions | 2026-01-26 | 2026-02-02 | 3 |
| Vaccination sessions | 2026-02-02 | 2026-02-09 | 6 |
| Vaccination sessions | 2026-02-09 | 2026-02-16 | 5 |
| Vaccination sessions | 2026-02-16 | 2026-02-23 | 6 |
| Vaccination sessions | 2026-02-23 | 2026-03-02 | 9 |
| Vaccination sessions | 2026-03-02 | 2026-03-09 | 5 |
| Vaccination sessions | 2026-03-09 | 2026-03-16 | 2 |
| Vaccination sessions | 2026-03-16 | 2026-03-23 | 3 |
| Vaccination sessions | 2026-03-23 | 2026-03-30 | 6 |
| Vaccination sessions | 2026-03-30 | 2026-04-06 | 5 |
| Vaccination sessions | 2026-04-06 | 2026-04-13 | 7 |
| Vaccination sessions | 2026-04-13 | 2026-04-20 | 9 |
| Vaccination sessions | 2026-04-20 | 2026-04-27 | 4 |
| Vaccination sessions | 2026-04-27 | 2026-05-04 | 0 |
| Vaccination sessions | 2026-05-04 | 2026-05-11 | 1 |
| Vaccination sessions | 2026-05-11 | 2026-05-18 | 7 |
| Vaccination sessions | 2026-05-18 | 2026-05-25 | 2 |
| Vaccination sessions | 2026-05-25 | 2026-06-01 | 5 |
| Vaccination sessions | 2026-06-01 | 2026-06-08 | 3 |
| Vaccination sessions | 2026-06-08 | 2026-06-15 | 9 |
| Vaccination sessions | 2026-06-15 | 2026-06-22 | 6 |
| Vaccination sessions | 2026-06-22 | 2026-06-29 | 11 |
| Vaccination sessions | 2026-06-29 | 2026-07-06 | 9 |
| Vaccination sessions | 2026-07-06 | 2026-07-13 | 2 |
| Vaccination sessions | 2026-07-13 | 2026-07-20 | 4 |
| Vaccination sessions | 2026-07-20 | 2026-07-27 | 5 |
| Vaccination sessions | 2026-07-27 | 2026-08-03 | 7 |
| Vaccination sessions | 2026-08-03 | 2026-08-10 | 5 |
| Vaccination sessions | 2026-08-10 | 2026-08-17 | 3 |
| Vaccination sessions | 2026-08-17 | 2026-08-24 | 3 |
| Vaccination sessions | 2026-08-24 | 2026-08-31 | 6 |
| Vaccination sessions | 2026-08-31 | 2026-09-07 | 5 |
| Vaccination sessions | 2026-09-07 | 2026-09-14 | 4 |
| Vaccination sessions | 2026-09-14 | 2026-09-21 | 6 |
| Vaccination sessions | 2026-09-21 | 2026-09-28 | 5 |
| Vaccination sessions | 2026-09-28 | 2026-10-05 | 5 |
Figure 3. Timeline: change from one week to the next 8
| period | period_end | value | previous | change |
|---|---|---|---|---|
| 2025-10-06 | 2025-10-13 | 43 | 16 | 27 |
| 2025-10-13 | 2025-10-20 | 38 | 43 | -5 |
| 2025-10-20 | 2025-10-27 | 57 | 38 | 19 |
| 2025-10-27 | 2025-11-03 | 43 | 57 | -14 |
| 2025-11-03 | 2025-11-10 | 56 | 43 | 13 |
| 2025-11-10 | 2025-11-17 | 68 | 56 | 12 |
| 2025-11-17 | 2025-11-24 | 78 | 68 | 10 |
| 2025-11-24 | 2025-12-01 | 109 | 78 | 31 |
| 2025-12-01 | 2025-12-08 | 81 | 109 | -28 |
| 2025-12-08 | 2025-12-15 | 73 | 81 | -8 |
| 2025-12-15 | 2025-12-22 | 88 | 73 | 15 |
| 2025-12-22 | 2025-12-29 | 70 | 88 | -18 |
| 2025-12-29 | 2026-01-05 | 92 | 70 | 22 |
| 2026-01-05 | 2026-01-12 | 70 | 92 | -22 |
| 2026-01-12 | 2026-01-19 | 59 | 70 | -11 |
| 2026-01-19 | 2026-01-26 | 50 | 59 | -9 |
| 2026-01-26 | 2026-02-02 | 86 | 50 | 36 |
| 2026-02-02 | 2026-02-09 | 50 | 86 | -36 |
| 2026-02-09 | 2026-02-16 | 40 | 50 | -10 |
| 2026-02-16 | 2026-02-23 | 45 | 40 | 5 |
| 2026-02-23 | 2026-03-02 | 91 | 45 | 46 |
| 2026-03-02 | 2026-03-09 | 48 | 91 | -43 |
| 2026-03-09 | 2026-03-16 | 43 | 48 | -5 |
| 2026-03-16 | 2026-03-23 | 50 | 43 | 7 |
| 2026-03-23 | 2026-03-30 | 53 | 50 | 3 |
| 2026-03-30 | 2026-04-06 | 105 | 53 | 52 |
| 2026-04-06 | 2026-04-13 | 107 | 105 | 2 |
| 2026-04-13 | 2026-04-20 | 116 | 107 | 9 |
| 2026-04-20 | 2026-04-27 | 119 | 116 | 3 |
| 2026-04-27 | 2026-05-04 | 183 | 119 | 64 |
| 2026-05-04 | 2026-05-11 | 190 | 183 | 7 |
| 2026-05-11 | 2026-05-18 | 220 | 190 | 30 |
| 2026-05-18 | 2026-05-25 | 200 | 220 | -20 |
| 2026-05-25 | 2026-06-01 | 146 | 200 | -54 |
| 2026-06-01 | 2026-06-08 | 147 | 146 | 1 |
| 2026-06-08 | 2026-06-15 | 87 | 147 | -60 |
| 2026-06-15 | 2026-06-22 | 98 | 87 | 11 |
| 2026-06-22 | 2026-06-29 | 94 | 98 | -4 |
| 2026-06-29 | 2026-07-06 | 139 | 94 | 45 |
| 2026-07-06 | 2026-07-13 | 96 | 139 | -43 |
| 2026-07-13 | 2026-07-20 | 97 | 96 | 1 |
| 2026-07-20 | 2026-07-27 | 94 | 97 | -3 |
| 2026-07-27 | 2026-08-03 | 125 | 94 | 31 |
| 2026-08-03 | 2026-08-10 | 97 | 125 | -28 |
| 2026-08-10 | 2026-08-17 | 89 | 97 | -8 |
| 2026-08-17 | 2026-08-24 | 84 | 89 | -5 |
| 2026-08-24 | 2026-08-31 | 82 | 84 | -2 |
| 2026-08-31 | 2026-09-07 | 114 | 82 | 32 |
| 2026-09-07 | 2026-09-14 | 93 | 114 | -21 |
| 2026-09-14 | 2026-09-21 | 76 | 93 | -17 |
| 2026-09-21 | 2026-09-28 | 84 | 76 | 8 |
| 2026-09-28 | 2026-10-05 | 62 | 84 | -22 |
Figure 14. Community health worker visits: count per week 53
| period | value |
|---|---|
| 2026-03-30 | 26 |
| 2026-04-06 | 42 |
| 2026-04-13 | 34 |
| 2026-04-20 | 37 |
| 2026-04-27 | 41 |
| 2026-05-04 | 43 |
| 2026-05-11 | 29 |
| 2026-05-18 | 44 |
| 2026-05-25 | 37 |
| 2026-06-01 | 31 |
| 2026-06-08 | 31 |
| 2026-06-15 | 38 |
| 2026-06-22 | 39 |
| 2026-06-29 | 40 |
| 2026-07-06 | 49 |
| 2026-07-13 | 47 |
| 2026-07-20 | 39 |
| 2026-07-27 | 37 |
| 2026-08-03 | 38 |
| 2026-08-10 | 43 |
| 2026-08-17 | 40 |
| 2026-08-24 | 37 |
| 2026-08-31 | 32 |
| 2026-09-07 | 38 |
| 2026-09-14 | 34 |
| 2026-09-21 | 36 |
| 2026-09-28 | 18 |
Figure 15. Community health worker visits: week of 2026-09-21 to week of 2026-09-28 by place 54
| group | period | value |
|---|---|---|
| Canal Side sub-district | week of 2026-09-21 | 5 |
| Canal Side sub-district | week of 2026-09-28 | 1 |
| Fernhill sub-district | week of 2026-09-21 | 6 |
| Fernhill sub-district | week of 2026-09-28 | 2 |
| Eastfield sub-district | week of 2026-09-21 | 5 |
| Eastfield sub-district | week of 2026-09-28 | 3 |
| Foundry Row sub-district | week of 2026-09-21 | 2 |
| Foundry Row sub-district | week of 2026-09-28 | 0 |
| Glenwood sub-district | week of 2026-09-21 | 2 |
| Glenwood sub-district | week of 2026-09-28 | 0 |
| Parkside sub-district | week of 2026-09-21 | 3 |
| Parkside sub-district | week of 2026-09-28 | 1 |
| Riverside sub-district | week of 2026-09-21 | 1 |
| Riverside sub-district | week of 2026-09-28 | 3 |
| Cedar Vale sub-district | week of 2026-09-21 | 1 |
| Cedar Vale sub-district | week of 2026-09-28 | 0 |
| Hawthorn Rise sub-district | week of 2026-09-21 | 1 |
| Hawthorn Rise sub-district | week of 2026-09-28 | 0 |
| Millbrook sub-district | week of 2026-09-21 | 2 |
| Millbrook sub-district | week of 2026-09-28 | 1 |
| Oakwood sub-district | week of 2026-09-21 | 2 |
| Oakwood sub-district | week of 2026-09-28 | 3 |
| Station Quarter sub-district | week of 2026-09-21 | 2 |
| Station Quarter sub-district | week of 2026-09-28 | 1 |
| Westbrook sub-district | week of 2026-09-21 | 1 |
| Westbrook sub-district | week of 2026-09-28 | 0 |
| Market Hill sub-district | week of 2026-09-21 | 3 |
| Market Hill sub-district | week of 2026-09-28 | 3 |
Figure 16. Period change: Community health worker visits (week of 2026-09-21 to week of 2026-09-28) 55
| bin_start | bin_end | count |
|---|---|---|
| -1.633 | -1.106 | 4 |
| -1.106 | -0.5798 | 5 |
| -0.5798 | -0.0532 | 2 |
| -0.0532 | 0.4734 | 2 |
| 0.4734 | 1 | 1 |
Figure 18. Vaccination sessions: count per week 57
| period | value |
|---|---|
| 2026-01-05 | 8 |
| 2026-01-12 | 5 |
| 2026-01-19 | 4 |
| 2026-01-26 | 3 |
| 2026-02-02 | 6 |
| 2026-02-09 | 5 |
| 2026-02-16 | 6 |
| 2026-02-23 | 9 |
| 2026-03-02 | 5 |
| 2026-03-09 | 2 |
| 2026-03-16 | 3 |
| 2026-03-23 | 6 |
| 2026-03-30 | 5 |
| 2026-04-06 | 7 |
| 2026-04-13 | 9 |
| 2026-04-20 | 4 |
| 2026-04-27 | 0 |
| 2026-05-04 | 1 |
| 2026-05-11 | 7 |
| 2026-05-18 | 2 |
| 2026-05-25 | 5 |
| 2026-06-01 | 3 |
| 2026-06-08 | 9 |
| 2026-06-15 | 6 |
| 2026-06-22 | 11 |
| 2026-06-29 | 9 |
| 2026-07-06 | 2 |
| 2026-07-13 | 4 |
| 2026-07-20 | 5 |
| 2026-07-27 | 7 |
| 2026-08-03 | 5 |
| 2026-08-10 | 3 |
| 2026-08-17 | 3 |
| 2026-08-24 | 6 |
| 2026-08-31 | 5 |
| 2026-09-07 | 4 |
| 2026-09-14 | 6 |
| 2026-09-21 | 5 |
| 2026-09-28 | 5 |
Figure 19. Vaccination sessions: week of 2026-06-29 to week of 2026-07-06 by place 58
| group | period | value |
|---|---|---|
| Fernhill sub-district | week of 2026-06-29 | 2 |
| Fernhill sub-district | week of 2026-07-06 | 0 |
| Brickfield sub-district | week of 2026-06-29 | 1 |
| Brickfield sub-district | week of 2026-07-06 | 0 |
| Canal Side sub-district | week of 2026-06-29 | 0 |
| Canal Side sub-district | week of 2026-07-06 | 1 |
| Foundry Row sub-district | week of 2026-06-29 | 0 |
| Foundry Row sub-district | week of 2026-07-06 | 1 |
| Glenwood sub-district | week of 2026-06-29 | 1 |
| Glenwood sub-district | week of 2026-07-06 | 0 |
| Ivy Bank sub-district | week of 2026-06-29 | 1 |
| Ivy Bank sub-district | week of 2026-07-06 | 0 |
| Market Hill sub-district | week of 2026-06-29 | 1 |
| Market Hill sub-district | week of 2026-07-06 | 0 |
| Oakwood sub-district | week of 2026-06-29 | 1 |
| Oakwood sub-district | week of 2026-07-06 | 0 |
| Parkside sub-district | week of 2026-06-29 | 1 |
| Parkside sub-district | week of 2026-07-06 | 0 |
| Station Quarter sub-district | week of 2026-06-29 | 1 |
| Station Quarter sub-district | week of 2026-07-06 | 0 |
Figure 20. Period change: Vaccination sessions (week of 2026-06-29 to week of 2026-07-06) 59
| bin_start | bin_end | count |
|---|---|---|
| -1.414 | -0.9314 | 8 |
| -0.9314 | -0.4485 | 0 |
| -0.4485 | 0.03432 | 0 |
| 0.03432 | 0.5172 | 0 |
| 0.5172 | 1 | 2 |
Figure 22. Cases: count per week 61
| period | value |
|---|---|
| 2025-09-29 | 16 |
| 2025-10-06 | 25 |
| 2025-10-13 | 20 |
| 2025-10-20 | 39 |
| 2025-10-27 | 25 |
| 2025-11-03 | 38 |
| 2025-11-10 | 50 |
| 2025-11-17 | 60 |
| 2025-11-24 | 91 |
| 2025-12-01 | 63 |
| 2025-12-08 | 55 |
| 2025-12-15 | 70 |
| 2025-12-22 | 52 |
| 2025-12-29 | 39 |
| 2026-01-05 | 44 |
| 2026-01-12 | 36 |
| 2026-01-19 | 28 |
| 2026-01-26 | 30 |
| 2026-02-02 | 26 |
| 2026-02-09 | 17 |
| 2026-02-16 | 21 |
| 2026-02-23 | 29 |
| 2026-03-02 | 25 |
| 2026-03-09 | 23 |
| 2026-03-16 | 29 |
| 2026-03-23 | 29 |
| 2026-03-30 | 21 |
| 2026-04-06 | 40 |
| 2026-04-13 | 55 |
| 2026-04-20 | 60 |
| 2026-04-27 | 89 |
| 2026-05-04 | 128 |
| 2026-05-11 | 166 |
| 2026-05-18 | 136 |
| 2026-05-25 | 86 |
| 2026-06-01 | 60 |
| 2026-06-08 | 29 |
| 2026-06-15 | 36 |
| 2026-06-22 | 26 |
| 2026-06-29 | 37 |
| 2026-07-06 | 27 |
| 2026-07-13 | 28 |
| 2026-07-20 | 32 |
| 2026-07-27 | 28 |
| 2026-08-03 | 36 |
| 2026-08-10 | 25 |
| 2026-08-17 | 23 |
| 2026-08-24 | 21 |
| 2026-08-31 | 24 |
| 2026-09-07 | 33 |
| 2026-09-14 | 18 |
| 2026-09-21 | 25 |
| 2026-09-28 | 21 |
Figure 23. Cases: week of 2026-05-18 to week of 2026-05-25 by place 62
| group | period | value |
|---|---|---|
| Parkside sub-district | week of 2026-05-18 | 77 |
| Parkside sub-district | week of 2026-05-25 | 39 |
| Fernhill sub-district | week of 2026-05-18 | 12 |
| Fernhill sub-district | week of 2026-05-25 | 6 |
| Oakwood sub-district | week of 2026-05-18 | 6 |
| Oakwood sub-district | week of 2026-05-25 | 2 |
| Foundry Row sub-district | week of 2026-05-18 | 5 |
| Foundry Row sub-district | week of 2026-05-25 | 8 |
| Hawthorn Rise sub-district | week of 2026-05-18 | 3 |
| Hawthorn Rise sub-district | week of 2026-05-25 | 0 |
| Riverside sub-district | week of 2026-05-18 | 3 |
| Riverside sub-district | week of 2026-05-25 | 0 |
| Station Quarter sub-district | week of 2026-05-18 | 4 |
| Station Quarter sub-district | week of 2026-05-25 | 1 |
| Eastfield sub-district | week of 2026-05-18 | 6 |
| Eastfield sub-district | week of 2026-05-25 | 8 |
| Market Hill sub-district | week of 2026-05-18 | 4 |
| Market Hill sub-district | week of 2026-05-25 | 6 |
| Ashby Green sub-district | week of 2026-05-18 | 1 |
| Ashby Green sub-district | week of 2026-05-25 | 2 |
| Brickfield sub-district | week of 2026-05-18 | 1 |
| Brickfield sub-district | week of 2026-05-25 | 0 |
| Elmstead sub-district | week of 2026-05-18 | 1 |
| Elmstead sub-district | week of 2026-05-25 | 2 |
| Ivy Bank sub-district | week of 2026-05-18 | 1 |
| Ivy Bank sub-district | week of 2026-05-25 | 0 |
| Millbrook sub-district | week of 2026-05-18 | 2 |
| Millbrook sub-district | week of 2026-05-25 | 3 |
| Westbrook sub-district | week of 2026-05-18 | 3 |
| Westbrook sub-district | week of 2026-05-25 | 2 |
Figure 24. Period change: Cases (week of 2026-05-18 to week of 2026-05-25) 63
| bin_start | bin_end | count |
|---|---|---|
| -3.528 | -2.801 | 1 |
| -2.801 | -2.075 | 0 |
| -2.075 | -1.348 | 4 |
| -1.348 | -0.6213 | 3 |
| -0.6213 | 0.1054 | 4 |
| 0.1054 | 0.8321 | 6 |
Figure 32. Change beside the counts per health sub-district 91
| bin_start | bin_end | count |
|---|---|---|
| -3.528 | -2.801 | 1 |
| -2.801 | -2.075 | 0 |
| -2.075 | -1.348 | 4 |
| -1.348 | -0.6213 | 3 |
| -0.6213 | 0.1054 | 4 |
| 0.1054 | 0.8321 | 6 |
Figure 34. Change of vaccination sessions where density is high 96
| bin_start | bin_end | count |
|---|---|---|
| -1.414 | -0.9314 | 8 |
| -0.9314 | -0.4485 | 0 |
| -0.4485 | 0.03432 | 0 |
| 0.03432 | 0.5172 | 0 |
| 0.5172 | 1 | 2 |
Figure 36. Hot cells of cases per health sub-district 101
| bin_start | bin_end | count |
|---|---|---|
| 73 | 120.5 | 9 |
| 120.5 | 168 | 5 |
| 168 | 215.5 | 2 |
| 215.5 | 263 | 1 |
| 263 | 310.5 | 0 |
| 310.5 | 358 | 1 |
Figure 38. Nearest outbreak response team to each cluster of cases 107
| rank | name |
|---|---|
| 1 | Rapid response team 1 |
Figure 39. Dense areas of community health worker visits 112
| bin_start | bin_end | count |
|---|---|---|
| 0 | 0.8 | 1 |
| 0.8 | 1.6 | 1 |
| 1.6 | 2.4 | 1 |
| 2.4 | 3.2 | 1 |
| 3.2 | 4 | 1 |
Figure 41. Change of vaccination sessions per health sub-district 116
| bin_start | bin_end | count |
|---|---|---|
| 0 | 0.1667 | 8 |
| 0.1667 | 0.3333 | 0 |
| 0.3333 | 0.5 | 0 |
| 0.5 | 0.6667 | 0 |
| 0.6667 | 0.8333 | 0 |
| 0.8333 | 1 | 10 |
Figure 43. Outbreak response teams within 250 m of each cluster of cases 121
| cluster | features | fraction | share |
|---|---|---|---|
| 0 | 1 | 1 | 100.0% |
Figure 44. Density of community health worker visits and cases together 126
| bin_start | bin_end | count |
|---|---|---|
| 0 | 3.786 | 295 |
| 3.786 | 7.571 | 385 |
| 7.571 | 11.36 | 389 |
| 11.36 | 15.14 | 384 |
| 15.14 | 18.93 | 284 |
| 18.93 | 22.71 | 378 |
| 22.71 | 26.5 | 380 |
| 26.5 | 30.29 | 383 |
| 30.29 | 34.07 | 381 |
| 34.07 | 37.86 | 279 |
| 37.86 | 41.64 | 378 |
| 41.64 | 45.43 | 382 |
| 45.43 | 49.21 | 375 |
| 49.21 | 53 | 287 |
Figure 46. Cases over time (onset_date) 128
| period | series | value |
|---|---|---|
| 2025-09-29 | malaria | 13 |
| 2025-09-29 | cholera | 0 |
| 2025-09-29 | typhoid | 3 |
| 2025-10-06 | malaria | 23 |
| 2025-10-06 | cholera | 0 |
| 2025-10-06 | typhoid | 2 |
| 2025-10-13 | malaria | 19 |
| 2025-10-13 | cholera | 0 |
| 2025-10-13 | typhoid | 1 |
| 2025-10-20 | malaria | 35 |
| 2025-10-20 | cholera | 0 |
| 2025-10-20 | typhoid | 4 |
| 2025-10-27 | malaria | 20 |
| 2025-10-27 | cholera | 0 |
| 2025-10-27 | typhoid | 5 |
| 2025-11-03 | malaria | 34 |
| 2025-11-03 | cholera | 0 |
| 2025-11-03 | typhoid | 4 |
| 2025-11-10 | malaria | 46 |
| 2025-11-10 | cholera | 0 |
| 2025-11-10 | typhoid | 4 |
| 2025-11-17 | malaria | 59 |
| 2025-11-17 | cholera | 0 |
| 2025-11-17 | typhoid | 1 |
| 2025-11-24 | malaria | 87 |
| 2025-11-24 | cholera | 0 |
| 2025-11-24 | typhoid | 4 |
| 2025-12-01 | malaria | 57 |
| 2025-12-01 | cholera | 0 |
| 2025-12-01 | typhoid | 6 |
| 2025-12-08 | malaria | 50 |
| 2025-12-08 | cholera | 0 |
| 2025-12-08 | typhoid | 5 |
| 2025-12-15 | malaria | 66 |
| 2025-12-15 | cholera | 0 |
| 2025-12-15 | typhoid | 4 |
| 2025-12-22 | malaria | 46 |
| 2025-12-22 | cholera | 0 |
| 2025-12-22 | typhoid | 6 |
| 2025-12-29 | malaria | 33 |
| 2025-12-29 | cholera | 0 |
| 2025-12-29 | typhoid | 6 |
| 2026-01-05 | malaria | 38 |
| 2026-01-05 | cholera | 0 |
| 2026-01-05 | typhoid | 6 |
| 2026-01-12 | malaria | 32 |
| 2026-01-12 | cholera | 0 |
| 2026-01-12 | typhoid | 4 |
| 2026-01-19 | malaria | 23 |
| 2026-01-19 | cholera | 0 |
| 2026-01-19 | typhoid | 5 |
| 2026-01-26 | malaria | 24 |
| 2026-01-26 | cholera | 0 |
| 2026-01-26 | typhoid | 6 |
| 2026-02-02 | malaria | 23 |
| 2026-02-02 | cholera | 0 |
| 2026-02-02 | typhoid | 3 |
| 2026-02-09 | malaria | 11 |
| 2026-02-09 | cholera | 0 |
| 2026-02-09 | typhoid | 6 |
| 2026-02-16 | malaria | 18 |
| 2026-02-16 | cholera | 0 |
| 2026-02-16 | typhoid | 3 |
| 2026-02-23 | malaria | 24 |
| 2026-02-23 | cholera | 0 |
| 2026-02-23 | typhoid | 5 |
| 2026-03-02 | malaria | 19 |
| 2026-03-02 | cholera | 0 |
| 2026-03-02 | typhoid | 6 |
| 2026-03-09 | malaria | 17 |
| 2026-03-09 | cholera | 0 |
| 2026-03-09 | typhoid | 6 |
| 2026-03-16 | malaria | 25 |
| 2026-03-16 | cholera | 0 |
| 2026-03-16 | typhoid | 4 |
| 2026-03-23 | malaria | 25 |
| 2026-03-23 | cholera | 0 |
| 2026-03-23 | typhoid | 4 |
| 2026-03-30 | malaria | 18 |
| 2026-03-30 | cholera | 0 |
| 2026-03-30 | typhoid | 3 |
| 2026-04-06 | malaria | 36 |
| 2026-04-06 | cholera | 0 |
| 2026-04-06 | typhoid | 4 |
| 2026-04-13 | malaria | 44 |
| 2026-04-13 | cholera | 0 |
| 2026-04-13 | typhoid | 11 |
| 2026-04-20 | malaria | 51 |
| 2026-04-20 | cholera | 1 |
| 2026-04-20 | typhoid | 8 |
| 2026-04-27 | malaria | 58 |
| 2026-04-27 | cholera | 25 |
| 2026-04-27 | typhoid | 6 |
| 2026-05-04 | malaria | 60 |
| 2026-05-04 | cholera | 63 |
| 2026-05-04 | typhoid | 5 |
| 2026-05-11 | malaria | 55 |
| 2026-05-11 | cholera | 109 |
| 2026-05-11 | typhoid | 2 |
| 2026-05-18 | malaria | 52 |
| 2026-05-18 | cholera | 77 |
| 2026-05-18 | typhoid | 7 |
| 2026-05-25 | malaria | 45 |
| 2026-05-25 | cholera | 37 |
| 2026-05-25 | typhoid | 4 |
| 2026-06-01 | malaria | 43 |
| 2026-06-01 | cholera | 14 |
| 2026-06-01 | typhoid | 3 |
| 2026-06-08 | malaria | 21 |
| 2026-06-08 | cholera | 4 |
| 2026-06-08 | typhoid | 4 |
| 2026-06-15 | malaria | 28 |
| 2026-06-15 | cholera | 0 |
| 2026-06-15 | typhoid | 8 |
| 2026-06-22 | malaria | 20 |
| 2026-06-22 | cholera | 0 |
| 2026-06-22 | typhoid | 6 |
| 2026-06-29 | malaria | 24 |
| 2026-06-29 | cholera | 0 |
| 2026-06-29 | typhoid | 13 |
| 2026-07-06 | malaria | 22 |
| 2026-07-06 | cholera | 0 |
| 2026-07-06 | typhoid | 5 |
| 2026-07-13 | malaria | 23 |
| 2026-07-13 | cholera | 0 |
| 2026-07-13 | typhoid | 5 |
| 2026-07-20 | malaria | 28 |
| 2026-07-20 | cholera | 0 |
| 2026-07-20 | typhoid | 4 |
| 2026-07-27 | malaria | 21 |
| 2026-07-27 | cholera | 0 |
| 2026-07-27 | typhoid | 7 |
| 2026-08-03 | malaria | 31 |
| 2026-08-03 | cholera | 0 |
| 2026-08-03 | typhoid | 5 |
| 2026-08-10 | malaria | 22 |
| 2026-08-10 | cholera | 0 |
| 2026-08-10 | typhoid | 3 |
| 2026-08-17 | malaria | 18 |
| 2026-08-17 | cholera | 0 |
| 2026-08-17 | typhoid | 5 |
| 2026-08-24 | malaria | 15 |
| 2026-08-24 | cholera | 0 |
| 2026-08-24 | typhoid | 6 |
| 2026-08-31 | malaria | 21 |
| 2026-08-31 | cholera | 0 |
| 2026-08-31 | typhoid | 3 |
| 2026-09-07 | malaria | 25 |
| 2026-09-07 | cholera | 0 |
| 2026-09-07 | typhoid | 8 |
| 2026-09-14 | malaria | 15 |
| 2026-09-14 | cholera | 0 |
| 2026-09-14 | typhoid | 3 |
| 2026-09-21 | malaria | 19 |
| 2026-09-21 | cholera | 0 |
| 2026-09-21 | typhoid | 6 |
| 2026-09-28 | malaria | 18 |
| 2026-09-28 | cholera | 0 |
| 2026-09-28 | typhoid | 3 |
Figure 47. Clinic stock by month over time (month) 129
| period | value |
|---|---|
| 2025-12-29 | 35 |
| 2026-01-05 | 0 |
| 2026-01-12 | 0 |
| 2026-01-19 | 0 |
| 2026-01-26 | 35 |
| 2026-02-02 | 0 |
| 2026-02-09 | 0 |
| 2026-02-16 | 0 |
| 2026-02-23 | 35 |
| 2026-03-02 | 0 |
| 2026-03-09 | 0 |
| 2026-03-16 | 0 |
| 2026-03-23 | 0 |
| 2026-03-30 | 35 |
| 2026-04-06 | 0 |
| 2026-04-13 | 0 |
| 2026-04-20 | 0 |
| 2026-04-27 | 35 |
| 2026-05-04 | 0 |
| 2026-05-11 | 0 |
| 2026-05-18 | 0 |
| 2026-05-25 | 0 |
| 2026-06-01 | 35 |
| 2026-06-08 | 0 |
| 2026-06-15 | 0 |
| 2026-06-22 | 0 |
| 2026-06-29 | 35 |
| 2026-07-06 | 0 |
| 2026-07-13 | 0 |
| 2026-07-20 | 0 |
| 2026-07-27 | 35 |
| 2026-08-03 | 0 |
| 2026-08-10 | 0 |
| 2026-08-17 | 0 |
| 2026-08-24 | 0 |
| 2026-08-31 | 35 |
Figure 48. Emerging hot spots: Community health worker visits 130
| bin_start | bin_end | count |
|---|---|---|
| -1.156 | -0.4926 | 60 |
| -0.4926 | 0.1708 | 26 |
| 0.1708 | 0.8341 | 18 |
| 0.8341 | 1.498 | 10 |
| 1.498 | 2.161 | 4 |
| 2.161 | 2.824 | 5 |
| 2.824 | 3.488 | 0 |
| 3.488 | 4.151 | 1 |
Figure 49. Emerging hot spots: Vaccination sessions 131
| bin_start | bin_end | count |
|---|---|---|
| -0.832 | -0.3452 | 3 |
| -0.3452 | 0.1417 | 0 |
| 0.1417 | 0.6285 | 11 |
| 0.6285 | 1.115 | 6 |
| 1.115 | 1.602 | 0 |
| 1.602 | 2.089 | 4 |
Figure 50. Emerging hot spots: Cases 132
| bin_start | bin_end | count |
|---|---|---|
| -0.628 | -0.4474 | 32 |
| -0.4474 | -0.2667 | 48 |
| -0.2667 | -0.08612 | 0 |
| -0.08612 | 0.0945 | 0 |
| 0.0945 | 0.2751 | 23 |
| 0.2751 | 0.4557 | 0 |
| 0.4557 | 0.6364 | 15 |
| 0.6364 | 0.817 | 7 |
Figure 51. Hot spot analysis: Community health worker visits 133
| bin_start | bin_end | band | band_label | count |
|---|---|---|---|---|
| -3.5 | -3 | cold_99 | Cold spot, 99% confidence | 1 |
| -3 | -2.5 | cold_95 | Cold spot, 95% confidence | 3 |
| -3 | -2.5 | cold_99 | Cold spot, 99% confidence | 6 |
| -2.5 | -2 | cold_95 | Cold spot, 95% confidence | 7 |
| -2 | -1.5 | cold_90 | Cold spot, 90% confidence | 14 |
| -2 | -1.5 | cold_95 | Cold spot, 95% confidence | 4 |
| -2 | -1.5 | not_significant | Not significant | 12 |
| -1.5 | -1 | not_significant | Not significant | 31 |
| -1 | -0.5 | not_significant | Not significant | 48 |
| -0.5 | 0 | not_significant | Not significant | 59 |
| 0 | 0.5 | not_significant | Not significant | 57 |
| 0.5 | 1 | not_significant | Not significant | 52 |
| 1 | 1.5 | not_significant | Not significant | 40 |
| 1.5 | 2 | hot_90 | Hot spot, 90% confidence | 15 |
| 1.5 | 2 | not_significant | Not significant | 3 |
| 2 | 2.5 | hot_95 | Hot spot, 95% confidence | 15 |
| 2.5 | 3 | hot_99 | Hot spot, 99% confidence | 7 |
| 3 | 3.5 | hot_99 | Hot spot, 99% confidence | 8 |
| 3.5 | 4 | hot_99 | Hot spot, 99% confidence | 5 |
| 4 | 4.5 | hot_99 | Hot spot, 99% confidence | 2 |
| 4.5 | 5 | hot_99 | Hot spot, 99% confidence | 1 |
Figure 52. Hot spot analysis: Cases 134
| bin_start | bin_end | band | band_label | count |
|---|---|---|---|---|
| -3 | -2.5 | cold_99 | Cold spot, 99% confidence | 1 |
| -2.5 | -2 | cold_95 | Cold spot, 95% confidence | 31 |
| -2 | -1.5 | cold_90 | Cold spot, 90% confidence | 88 |
| -2 | -1.5 | cold_95 | Cold spot, 95% confidence | 17 |
| -2 | -1.5 | not_significant | Not significant | 17 |
| -1.5 | -1 | not_significant | Not significant | 401 |
| -1 | -0.5 | not_significant | Not significant | 509 |
| -0.5 | 0 | not_significant | Not significant | 472 |
| 0 | 0.5 | not_significant | Not significant | 351 |
| 0.5 | 1 | not_significant | Not significant | 177 |
| 1 | 1.5 | not_significant | Not significant | 75 |
| 1.5 | 2 | hot_90 | Hot spot, 90% confidence | 12 |
| 1.5 | 2 | not_significant | Not significant | 11 |
| 2 | 2.5 | hot_95 | Hot spot, 95% confidence | 7 |
| 2.5 | 3 | hot_95 | Hot spot, 95% confidence | 2 |
| 2.5 | 3 | hot_99 | Hot spot, 99% confidence | 2 |
| 3 | 3.5 | hot_99 | Hot spot, 99% confidence | 2 |
| 3.5 | 4 | hot_99 | Hot spot, 99% confidence | 9 |
| 4 | 4.5 | hot_99 | Hot spot, 99% confidence | 8 |
| 4.5 | 5 | hot_99 | Hot spot, 99% confidence | 2 |
| 5 | 5.5 | hot_99 | Hot spot, 99% confidence | 3 |
| 5.5 | 6 | hot_99 | Hot spot, 99% confidence | 4 |
| 6 | 6.5 | hot_99 | Hot spot, 99% confidence | 3 |
| 6.5 | 7 | hot_99 | Hot spot, 99% confidence | 2 |
| 7 | 7.5 | hot_99 | Hot spot, 99% confidence | 3 |
| 7.5 | 8 | hot_99 | Hot spot, 99% confidence | 1 |
| 8 | 8.5 | hot_99 | Hot spot, 99% confidence | 4 |
| 8.5 | 9 | hot_99 | Hot spot, 99% confidence | 2 |
| 9 | 9.5 | hot_99 | Hot spot, 99% confidence | 4 |
| 9.5 | 10 | hot_99 | Hot spot, 99% confidence | 2 |
| 10 | 10.5 | hot_99 | Hot spot, 99% confidence | 3 |
| 10.5 | 11 | hot_99 | Hot spot, 99% confidence | 2 |
| 11 | 11.5 | hot_99 | Hot spot, 99% confidence | 1 |
| 12 | 12.5 | hot_99 | Hot spot, 99% confidence | 2 |
| 13 | 13.5 | hot_99 | Hot spot, 99% confidence | 1 |
| 13.5 | 14 | hot_99 | Hot spot, 99% confidence | 1 |
| 14 | 14.5 | hot_99 | Hot spot, 99% confidence | 3 |
| 14.5 | 15 | hot_99 | Hot spot, 99% confidence | 1 |
| 15 | 15.5 | hot_99 | Hot spot, 99% confidence | 1 |
| 15.5 | 16 | hot_99 | Hot spot, 99% confidence | 1 |
| 16 | 16.5 | hot_99 | Hot spot, 99% confidence | 2 |
| 17 | 17.5 | hot_99 | Hot spot, 99% confidence | 2 |
| 18 | 18.5 | hot_99 | Hot spot, 99% confidence | 2 |
| 18.5 | 19 | hot_99 | Hot spot, 99% confidence | 1 |
| 19 | 19.5 | hot_99 | Hot spot, 99% confidence | 1 |
| 19.5 | 20 | hot_99 | Hot spot, 99% confidence | 1 |
| 20 | 20.5 | hot_99 | Hot spot, 99% confidence | 2 |
| 22.5 | 23 | hot_99 | Hot spot, 99% confidence | 4 |
| 23 | 23.5 | hot_99 | Hot spot, 99% confidence | 1 |
| 24 | 24.5 | hot_99 | Hot spot, 99% confidence | 2 |
| 24.5 | 25 | hot_99 | Hot spot, 99% confidence | 1 |
| 25.5 | 26 | hot_99 | Hot spot, 99% confidence | 1 |
| 26 | 26.5 | hot_99 | Hot spot, 99% confidence | 1 |
Figure 53. Hot spot analysis: Vaccination sessions 135
| bin_start | bin_end | band | band_label | count |
|---|---|---|---|---|
| -2.5 | -2 | cold_95 | Cold spot, 95% confidence | 1 |
| -2 | -1.5 | cold_90 | Cold spot, 90% confidence | 4 |
| -1.5 | -1 | not_significant | Not significant | 15 |
| -1 | -0.5 | not_significant | Not significant | 22 |
| -0.5 | 0 | not_significant | Not significant | 20 |
| 0 | 0.5 | not_significant | Not significant | 8 |
| 0.5 | 1 | not_significant | Not significant | 8 |
| 1 | 1.5 | not_significant | Not significant | 3 |
| 1.5 | 2 | hot_90 | Hot spot, 90% confidence | 6 |
| 2.5 | 3 | hot_99 | Hot spot, 99% confidence | 2 |
| 3 | 3.5 | hot_99 | Hot spot, 99% confidence | 4 |
| 3.5 | 4 | hot_99 | Hot spot, 99% confidence | 3 |
| 5 | 5.5 | hot_99 | Hot spot, 99% confidence | 2 |
| 5.5 | 6 | hot_99 | Hot spot, 99% confidence | 1 |
Figure 54. Summarize within: Health sub-districts 136
| bin_start | bin_end | count |
|---|---|---|
| 14 | 36.67 | 7 |
| 36.67 | 59.33 | 3 |
| 59.33 | 82 | 6 |
| 82 | 104.7 | 1 |
| 104.7 | 127.3 | 0 |
| 127.3 | 150 | 1 |
Figure 55. Summarize within: Health sub-districts 137
| bin_start | bin_end | count |
|---|---|---|
| 3 | 7.833 | 8 |
| 7.833 | 12.67 | 5 |
| 12.67 | 17.5 | 1 |
| 17.5 | 22.33 | 2 |
| 22.33 | 27.17 | 1 |
| 27.17 | 32 | 1 |
Figure 56. Summarize within: Health sub-districts 138
| bin_start | bin_end | count |
|---|---|---|
| 33 | 113 | 10 |
| 113 | 193 | 6 |
| 193 | 273 | 0 |
| 273 | 353 | 1 |
| 353 | 433 | 0 |
| 433 | 513 | 1 |
Figure 57. Calculate density: Community health worker visits 139
| bin_start | bin_end | count |
|---|---|---|
| 0 | 4.077 | 198 |
| 4.077 | 8.154 | 193 |
| 8.154 | 12.23 | 192 |
| 12.23 | 16.31 | 191 |
| 16.31 | 20.38 | 188 |
| 20.38 | 24.46 | 186 |
| 24.46 | 28.54 | 190 |
| 28.54 | 32.62 | 193 |
| 32.62 | 36.69 | 187 |
| 36.69 | 40.77 | 189 |
| 40.77 | 44.85 | 189 |
| 44.85 | 48.92 | 187 |
| 48.92 | 53 | 169 |
Figure 58. Calculate density: Cases 140
| bin_start | bin_end | count |
|---|---|---|
| 0 | 4.077 | 193 |
| 4.077 | 8.154 | 194 |
| 8.154 | 12.23 | 196 |
| 12.23 | 16.31 | 190 |
| 16.31 | 20.38 | 192 |
| 20.38 | 24.46 | 189 |
| 24.46 | 28.54 | 194 |
| 28.54 | 32.62 | 192 |
| 32.62 | 36.69 | 187 |
| 36.69 | 40.77 | 187 |
| 40.77 | 44.85 | 192 |
| 44.85 | 48.92 | 190 |
| 48.92 | 53 | 212 |
Figure 59. Calculate density: Vaccination sessions 141
| bin_start | bin_end | count |
|---|---|---|
| 0 | 2.455 | 49 |
| 2.455 | 4.909 | 47 |
| 4.909 | 7.364 | 71 |
| 7.364 | 9.818 | 46 |
| 9.818 | 12.27 | 72 |
| 12.27 | 14.73 | 49 |
| 14.73 | 17.18 | 73 |
| 17.18 | 19.64 | 48 |
| 19.64 | 22.09 | 75 |
| 22.09 | 24.55 | 46 |
| 24.55 | 27 | 40 |
Figure 60. Find point clusters: Cases 142
| cluster | features | fraction | share |
|---|---|---|---|
| Noise | 1,961 | 0.8563 | 85.6% |
| 0 | 329 | 0.1437 | 14.4% |
Figure 61. Find point clusters: cluster hulls 143
| cluster | features | fraction | share |
|---|---|---|---|
| 0 | 1 | 1 | 100.0% |
Figure 62. Find outliers: Health sub-districts 144
| value | lag | type |
|---|---|---|
| 1.279 | -0.6096 | NS |
| -0.322 | -0.1926 | NS |
| 0.3843 | -0.2891 | NS |
| -0.4745 | -0.8491 | NS |
| -0.3255 | 1.301 | NS |
| -0.1949 | 0.5765 | NS |
| 1.301 | -0.2602 | NS |
| -0.8491 | -0.7215 | NS |
| -0.7074 | -0.9158 | NS |
| -0.2891 | 0.3834 | NS |
| 0.7505 | -0.2687 | NS |
| 0.0154 | -0.3876 | NS |
| -0.9826 | -0.6102 | NS |
| -0.5515 | -0.4775 | NS |
| 3.066 | -0.8691 | NS |
| -0.6096 | 1.279 | NS |
| -0.8691 | 3.066 | NS |
| -0.6209 | -0.7671 | NS |
Figure 63. Find point clusters: Cases over time 145
| period | series | value |
|---|---|---|
| 2025-09-29 | F | 8 |
| 2025-09-29 | M | 8 |
| 2025-10-06 | F | 8 |
| 2025-10-06 | M | 17 |
| 2025-10-13 | F | 16 |
| 2025-10-13 | M | 4 |
| 2025-10-20 | F | 19 |
| 2025-10-20 | M | 20 |
| 2025-10-27 | F | 13 |
| 2025-10-27 | M | 12 |
| 2025-11-03 | F | 17 |
| 2025-11-03 | M | 21 |
| 2025-11-10 | F | 23 |
| 2025-11-10 | M | 27 |
| 2025-11-17 | F | 37 |
| 2025-11-17 | M | 23 |
| 2025-11-24 | F | 43 |
| 2025-11-24 | M | 48 |
| 2025-12-01 | F | 25 |
| 2025-12-01 | M | 38 |
| 2025-12-08 | F | 30 |
| 2025-12-08 | M | 25 |
| 2025-12-15 | F | 35 |
| 2025-12-15 | M | 35 |
| 2025-12-22 | F | 23 |
| 2025-12-22 | M | 29 |
| 2025-12-29 | F | 25 |
| 2025-12-29 | M | 14 |
| 2026-01-05 | F | 25 |
| 2026-01-05 | M | 19 |
| 2026-01-12 | F | 16 |
| 2026-01-12 | M | 20 |
| 2026-01-19 | F | 12 |
| 2026-01-19 | M | 16 |
| 2026-01-26 | F | 14 |
| 2026-01-26 | M | 16 |
| 2026-02-02 | F | 11 |
| 2026-02-02 | M | 15 |
| 2026-02-09 | F | 8 |
| 2026-02-09 | M | 9 |
| 2026-02-16 | F | 13 |
| 2026-02-16 | M | 8 |
| 2026-02-23 | F | 15 |
| 2026-02-23 | M | 14 |
| 2026-03-02 | F | 13 |
| 2026-03-02 | M | 12 |
| 2026-03-09 | F | 15 |
| 2026-03-09 | M | 8 |
| 2026-03-16 | F | 17 |
| 2026-03-16 | M | 12 |
| 2026-03-23 | F | 12 |
| 2026-03-23 | M | 17 |
| 2026-03-30 | F | 9 |
| 2026-03-30 | M | 12 |
| 2026-04-06 | F | 26 |
| 2026-04-06 | M | 14 |
| 2026-04-13 | F | 26 |
| 2026-04-13 | M | 29 |
| 2026-04-20 | F | 36 |
| 2026-04-20 | M | 24 |
| 2026-04-27 | F | 50 |
| 2026-04-27 | M | 39 |
| 2026-05-04 | F | 65 |
| 2026-05-04 | M | 63 |
| 2026-05-11 | F | 86 |
| 2026-05-11 | M | 80 |
| 2026-05-18 | F | 75 |
| 2026-05-18 | M | 61 |
| 2026-05-25 | F | 41 |
| 2026-05-25 | M | 45 |
| 2026-06-01 | F | 29 |
| 2026-06-01 | M | 31 |
| 2026-06-08 | F | 13 |
| 2026-06-08 | M | 16 |
| 2026-06-15 | F | 19 |
| 2026-06-15 | M | 17 |
| 2026-06-22 | F | 11 |
| 2026-06-22 | M | 15 |
| 2026-06-29 | F | 25 |
| 2026-06-29 | M | 12 |
| 2026-07-06 | F | 14 |
| 2026-07-06 | M | 13 |
| 2026-07-13 | F | 9 |
| 2026-07-13 | M | 19 |
| 2026-07-20 | F | 19 |
| 2026-07-20 | M | 13 |
| 2026-07-27 | F | 11 |
| 2026-07-27 | M | 17 |
| 2026-08-03 | F | 15 |
| 2026-08-03 | M | 21 |
| 2026-08-10 | F | 12 |
| 2026-08-10 | M | 13 |
| 2026-08-17 | F | 10 |
| 2026-08-17 | M | 13 |
| 2026-08-24 | F | 5 |
| 2026-08-24 | M | 16 |
| 2026-08-31 | F | 14 |
| 2026-08-31 | M | 10 |
| 2026-09-07 | F | 21 |
| 2026-09-07 | M | 12 |
| 2026-09-14 | F | 6 |
| 2026-09-14 | M | 12 |
| 2026-09-21 | F | 9 |
| 2026-09-21 | M | 16 |
| 2026-09-28 | F | 5 |
| 2026-09-28 | M | 16 |
Figure 64. Find point clusters: Community health worker visits over time 146
| period | series | value |
|---|---|---|
| 2026-03-30 | bed net check | 6 |
| 2026-03-30 | referral | 6 |
| 2026-03-30 | case follow-up | 8 |
| 2026-03-30 | health education | 6 |
| 2026-04-06 | bed net check | 11 |
| 2026-04-06 | referral | 9 |
| 2026-04-06 | case follow-up | 10 |
| 2026-04-06 | health education | 12 |
| 2026-04-13 | bed net check | 6 |
| 2026-04-13 | referral | 8 |
| 2026-04-13 | case follow-up | 11 |
| 2026-04-13 | health education | 9 |
| 2026-04-20 | bed net check | 7 |
| 2026-04-20 | referral | 9 |
| 2026-04-20 | case follow-up | 10 |
| 2026-04-20 | health education | 11 |
| 2026-04-27 | bed net check | 11 |
| 2026-04-27 | referral | 12 |
| 2026-04-27 | case follow-up | 9 |
| 2026-04-27 | health education | 9 |
| 2026-05-04 | bed net check | 16 |
| 2026-05-04 | referral | 11 |
| 2026-05-04 | case follow-up | 7 |
| 2026-05-04 | health education | 9 |
| 2026-05-11 | bed net check | 7 |
| 2026-05-11 | referral | 9 |
| 2026-05-11 | case follow-up | 6 |
| 2026-05-11 | health education | 7 |
| 2026-05-18 | bed net check | 7 |
| 2026-05-18 | referral | 13 |
| 2026-05-18 | case follow-up | 8 |
| 2026-05-18 | health education | 16 |
| 2026-05-25 | bed net check | 7 |
| 2026-05-25 | referral | 10 |
| 2026-05-25 | case follow-up | 14 |
| 2026-05-25 | health education | 6 |
| 2026-06-01 | bed net check | 8 |
| 2026-06-01 | referral | 6 |
| 2026-06-01 | case follow-up | 11 |
| 2026-06-01 | health education | 6 |
| 2026-06-08 | bed net check | 8 |
| 2026-06-08 | referral | 9 |
| 2026-06-08 | case follow-up | 7 |
| 2026-06-08 | health education | 7 |
| 2026-06-15 | bed net check | 10 |
| 2026-06-15 | referral | 10 |
| 2026-06-15 | case follow-up | 10 |
| 2026-06-15 | health education | 8 |
| 2026-06-22 | bed net check | 13 |
| 2026-06-22 | referral | 11 |
| 2026-06-22 | case follow-up | 4 |
| 2026-06-22 | health education | 11 |
| 2026-06-29 | bed net check | 6 |
| 2026-06-29 | referral | 14 |
| 2026-06-29 | case follow-up | 9 |
| 2026-06-29 | health education | 11 |
| 2026-07-06 | bed net check | 14 |
| 2026-07-06 | referral | 12 |
| 2026-07-06 | case follow-up | 15 |
| 2026-07-06 | health education | 8 |
| 2026-07-13 | bed net check | 15 |
| 2026-07-13 | referral | 9 |
| 2026-07-13 | case follow-up | 9 |
| 2026-07-13 | health education | 14 |
| 2026-07-20 | bed net check | 9 |
| 2026-07-20 | referral | 11 |
| 2026-07-20 | case follow-up | 4 |
| 2026-07-20 | health education | 15 |
| 2026-07-27 | bed net check | 16 |
| 2026-07-27 | referral | 9 |
| 2026-07-27 | case follow-up | 4 |
| 2026-07-27 | health education | 8 |
| 2026-08-03 | bed net check | 11 |
| 2026-08-03 | referral | 10 |
| 2026-08-03 | case follow-up | 7 |
| 2026-08-03 | health education | 10 |
| 2026-08-10 | bed net check | 9 |
| 2026-08-10 | referral | 13 |
| 2026-08-10 | case follow-up | 14 |
| 2026-08-10 | health education | 7 |
| 2026-08-17 | bed net check | 7 |
| 2026-08-17 | referral | 12 |
| 2026-08-17 | case follow-up | 9 |
| 2026-08-17 | health education | 12 |
| 2026-08-24 | bed net check | 8 |
| 2026-08-24 | referral | 8 |
| 2026-08-24 | case follow-up | 13 |
| 2026-08-24 | health education | 8 |
| 2026-08-31 | bed net check | 10 |
| 2026-08-31 | referral | 6 |
| 2026-08-31 | case follow-up | 9 |
| 2026-08-31 | health education | 7 |
| 2026-09-07 | bed net check | 10 |
| 2026-09-07 | referral | 10 |
| 2026-09-07 | case follow-up | 7 |
| 2026-09-07 | health education | 11 |
| 2026-09-14 | bed net check | 11 |
| 2026-09-14 | referral | 7 |
| 2026-09-14 | case follow-up | 10 |
| 2026-09-14 | health education | 6 |
| 2026-09-21 | bed net check | 9 |
| 2026-09-21 | referral | 7 |
| 2026-09-21 | case follow-up | 14 |
| 2026-09-21 | health education | 6 |
| 2026-09-28 | bed net check | 5 |
| 2026-09-28 | referral | 5 |
| 2026-09-28 | case follow-up | 5 |
| 2026-09-28 | health education | 3 |
GeoBit Large Spatial Model. Findings are labeled Evidenced (computed by a tool), Inferred (a reading or reasoning) or Unverified (no evidence yet).