Sample: Conservation, Okavango Delta near Maun: report
Project: Sample: Conservation, Okavango Delta near Maun
Goal: Describe the project Sample: Conservation, Okavango Delta near Maun: run the analyses that tell the most about its data, draw every result, and write a cited report.
Run: 02856b25-6165-4e7c-bf67-eecb1dfb06b6 (running, 12 agent run(s))
Generated: 2026-10-18T05:10:01Z, version 1
Model cost: USD 0.0000 over 4 model call(s)
Data used
| Data | Kind | Rows | Time span | Summary | Source |
|---|---|---|---|---|---|
| Protected areas | vector, Polygon | 5 | 5 polygon (area) features; 'area_km2' 2.5 to 42 (mean 24.5); 'established' 1,963 to 2,019 (mean 2003); named by 'name' (e.g. Northern wildlife concession, Delta game reserve, Community trust area); total area 122.5 km2; extent 23.2921,-19.8459 to 23.4079,-19.7541. Areas (Protected areas) with area_km2 to compare and map. | 105 | |
| Wildlife sightings | vector, Point | 2,000 | 2020-01-03 to 2025-12-30 | 2,000 point features; dated by 'observed_at' from 2020-01-03 to 2025-12-30; 'species' has 9 values (top: elephant 570, buffalo 310, giraffe 232); 'observer' has 4 values (top: researcher 525, ranger 512, guide 498); 'count' 1 to 47 (mean 10.29); extent 23.2929,-19.8447 to 23.4072,-19.7547. Dated point events by species: where and when Wildlife sightings happen. | 2 |
| River channels | vector, LineString | 2 | 2 line features; named by 'name' (e.g. Main channel, Southern channel); total length 31.87 km; extent 23.2927,-19.8258 to 23.4074,-19.7811. Lines (River channels) such as routes or networks. | 106 | |
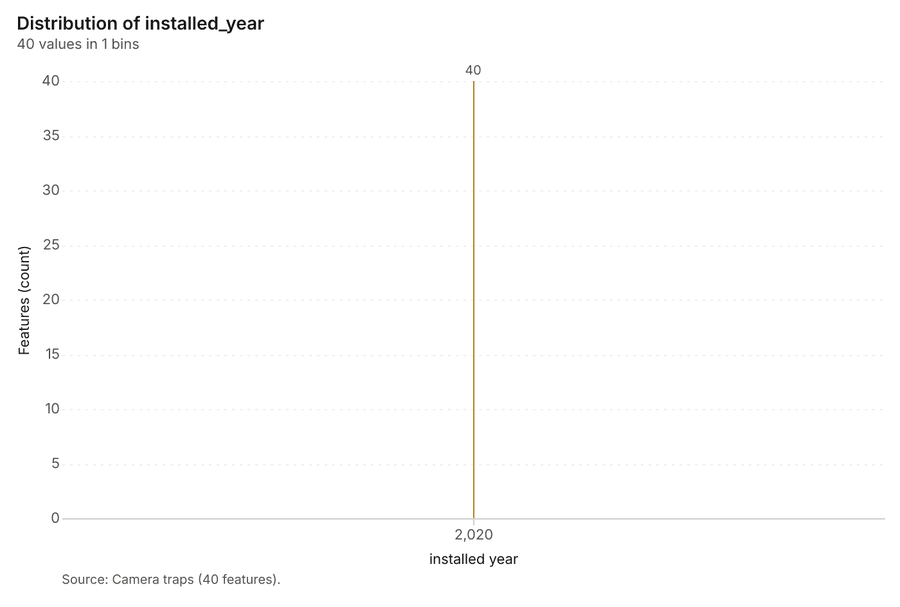
| Camera traps | vector, Point | 40 | 40 point features; 'working' has 2 values (top: True 34, False 6); 'installed_year' 2,020 to 2,020 (mean 2020); named by 'name' (e.g. Camera trap 01, Camera trap 02, Camera trap 03); extent 23.2940,-19.8426 to 23.4047,-19.7566. Point locations of Camera traps by working. | 107 | |
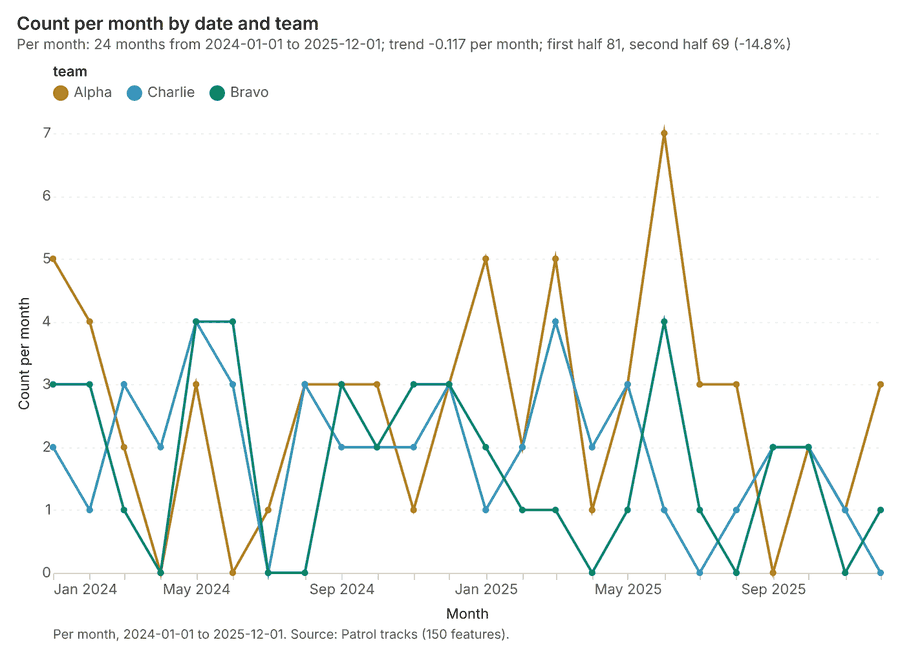
| Patrol tracks | vector, LineString | 150 | 2024-01-12 to 2025-12-28 | 150 line features; dated by 'date' from 2024-01-12 to 2025-12-28; 'team' has 3 values (top: Alpha 63, Charlie 46, Bravo 41); 'snares_found' 0 to 4 (mean 0.9067); total length 985.6 km; extent 23.2921,-19.8472 to 23.4085,-19.7533. Lines (Patrol tracks) such as routes or networks. | 3 |
| Water points | vector, Point | 25 | 25 point features; 'type' has 3 values (top: borehole 10, pan 8, lagoon 7); 'permanent' has 2 values (top: True 14, False 11); extent 23.2942,-19.8258 to 23.3495,-19.7772. Point locations of Water points by type. | 108 | |
| Habitat scene 2020-09-15 | raster | 2020-09-15 | 4-band float32 raster (imagery), 300 x 250 cells; resolution 40; band 1 0.009 to 0.079; acquired 2020-09-15; extent 23.2921,-19.8459 to 23.4079,-19.7541. Imagery for visual and change analysis. | 109 | |
| Habitat scene 2025-09-15 | raster | 2025-09-15 | 4-band float32 raster (imagery), 300 x 250 cells; resolution 40; band 1 0.007 to 0.182; acquired 2025-09-15; extent 23.2921,-19.8459 to 23.4079,-19.7541. Imagery for visual and change analysis. | 110 | |
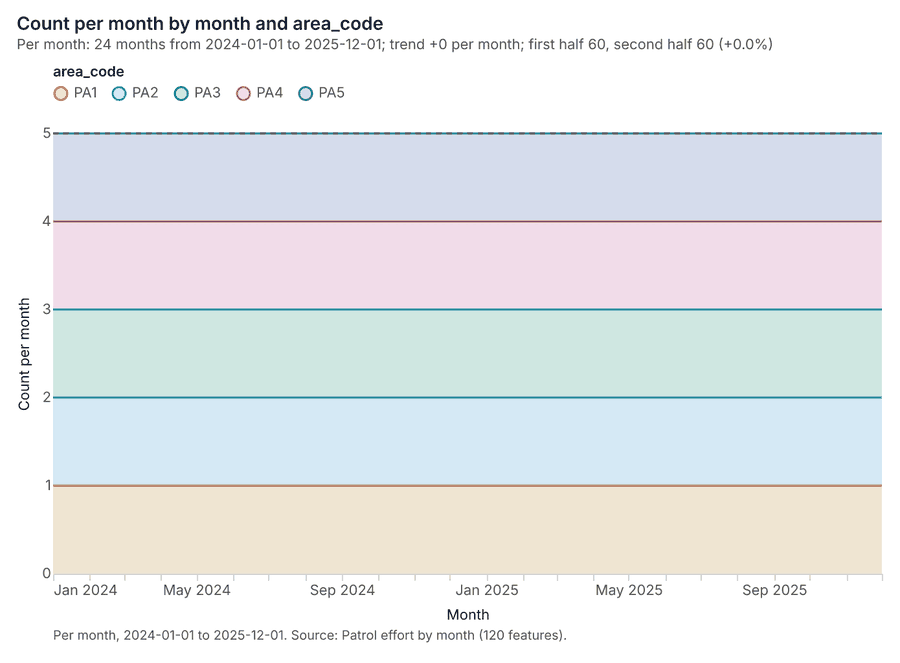
| Patrol effort by month | table | 120 | 2024-01-01 to 2025-12-01 | Table of 120 rows and 5 columns without geometry; dated by 'month' from 2024-01-01 to 2025-12-01; 'area_code' has 5 values (top: PA1 24, PA2 24, PA3 24); 'patrol_km' 130 to 707 (mean 338.4); 'snares_removed' 0 to 7 (mean 1.275); 'carcasses_found' 0 to 3 (mean 0.425). A table of Patrol effort by month without locations. | 4 |
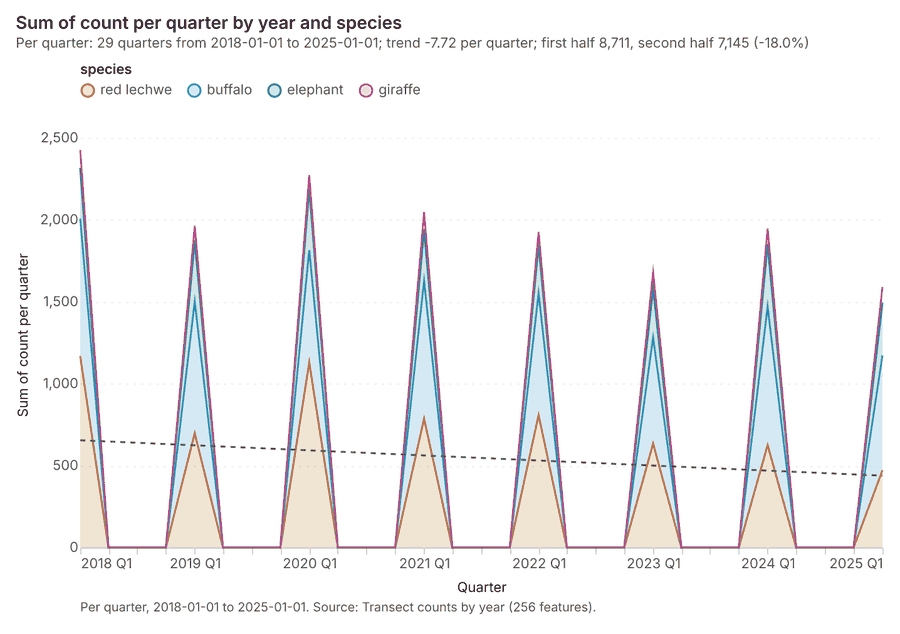
| Transect counts by year | table | 256 | 2018-01-01 to 2025-01-01 | Table of 256 rows and 4 columns without geometry; dated by 'year' from 2018-01-01 to 2025-01-01; 'species' has 4 values (top: elephant 64, buffalo 64, red lechwe 64); 'count' 6 to 287 (mean 61.94). A table of Transect counts by year without locations. | 5 |
| Annual wildlife monitoring report | document | 1-page md document 'Annual wildlife monitoring report 2025'; language en; mentions 4 place(s): Community trust area (2), Northern wildlife concession (1), -19.77328, 23.32099 (1), Main channel (1). A document about Community trust area, Northern wildlife concession, -19.77328, 23.32099. | 111 | ||
| Sample: Conservation, Okavango Delta near Maun | record | 112 | |||
| Emerging hot spots: Wildlife sightings | layer, Polygon | 187 | 113 | ||
| Repeat and near repeat classification: Wildlife sightings | layer, Point | 2,000 | 114 | ||
| Hot spot analysis: Camera traps | layer, Polygon | 11 | 115 | ||
| Hot spot analysis: Wildlife sightings | layer, Point | 2,000 | 116 | ||
| NDVI change Habitat scene 2020-09-15 to Habitat scene 2025-09-15 | layer | 0 | 117 | ||
| NDVI decrease / increase | layer | 0 | 118 | ||
| NDVI change polygons | layer, Polygon | 984 | 119 | ||
| Difference Habitat scene 2020-09-15 to Habitat scene 2025-09-15 | layer | 0 | 120 | ||
| Calculate density: Water points | layer, Polygon | 67 | 121 | ||
| Calculate density: Camera traps | layer, Polygon | 95 | 122 | ||
| Calculate density: Wildlife sightings | layer, Polygon | 3,384 | 123 | ||
| Summarize within: Protected areas | layer, Polygon | 5 | 124 | ||
| Summarize within: Protected areas | layer, Polygon | 5 | 125 | ||
| Summarize within: Protected areas | layer, Polygon | 5 | 126 | ||
| Find point clusters: Water points | layer, Point | 25 | 127 | ||
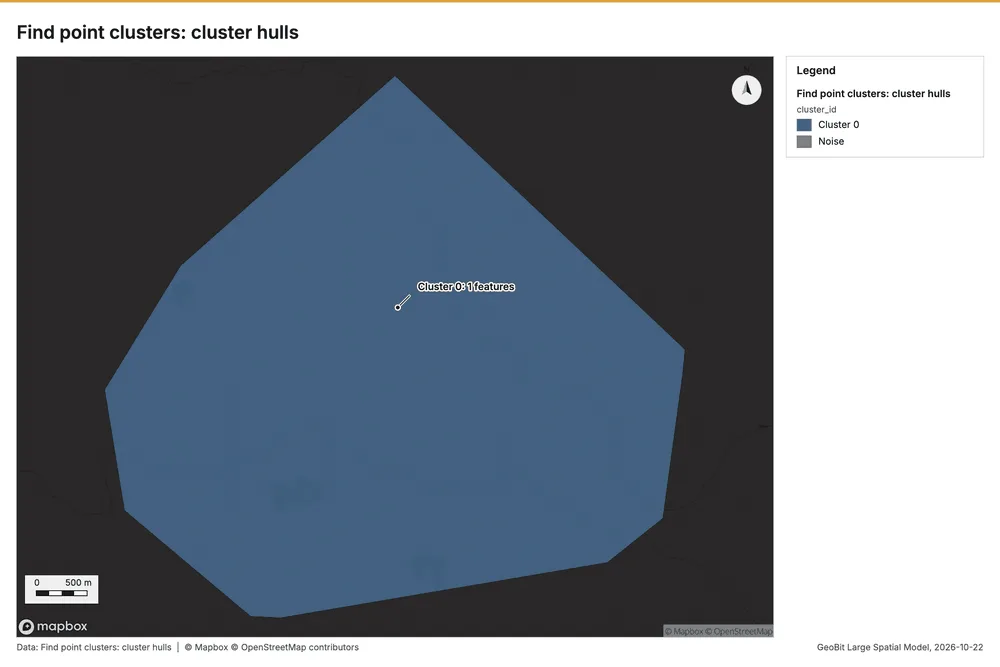
| Find point clusters: cluster hulls | layer, Polygon | 1 | 128 | ||
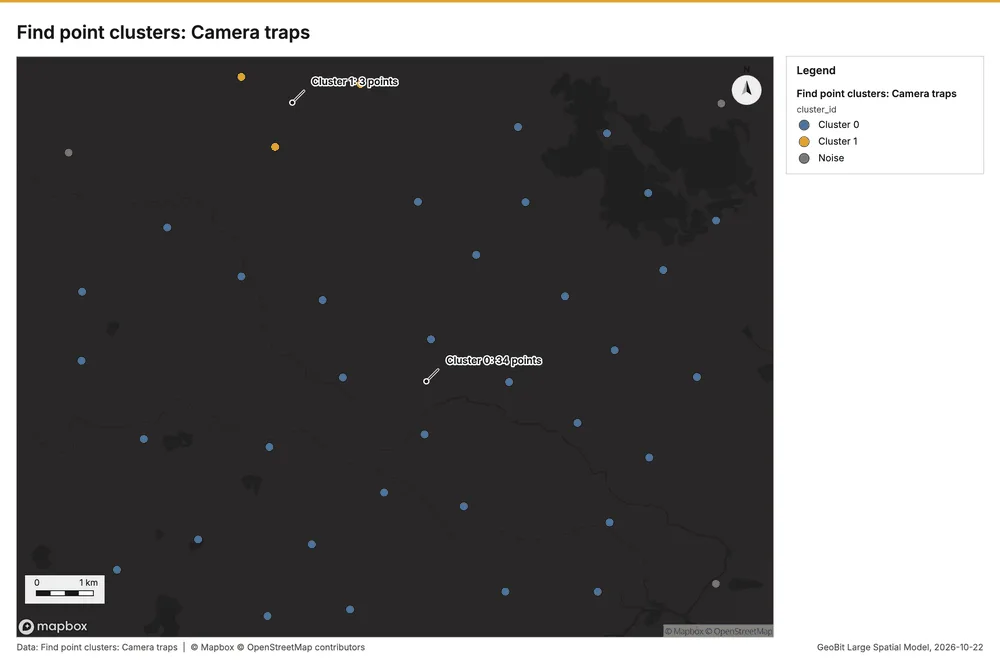
| Find point clusters: Camera traps | layer, Point | 40 | 129 | ||
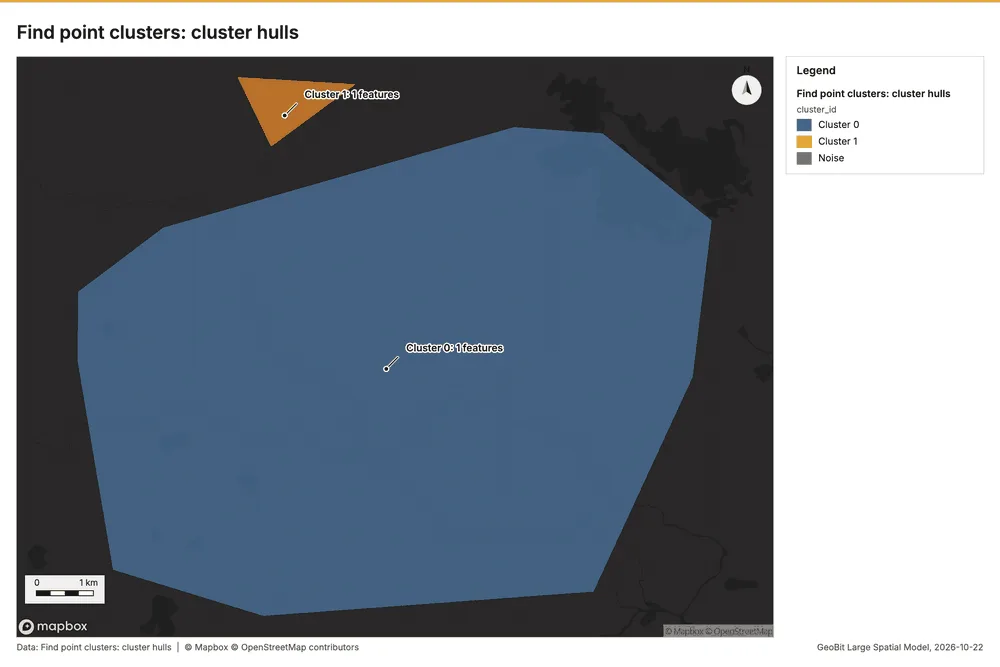
| Find point clusters: cluster hulls | layer, Polygon | 2 | 130 | ||
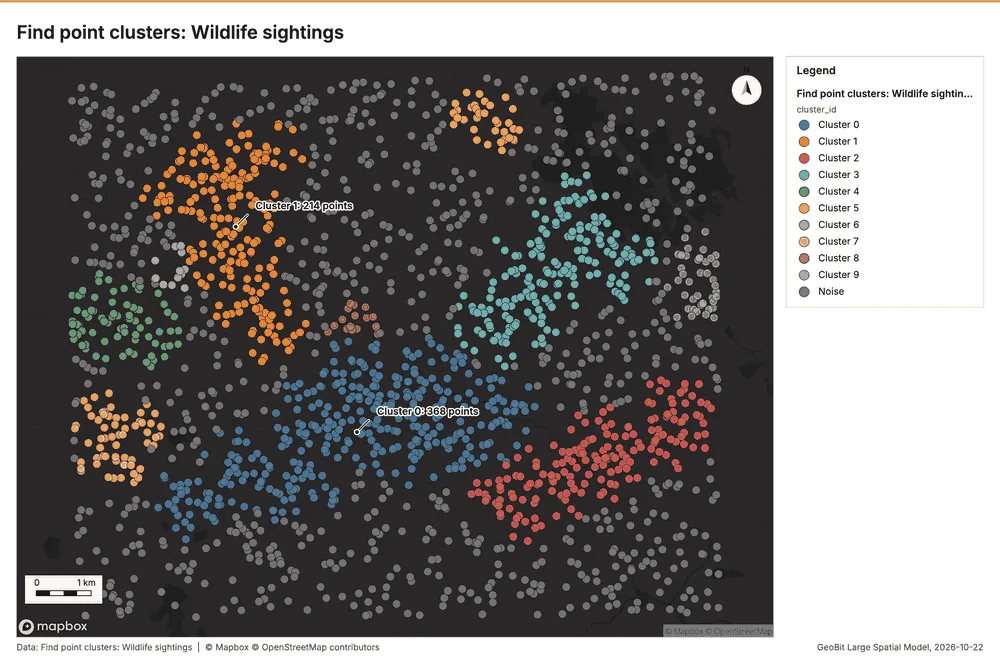
| Find point clusters: Wildlife sightings | layer, Point | 2,000 | 131 | ||
| Find point clusters: cluster hulls | layer, Polygon | 10 | 132 | ||
| NDVI change polygons | layer, Polygon | 984 | 133 |
Timeline
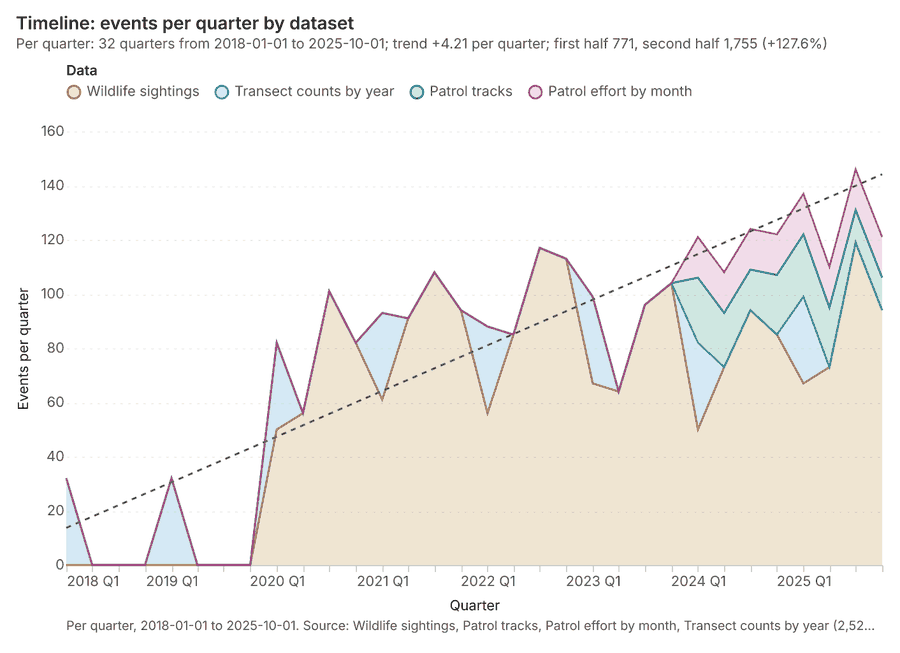
The timeline counts 2,526 dated events in Wildlife sightings, Patrol tracks, Patrol effort by month and 1 more per quarter, from Q1 2018 to Q4 2025 12345. By dataset: Wildlife sightings 2,000; Transect counts by year 256; Patrol tracks 150; Patrol effort by month 120 1. The trend is +4.21 events per quarter; the second half of the quarters has 1,755 against 771 in the first (+127.6%) 1. 6 of the 32 quarters had no events 1. Change point detection found no shift in the counts 6.
Busiest quarters
Quietest quarters with events
Space time hot spots
What this analysis is. Emerging hot spots: Where hot spots are new, consecutive, intensifying, persistent, diminishing, sporadic, oscillating or historical over time 7. In ArcGIS it is Emerging Hot Spot Analysis or Create Space Time Cube 7.
Why it was run on this data. Wildlife sightings carry dates in 'observed_at': emerging hot spot analysis finds new, intensifying and fading hot spots per month 8.
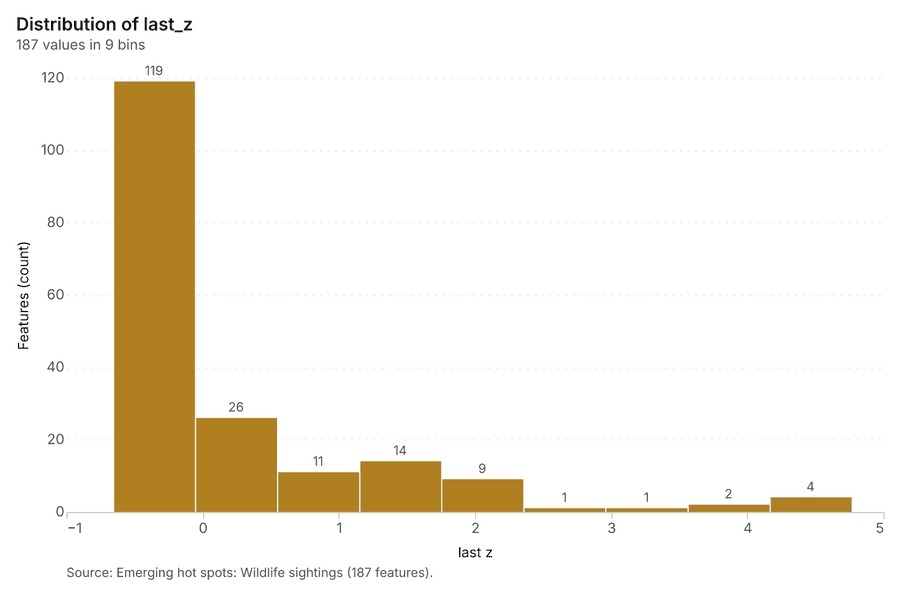
What it found. The process generated 187 features for emerging hot spots: Wildlife sightings 9. The analysis utilized the Wildlife sightings input layer 10, processing 2,000 features and reaching a resolution of 8 9.
| Result | Value |
|---|---|
| result, count | 187 |
| result, elapsed ms | 74 |
| result, resolution | 8 |
| result, features used | 2,000 |
| result, time neighbors | 0 |
| billing, cost | 0.2 |
| billing, list price | 0.2 |
| billing, upstream cost | 0 |
Findings
- Evidenced: Space time hot spots on Wildlife sightings: Emerging hot spots: 1 layer saved: Emerging hot spots: Wildlife sightings (187 features) 910.
- Evidenced: It reported result, count 187; result, elapsed ms 74; result, resolution 8; result, features used 2,000; result, time neighbors 0; billing, cost 0.2 9.
Tool gp_space_time_hot_spots; parameters {"agg": "sum", "project": "750b4ce3-8424-4738-b383-c6a58973ae02", "features": {"layer": "Wildlife sightings (49c8e07e)"}, "interval": "month", "bin_shape": "h3", "resolution": 8, "time_field": "observed_at", "value_field": "count"}
Near repeat
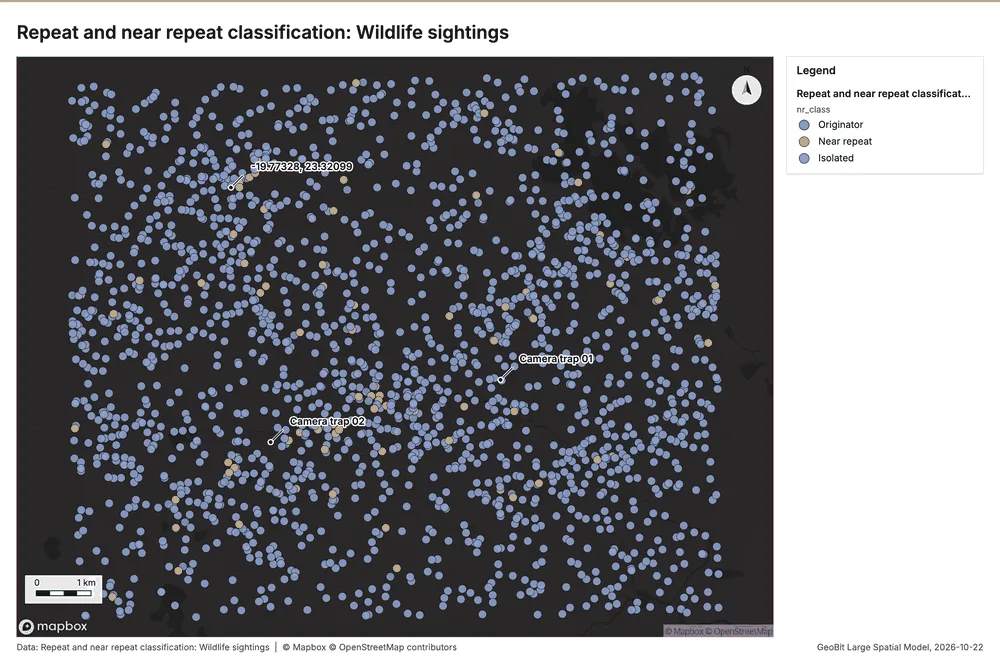
What this analysis is. Repeat and near repeat classification: Classify incidents as originators, repeats (same place) or near repeats within a distance and time window, with a Knox test table 11. In ArcGIS it is Repeat and Near Repeat Classification or Near Repeat Calculator 11.
Why it was run on this data. Near repeat analysis tests whether Wildlife sightings close in space also follow each other within 30 days 12.
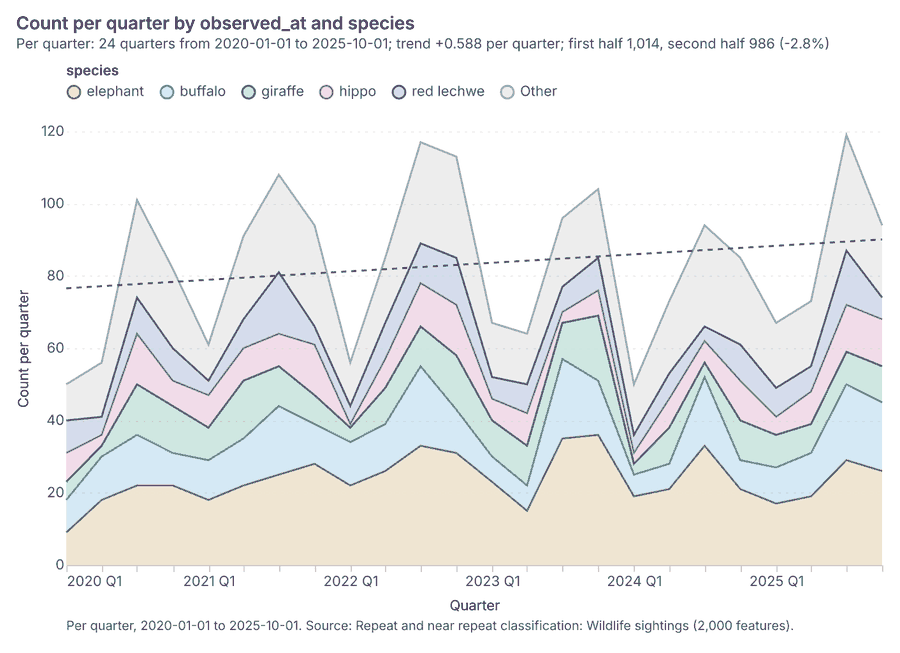
What it found. Near repeat on Wildlife sightings: Repeat and near repeat classification: 1 layer saved: Repeat and near repeat classification: Wildlife sightings (2000 features) 1013. It reported result, days 30; result, count 2,000; result, chains 72; result, distance m 200; result, elapsed ms 29; result, pairs linked 87 13.
| Result | Value |
|---|---|
| result, days | 30 |
| result, count | 2,000 |
| result, chains | 72 |
| result, distance m | 200 |
| result, elapsed ms | 29 |
| result, pairs linked | 87 |
| billing, cost | 0.11 |
| billing, list price | 0.11 |
| billing, upstream cost | 0 |
Findings
- Evidenced: Near repeat on Wildlife sightings: Repeat and near repeat classification: 1 layer saved: Repeat and near repeat classification: Wildlife sightings (2000 features) 1013.
- Evidenced: It reported result, days 30; result, count 2,000; result, chains 72; result, distance m 200; result, elapsed ms 29; result, pairs linked 87 13.
Tool gp_near_repeat; parameters {"days": 30, "project": "750b4ce3-8424-4738-b383-c6a58973ae02", "features": {"layer": "Wildlife sightings (49c8e07e)"}, "distance_m": 200.0, "time_field": "observed_at"}
Change point detection
What this analysis is. Change point detection: When did the level, count, trend or variability change 14? For the whole study area or for every bin 14. In ArcGIS it is Change Point Detection 14.
Why it was run on this data. Change point detection finds when the monthly count of Wildlife sightings shifted 15.
What it found. The change point detection tool, gp_change_point_detection 6, was run using the Wildlife sightings data 10. The analysis confirmed that change point detection was done 6. The output indicated that there was no map output 6.
Findings
- Evidenced: Change point detection on Wildlife sightings: Change point detection: done; no map output 610.
Tool gp_change_point_detection; parameters {"method": "count", "project": "750b4ce3-8424-4738-b383-c6a58973ae02", "features": {"layer": "Wildlife sightings (49c8e07e)"}, "interval": "month", "time_field": "observed_at"}
Hot spots
What this analysis is. Hot spot analysis: Getis-Ord Gi* hot and cold spots with z-scores, p-values and confidence bins 16. In ArcGIS it is Find Hot Spots or Hot Spot Analysis (Getis-Ord Gi*); in QGIS, qgis:hotspot (plugin) 16.
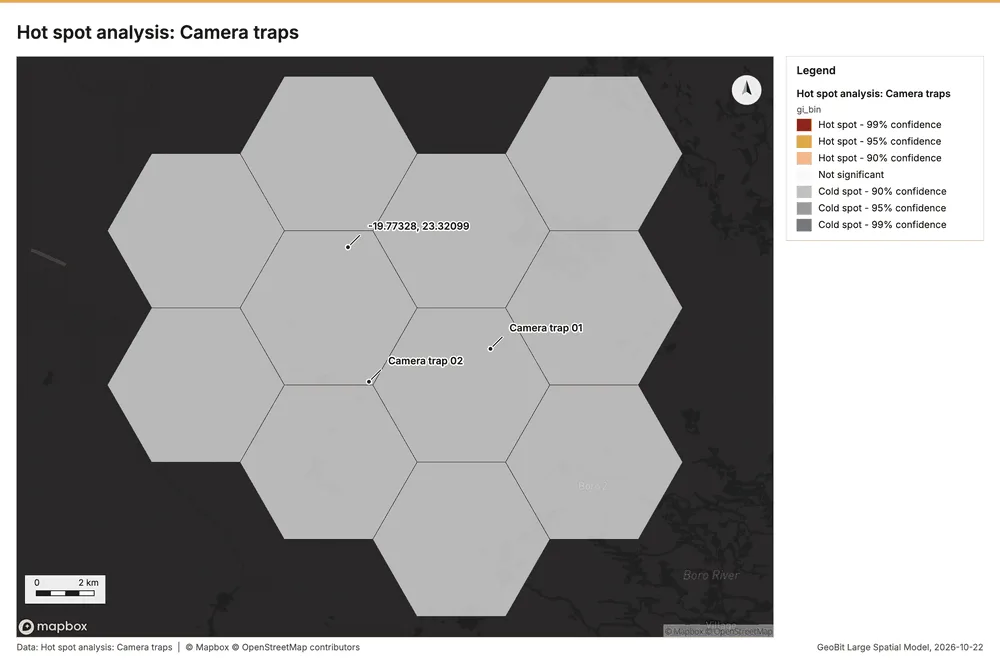
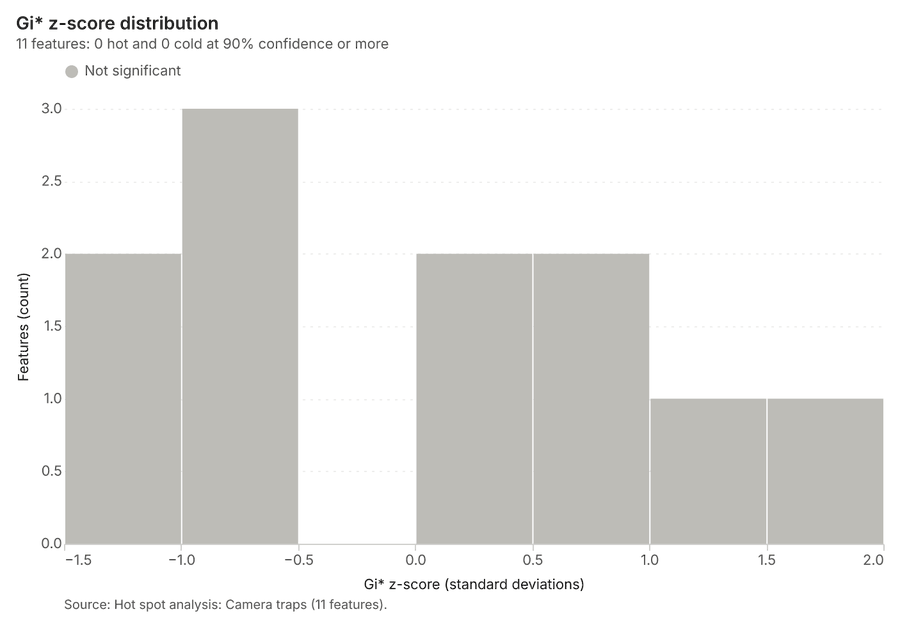
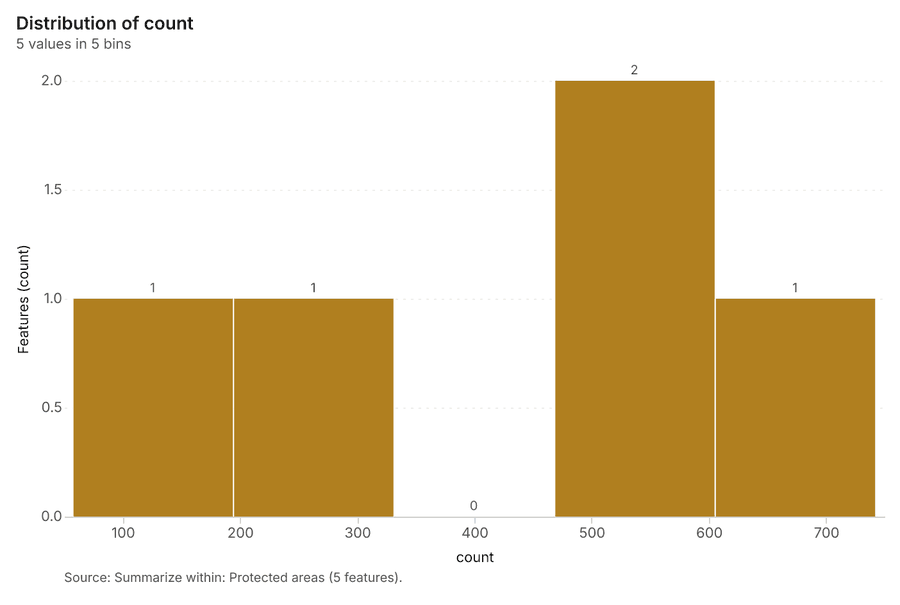
Why it was run on this data. 40 points: Getis-Ord Gi* tests whether the concentrations in Camera traps are statistically significant 17.
What it found. Hot spots on Camera traps: Hot spot analysis: 1 layer saved: Hot spot analysis: Camera traps (11 features) 1819. It reported result, bins 11; result, count 11; result, elapsed ms 3; result, cell size m 5,000; result, incidents used 40; result, distance band m 5,000 18.
| Result | Value |
|---|---|
| result, bins | 11 |
| result, count | 11 |
| result, elapsed ms | 3 |
| result, cell size m | 5,000 |
| result, incidents used | 40 |
| result, distance band m | 5,000 |
| billing, cost | 0.0508 |
| billing, list price | 0.0508 |
| billing, upstream cost | 0 |
Findings
- Evidenced: Hot spots on Camera traps: Hot spot analysis: 1 layer saved: Hot spot analysis: Camera traps (11 features) 1819.
- Evidenced: It reported result, bins 11; result, count 11; result, elapsed ms 3; result, cell size m 5,000; result, incidents used 40; result, distance band m 5,000 18.
Tool gp_hot_spots; parameters {"project": "750b4ce3-8424-4738-b383-c6a58973ae02", "features": {"layer": "Camera traps (2952931c)"}, "aggregation": "hexagon", "cell_size_m": 5000.0, "distance_band_m": 5000.0}
Hot spots
What this analysis is. Hot spot analysis: Getis-Ord Gi* hot and cold spots with z-scores, p-values and confidence bins 16. In ArcGIS it is Find Hot Spots or Hot Spot Analysis (Getis-Ord Gi*); in QGIS, qgis:hotspot (plugin) 16.
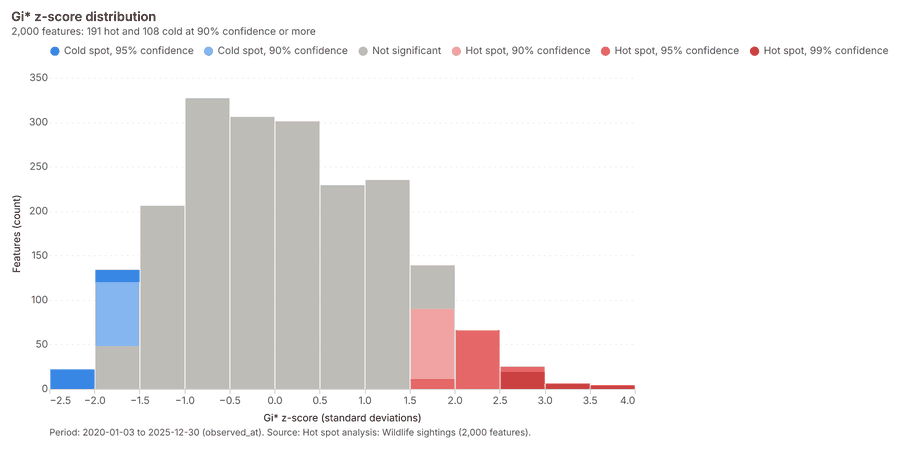
Why it was run on this data. 2000 points: Getis-Ord Gi* tests whether the concentrations in Wildlife sightings are statistically significant 20.
What it found. Hot spots on Wildlife sightings: Hot spot analysis: 1 layer saved: Hot spot analysis: Wildlife sightings (2000 features) 1021. It reported result, count 2,000; result, elapsed ms 27; result, excluded null 0; result, distance band m 500; billing, cost 0.09; billing, list price 0.09 21.
| Result | Value |
|---|---|
| result, count | 2,000 |
| result, elapsed ms | 27 |
| result, excluded null | 0 |
| result, distance band m | 500 |
| billing, cost | 0.09 |
| billing, list price | 0.09 |
| billing, upstream cost | 0 |
Findings
- Evidenced: Hot spots on Wildlife sightings: Hot spot analysis: 1 layer saved: Hot spot analysis: Wildlife sightings (2000 features) 1021.
- Evidenced: It reported result, count 2,000; result, elapsed ms 27; result, excluded null 0; result, distance band m 500; billing, cost 0.09; billing, list price 0.09 21.
Tool gp_hot_spots; parameters {"field": "count", "project": "750b4ce3-8424-4738-b383-c6a58973ae02", "features": {"layer": "Wildlife sightings (49c8e07e)"}, "aggregation": "hexagon", "cell_size_m": 500.0, "distance_band_m": 500.0}
Index change
What this analysis is. Spectral index change: Change of a spectral index (NDVI, NDWI, NDBI, NBR …) or a band expression between two images: before, after and difference rasters, decrease / increase classes beyond the threshold with polygons and areas; NBR also gives dNBR with burn severity classes 22.
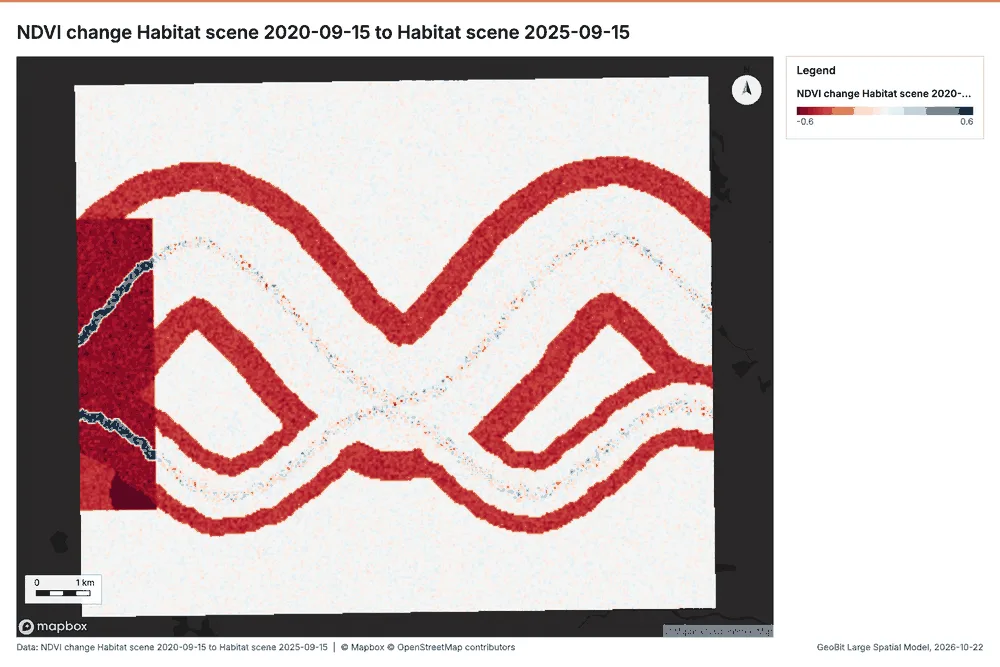
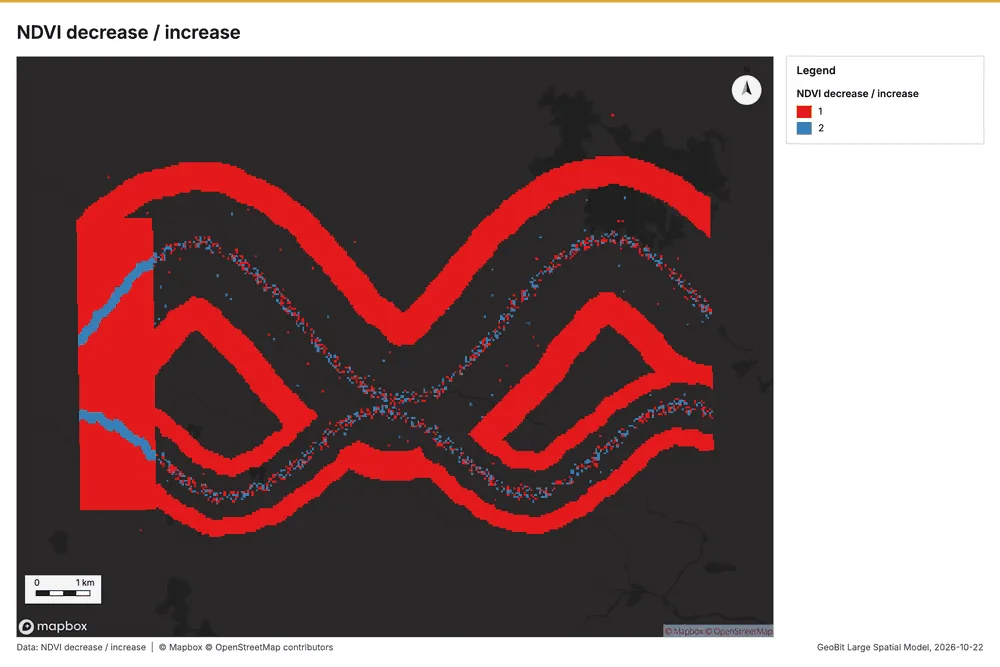
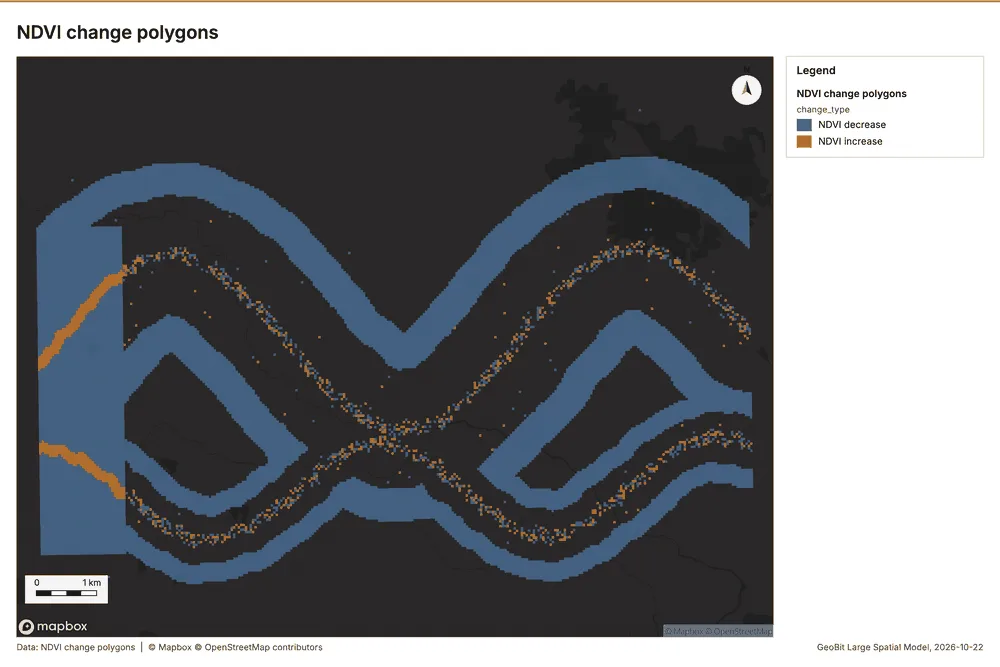
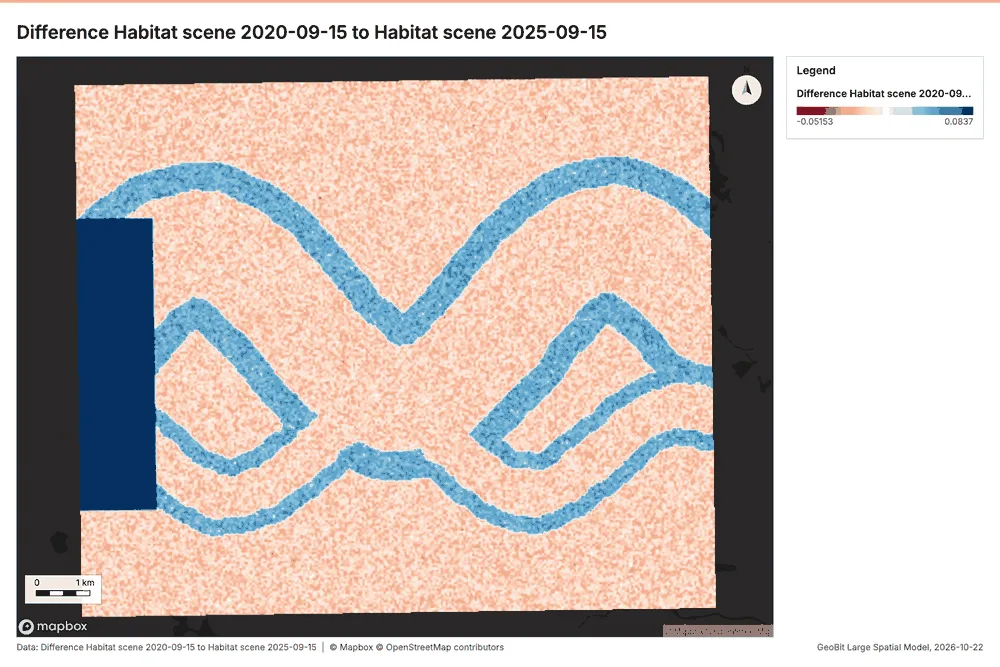
Why it was run on this data. Index change between Habitat scene 2020-09-15 (2020-09-15) and Habitat scene 2025-09-15 (2025-09-15): the changed area, with the changed places as polygons 23.
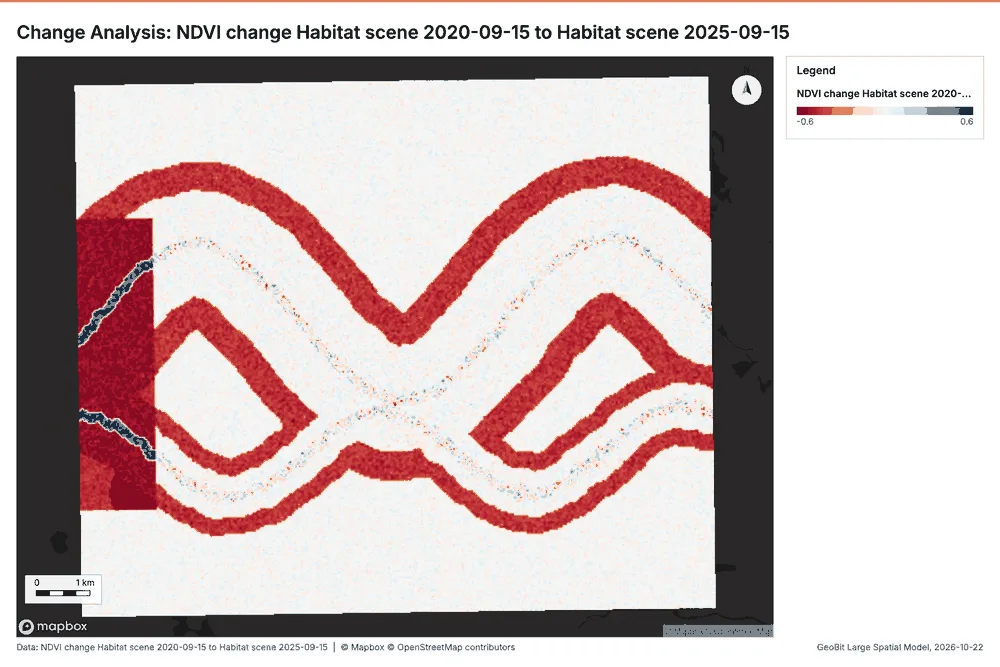
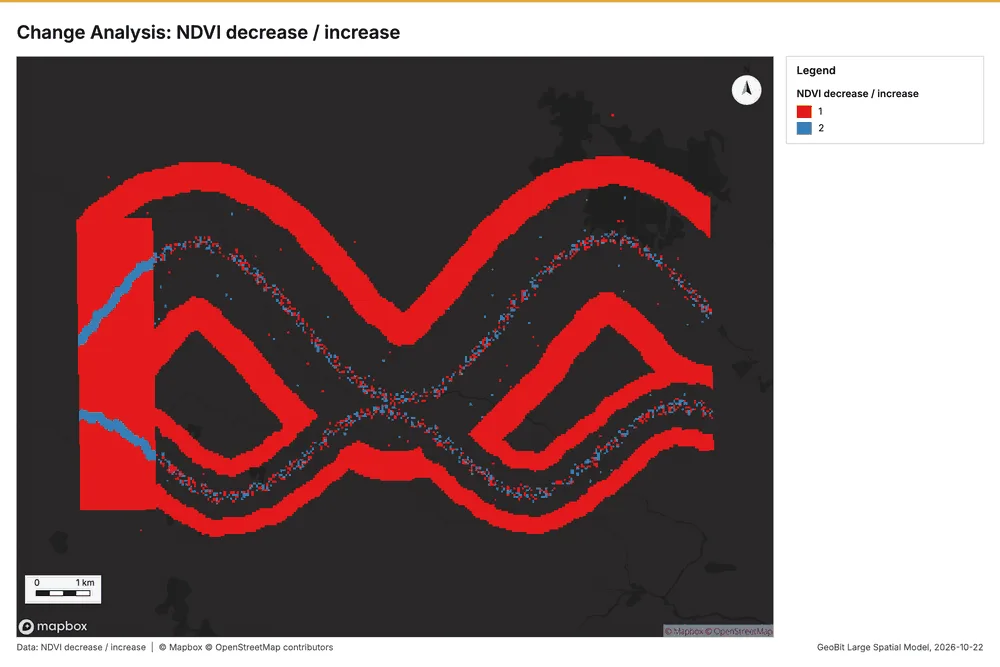
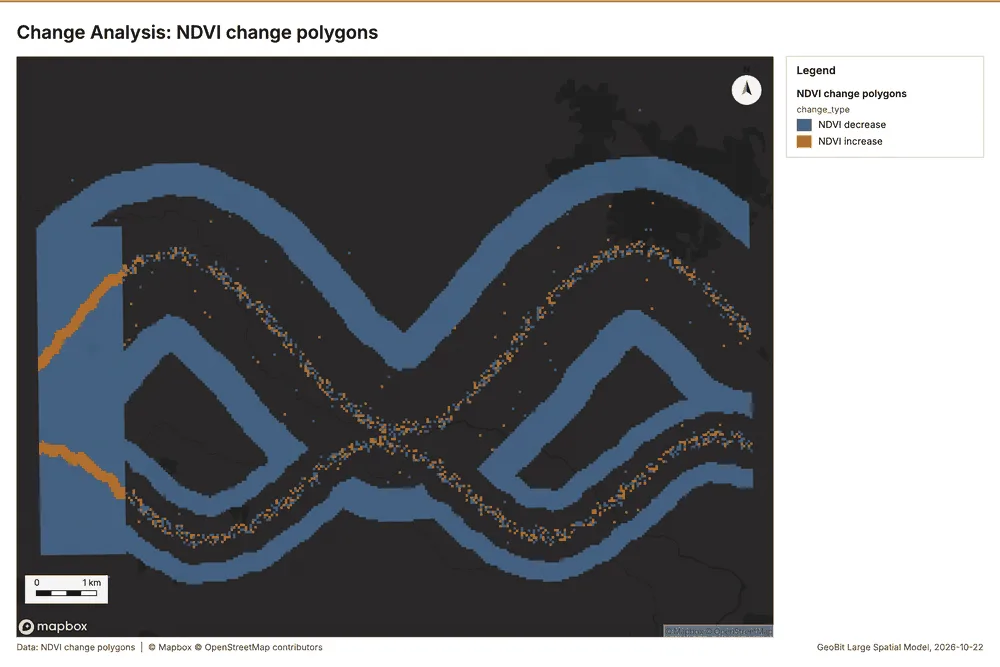
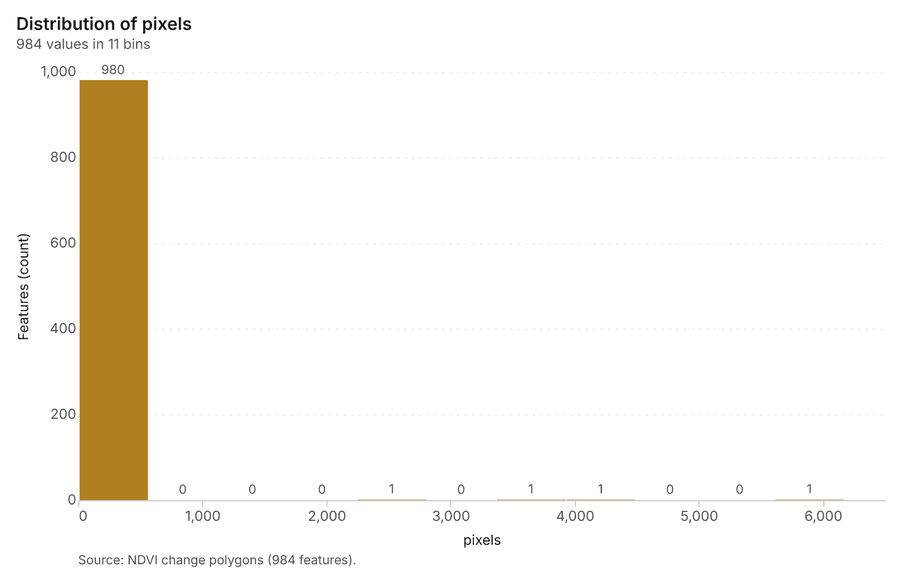
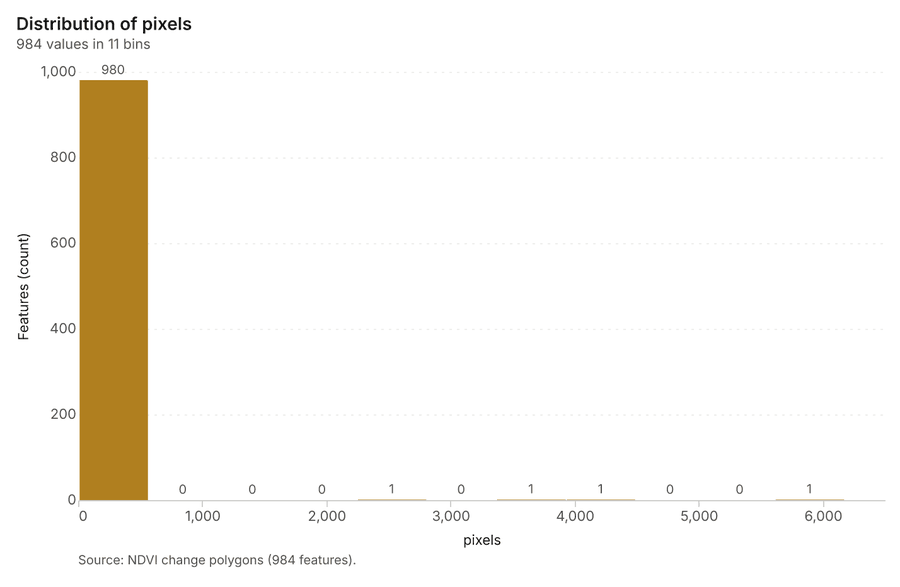
What it found. Index change: Spectral index change: created NDVI change Habitat scene 2020-09-15 to Habitat scene 2025-09-15 (300 x 250 cells, 40.00 m) 24. plus 1 more raster layer(s) 24. and layer NDVI change polygons with 984 feature(s) 24. mean before 0.5613; mean after 0.4592; mean difference -0.1022; decrease ha 2,822; increase ha 185.28 24. It reported stats, polygons 984; stats, mean after 0.4592; stats, decrease ha 2,822; stats, increase ha 185.3; stats, mean before 0.5613; stats, masked pixels 0 24.
| Result | Value |
|---|---|
| stats, polygons | 984 |
| stats, mean after | 0.4592 |
| stats, decrease ha | 2,822 |
| stats, increase ha | 185.3 |
| stats, mean before | 0.5613 |
| stats, masked pixels | 0 |
| stats, mean difference | -0.1022 |
| elapsed ms | 383 |
Findings
- Evidenced: Index change: Spectral index change: created NDVI change Habitat scene 2020-09-15 to Habitat scene 2025-09-15 (300 x 250 cells, 40.00 m) 24.
- Evidenced: plus 1 more raster layer(s) 24.
- Evidenced: and layer NDVI change polygons with 984 feature(s) 24.
- Evidenced: mean before 0.5613; mean after 0.4592; mean difference -0.1022; decrease ha 2,822; increase ha 185.28 24.
- Evidenced: It reported stats, polygons 984; stats, mean after 0.4592; stats, decrease ha 2,822; stats, increase ha 185.3; stats, mean before 0.5613; stats, masked pixels 0 24.
A model draft was discarded because a sentence did not cite a source of this section.
Tool im_index_change; parameters {"after_id": "Habitat scene 2025-09-15 (f6387687)", "polygons": true, "before_id": "Habitat scene 2020-09-15 (de16b11c)"}
Compute change raster
What this analysis is. Compute change raster: Pixel value or spectral change between two co-registered images: difference, relative difference, absolute difference, log ratio (radar, dB), Euclidean spectral distance, spectral angle (radians) or the band with most change 25.
Why it was run on this data. A change raster between Habitat scene 2020-09-15 (2020-09-15) and Habitat scene 2025-09-15 (2025-09-15): where and how much the pixels changed 26.
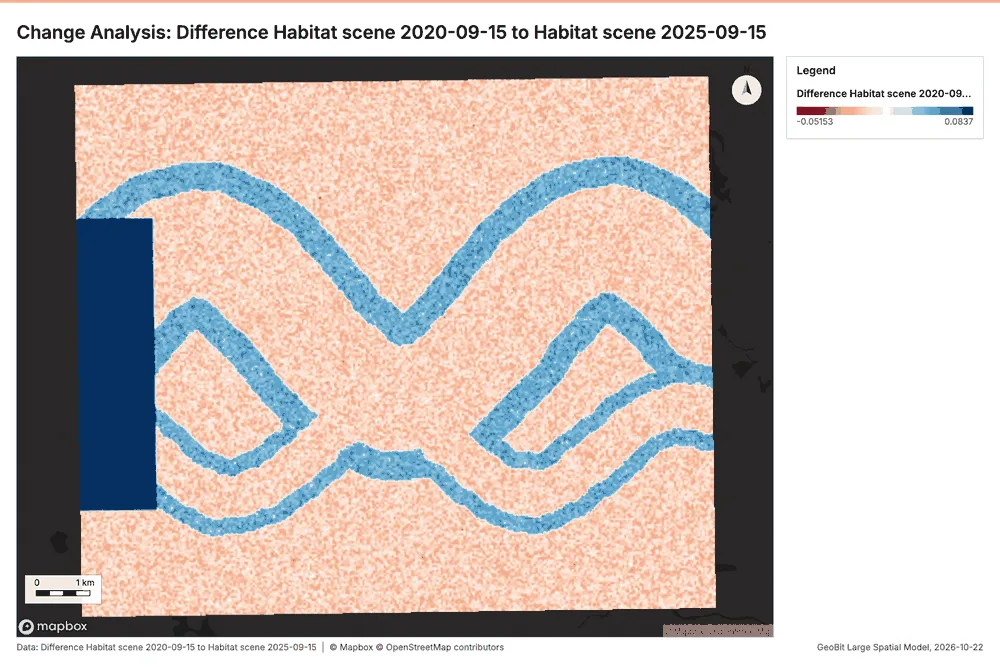
What it found. Compute change raster: Compute change raster: created Difference Habitat scene 2020-09-15 to Habitat scene 2025-09-15 (300 x 250 cells, 40.00 m) 27. mean 0.01608; std 0.03381; min -0.04; max 0.15; masked pixels 0 27. It reported stats, max 0.15; stats, min -0.04; stats, std 0.03381; stats, mean 0.01608; stats, masked pixels 0; elapsed ms 88 27.
| Result | Value |
|---|---|
| stats, max | 0.15 |
| stats, min | -0.04 |
| stats, std | 0.03381 |
| stats, mean | 0.01608 |
| stats, masked pixels | 0 |
| elapsed ms | 88 |
Findings
- Evidenced: Compute change raster: Compute change raster: created Difference Habitat scene 2020-09-15 to Habitat scene 2025-09-15 (300 x 250 cells, 40.00 m) 27.
- Evidenced: mean 0.01608; std 0.03381; min -0.04; max 0.15; masked pixels 0 27.
- Evidenced: It reported stats, max 0.15; stats, min -0.04; stats, std 0.03381; stats, mean 0.01608; stats, masked pixels 0; elapsed ms 88 27.
Tool im_compute_change_raster; parameters {"after_id": "Habitat scene 2025-09-15 (f6387687)", "before_id": "Habitat scene 2020-09-15 (de16b11c)"}
Calculate density
What this analysis is. Calculate density: Kernel density per square kilometer on a grid 28. In ArcGIS it is Calculate Density or Kernel Density; in QGIS, native:heatmapkerneldensityestimation 28.
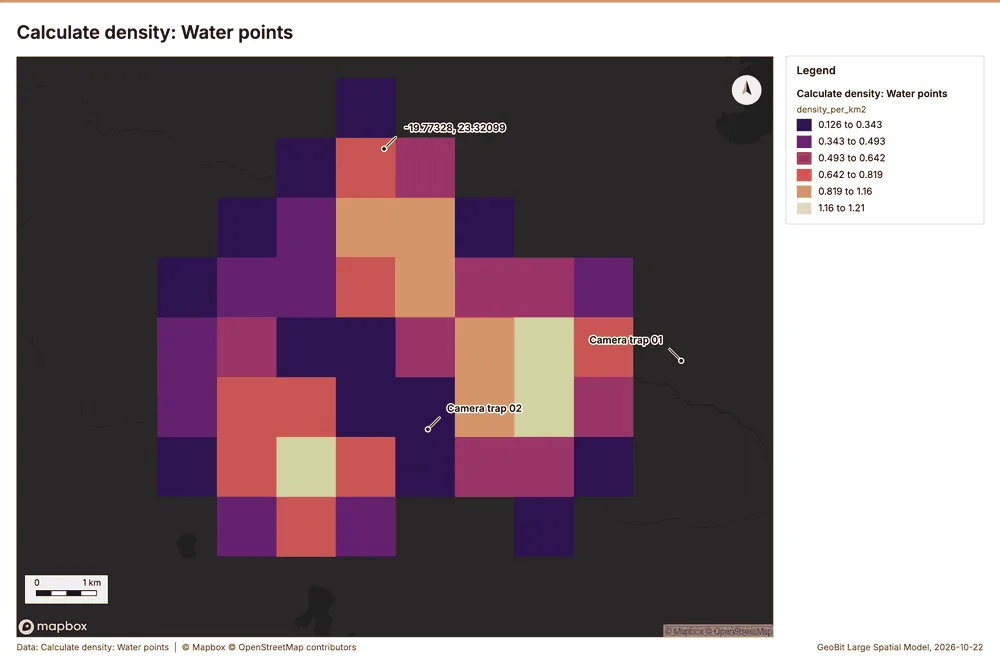
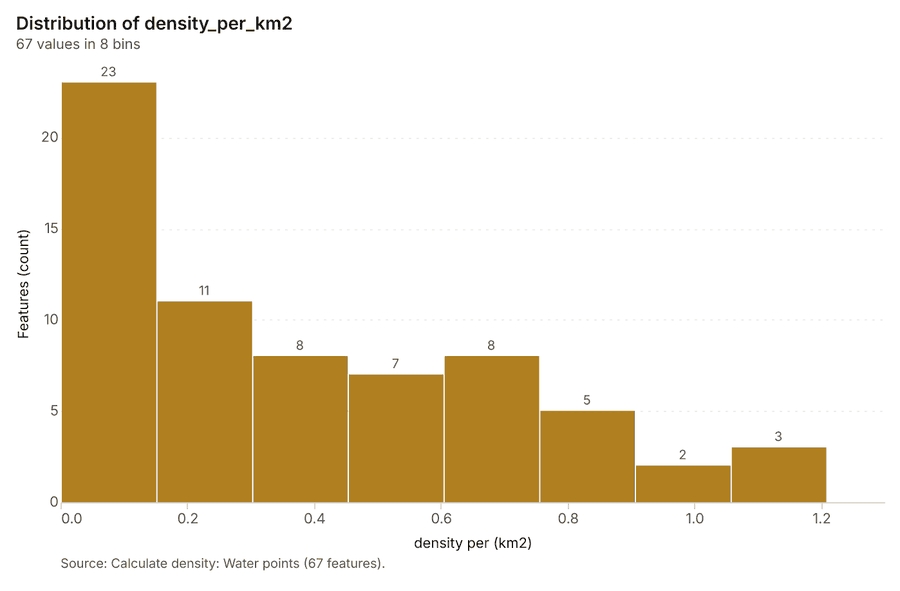
Why it was run on this data. 25 points in Water points: a density surface shows where they concentrate 29.
What it found. The density calculation was performed on the Water points data 31. The process successfully created 1 layer and analyzed a total of 67 water points 30. Key metrics reported include a bandwidth of 2,000 meters, a cell size of 1,000 meters, and a maximum density of 1.208 per km² 30.
| Result | Value |
|---|---|
| result, count | 67 |
| result, elapsed ms | 3 |
| result, bandwidth m | 2,000 |
| result, cell size m | 1,000 |
| result, excluded null | 0 |
| result, max density per km2 | 1.208 |
| billing, cost | 0.0505 |
| billing, list price | 0.0505 |
| billing, upstream cost | 0 |
Findings
- Evidenced: Calculate density on Water points: Calculate density: 1 layer saved: Calculate density: Water points (67 features) 3031.
- Evidenced: It reported result, count 67; result, elapsed ms 3; result, bandwidth m 2,000; result, cell size m 1,000; result, excluded null 0; result, max density per km2 1.208 30.
Tool gp_calculate_density; parameters {"kernel": "quartic", "project": "750b4ce3-8424-4738-b383-c6a58973ae02", "features": {"layer": "Water points (2b4e30e1)"}, "bandwidth_m": 2000.0, "cell_size_m": 1000.0}
Calculate density
What this analysis is. Calculate density: Kernel density per square kilometer on a grid 28. In ArcGIS it is Calculate Density or Kernel Density; in QGIS, native:heatmapkerneldensityestimation 28.
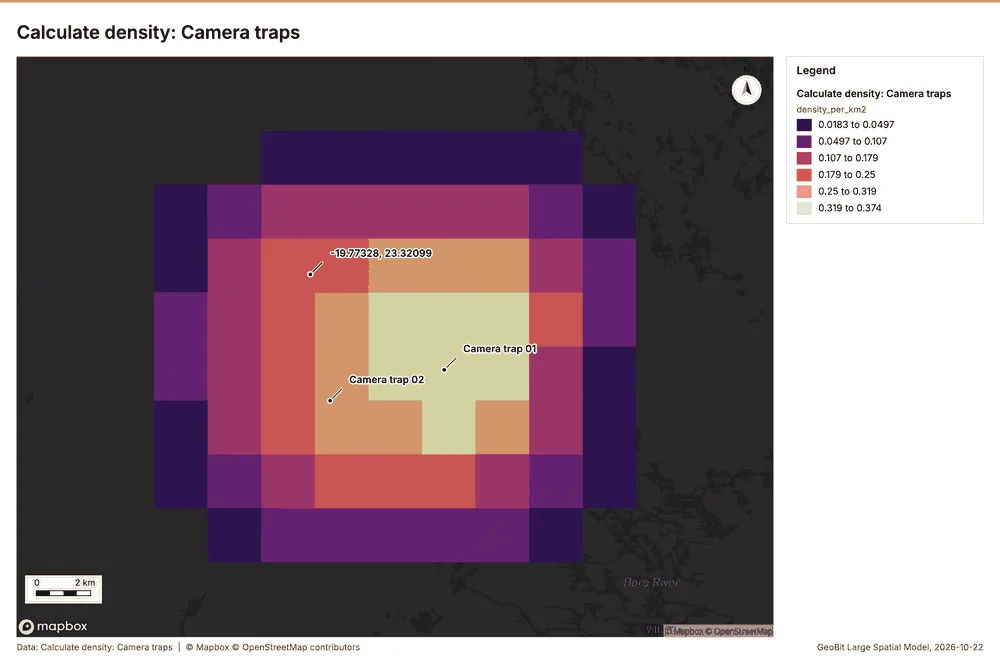
Why it was run on this data. 40 points in Camera traps: a density surface shows where they concentrate 32.
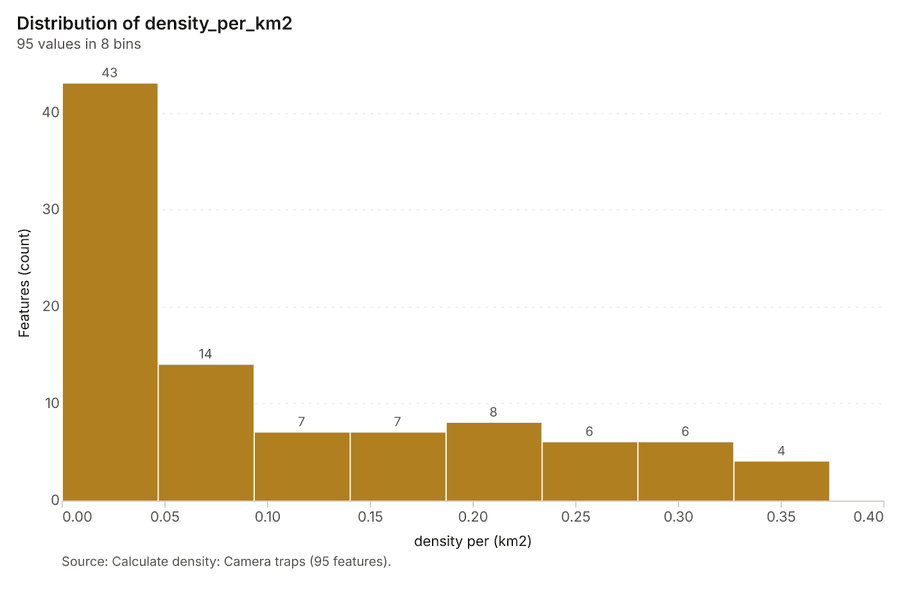
What it found. The density calculation, which utilized the Camera traps layer 19, reported a maximum density per km2 of 0.3737
| Result | Value |
|---|---|
| result, count | 95 |
| result, elapsed ms | 3 |
| result, bandwidth m | 5,000 |
| result, cell size m | 2,000 |
| result, excluded null | 0 |
| result, max density per km2 | 0.3737 |
| billing, cost | 0.0508 |
| billing, list price | 0.0508 |
| billing, upstream cost | 0 |
Findings
- Evidenced: Calculate density on Camera traps: Calculate density: 1 layer saved: Calculate density: Camera traps (95 features) 1933.
- Evidenced: It reported result, count 95; result, elapsed ms 3; result, bandwidth m 5,000; result, cell size m 2,000; result, excluded null 0; result, max density per km2 0.3737 33.
Tool gp_calculate_density; parameters {"kernel": "quartic", "project": "750b4ce3-8424-4738-b383-c6a58973ae02", "features": {"layer": "Camera traps (2952931c)"}, "bandwidth_m": 5000.0, "cell_size_m": 2000.0}
Calculate density
What this analysis is. Calculate density: Kernel density per square kilometer on a grid 28. In ArcGIS it is Calculate Density or Kernel Density; in QGIS, native:heatmapkerneldensityestimation 28.
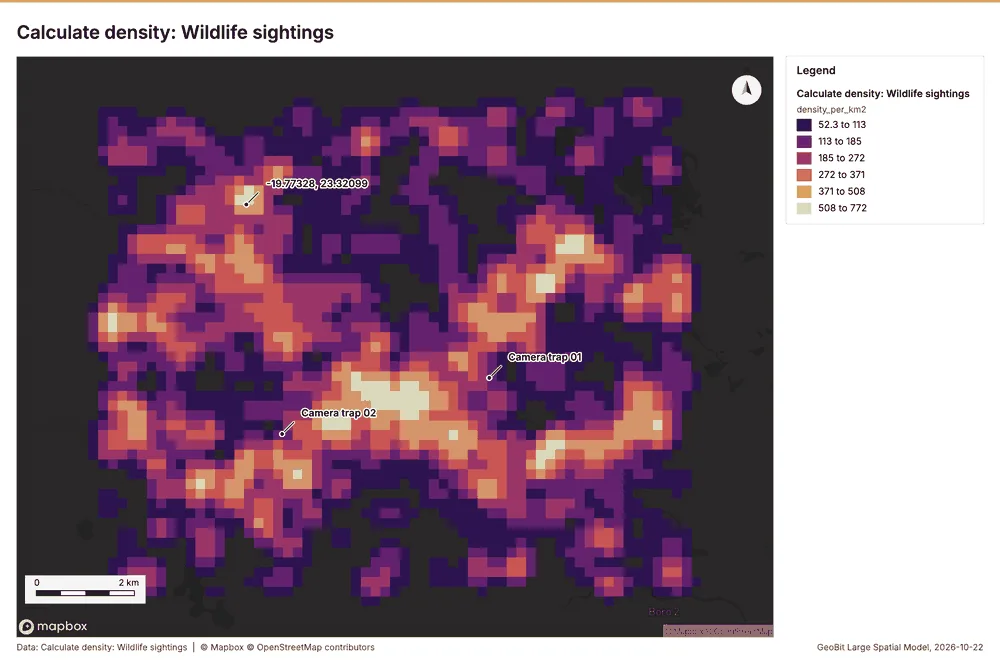
Why it was run on this data. 2000 points in Wildlife sightings: a density surface shows where they concentrate 34.
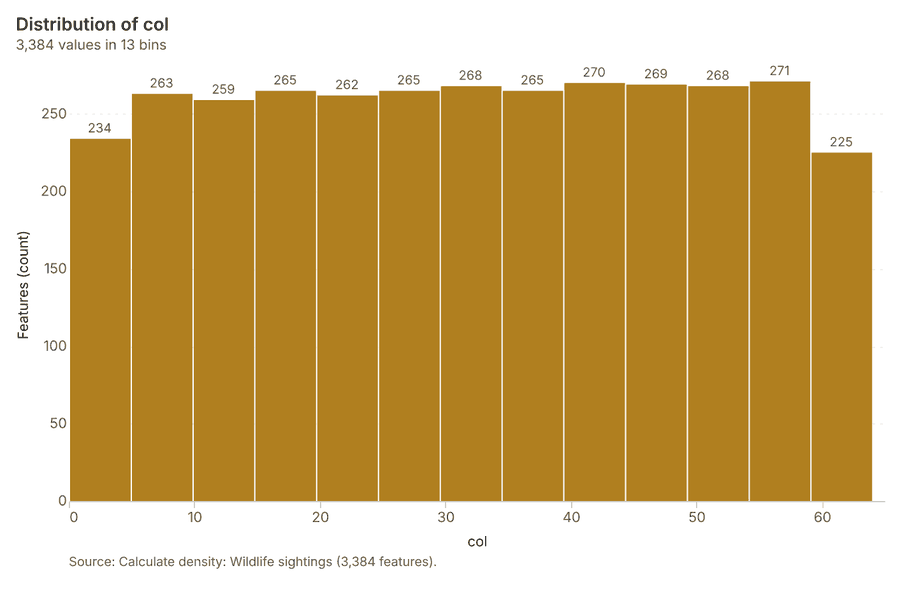
What it found. The density calculation was performed on the Wildlife sightings layer 10, yielding a result count of 3,384 35. The process successfully ran with an elapsed time of 92 milliseconds 35. The resulting surface covered a bandwidth of 500 meters and utilized a 200-meter cell size 35.
| Result | Value |
|---|---|
| result, count | 3,384 |
| result, elapsed ms | 92 |
| result, bandwidth m | 500 |
| result, cell size m | 200 |
| result, excluded null | 0 |
| result, max density per km2 | 771.7 |
| billing, cost | 0.09 |
| billing, list price | 0.09 |
| billing, upstream cost | 0 |
Findings
- Evidenced: Calculate density on Wildlife sightings: Calculate density: 1 layer saved: Calculate density: Wildlife sightings (3384 features) 1035.
- Evidenced: It reported result, count 3,384; result, elapsed ms 92; result, bandwidth m 500; result, cell size m 200; result, excluded null 0; result, max density per km2 771.7 35.
Tool gp_calculate_density; parameters {"kernel": "quartic", "project": "750b4ce3-8424-4738-b383-c6a58973ae02", "features": {"layer": "Wildlife sightings (49c8e07e)"}, "bandwidth_m": 500.0, "cell_size_m": 200.0, "weight_field": "count"}
Summarize within
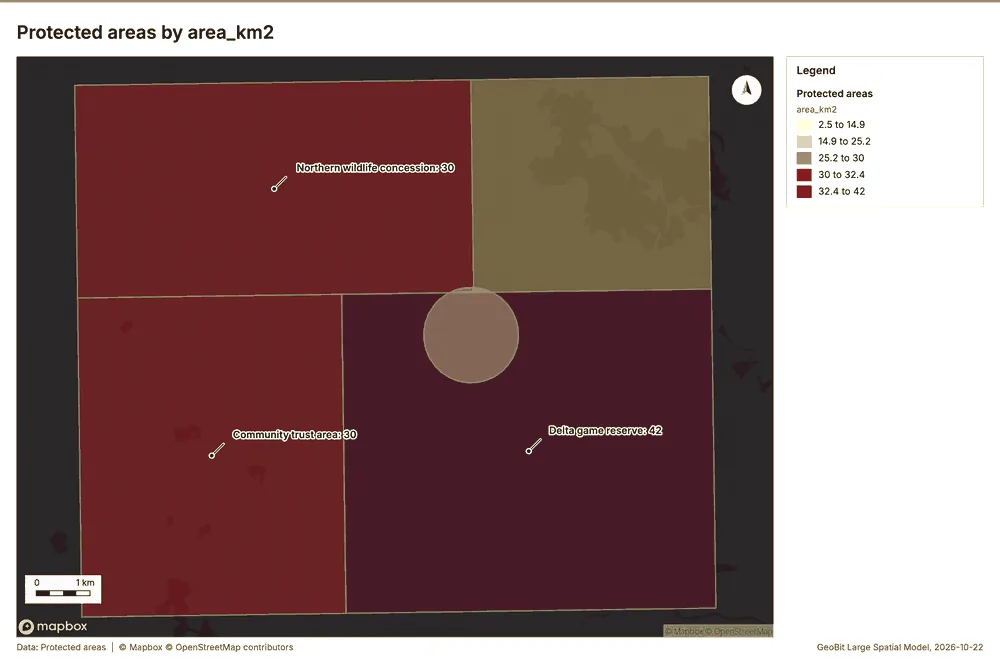
What this analysis is. Summarize within: Count and aggregate the features inside each polygon (or bin), proportionally for lines and polygons 36. In ArcGIS it is Summarize Within or Aggregate Points; in QGIS, native:countpointsinpolygon or native:sumlinelengths 36.
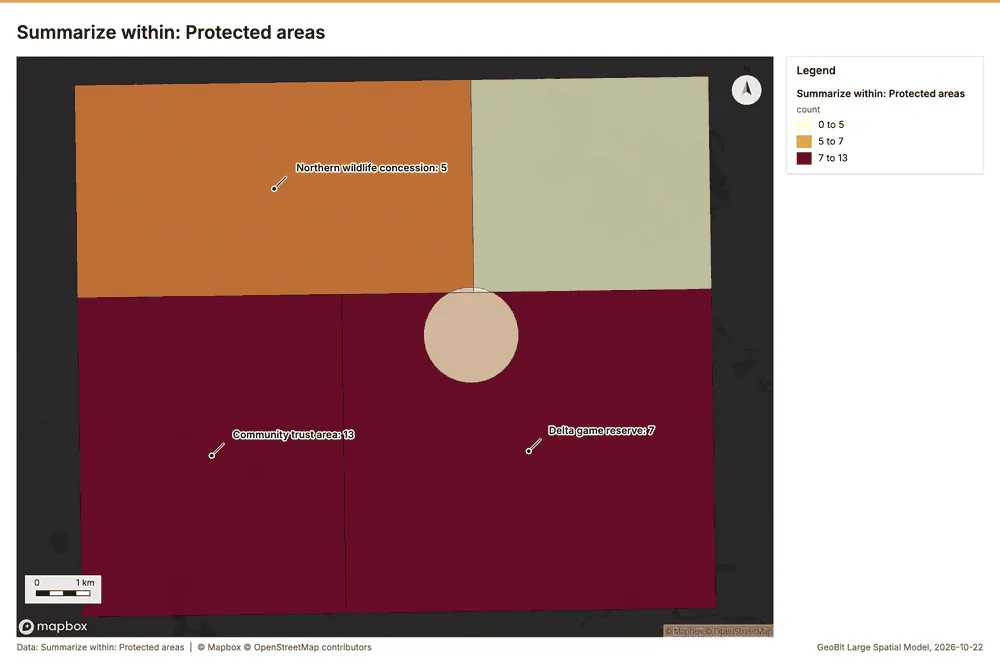
Why it was run on this data. Count Water points inside each feature of Protected areas by type; the counts map as a choropleth (natural breaks, sequential colors) 37.
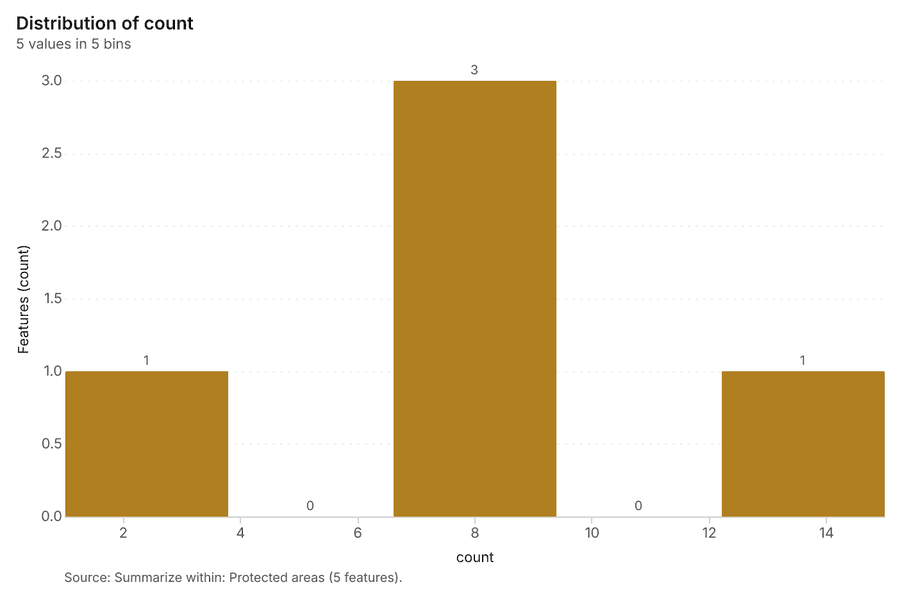
What it found. The gp_summarize_within tool was run using Water points 31 and
| Result | Value |
|---|---|
| result, count | 5 |
| result, elapsed ms | 0 |
| billing, cost | 0.0106 |
| billing, list price | 0.0106 |
| billing, upstream cost | 0 |
Findings
- Evidenced: Summarize within on Water points, Protected areas: Summarize within: 1 layer saved: Summarize within: Protected areas (5 features) 313839.
- Evidenced: It reported result, count 5; result, elapsed ms 0; billing, cost 0.0106; billing, list price 0.0106; billing, upstream cost 0 38.
Tool gp_summarize_within; parameters {"stats": [], "project": "750b4ce3-8424-4738-b383-c6a58973ae02", "features": {"layer": "Water points (2b4e30e1)"}, "group_by": "type", "polygons": {"layer": "Protected areas (446c314f)"}}
Summarize within
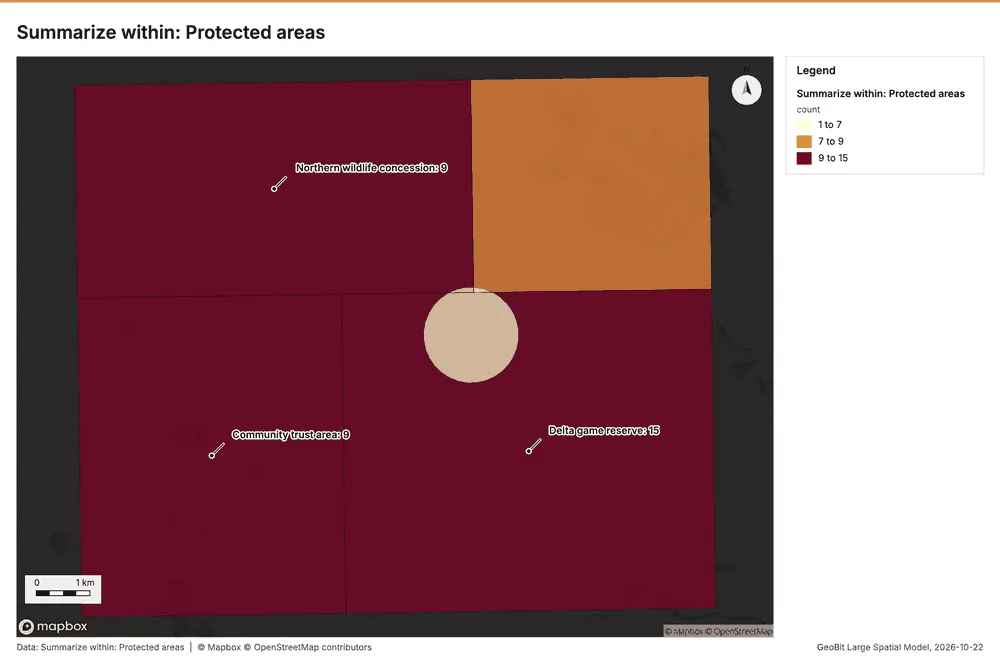
What this analysis is. Summarize within: Count and aggregate the features inside each polygon (or bin), proportionally for lines and polygons 36. In ArcGIS it is Summarize Within or Aggregate Points; in QGIS, native:countpointsinpolygon or native:sumlinelengths 36.
Why it was run on this data. Count Water points inside each feature of Protected areas by type; the counts map as a choropleth (natural breaks, sequential colors) 37.
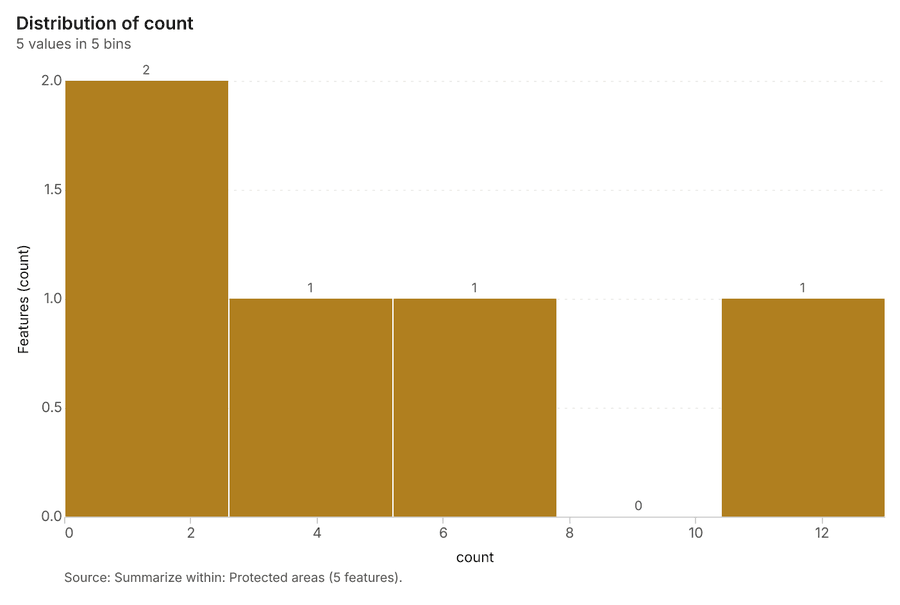
What it found. Summarize within on Camera traps, Protected areas: Summarize within: 1 layer saved: Summarize within: Protected areas (5 features) 193940. It reported result, count 5; result, elapsed ms 0; billing, cost 0.0109; billing, list price 0.0109; billing, upstream cost 0 40.
| Result | Value |
|---|---|
| result, count | 5 |
| result, elapsed ms | 0 |
| billing, cost | 0.0109 |
| billing, list price | 0.0109 |
| billing, upstream cost | 0 |
Findings
- Evidenced: Summarize within on Camera traps, Protected areas: Summarize within: 1 layer saved: Summarize within: Protected areas (5 features) 193940.
- Evidenced: It reported result, count 5; result, elapsed ms 0; billing, cost 0.0109; billing, list price 0.0109; billing, upstream cost 0 40.
Tool gp_summarize_within; parameters {"stats": [], "project": "750b4ce3-8424-4738-b383-c6a58973ae02", "features": {"layer": "Camera traps (2952931c)"}, "group_by": "working", "polygons": {"layer": "Protected areas (446c314f)"}}
Summarize within
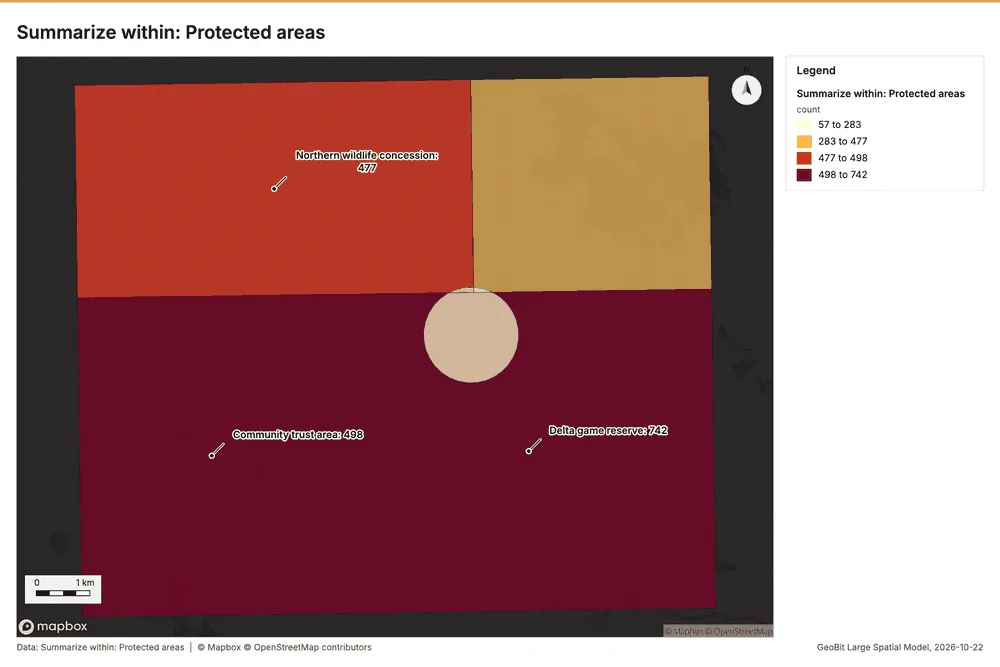
What this analysis is. Summarize within: Count and aggregate the features inside each polygon (or bin), proportionally for lines and polygons 36. In ArcGIS it is Summarize Within or Aggregate Points; in QGIS, native:countpointsinpolygon or native:sumlinelengths 36.
Why it was run on this data. Count Water points inside each feature of Protected areas by type; the counts map as a choropleth (natural breaks, sequential colors) 37.
What it found. The gp_summarize_within function was executed using Wildlife sightings 10 and Protected areas 39 as
| Result | Value |
|---|---|
| result, count | 5 |
| result, elapsed ms | 3 |
| billing, cost | 0.05012 |
| billing, list price | 0.05012 |
| billing, upstream cost | 0 |
Findings
- Evidenced: Summarize within on Wildlife sightings, Protected areas: Summarize within: 1 layer saved: Summarize within: Protected areas (5 features) 103941.
- Evidenced: It reported result, count 5; result, elapsed ms 3; billing, cost 0.05012; billing, list price 0.05012; billing, upstream cost 0 41.
Tool gp_summarize_within; parameters {"stats": [{"stat": "sum", "field": "count"}], "project": "750b4ce3-8424-4738-b383-c6a58973ae02", "features": {"layer": "Wildlife sightings (49c8e07e)"}, "group_by": "species", "polygons": {"layer": "Protected areas (446c314f)"}}
Find point clusters
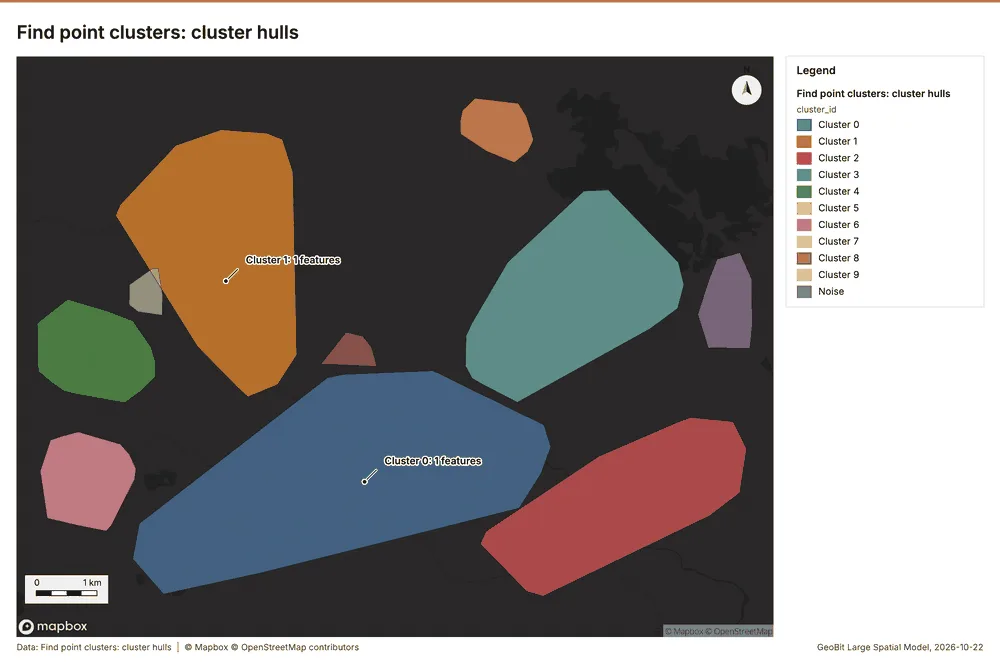
What this analysis is. Find point clusters: Density-based clusters (DBSCAN, HDBSCAN or OPTICS, optionally space-time) with hulls and noise 42. In ArcGIS it is Find Point Clusters or Density-based Clustering; in QGIS, native:dbscanclustering or native:stdbscanclustering 42.
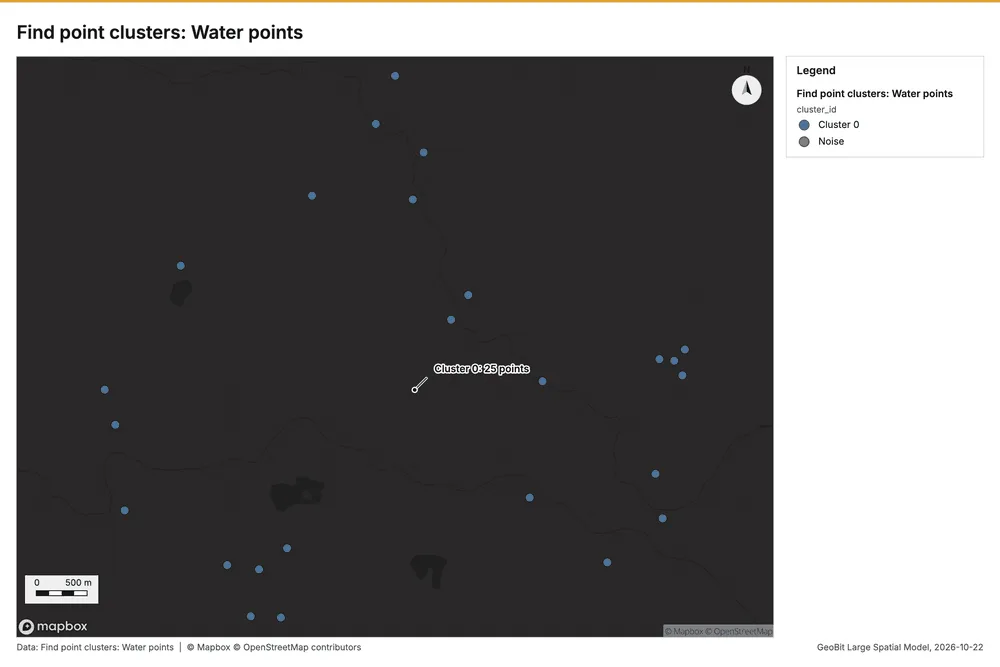
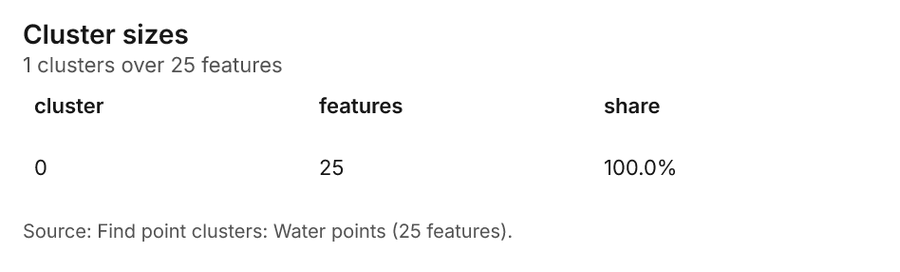
Why it was run on this data. DBSCAN finds dense groups of Water points and separates noise 43.
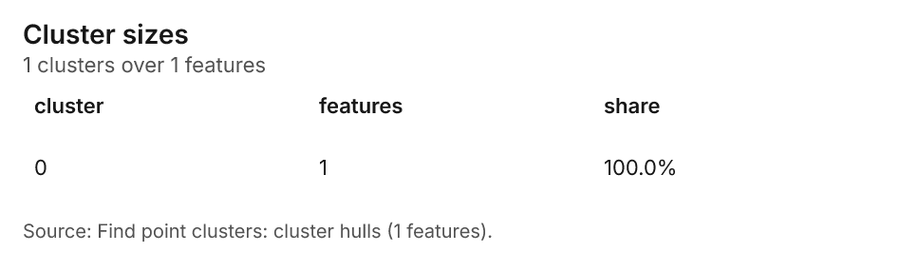
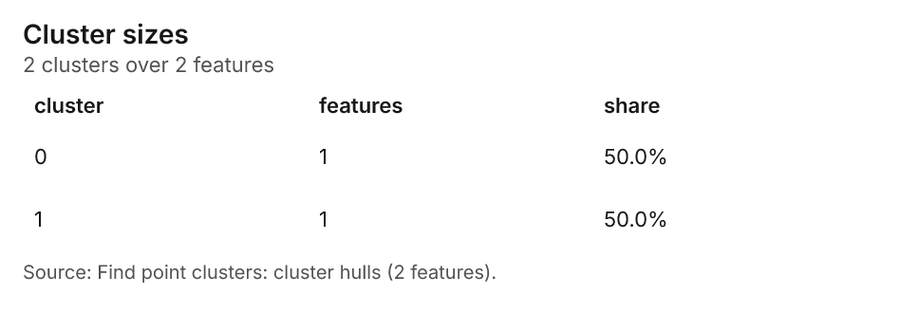
What it found. Find point clusters on Water points: Find point clusters: 2 layers saved: Find point clusters: Water points (25 features); Find point clusters: cluster hulls (1 feature) 3144. It reported result, count 25; result, noise 0; result, distance m 2,000; result, elapsed ms 5; result, min points 3; billing, cost 0.0505 44.
| Result | Value |
|---|---|
| result, count | 25 |
| result, noise | 0 |
| result, distance m | 2,000 |
| result, elapsed ms | 5 |
| result, min points | 3 |
| billing, cost | 0.0505 |
| billing, list price | 0.0505 |
| billing, upstream cost | 0 |
Findings
- Evidenced: Find point clusters on Water points: Find point clusters: 2 layers saved: Find point clusters: Water points (25 features); Find point clusters: cluster hulls (1 feature) 3144.
- Evidenced: It reported result, count 25; result, noise 0; result, distance m 2,000; result, elapsed ms 5; result, min points 3; billing, cost 0.0505 44.
Tool gp_find_point_clusters; parameters {"method": "dbscan", "project": "750b4ce3-8424-4738-b383-c6a58973ae02", "features": {"layer": "Water points (2b4e30e1)"}, "distance_m": 2000.0, "min_points": 3}
Find point clusters
What this analysis is. Find point clusters: Density-based clusters (DBSCAN, HDBSCAN or OPTICS, optionally space-time) with hulls and noise 42. In ArcGIS it is Find Point Clusters or Density-based Clustering; in QGIS, native:dbscanclustering or native:stdbscanclustering 42.
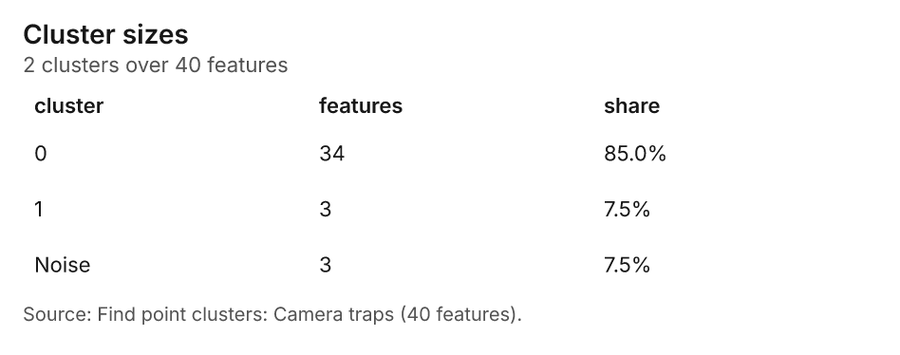
Why it was run on this data. DBSCAN finds dense groups of Camera traps and separates noise 45.
What it found. Find point clusters on Camera traps: Find point clusters: 2 layers saved: Find point clusters: Camera traps (40 features); Find point clusters: cluster hulls (2 features) 1946. It reported result, count 40; result, noise 3; result, distance m 2,000; result, elapsed ms 2; result, min points 3; billing, cost 0.0508 46.
| Result | Value |
|---|---|
| result, count | 40 |
| result, noise | 3 |
| result, distance m | 2,000 |
| result, elapsed ms | 2 |
| result, min points | 3 |
| billing, cost | 0.0508 |
| billing, list price | 0.0508 |
| billing, upstream cost | 0 |
Findings
- Evidenced: Find point clusters on Camera traps: Find point clusters: 2 layers saved: Find point clusters: Camera traps (40 features); Find point clusters: cluster hulls (2 features) 1946.
- Evidenced: It reported result, count 40; result, noise 3; result, distance m 2,000; result, elapsed ms 2; result, min points 3; billing, cost 0.0508 46.
Tool gp_find_point_clusters; parameters {"method": "dbscan", "project": "750b4ce3-8424-4738-b383-c6a58973ae02", "features": {"layer": "Camera traps (2952931c)"}, "distance_m": 2000.0, "min_points": 3}
Find point clusters
What this analysis is. Find point clusters: Density-based clusters (DBSCAN, HDBSCAN or OPTICS, optionally space-time) with hulls and noise 42. In ArcGIS it is Find Point Clusters or Density-based Clustering; in QGIS, native:dbscanclustering or native:stdbscanclustering 42.
Why it was run on this data. DBSCAN finds dense groups of Wildlife sightings and separates noise 47.
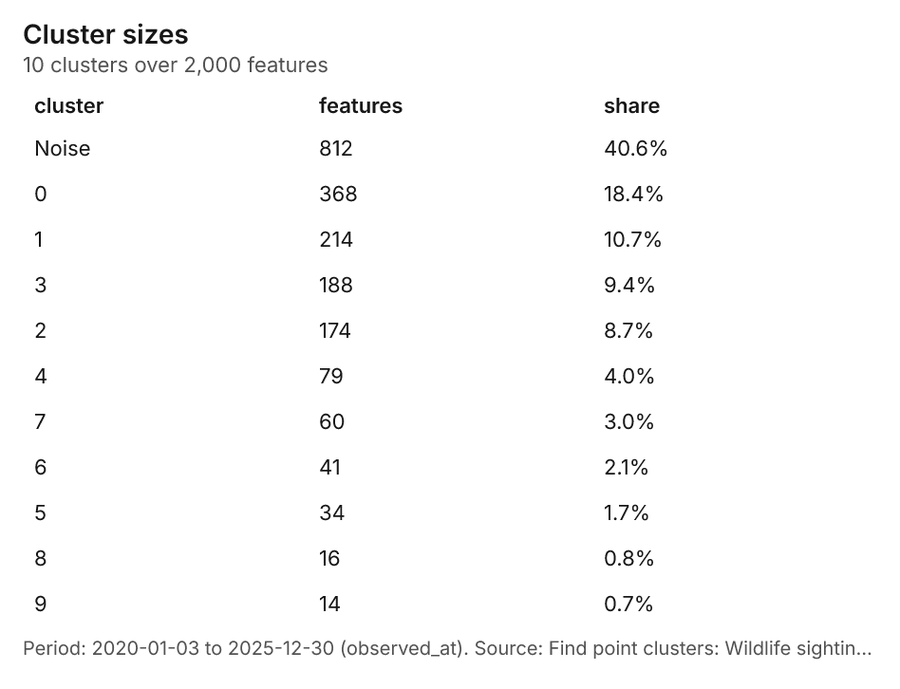
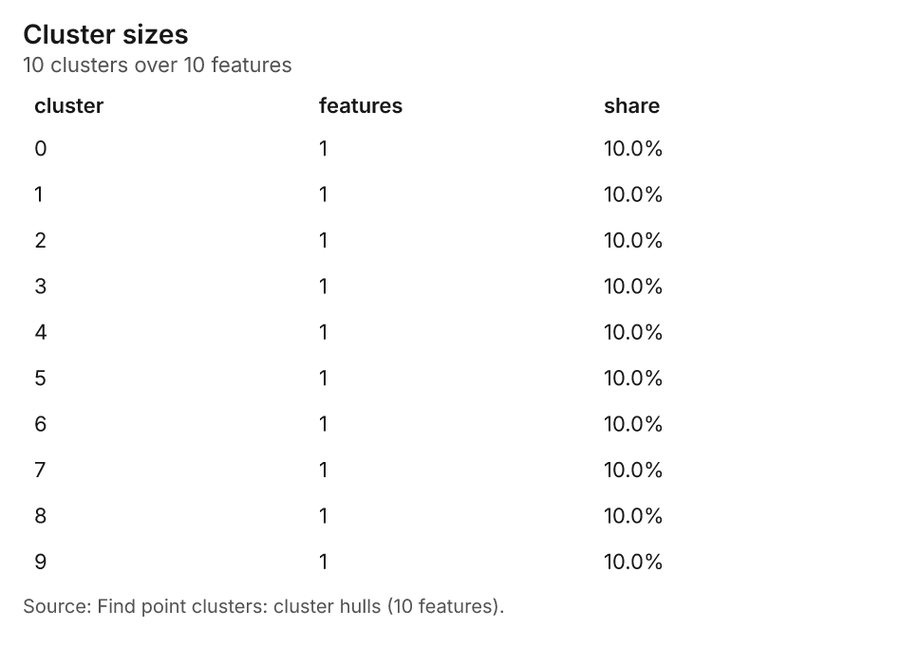
What it found. Find point clusters on Wildlife sightings: Find point clusters: 2 layers saved: Find point clusters: Wildlife sightings (2000 features); Find point clusters: cluster hulls (10 features) 1048. It reported result, count 2,000; result, noise 812; result, distance m 500; result, elapsed ms 208; result, min points 20; billing, cost 0.09 48.
| Result | Value |
|---|---|
| result, count | 2,000 |
| result, noise | 812 |
| result, distance m | 500 |
| result, elapsed ms | 208 |
| result, min points | 20 |
| billing, cost | 0.09 |
| billing, list price | 0.09 |
| billing, upstream cost | 0 |
Findings
- Evidenced: Find point clusters on Wildlife sightings: Find point clusters: 2 layers saved: Find point clusters: Wildlife sightings (2000 features); Find point clusters: cluster hulls (10 features) 1048.
- Evidenced: It reported result, count 2,000; result, noise 812; result, distance m 500; result, elapsed ms 208; result, min points 20; billing, cost 0.09 48.
Tool gp_find_point_clusters; parameters {"method": "dbscan", "project": "750b4ce3-8424-4738-b383-c6a58973ae02", "features": {"layer": "Wildlife sightings (49c8e07e)"}, "distance_m": 500.0, "min_points": 20}
Zonal statistics
What this analysis is. Zonal statistics: count/min/max/mean/std/sum/median/majority per polygon as a table and as GeoJSON 49. In ArcGIS it is Zonal Statistics as Table (polygons) 49.
Why it was run on this data. Statistics of Habitat scene 2020-09-15 inside each feature of Protected areas 50.
What it found. The analysis utilized the Zonal statistics tool, identified as rs_zonal_statistics 51. The resulting zonal statistics summary documented 5 row(s) 51. This process analyzed the data across 5 zones 51.
Findings
Tool rs_zonal_statistics; parameters {"stats": ["mean", "min", "max", "std"], "zones": "Protected areas (446c314f)", "raster_id": "Habitat scene 2020-09-15 (de16b11c)"}
Zonal statistics
What this analysis is. Zonal statistics: count/min/max/mean/std/sum/median/majority per polygon as a table and as GeoJSON 49. In ArcGIS it is Zonal Statistics as Table (polygons) 49.
Why it was run on this data. Statistics of Habitat scene 2020-09-15 inside each feature of Protected areas 50.
What it found. Zonal statistics were applied utilizing the rs_zonal_statistics tool 52. The tool summary indicates that the analysis resulted in 5 row(s) 52. Additionally, the analysis covered 5 zones 52.
Findings
Tool rs_zonal_statistics; parameters {"stats": ["mean", "min", "max", "std"], "zones": "Protected areas (446c314f)", "raster_id": "Habitat scene 2025-09-15 (f6387687)"}
Index change
What this analysis is. Spectral index change: Change of a spectral index (NDVI, NDWI, NDBI, NBR …) or a band expression between two images: before, after and difference rasters, decrease / increase classes beyond the threshold with polygons and areas; NBR also gives dNBR with burn severity classes 22.
Why it was run on this data. Index change between Habitat scene 2020-09-15 (2020-09-15) and Habitat scene 2025-09-15 (2025-09-15): the changed area, with the changed places as polygons 23.
What it found. Index change: Spectral index change: created NDVI change Habitat scene 2020-09-15 to Habitat scene 2025-09-15 (300 x 250 cells, 40.00 m) 53. plus 1 more raster layer(s) 53. and layer NDVI change polygons with 984 feature(s) 53. mean before 0.5613; mean after 0.4592; mean difference -0.1022; decrease ha 2,822; increase ha 185.28 53. It reported stats, polygons 984; stats, mean after 0.4592; stats, decrease ha 2,822; stats, increase ha 185.3; stats, mean before 0.5613; stats, masked pixels 0 53.
| Result | Value |
|---|---|
| stats, polygons | 984 |
| stats, mean after | 0.4592 |
| stats, decrease ha | 2,822 |
| stats, increase ha | 185.3 |
| stats, mean before | 0.5613 |
| stats, masked pixels | 0 |
| stats, mean difference | -0.1022 |
| elapsed ms | 500 |
Findings
- Evidenced: Index change: Spectral index change: created NDVI change Habitat scene 2020-09-15 to Habitat scene 2025-09-15 (300 x 250 cells, 40.00 m) 53.
- Evidenced: plus 1 more raster layer(s) 53.
- Evidenced: and layer NDVI change polygons with 984 feature(s) 53.
- Evidenced: mean before 0.5613; mean after 0.4592; mean difference -0.1022; decrease ha 2,822; increase ha 185.28 53.
- Evidenced: It reported stats, polygons 984; stats, mean after 0.4592; stats, decrease ha 2,822; stats, increase ha 185.3; stats, mean before 0.5613; stats, masked pixels 0 53.
Tool im_index_change; parameters {"after_id": "Habitat scene 2025-09-15 (f6387687)", "polygons": true, "before_id": "Habitat scene 2020-09-15 (de16b11c)"}
Compute change raster
What this analysis is. Compute change raster: Pixel value or spectral change between two co-registered images: difference, relative difference, absolute difference, log ratio (radar, dB), Euclidean spectral distance, spectral angle (radians) or the band with most change 25.
Why it was run on this data. A change raster between Habitat scene 2020-09-15 (2020-09-15) and Habitat scene 2025-09-15 (2025-09-15): where and how much the pixels changed 26.
What it found. Compute change raster: Compute change raster: created Difference Habitat scene 2020-09-15 to Habitat scene 2025-09-15 (300 x 250 cells, 40.00 m) 54. mean 0.01608; std 0.03381; min -0.04; max 0.15; masked pixels 0 54. It reported stats, max 0.15; stats, min -0.04; stats, std 0.03381; stats, mean 0.01608; stats, masked pixels 0; elapsed ms 124 54.
| Result | Value |
|---|---|
| stats, max | 0.15 |
| stats, min | -0.04 |
| stats, std | 0.03381 |
| stats, mean | 0.01608 |
| stats, masked pixels | 0 |
| elapsed ms | 124 |
Findings
- Evidenced: Compute change raster: Compute change raster: created Difference Habitat scene 2020-09-15 to Habitat scene 2025-09-15 (300 x 250 cells, 40.00 m) 54.
- Evidenced: mean 0.01608; std 0.03381; min -0.04; max 0.15; masked pixels 0 54.
- Evidenced: It reported stats, max 0.15; stats, min -0.04; stats, std 0.03381; stats, mean 0.01608; stats, masked pixels 0; elapsed ms 124 54.
Tool im_compute_change_raster; parameters {"after_id": "Habitat scene 2025-09-15 (f6387687)", "before_id": "Habitat scene 2020-09-15 (de16b11c)"}
Maps and charts
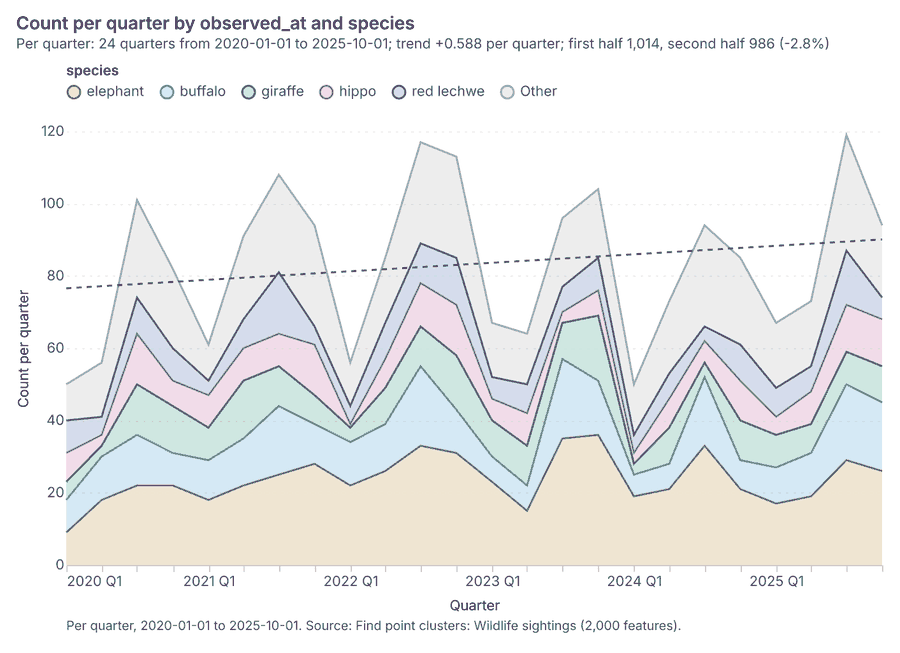
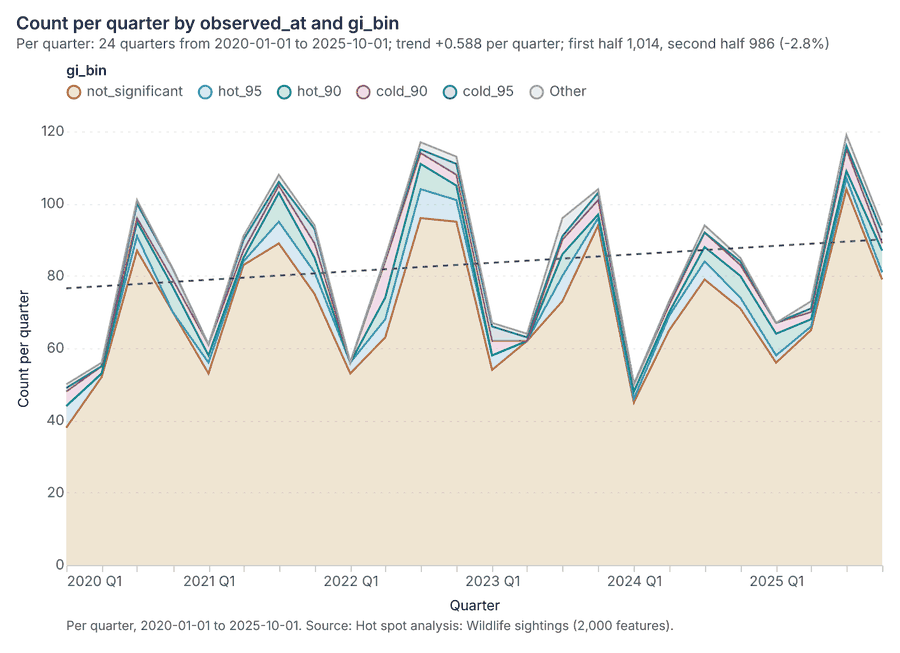
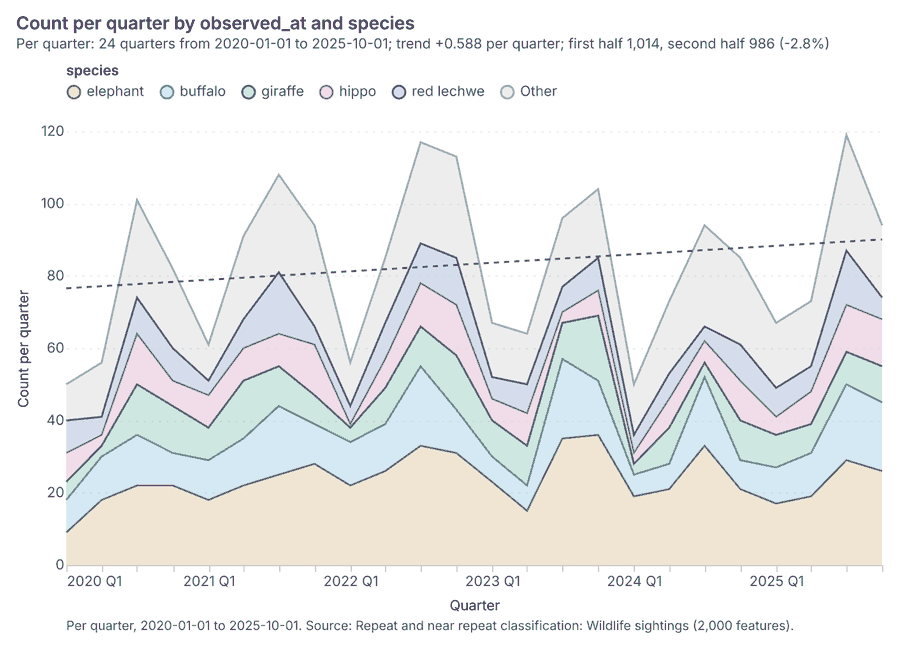
The run also made 25 map image(s) 55565758596061626364656667686970717273747576777879 and 25 chart(s) 8081828384858687888990919293949596979899100101102103104.
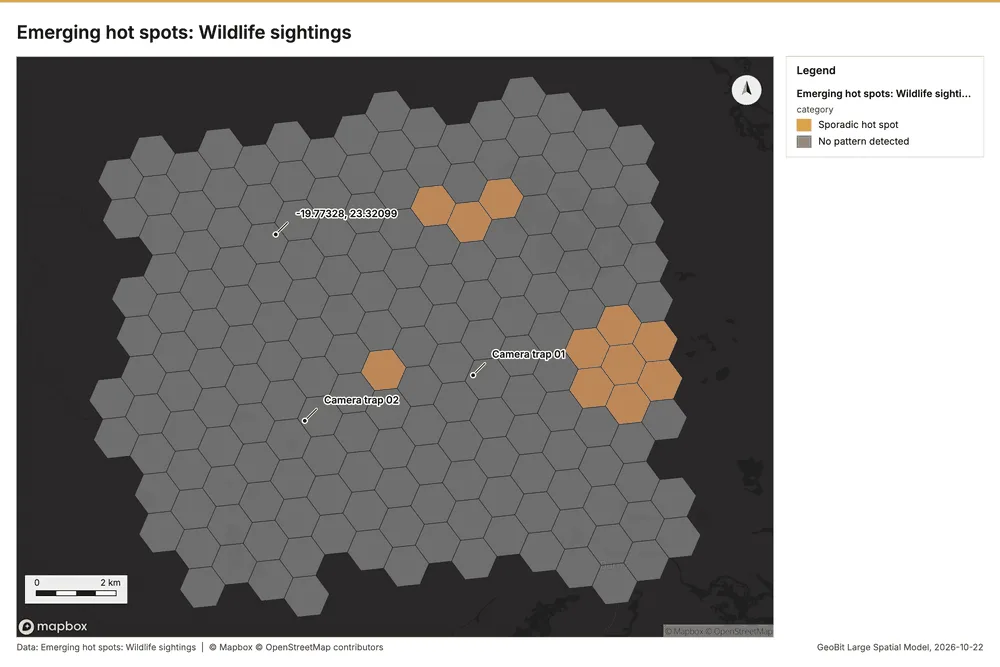
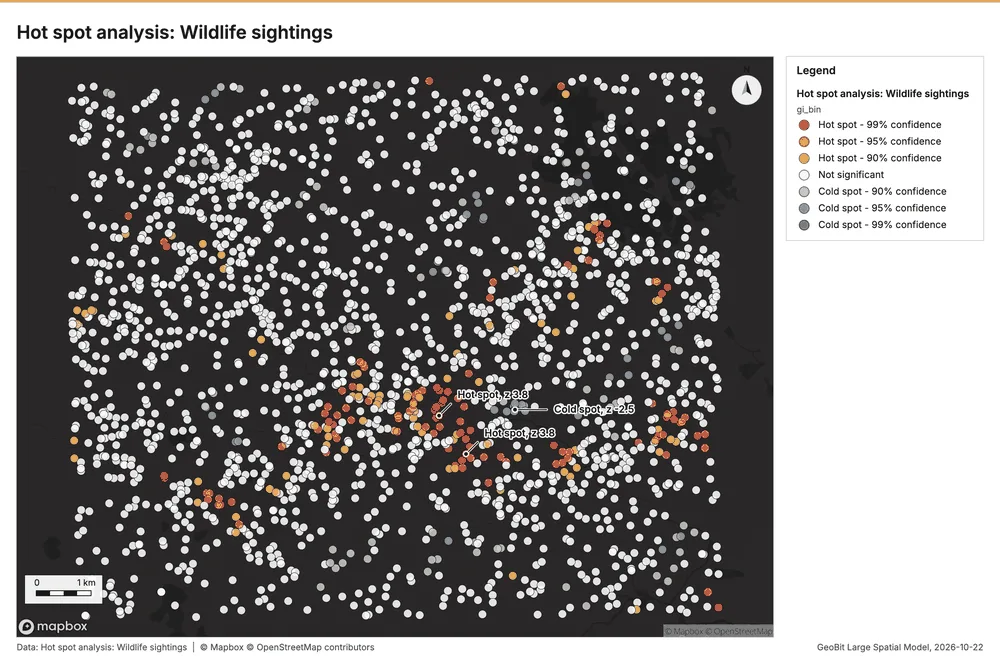
What the map shows. The map illustrates the presence of potential wildlife hot spots based on the 55
Inferred: read from the image by gemma4:e4b, not evidence.
Changes since the last run
This is the first report of this project.
Sources
- 1Rendering: Chart: Timeline: events per quarter by dataset. 128 rows id 0724d535-2e2e-4bb7-b82c-698b724a5b84
- 2Dataset: Wildlife sightings. vector, 2000 rows id 9a6b5c20-62ec-407e-8ddc-4a0caffd3d78
- 3Dataset: Patrol tracks. vector, 150 rows id 814d9a40-6257-4402-aefd-0471b089fe13
- 4Dataset: Patrol effort by month. table, 120 rows id 7ff2c071-222a-49b6-9c45-0ab36a6fa275
- 5Dataset: Transect counts by year. table, 256 rows id 19804e2c-33c7-475b-976e-0a261338d7ca
- 6Tool result: gp_change_point_detection, step 2. Change point detection: done; no map output. id ae9291dd-465c-483c-82b1-be209e5ed950:2
- 7Catalog: Emerging hot spots (operation catalog, gp_space_time_hot_spots). Where hot spots are new, consecutive, intensifying, persistent, diminishing, sporadic, oscillating or historical over time. ArcGIS: Emerging Hot Spot Analysis, Create Space Time Cube. id gp_space_time_hot_spots
- 8Plan: Space time hot spots of Wildlife sightings (the Start plan's candidate c_410f48d3d771). Wildlife sightings carry dates in 'observed_at': emerging hot spot analysis finds new, intensifying and fading hot spots per month. id 41c286e6-f1de-4fb3-ab1e-55065e9e3167:c_410f48d3d771
- 9Tool result: gp_space_time_hot_spots, step 0. Emerging hot spots: 1 layer saved: Emerging hot spots: Wildlife sightings (187 features). id ae9291dd-465c-483c-82b1-be209e5ed950:0
- 10Layer: Wildlife sightings. 2,000 features id 49c8e07e-b766-4e5c-87e7-a09af4f67da6
- 11Catalog: Repeat and near repeat classification (operation catalog, gp_near_repeat). Classify incidents as originators, repeats (same place) or near repeats within a distance and time window, with a Knox test table. ArcGIS: Repeat and Near Repeat Classification, Near Repeat Calculator. id gp_near_repeat
- 12Plan: Near repeat of Wildlife sightings (the Start plan's candidate c_90899865dc1b). Near repeat analysis tests whether Wildlife sightings close in space also follow each other within 30 days. id 41c286e6-f1de-4fb3-ab1e-55065e9e3167:c_90899865dc1b
- 13Tool result: gp_near_repeat, step 1. Repeat and near repeat classification: 1 layer saved: Repeat and near repeat classification: Wildlife sightings (2000 features). id ae9291dd-465c-483c-82b1-be209e5ed950:1
- 14Catalog: Change point detection (operation catalog, gp_change_point_detection). When did the level, count, trend or variability change? For the whole study area or for every bin. ArcGIS: Change Point Detection. id gp_change_point_detection
- 15Plan: Change points of Wildlife sightings (the Start plan's candidate c_732496fb9369). Change point detection finds when the monthly count of Wildlife sightings shifted. id 41c286e6-f1de-4fb3-ab1e-55065e9e3167:c_732496fb9369
- 16Catalog: Hot spot analysis (operation catalog, gp_hot_spots). Getis-Ord Gi* hot and cold spots with z-scores, p-values and confidence bins. ArcGIS: Find Hot Spots, Hot Spot Analysis (Getis-Ord Gi*). QGIS: qgis:hotspot (plugin). id gp_hot_spots
- 17Plan: Hot spots of Camera traps (the Start plan's candidate c_7aa48c367385). 40 points: Getis-Ord Gi* tests whether the concentrations in Camera traps are statistically significant. id 41c286e6-f1de-4fb3-ab1e-55065e9e3167:c_7aa48c367385
- 18Tool result: gp_hot_spots, step 0. Hot spot analysis: 1 layer saved: Hot spot analysis: Camera traps (11 features). id c80e3725-e679-4389-b91c-8fcf60553593:0
- 19Layer: Camera traps. 40 features id 2952931c-dfd9-4179-ac00-717ec101503d
- 20Plan: Hot spots of Wildlife sightings (the Start plan's candidate c_1dd1e67c3631). 2000 points: Getis-Ord Gi* tests whether the concentrations in Wildlife sightings are statistically significant. id 41c286e6-f1de-4fb3-ab1e-55065e9e3167:c_1dd1e67c3631
- 21Tool result: gp_hot_spots, step 1. Hot spot analysis: 1 layer saved: Hot spot analysis: Wildlife sightings (2000 features). id c80e3725-e679-4389-b91c-8fcf60553593:1
- 22Catalog: Spectral index change (analysis catalog, im_index_change). Change of a spectral index (NDVI, NDWI, NDBI, NBR ...) or a band expression between two images: before, after and difference rasters, decrease / increase classes beyond the threshold with polygons and areas; NBR also gives dNBR with burn severity classes. id im_index_change
- 23Plan: Index change of Habitat scene 2020-09-15 and Habitat scene 2025-09-15 (the Start plan's candidate c_f9c63f3ce298). Index change between Habitat scene 2020-09-15 (2020-09-15) and Habitat scene 2025-09-15 (2025-09-15): the changed area, with the changed places as polygons. id 41c286e6-f1de-4fb3-ab1e-55065e9e3167:c_f9c63f3ce298
- 24Tool result: im_index_change, step 0. Spectral index change: created NDVI change Habitat scene 2020-09-15 to Habitat scene 2025-09-15 (300 x 250 cells, 40.00 m). plus 1 more raster layer(s). and layer NDVI change polygons with 984 feature(s). mean before 0.5613; mean after 0.4592; mean difference -0.1022; decrease ha 2,822; increase ha id 25b17de9-ec4a-4fc2-a10c-3cc5543c313b:0
- 25Catalog: Compute change raster (analysis catalog, im_compute_change_raster). Pixel value or spectral change between two co-registered images: difference, relative difference, absolute difference, log ratio (radar, dB), Euclidean spectral distance, spectral angle (radians) or the band with most change. Clouds and shadows are masked when the images have id im_compute_change_raster
- 26Plan: Compute change raster of Habitat scene 2020-09-15 and Habitat scene 2025-09-15 (the Start plan's candidate c_64fec8a79a74). A change raster between Habitat scene 2020-09-15 (2020-09-15) and Habitat scene 2025-09-15 (2025-09-15): where and how much the pixels changed. id 41c286e6-f1de-4fb3-ab1e-55065e9e3167:c_64fec8a79a74
- 27Tool result: im_compute_change_raster, step 1. Compute change raster: created Difference Habitat scene 2020-09-15 to Habitat scene 2025-09-15 (300 x 250 cells, 40.00 m). mean 0.01608; std 0.03381; min -0.04; max 0.15; masked pixels 0. id 25b17de9-ec4a-4fc2-a10c-3cc5543c313b:1
- 28Catalog: Calculate density (operation catalog, gp_calculate_density). Kernel density per square kilometer on a grid. ArcGIS: Calculate Density, Kernel Density. QGIS: native:heatmapkerneldensityestimation. id gp_calculate_density
- 29Plan: Kernel density of Water points (the Start plan's candidate c_8769ce6eb6cd). 25 points in Water points: a density surface shows where they concentrate. id 41c286e6-f1de-4fb3-ab1e-55065e9e3167:c_8769ce6eb6cd
- 30Tool result: gp_calculate_density, step 0. Calculate density: 1 layer saved: Calculate density: Water points (67 features). id 01964fe7-6064-4d8e-821d-2f1fc44a40a7:0
- 31Layer: Water points. 25 features id 2b4e30e1-0347-4c58-b093-eb060c234f8b
- 32Plan: Kernel density of Camera traps (the Start plan's candidate c_04d8c646d639). 40 points in Camera traps: a density surface shows where they concentrate. id 41c286e6-f1de-4fb3-ab1e-55065e9e3167:c_04d8c646d639
- 33Tool result: gp_calculate_density, step 1. Calculate density: 1 layer saved: Calculate density: Camera traps (95 features). id 01964fe7-6064-4d8e-821d-2f1fc44a40a7:1
- 34Plan: Kernel density of Wildlife sightings (the Start plan's candidate c_e2212fdd849b). 2000 points in Wildlife sightings: a density surface shows where they concentrate. id 41c286e6-f1de-4fb3-ab1e-55065e9e3167:c_e2212fdd849b
- 35Tool result: gp_calculate_density, step 2. Calculate density: 1 layer saved: Calculate density: Wildlife sightings (3384 features). id 01964fe7-6064-4d8e-821d-2f1fc44a40a7:2
- 36Catalog: Summarize within (operation catalog, gp_summarize_within). Count and aggregate the features inside each polygon (or bin), proportionally for lines and polygons. ArcGIS: Summarize Within, Aggregate Points. QGIS: native:countpointsinpolygon, native:sumlinelengths. id gp_summarize_within
- 37Plan: Water points per feature of Protected areas (the Start plan's candidate c_04513400fd64). Count Water points inside each feature of Protected areas by type; the counts map as a choropleth (natural breaks, sequential colors). id 41c286e6-f1de-4fb3-ab1e-55065e9e3167:c_04513400fd64
- 38Tool result: gp_summarize_within, step 0. Summarize within: 1 layer saved: Summarize within: Protected areas (5 features). id 6776e53d-c51a-4c30-9da5-d711d9628f48:0
- 39Layer: Protected areas. 5 features id 446c314f-bc35-4126-af57-469e6d5aa55b
- 40Tool result: gp_summarize_within, step 1. Summarize within: 1 layer saved: Summarize within: Protected areas (5 features). id 6776e53d-c51a-4c30-9da5-d711d9628f48:1
- 41Tool result: gp_summarize_within, step 2. Summarize within: 1 layer saved: Summarize within: Protected areas (5 features). id 6776e53d-c51a-4c30-9da5-d711d9628f48:2
- 42Catalog: Find point clusters (operation catalog, gp_find_point_clusters). Density-based clusters (DBSCAN, HDBSCAN or OPTICS, optionally space-time) with hulls and noise. ArcGIS: Find Point Clusters, Density-based Clustering. QGIS: native:dbscanclustering, native:stdbscanclustering. id gp_find_point_clusters
- 43Plan: Cluster points of Water points (the Start plan's candidate c_e10b266f027d). DBSCAN finds dense groups of Water points and separates noise. id 41c286e6-f1de-4fb3-ab1e-55065e9e3167:c_e10b266f027d
- 44Tool result: gp_find_point_clusters, step 0. Find point clusters: 2 layers saved: Find point clusters: Water points (25 features); Find point clusters: cluster hulls (1 feature). id 0c30535f-d016-409b-b4ab-3f26aba08abc:0
- 45Plan: Cluster points of Camera traps (the Start plan's candidate c_008a367bf2dc). DBSCAN finds dense groups of Camera traps and separates noise. id 41c286e6-f1de-4fb3-ab1e-55065e9e3167:c_008a367bf2dc
- 46Tool result: gp_find_point_clusters, step 1. Find point clusters: 2 layers saved: Find point clusters: Camera traps (40 features); Find point clusters: cluster hulls (2 features). id 0c30535f-d016-409b-b4ab-3f26aba08abc:1
- 47Plan: Cluster points of Wildlife sightings (the Start plan's candidate c_5e77fd8554c0). DBSCAN finds dense groups of Wildlife sightings and separates noise. id 41c286e6-f1de-4fb3-ab1e-55065e9e3167:c_5e77fd8554c0
- 48Tool result: gp_find_point_clusters, step 2. Find point clusters: 2 layers saved: Find point clusters: Wildlife sightings (2000 features); Find point clusters: cluster hulls (10 features). id 0c30535f-d016-409b-b4ab-3f26aba08abc:2
- 49Catalog: Zonal statistics (analysis catalog, rs_zonal_statistics). count/min/max/mean/std/sum/median/majority per polygon as a table and as GeoJSON. ArcGIS: Zonal Statistics as Table (polygons). id rs_zonal_statistics
- 50Plan: Zonal statistics of Habitat scene 2020-09-15 and Protected areas (the Start plan's candidate c_70c74078ffd8). Statistics of Habitat scene 2020-09-15 inside each feature of Protected areas. id 41c286e6-f1de-4fb3-ab1e-55065e9e3167:c_70c74078ffd8
- 51Tool result: rs_zonal_statistics, step 0. Zonal statistics: 5 row(s). zones 5. id 0285f5a2-ee85-41f6-8973-17e457b19d16:0
- 52Tool result: rs_zonal_statistics, step 1. Zonal statistics: 5 row(s). zones 5. id 0285f5a2-ee85-41f6-8973-17e457b19d16:1
- 53Tool result: im_index_change, step 0. Spectral index change: created NDVI change Habitat scene 2020-09-15 to Habitat scene 2025-09-15 (300 x 250 cells, 40.00 m). plus 1 more raster layer(s). and layer NDVI change polygons with 984 feature(s). mean before 0.5613; mean after 0.4592; mean difference -0.1022; decrease ha 2,822; increase ha id d6cae56b-660a-4f0f-8c67-4f9de89853d8:0
- 54Tool result: im_compute_change_raster, step 1. Compute change raster: created Difference Habitat scene 2020-09-15 to Habitat scene 2025-09-15 (300 x 250 cells, 40.00 m). mean 0.01608; std 0.03381; min -0.04; max 0.15; masked pixels 0. id d6cae56b-660a-4f0f-8c67-4f9de89853d8:1
- 55Rendering: Map: Emerging hot spots: Wildlife sightings id 9c331cfd-4983-4a73-9cb8-323c32e4aa1a
- 56Rendering: Map: Repeat and near repeat classification: Wildlife sightings id 54dedce7-b568-41ed-8a3e-2f16e78eef00
- 57Rendering: Map: Hot spot analysis: Camera traps id cccc83e3-4db7-4fb9-8950-5bb38a673af5
- 58Rendering: Map: Hot spot analysis: Wildlife sightings id 10d58a93-f8d6-4c71-9a15-b562b40f6767
- 59Rendering: Map: NDVI change Habitat scene 2020-09-15 to Habitat scene 2025-09-15 id 8d6f1690-5b0d-4f4b-a7cd-cd5c4e8cf6ad
- 60Rendering: Map: NDVI decrease / increase id 15ba8d9d-bf64-4548-aaea-5c255f214c41
- 61Rendering: Map: NDVI change polygons id 940f75e7-4b4a-480a-8452-4e0055c12596
- 62Rendering: Map: Difference Habitat scene 2020-09-15 to Habitat scene 2025-09-15 id d642c322-d610-40f6-a2a4-680edf061662
- 63Rendering: Map: Calculate density: Water points id 5d0cbf7a-68de-42e2-ac67-cc0feb01919f
- 64Rendering: Map: Calculate density: Camera traps id 0131588b-7e0d-44b3-857c-6b7e3c992904
- 65Rendering: Map: Calculate density: Wildlife sightings id 4a1dfe19-c4df-4468-8985-e90b8be9a66a
- 66Rendering: Map: Summarize within: Protected areas id 8d6cfb31-1e7a-46c0-8b3b-14fcca86feb3
- 67Rendering: Map: Summarize within: Protected areas id ab4707fc-4ac2-4e7f-aace-3c12d9aefc49
- 68Rendering: Map: Summarize within: Protected areas id e92c8c09-d62d-4c61-a41e-9eab93106689
- 69Rendering: Map: Find point clusters: Water points id 2ef976fe-c86c-4852-8d50-e2334804cffb
- 70Rendering: Map: Find point clusters: cluster hulls id f0f01aa8-ceb0-4578-8cee-1fc54b125c7f
- 71Rendering: Map: Find point clusters: Camera traps id 68fe64f6-4d5e-4456-b415-8b0c5e137963
- 72Rendering: Map: Find point clusters: cluster hulls id 6fd1e101-3103-4507-8297-e61eceb58e4c
- 73Rendering: Map: Find point clusters: Wildlife sightings id e4f56f90-c90d-4bb8-8df9-27afdf318b33
- 74Rendering: Map: Find point clusters: cluster hulls id d1316f24-5049-469b-85c8-67c1984de3ec
- 75Rendering: Map: Protected areas by area_km2 id ac009abe-f117-45f7-bd9a-48427ea82fb6
- 76Rendering: Map: Change Analysis: NDVI change Habitat scene 2020-09-15 to Habitat scene 2025-09-15 id 8e0b0fa2-feed-49ea-ad2a-f565d878327d
- 77Rendering: Map: Change Analysis: NDVI decrease / increase id 91e47706-6cbf-4b9c-8ad1-484d35b3c7c6
- 78Rendering: Map: Change Analysis: NDVI change polygons id c91b140f-5f07-4863-a6c6-4e2c84bba5c8
- 79Rendering: Map: Change Analysis: Difference Habitat scene 2020-09-15 to Habitat scene 2025-09-15 id 005f6107-414f-4f41-87b6-5198fc10e839
- 80Rendering: Chart: Camera traps over time (installed_year). 1 rows id 11efc874-2e1c-49fb-8011-bc470de56923
- 81Rendering: Chart: Patrol tracks over time (date). 72 rows id 566504c3-02f8-45bc-a5af-5d3cfd7b26b1
- 82Rendering: Chart: Patrol effort by month over time (month). 120 rows id d26c312f-f3e6-410e-a665-caa60c2be84e
- 83Rendering: Chart: Transect counts by year over time (year). 116 rows id f30bd747-c4d1-4069-8332-200a119caf4a
- 84Rendering: Chart: Emerging hot spots: Wildlife sightings. 9 rows id 336187f6-9aa6-4fdb-a2b2-bcbd01a6d11f
- 85Rendering: Chart: Repeat and near repeat classification: Wildlife sightings. 144 rows id dfae20b3-c296-4b80-83de-7c8cfc621e38
- 86Rendering: Chart: Hot spot analysis: Camera traps. 6 rows id 632e8a2c-1eff-4f6a-985c-67a89d6a4947
- 87Rendering: Chart: Hot spot analysis: Wildlife sightings. 18 rows id 05576c19-da08-403f-8daa-289e88599168
- 88Rendering: Chart: NDVI change polygons. 11 rows id af589c3a-4e8f-4939-be0e-214f2b289c2e
- 89Rendering: Chart: Calculate density: Water points. 8 rows id 789e658b-0a46-4ccb-bb9f-0605baba7590
- 90Rendering: Chart: Calculate density: Camera traps. 8 rows id 194574a5-7da8-4372-9aab-0ed2c503366c
- 91Rendering: Chart: Calculate density: Wildlife sightings. 13 rows id 79663709-0cd5-4172-bc17-e223c6dbe444
- 92Rendering: Chart: Summarize within: Protected areas. 5 rows id 8141e260-100f-4d40-bc34-7e64674372da
- 93Rendering: Chart: Summarize within: Protected areas. 5 rows id 5b5cde74-67ec-4fb8-99ab-8c31a9c6e86e
- 94Rendering: Chart: Summarize within: Protected areas. 5 rows id c0ce8baf-5831-4348-9566-b519e6175395
- 95Rendering: Chart: Find point clusters: Water points. 1 rows id 9cf9975c-ea09-45a0-bdad-c7265f897ff2
- 96Rendering: Chart: Find point clusters: cluster hulls. 1 rows id 8da356a8-27a4-4bb9-84c2-9620eac3b532
- 97Rendering: Chart: Find point clusters: Camera traps. 3 rows id 89f781cf-b6ae-46e1-81a8-a915a2588c57
- 98Rendering: Chart: Find point clusters: cluster hulls. 2 rows id 64aebe57-1b31-48ca-9fc9-5f83f833cc53
- 99Rendering: Chart: Find point clusters: Wildlife sightings. 11 rows id 6b044701-7146-43e9-9a25-9a912c844922
- 100Rendering: Chart: Find point clusters: cluster hulls. 10 rows id da54ed0a-3d83-4640-bf04-d09c9c2ab1f2
- 101Rendering: Chart: NDVI change polygons. 11 rows id 6ae7db91-618b-4063-9d4a-e4c147eb49cc
- 102Rendering: Chart: Find point clusters: Wildlife sightings over time. 144 rows id c0d9a68a-73b7-4840-9446-0e8a318f3bdd
- 103Rendering: Chart: Hot spot analysis: Wildlife sightings over time. 144 rows id 78f16216-e0fa-4a2f-9c0a-c0f2476bc9a0
- 104Rendering: Chart: Repeat and near repeat classification: Wildlife sightings over time. 144 rows id 3241845c-4265-44df-bc31-31e0200b158c
- 105Dataset: Protected areas. vector, 5 rows id 1e486b97-508d-4337-ae50-e69a1b8ffb02
- 106Dataset: River channels. vector, 2 rows id 7315f4d9-c391-406c-bed2-14d9ab7690f0
- 107Dataset: Camera traps. vector, 40 rows id 6baeccec-3617-4b56-be6a-c455cd0fbafb
- 108Dataset: Water points. vector, 25 rows id 03d16489-5533-4abf-ac13-90fb1db77364
- 109Dataset: Habitat scene 2020-09-15. raster, ? rows id 5d31a198-7af1-43ff-b987-95e63692238f
- 110Dataset: Habitat scene 2025-09-15. raster, ? rows id c4cf3368-47bc-4215-9a15-2e33536e69ae
- 111Dataset: Annual wildlife monitoring report. document, ? rows id bc1ed059-741b-47ee-9e3d-4ea6e56612e1
- 112Record: Sample: Conservation, Okavango Delta near Maun id 750b4ce3-8424-4738-b383-c6a58973ae02
- 113Layer: Emerging hot spots: Wildlife sightings. 187 features id 25f740dd-9467-44c8-ac92-0b3093bb596c
- 114Layer: Repeat and near repeat classification: Wildlife sightings. 2,000 features id b3ca8ebf-0745-4ec4-8a45-bbe2a690f0db
- 115Layer: Hot spot analysis: Camera traps. 11 features id e7a89409-c9ed-463d-823f-677e22ab631c
- 116Layer: Hot spot analysis: Wildlife sightings. 2,000 features id f319351b-b79e-40cc-af73-16512c8cd363
- 117Layer: NDVI change Habitat scene 2020-09-15 to Habitat scene 2025-09-15. 0 features id 1e7295c4-437f-4592-ae40-ba4bbdb0717b
- 118Layer: NDVI decrease / increase. 0 features id 92900ecf-ab3e-4b43-b4cf-6b08b036e3fe
- 119Layer: NDVI change polygons. 984 features id bf42f4f1-8b33-44ec-966f-18e38ceabf89
- 120Layer: Difference Habitat scene 2020-09-15 to Habitat scene 2025-09-15. 0 features id 33686ef4-9edd-4167-a443-df679ae27b18
- 121Layer: Calculate density: Water points. 67 features id 7b558d2e-7e39-420e-9603-d53f4706d94e
- 122Layer: Calculate density: Camera traps. 95 features id 087d5d69-2b6f-47bb-9d24-4ebfe7828e43
- 123Layer: Calculate density: Wildlife sightings. 3,384 features id 5109f215-01e5-45df-bd1a-8d7fd591dbd4
- 124Layer: Summarize within: Protected areas. 5 features id 31880463-9414-41cb-b944-378bf5fd3fbd
- 125Layer: Summarize within: Protected areas. 5 features id cd5df3dd-2597-4703-9f13-db82b5b55d6f
- 126Layer: Summarize within: Protected areas. 5 features id 83d77110-e66e-43fa-a592-e7204275b8e2
- 127Layer: Find point clusters: Water points. 25 features id c0112b91-150f-4a55-a360-f76b0bd99a95
- 128Layer: Find point clusters: cluster hulls. 1 features id 24c2763d-d1eb-4805-91d1-cbfd5661bad4
- 129Layer: Find point clusters: Camera traps. 40 features id 4649022a-052c-47f0-b5f3-ea841d10a2ce
- 130Layer: Find point clusters: cluster hulls. 2 features id 69fa523b-63c9-49ac-b08f-33713597df34
- 131Layer: Find point clusters: Wildlife sightings. 2,000 features id 6c25135b-35a1-4dc6-9bad-5e2bb9a95460
- 132Layer: Find point clusters: cluster hulls. 10 features id 7326560f-58fb-4bab-867c-48455d3e5469
- 133Layer: NDVI change polygons. 984 features id d12c4629-9f52-437d-be16-1038367b3ca0
Appendix: the data behind the chartsShow
Figure 1. Timeline: events per quarter by dataset 1
| period | series | value |
|---|---|---|
| 2018-01-01 | Wildlife sightings | 0 |
| 2018-01-01 | Transect counts by year | 32 |
| 2018-01-01 | Patrol tracks | 0 |
| 2018-01-01 | Patrol effort by month | 0 |
| 2018-04-01 | Wildlife sightings | 0 |
| 2018-04-01 | Transect counts by year | 0 |
| 2018-04-01 | Patrol tracks | 0 |
| 2018-04-01 | Patrol effort by month | 0 |
| 2018-07-01 | Wildlife sightings | 0 |
| 2018-07-01 | Transect counts by year | 0 |
| 2018-07-01 | Patrol tracks | 0 |
| 2018-07-01 | Patrol effort by month | 0 |
| 2018-10-01 | Wildlife sightings | 0 |
| 2018-10-01 | Transect counts by year | 0 |
| 2018-10-01 | Patrol tracks | 0 |
| 2018-10-01 | Patrol effort by month | 0 |
| 2019-01-01 | Wildlife sightings | 0 |
| 2019-01-01 | Transect counts by year | 32 |
| 2019-01-01 | Patrol tracks | 0 |
| 2019-01-01 | Patrol effort by month | 0 |
| 2019-04-01 | Wildlife sightings | 0 |
| 2019-04-01 | Transect counts by year | 0 |
| 2019-04-01 | Patrol tracks | 0 |
| 2019-04-01 | Patrol effort by month | 0 |
| 2019-07-01 | Wildlife sightings | 0 |
| 2019-07-01 | Transect counts by year | 0 |
| 2019-07-01 | Patrol tracks | 0 |
| 2019-07-01 | Patrol effort by month | 0 |
| 2019-10-01 | Wildlife sightings | 0 |
| 2019-10-01 | Transect counts by year | 0 |
| 2019-10-01 | Patrol tracks | 0 |
| 2019-10-01 | Patrol effort by month | 0 |
| 2020-01-01 | Wildlife sightings | 50 |
| 2020-01-01 | Transect counts by year | 32 |
| 2020-01-01 | Patrol tracks | 0 |
| 2020-01-01 | Patrol effort by month | 0 |
| 2020-04-01 | Wildlife sightings | 56 |
| 2020-04-01 | Transect counts by year | 0 |
| 2020-04-01 | Patrol tracks | 0 |
| 2020-04-01 | Patrol effort by month | 0 |
| 2020-07-01 | Wildlife sightings | 101 |
| 2020-07-01 | Transect counts by year | 0 |
| 2020-07-01 | Patrol tracks | 0 |
| 2020-07-01 | Patrol effort by month | 0 |
| 2020-10-01 | Wildlife sightings | 82 |
| 2020-10-01 | Transect counts by year | 0 |
| 2020-10-01 | Patrol tracks | 0 |
| 2020-10-01 | Patrol effort by month | 0 |
| 2021-01-01 | Wildlife sightings | 61 |
| 2021-01-01 | Transect counts by year | 32 |
| 2021-01-01 | Patrol tracks | 0 |
| 2021-01-01 | Patrol effort by month | 0 |
| 2021-04-01 | Wildlife sightings | 91 |
| 2021-04-01 | Transect counts by year | 0 |
| 2021-04-01 | Patrol tracks | 0 |
| 2021-04-01 | Patrol effort by month | 0 |
| 2021-07-01 | Wildlife sightings | 108 |
| 2021-07-01 | Transect counts by year | 0 |
| 2021-07-01 | Patrol tracks | 0 |
| 2021-07-01 | Patrol effort by month | 0 |
| 2021-10-01 | Wildlife sightings | 94 |
| 2021-10-01 | Transect counts by year | 0 |
| 2021-10-01 | Patrol tracks | 0 |
| 2021-10-01 | Patrol effort by month | 0 |
| 2022-01-01 | Wildlife sightings | 56 |
| 2022-01-01 | Transect counts by year | 32 |
| 2022-01-01 | Patrol tracks | 0 |
| 2022-01-01 | Patrol effort by month | 0 |
| 2022-04-01 | Wildlife sightings | 85 |
| 2022-04-01 | Transect counts by year | 0 |
| 2022-04-01 | Patrol tracks | 0 |
| 2022-04-01 | Patrol effort by month | 0 |
| 2022-07-01 | Wildlife sightings | 117 |
| 2022-07-01 | Transect counts by year | 0 |
| 2022-07-01 | Patrol tracks | 0 |
| 2022-07-01 | Patrol effort by month | 0 |
| 2022-10-01 | Wildlife sightings | 113 |
| 2022-10-01 | Transect counts by year | 0 |
| 2022-10-01 | Patrol tracks | 0 |
| 2022-10-01 | Patrol effort by month | 0 |
| 2023-01-01 | Wildlife sightings | 67 |
| 2023-01-01 | Transect counts by year | 32 |
| 2023-01-01 | Patrol tracks | 0 |
| 2023-01-01 | Patrol effort by month | 0 |
| 2023-04-01 | Wildlife sightings | 64 |
| 2023-04-01 | Transect counts by year | 0 |
| 2023-04-01 | Patrol tracks | 0 |
| 2023-04-01 | Patrol effort by month | 0 |
| 2023-07-01 | Wildlife sightings | 96 |
| 2023-07-01 | Transect counts by year | 0 |
| 2023-07-01 | Patrol tracks | 0 |
| 2023-07-01 | Patrol effort by month | 0 |
| 2023-10-01 | Wildlife sightings | 104 |
| 2023-10-01 | Transect counts by year | 0 |
| 2023-10-01 | Patrol tracks | 0 |
| 2023-10-01 | Patrol effort by month | 0 |
| 2024-01-01 | Wildlife sightings | 50 |
| 2024-01-01 | Transect counts by year | 32 |
| 2024-01-01 | Patrol tracks | 24 |
| 2024-01-01 | Patrol effort by month | 15 |
| 2024-04-01 | Wildlife sightings | 73 |
| 2024-04-01 | Transect counts by year | 0 |
| 2024-04-01 | Patrol tracks | 20 |
| 2024-04-01 | Patrol effort by month | 15 |
| 2024-07-01 | Wildlife sightings | 94 |
| 2024-07-01 | Transect counts by year | 0 |
| 2024-07-01 | Patrol tracks | 15 |
| 2024-07-01 | Patrol effort by month | 15 |
| 2024-10-01 | Wildlife sightings | 85 |
| 2024-10-01 | Transect counts by year | 0 |
| 2024-10-01 | Patrol tracks | 22 |
| 2024-10-01 | Patrol effort by month | 15 |
| 2025-01-01 | Wildlife sightings | 67 |
| 2025-01-01 | Transect counts by year | 32 |
| 2025-01-01 | Patrol tracks | 23 |
| 2025-01-01 | Patrol effort by month | 15 |
| 2025-04-01 | Wildlife sightings | 73 |
| 2025-04-01 | Transect counts by year | 0 |
| 2025-04-01 | Patrol tracks | 22 |
| 2025-04-01 | Patrol effort by month | 15 |
| 2025-07-01 | Wildlife sightings | 119 |
| 2025-07-01 | Transect counts by year | 0 |
| 2025-07-01 | Patrol tracks | 12 |
| 2025-07-01 | Patrol effort by month | 15 |
| 2025-10-01 | Wildlife sightings | 94 |
| 2025-10-01 | Transect counts by year | 0 |
| 2025-10-01 | Patrol tracks | 12 |
| 2025-10-01 | Patrol effort by month | 15 |
Figure 27. Camera traps over time (installed_year) 80
| bin_start | bin_end | count |
|---|---|---|
| 2,020 | 2,020 | 40 |
Figure 28. Patrol tracks over time (date) 81
| period | series | value |
|---|---|---|
| 2024-01-01 | Alpha | 5 |
| 2024-01-01 | Charlie | 2 |
| 2024-01-01 | Bravo | 3 |
| 2024-02-01 | Alpha | 4 |
| 2024-02-01 | Charlie | 1 |
| 2024-02-01 | Bravo | 3 |
| 2024-03-01 | Alpha | 2 |
| 2024-03-01 | Charlie | 3 |
| 2024-03-01 | Bravo | 1 |
| 2024-04-01 | Alpha | 0 |
| 2024-04-01 | Charlie | 2 |
| 2024-04-01 | Bravo | 0 |
| 2024-05-01 | Alpha | 3 |
| 2024-05-01 | Charlie | 4 |
| 2024-05-01 | Bravo | 4 |
| 2024-06-01 | Alpha | 0 |
| 2024-06-01 | Charlie | 3 |
| 2024-06-01 | Bravo | 4 |
| 2024-07-01 | Alpha | 1 |
| 2024-07-01 | Charlie | 0 |
| 2024-07-01 | Bravo | 0 |
| 2024-08-01 | Alpha | 3 |
| 2024-08-01 | Charlie | 3 |
| 2024-08-01 | Bravo | 0 |
| 2024-09-01 | Alpha | 3 |
| 2024-09-01 | Charlie | 2 |
| 2024-09-01 | Bravo | 3 |
| 2024-10-01 | Alpha | 3 |
| 2024-10-01 | Charlie | 2 |
| 2024-10-01 | Bravo | 2 |
| 2024-11-01 | Alpha | 1 |
| 2024-11-01 | Charlie | 2 |
| 2024-11-01 | Bravo | 3 |
| 2024-12-01 | Alpha | 3 |
| 2024-12-01 | Charlie | 3 |
| 2024-12-01 | Bravo | 3 |
| 2025-01-01 | Alpha | 5 |
| 2025-01-01 | Charlie | 1 |
| 2025-01-01 | Bravo | 2 |
| 2025-02-01 | Alpha | 2 |
| 2025-02-01 | Charlie | 2 |
| 2025-02-01 | Bravo | 1 |
| 2025-03-01 | Alpha | 5 |
| 2025-03-01 | Charlie | 4 |
| 2025-03-01 | Bravo | 1 |
| 2025-04-01 | Alpha | 1 |
| 2025-04-01 | Charlie | 2 |
| 2025-04-01 | Bravo | 0 |
| 2025-05-01 | Alpha | 3 |
| 2025-05-01 | Charlie | 3 |
| 2025-05-01 | Bravo | 1 |
| 2025-06-01 | Alpha | 7 |
| 2025-06-01 | Charlie | 1 |
| 2025-06-01 | Bravo | 4 |
| 2025-07-01 | Alpha | 3 |
| 2025-07-01 | Charlie | 0 |
| 2025-07-01 | Bravo | 1 |
| 2025-08-01 | Alpha | 3 |
| 2025-08-01 | Charlie | 1 |
| 2025-08-01 | Bravo | 0 |
| 2025-09-01 | Alpha | 0 |
| 2025-09-01 | Charlie | 2 |
| 2025-09-01 | Bravo | 2 |
| 2025-10-01 | Alpha | 2 |
| 2025-10-01 | Charlie | 2 |
| 2025-10-01 | Bravo | 2 |
| 2025-11-01 | Alpha | 1 |
| 2025-11-01 | Charlie | 1 |
| 2025-11-01 | Bravo | 0 |
| 2025-12-01 | Alpha | 3 |
| 2025-12-01 | Charlie | 0 |
| 2025-12-01 | Bravo | 1 |
Figure 29. Patrol effort by month over time (month) 82
| period | series | value |
|---|---|---|
| 2024-01-01 | PA1 | 1 |
| 2024-01-01 | PA2 | 1 |
| 2024-01-01 | PA3 | 1 |
| 2024-01-01 | PA4 | 1 |
| 2024-01-01 | PA5 | 1 |
| 2024-02-01 | PA1 | 1 |
| 2024-02-01 | PA2 | 1 |
| 2024-02-01 | PA3 | 1 |
| 2024-02-01 | PA4 | 1 |
| 2024-02-01 | PA5 | 1 |
| 2024-03-01 | PA1 | 1 |
| 2024-03-01 | PA2 | 1 |
| 2024-03-01 | PA3 | 1 |
| 2024-03-01 | PA4 | 1 |
| 2024-03-01 | PA5 | 1 |
| 2024-04-01 | PA1 | 1 |
| 2024-04-01 | PA2 | 1 |
| 2024-04-01 | PA3 | 1 |
| 2024-04-01 | PA4 | 1 |
| 2024-04-01 | PA5 | 1 |
| 2024-05-01 | PA1 | 1 |
| 2024-05-01 | PA2 | 1 |
| 2024-05-01 | PA3 | 1 |
| 2024-05-01 | PA4 | 1 |
| 2024-05-01 | PA5 | 1 |
| 2024-06-01 | PA1 | 1 |
| 2024-06-01 | PA2 | 1 |
| 2024-06-01 | PA3 | 1 |
| 2024-06-01 | PA4 | 1 |
| 2024-06-01 | PA5 | 1 |
| 2024-07-01 | PA1 | 1 |
| 2024-07-01 | PA2 | 1 |
| 2024-07-01 | PA3 | 1 |
| 2024-07-01 | PA4 | 1 |
| 2024-07-01 | PA5 | 1 |
| 2024-08-01 | PA1 | 1 |
| 2024-08-01 | PA2 | 1 |
| 2024-08-01 | PA3 | 1 |
| 2024-08-01 | PA4 | 1 |
| 2024-08-01 | PA5 | 1 |
| 2024-09-01 | PA1 | 1 |
| 2024-09-01 | PA2 | 1 |
| 2024-09-01 | PA3 | 1 |
| 2024-09-01 | PA4 | 1 |
| 2024-09-01 | PA5 | 1 |
| 2024-10-01 | PA1 | 1 |
| 2024-10-01 | PA2 | 1 |
| 2024-10-01 | PA3 | 1 |
| 2024-10-01 | PA4 | 1 |
| 2024-10-01 | PA5 | 1 |
| 2024-11-01 | PA1 | 1 |
| 2024-11-01 | PA2 | 1 |
| 2024-11-01 | PA3 | 1 |
| 2024-11-01 | PA4 | 1 |
| 2024-11-01 | PA5 | 1 |
| 2024-12-01 | PA1 | 1 |
| 2024-12-01 | PA2 | 1 |
| 2024-12-01 | PA3 | 1 |
| 2024-12-01 | PA4 | 1 |
| 2024-12-01 | PA5 | 1 |
| 2025-01-01 | PA1 | 1 |
| 2025-01-01 | PA2 | 1 |
| 2025-01-01 | PA3 | 1 |
| 2025-01-01 | PA4 | 1 |
| 2025-01-01 | PA5 | 1 |
| 2025-02-01 | PA1 | 1 |
| 2025-02-01 | PA2 | 1 |
| 2025-02-01 | PA3 | 1 |
| 2025-02-01 | PA4 | 1 |
| 2025-02-01 | PA5 | 1 |
| 2025-03-01 | PA1 | 1 |
| 2025-03-01 | PA2 | 1 |
| 2025-03-01 | PA3 | 1 |
| 2025-03-01 | PA4 | 1 |
| 2025-03-01 | PA5 | 1 |
| 2025-04-01 | PA1 | 1 |
| 2025-04-01 | PA2 | 1 |
| 2025-04-01 | PA3 | 1 |
| 2025-04-01 | PA4 | 1 |
| 2025-04-01 | PA5 | 1 |
| 2025-05-01 | PA1 | 1 |
| 2025-05-01 | PA2 | 1 |
| 2025-05-01 | PA3 | 1 |
| 2025-05-01 | PA4 | 1 |
| 2025-05-01 | PA5 | 1 |
| 2025-06-01 | PA1 | 1 |
| 2025-06-01 | PA2 | 1 |
| 2025-06-01 | PA3 | 1 |
| 2025-06-01 | PA4 | 1 |
| 2025-06-01 | PA5 | 1 |
| 2025-07-01 | PA1 | 1 |
| 2025-07-01 | PA2 | 1 |
| 2025-07-01 | PA3 | 1 |
| 2025-07-01 | PA4 | 1 |
| 2025-07-01 | PA5 | 1 |
| 2025-08-01 | PA1 | 1 |
| 2025-08-01 | PA2 | 1 |
| 2025-08-01 | PA3 | 1 |
| 2025-08-01 | PA4 | 1 |
| 2025-08-01 | PA5 | 1 |
| 2025-09-01 | PA1 | 1 |
| 2025-09-01 | PA2 | 1 |
| 2025-09-01 | PA3 | 1 |
| 2025-09-01 | PA4 | 1 |
| 2025-09-01 | PA5 | 1 |
| 2025-10-01 | PA1 | 1 |
| 2025-10-01 | PA2 | 1 |
| 2025-10-01 | PA3 | 1 |
| 2025-10-01 | PA4 | 1 |
| 2025-10-01 | PA5 | 1 |
| 2025-11-01 | PA1 | 1 |
| 2025-11-01 | PA2 | 1 |
| 2025-11-01 | PA3 | 1 |
| 2025-11-01 | PA4 | 1 |
| 2025-11-01 | PA5 | 1 |
| 2025-12-01 | PA1 | 1 |
| 2025-12-01 | PA2 | 1 |
| 2025-12-01 | PA3 | 1 |
| 2025-12-01 | PA4 | 1 |
| 2025-12-01 | PA5 | 1 |
Figure 30. Transect counts by year over time (year) 83
| period | series | value |
|---|---|---|
| 2018-01-01 | red lechwe | 1,169 |
| 2018-01-01 | buffalo | 839 |
| 2018-01-01 | elephant | 309 |
| 2018-01-01 | giraffe | 110 |
| 2018-04-01 | red lechwe | 0 |
| 2018-04-01 | buffalo | 0 |
| 2018-04-01 | elephant | 0 |
| 2018-04-01 | giraffe | 0 |
| 2018-07-01 | red lechwe | 0 |
| 2018-07-01 | buffalo | 0 |
| 2018-07-01 | elephant | 0 |
| 2018-07-01 | giraffe | 0 |
| 2018-10-01 | red lechwe | 0 |
| 2018-10-01 | buffalo | 0 |
| 2018-10-01 | elephant | 0 |
| 2018-10-01 | giraffe | 0 |
| 2019-01-01 | red lechwe | 698 |
| 2019-01-01 | buffalo | 804 |
| 2019-01-01 | elephant | 372 |
| 2019-01-01 | giraffe | 90 |
| 2019-04-01 | red lechwe | 0 |
| 2019-04-01 | buffalo | 0 |
| 2019-04-01 | elephant | 0 |
| 2019-04-01 | giraffe | 0 |
| 2019-07-01 | red lechwe | 0 |
| 2019-07-01 | buffalo | 0 |
| 2019-07-01 | elephant | 0 |
| 2019-07-01 | giraffe | 0 |
| 2019-10-01 | red lechwe | 0 |
| 2019-10-01 | buffalo | 0 |
| 2019-10-01 | elephant | 0 |
| 2019-10-01 | giraffe | 0 |
| 2020-01-01 | red lechwe | 1,130 |
| 2020-01-01 | buffalo | 686 |
| 2020-01-01 | elephant | 380 |
| 2020-01-01 | giraffe | 77 |
| 2020-04-01 | red lechwe | 0 |
| 2020-04-01 | buffalo | 0 |
| 2020-04-01 | elephant | 0 |
| 2020-04-01 | giraffe | 0 |
| 2020-07-01 | red lechwe | 0 |
| 2020-07-01 | buffalo | 0 |
| 2020-07-01 | elephant | 0 |
| 2020-07-01 | giraffe | 0 |
| 2020-10-01 | red lechwe | 0 |
| 2020-10-01 | buffalo | 0 |
| 2020-10-01 | elephant | 0 |
| 2020-10-01 | giraffe | 0 |
| 2021-01-01 | red lechwe | 787 |
| 2021-01-01 | buffalo | 840 |
| 2021-01-01 | elephant | 316 |
| 2021-01-01 | giraffe | 104 |
| 2021-04-01 | red lechwe | 0 |
| 2021-04-01 | buffalo | 0 |
| 2021-04-01 | elephant | 0 |
| 2021-04-01 | giraffe | 0 |
| 2021-07-01 | red lechwe | 0 |
| 2021-07-01 | buffalo | 0 |
| 2021-07-01 | elephant | 0 |
| 2021-07-01 | giraffe | 0 |
| 2021-10-01 | red lechwe | 0 |
| 2021-10-01 | buffalo | 0 |
| 2021-10-01 | elephant | 0 |
| 2021-10-01 | giraffe | 0 |
| 2022-01-01 | red lechwe | 809 |
| 2022-01-01 | buffalo | 743 |
| 2022-01-01 | elephant | 298 |
| 2022-01-01 | giraffe | 77 |
| 2022-04-01 | red lechwe | 0 |
| 2022-04-01 | buffalo | 0 |
| 2022-04-01 | elephant | 0 |
| 2022-04-01 | giraffe | 0 |
| 2022-07-01 | red lechwe | 0 |
| 2022-07-01 | buffalo | 0 |
| 2022-07-01 | elephant | 0 |
| 2022-07-01 | giraffe | 0 |
| 2022-10-01 | red lechwe | 0 |
| 2022-10-01 | buffalo | 0 |
| 2022-10-01 | elephant | 0 |
| 2022-10-01 | giraffe | 0 |
| 2023-01-01 | red lechwe | 635 |
| 2023-01-01 | buffalo | 647 |
| 2023-01-01 | elephant | 303 |
| 2023-01-01 | giraffe | 95 |
| 2023-04-01 | red lechwe | 0 |
| 2023-04-01 | buffalo | 0 |
| 2023-04-01 | elephant | 0 |
| 2023-04-01 | giraffe | 0 |
| 2023-07-01 | red lechwe | 0 |
| 2023-07-01 | buffalo | 0 |
| 2023-07-01 | elephant | 0 |
| 2023-07-01 | giraffe | 0 |
| 2023-10-01 | red lechwe | 0 |
| 2023-10-01 | buffalo | 0 |
| 2023-10-01 | elephant | 0 |
| 2023-10-01 | giraffe | 0 |
| 2024-01-01 | red lechwe | 626 |
| 2024-01-01 | buffalo | 844 |
| 2024-01-01 | elephant | 382 |
| 2024-01-01 | giraffe | 96 |
| 2024-04-01 | red lechwe | 0 |
| 2024-04-01 | buffalo | 0 |
| 2024-04-01 | elephant | 0 |
| 2024-04-01 | giraffe | 0 |
| 2024-07-01 | red lechwe | 0 |
| 2024-07-01 | buffalo | 0 |
| 2024-07-01 | elephant | 0 |
| 2024-07-01 | giraffe | 0 |
| 2024-10-01 | red lechwe | 0 |
| 2024-10-01 | buffalo | 0 |
| 2024-10-01 | elephant | 0 |
| 2024-10-01 | giraffe | 0 |
| 2025-01-01 | red lechwe | 471 |
| 2025-01-01 | buffalo | 702 |
| 2025-01-01 | elephant | 321 |
| 2025-01-01 | giraffe | 96 |
Figure 31. Emerging hot spots: Wildlife sightings 84
| bin_start | bin_end | count |
|---|---|---|
| -0.658 | -0.05533 | 119 |
| -0.05533 | 0.5473 | 26 |
| 0.5473 | 1.15 | 11 |
| 1.15 | 1.753 | 14 |
| 1.753 | 2.355 | 9 |
| 2.355 | 2.958 | 1 |
| 2.958 | 3.561 | 1 |
| 3.561 | 4.163 | 2 |
| 4.163 | 4.766 | 4 |
Figure 32. Repeat and near repeat classification: Wildlife sightings 85
| period | series | value |
|---|---|---|
| 2020-01-01 | elephant | 9 |
| 2020-01-01 | buffalo | 9 |
| 2020-01-01 | giraffe | 5 |
| 2020-01-01 | hippo | 8 |
| 2020-01-01 | red lechwe | 9 |
| 2020-01-01 | Other | 10 |
| 2020-04-01 | elephant | 18 |
| 2020-04-01 | buffalo | 12 |
| 2020-04-01 | giraffe | 3 |
| 2020-04-01 | hippo | 3 |
| 2020-04-01 | red lechwe | 5 |
| 2020-04-01 | Other | 15 |
| 2020-07-01 | elephant | 22 |
| 2020-07-01 | buffalo | 14 |
| 2020-07-01 | giraffe | 14 |
| 2020-07-01 | hippo | 14 |
| 2020-07-01 | red lechwe | 10 |
| 2020-07-01 | Other | 27 |
| 2020-10-01 | elephant | 22 |
| 2020-10-01 | buffalo | 9 |
| 2020-10-01 | giraffe | 13 |
| 2020-10-01 | hippo | 7 |
| 2020-10-01 | red lechwe | 9 |
| 2020-10-01 | Other | 22 |
| 2021-01-01 | elephant | 18 |
| 2021-01-01 | buffalo | 11 |
| 2021-01-01 | giraffe | 9 |
| 2021-01-01 | hippo | 9 |
| 2021-01-01 | red lechwe | 4 |
| 2021-01-01 | Other | 10 |
| 2021-04-01 | elephant | 22 |
| 2021-04-01 | buffalo | 13 |
| 2021-04-01 | giraffe | 16 |
| 2021-04-01 | hippo | 9 |
| 2021-04-01 | red lechwe | 8 |
| 2021-04-01 | Other | 23 |
| 2021-07-01 | elephant | 25 |
| 2021-07-01 | buffalo | 19 |
| 2021-07-01 | giraffe | 11 |
| 2021-07-01 | hippo | 9 |
| 2021-07-01 | red lechwe | 17 |
| 2021-07-01 | Other | 27 |
| 2021-10-01 | elephant | 28 |
| 2021-10-01 | buffalo | 11 |
| 2021-10-01 | giraffe | 8 |
| 2021-10-01 | hippo | 14 |
| 2021-10-01 | red lechwe | 5 |
| 2021-10-01 | Other | 28 |
| 2022-01-01 | elephant | 22 |
| 2022-01-01 | buffalo | 12 |
| 2022-01-01 | giraffe | 4 |
| 2022-01-01 | hippo | 1 |
| 2022-01-01 | red lechwe | 5 |
| 2022-01-01 | Other | 12 |
| 2022-04-01 | elephant | 26 |
| 2022-04-01 | buffalo | 13 |
| 2022-04-01 | giraffe | 10 |
| 2022-04-01 | hippo | 8 |
| 2022-04-01 | red lechwe | 10 |
| 2022-04-01 | Other | 18 |
| 2022-07-01 | elephant | 33 |
| 2022-07-01 | buffalo | 22 |
| 2022-07-01 | giraffe | 11 |
| 2022-07-01 | hippo | 12 |
| 2022-07-01 | red lechwe | 11 |
| 2022-07-01 | Other | 28 |
| 2022-10-01 | elephant | 31 |
| 2022-10-01 | buffalo | 12 |
| 2022-10-01 | giraffe | 15 |
| 2022-10-01 | hippo | 14 |
| 2022-10-01 | red lechwe | 13 |
| 2022-10-01 | Other | 28 |
| 2023-01-01 | elephant | 23 |
| 2023-01-01 | buffalo | 7 |
| 2023-01-01 | giraffe | 10 |
| 2023-01-01 | hippo | 6 |
| 2023-01-01 | red lechwe | 6 |
| 2023-01-01 | Other | 15 |
| 2023-04-01 | elephant | 15 |
| 2023-04-01 | buffalo | 7 |
| 2023-04-01 | giraffe | 11 |
| 2023-04-01 | hippo | 9 |
| 2023-04-01 | red lechwe | 8 |
| 2023-04-01 | Other | 14 |
| 2023-07-01 | elephant | 35 |
| 2023-07-01 | buffalo | 22 |
| 2023-07-01 | giraffe | 10 |
| 2023-07-01 | hippo | 3 |
| 2023-07-01 | red lechwe | 7 |
| 2023-07-01 | Other | 19 |
| 2023-10-01 | elephant | 36 |
| 2023-10-01 | buffalo | 15 |
| 2023-10-01 | giraffe | 18 |
| 2023-10-01 | hippo | 7 |
| 2023-10-01 | red lechwe | 9 |
| 2023-10-01 | Other | 19 |
| 2024-01-01 | elephant | 19 |
| 2024-01-01 | buffalo | 6 |
| 2024-01-01 | giraffe | 3 |
| 2024-01-01 | hippo | 3 |
| 2024-01-01 | red lechwe | 5 |
| 2024-01-01 | Other | 14 |
| 2024-04-01 | elephant | 21 |
| 2024-04-01 | buffalo | 7 |
| 2024-04-01 | giraffe | 10 |
| 2024-04-01 | hippo | 8 |
| 2024-04-01 | red lechwe | 7 |
| 2024-04-01 | Other | 20 |
| 2024-07-01 | elephant | 33 |
| 2024-07-01 | buffalo | 19 |
| 2024-07-01 | giraffe | 4 |
| 2024-07-01 | hippo | 6 |
| 2024-07-01 | red lechwe | 4 |
| 2024-07-01 | Other | 28 |
| 2024-10-01 | elephant | 21 |
| 2024-10-01 | buffalo | 8 |
| 2024-10-01 | giraffe | 11 |
| 2024-10-01 | hippo | 11 |
| 2024-10-01 | red lechwe | 10 |
| 2024-10-01 | Other | 24 |
| 2025-01-01 | elephant | 17 |
| 2025-01-01 | buffalo | 10 |
| 2025-01-01 | giraffe | 9 |
| 2025-01-01 | hippo | 5 |
| 2025-01-01 | red lechwe | 8 |
| 2025-01-01 | Other | 18 |
| 2025-04-01 | elephant | 19 |
| 2025-04-01 | buffalo | 12 |
| 2025-04-01 | giraffe | 8 |
| 2025-04-01 | hippo | 9 |
| 2025-04-01 | red lechwe | 7 |
| 2025-04-01 | Other | 18 |
| 2025-07-01 | elephant | 29 |
| 2025-07-01 | buffalo | 21 |
| 2025-07-01 | giraffe | 9 |
| 2025-07-01 | hippo | 13 |
| 2025-07-01 | red lechwe | 15 |
| 2025-07-01 | Other | 32 |
| 2025-10-01 | elephant | 26 |
| 2025-10-01 | buffalo | 19 |
| 2025-10-01 | giraffe | 10 |
| 2025-10-01 | hippo | 13 |
| 2025-10-01 | red lechwe | 6 |
| 2025-10-01 | Other | 20 |
Figure 33. Hot spot analysis: Camera traps 86
| bin_start | bin_end | band | band_label | count |
|---|---|---|---|---|
| -1.5 | -1 | not_significant | Not significant | 2 |
| -1 | -0.5 | not_significant | Not significant | 3 |
| 0 | 0.5 | not_significant | Not significant | 2 |
| 0.5 | 1 | not_significant | Not significant | 2 |
| 1 | 1.5 | not_significant | Not significant | 1 |
| 1.5 | 2 | not_significant | Not significant | 1 |
Figure 34. Hot spot analysis: Wildlife sightings 87
| bin_start | bin_end | band | band_label | count |
|---|---|---|---|---|
| -2.5 | -2 | cold_95 | Cold spot, 95% confidence | 22 |
| -2 | -1.5 | cold_90 | Cold spot, 90% confidence | 72 |
| -2 | -1.5 | cold_95 | Cold spot, 95% confidence | 14 |
| -2 | -1.5 | not_significant | Not significant | 48 |
| -1.5 | -1 | not_significant | Not significant | 206 |
| -1 | -0.5 | not_significant | Not significant | 327 |
| -0.5 | 0 | not_significant | Not significant | 306 |
| 0 | 0.5 | not_significant | Not significant | 301 |
| 0.5 | 1 | not_significant | Not significant | 229 |
| 1 | 1.5 | not_significant | Not significant | 235 |
| 1.5 | 2 | hot_90 | Hot spot, 90% confidence | 79 |
| 1.5 | 2 | hot_95 | Hot spot, 95% confidence | 11 |
| 1.5 | 2 | not_significant | Not significant | 49 |
| 2 | 2.5 | hot_95 | Hot spot, 95% confidence | 66 |
| 2.5 | 3 | hot_95 | Hot spot, 95% confidence | 6 |
| 2.5 | 3 | hot_99 | Hot spot, 99% confidence | 19 |
| 3 | 3.5 | hot_99 | Hot spot, 99% confidence | 6 |
| 3.5 | 4 | hot_99 | Hot spot, 99% confidence | 4 |
Figure 35. NDVI change polygons 88
| bin_start | bin_end | count |
|---|---|---|
| 1 | 561.9 | 980 |
| 561.9 | 1,123 | 0 |
| 1,123 | 1,684 | 0 |
| 1,684 | 2,245 | 0 |
| 2,245 | 2,806 | 1 |
| 2,806 | 3,366 | 0 |
| 3,366 | 3,927 | 1 |
| 3,927 | 4,488 | 1 |
| 4,488 | 5,049 | 0 |
| 5,049 | 5,610 | 0 |
| 5,610 | 6,171 | 1 |
Figure 36. Calculate density: Water points 89
| bin_start | bin_end | count |
|---|---|---|
| 7.272e-05 | 0.1511 | 23 |
| 0.1511 | 0.3021 | 11 |
| 0.3021 | 0.453 | 8 |
| 0.453 | 0.604 | 7 |
| 0.604 | 0.755 | 8 |
| 0.755 | 0.906 | 5 |
| 0.906 | 1.057 | 2 |
| 1.057 | 1.208 | 3 |
Figure 37. Calculate density: Camera traps 90
| bin_start | bin_end | count |
|---|---|---|
| 8.135e-06 | 0.04672 | 43 |
| 0.04672 | 0.09343 | 14 |
| 0.09343 | 0.1401 | 7 |
| 0.1401 | 0.1868 | 7 |
| 0.1868 | 0.2336 | 8 |
| 0.2336 | 0.2803 | 6 |
| 0.2803 | 0.327 | 6 |
| 0.327 | 0.3737 | 4 |
Figure 38. Calculate density: Wildlife sightings 91
| bin_start | bin_end | count |
|---|---|---|
| 0 | 4.923 | 234 |
| 4.923 | 9.846 | 263 |
| 9.846 | 14.77 | 259 |
| 14.77 | 19.69 | 265 |
| 19.69 | 24.62 | 262 |
| 24.62 | 29.54 | 265 |
| 29.54 | 34.46 | 268 |
| 34.46 | 39.38 | 265 |
| 39.38 | 44.31 | 270 |
| 44.31 | 49.23 | 269 |
| 49.23 | 54.15 | 268 |
| 54.15 | 59.08 | 271 |
| 59.08 | 64 | 225 |
Figure 39. Summarize within: Protected areas 92
| bin_start | bin_end | count |
|---|---|---|
| 0 | 2.6 | 2 |
| 2.6 | 5.2 | 1 |
| 5.2 | 7.8 | 1 |
| 7.8 | 10.4 | 0 |
| 10.4 | 13 | 1 |
Figure 40. Summarize within: Protected areas 93
| bin_start | bin_end | count |
|---|---|---|
| 1 | 3.8 | 1 |
| 3.8 | 6.6 | 0 |
| 6.6 | 9.4 | 3 |
| 9.4 | 12.2 | 0 |
| 12.2 | 15 | 1 |
Figure 41. Summarize within: Protected areas 94
| bin_start | bin_end | count |
|---|---|---|
| 57 | 194 | 1 |
| 194 | 331 | 1 |
| 331 | 468 | 0 |
| 468 | 605 | 2 |
| 605 | 742 | 1 |
Figure 42. Find point clusters: Water points 95
| cluster | features | fraction | share |
|---|---|---|---|
| 0 | 25 | 1 | 100.0% |
Figure 43. Find point clusters: cluster hulls 96
| cluster | features | fraction | share |
|---|---|---|---|
| 0 | 1 | 1 | 100.0% |
Figure 44. Find point clusters: Camera traps 97
| cluster | features | fraction | share |
|---|---|---|---|
| 0 | 34 | 0.85 | 85.0% |
| 1 | 3 | 0.075 | 7.5% |
| Noise | 3 | 0.075 | 7.5% |
Figure 45. Find point clusters: cluster hulls 98
| cluster | features | fraction | share |
|---|---|---|---|
| 0 | 1 | 0.5 | 50.0% |
| 1 | 1 | 0.5 | 50.0% |
Figure 46. Find point clusters: Wildlife sightings 99
| cluster | features | fraction | share |
|---|---|---|---|
| Noise | 812 | 0.406 | 40.6% |
| 0 | 368 | 0.184 | 18.4% |
| 1 | 214 | 0.107 | 10.7% |
| 3 | 188 | 0.094 | 9.4% |
| 2 | 174 | 0.087 | 8.7% |
| 4 | 79 | 0.0395 | 4.0% |
| 7 | 60 | 0.03 | 3.0% |
| 6 | 41 | 0.0205 | 2.1% |
| 5 | 34 | 0.017 | 1.7% |
| 8 | 16 | 0.008 | 0.8% |
| 9 | 14 | 0.007 | 0.7% |
Figure 47. Find point clusters: cluster hulls 100
| cluster | features | fraction | share |
|---|---|---|---|
| 0 | 1 | 0.1 | 10.0% |
| 1 | 1 | 0.1 | 10.0% |
| 2 | 1 | 0.1 | 10.0% |
| 3 | 1 | 0.1 | 10.0% |
| 4 | 1 | 0.1 | 10.0% |
| 5 | 1 | 0.1 | 10.0% |
| 6 | 1 | 0.1 | 10.0% |
| 7 | 1 | 0.1 | 10.0% |
| 8 | 1 | 0.1 | 10.0% |
| 9 | 1 | 0.1 | 10.0% |
Figure 48. NDVI change polygons 101
| bin_start | bin_end | count |
|---|---|---|
| 1 | 561.9 | 980 |
| 561.9 | 1,123 | 0 |
| 1,123 | 1,684 | 0 |
| 1,684 | 2,245 | 0 |
| 2,245 | 2,806 | 1 |
| 2,806 | 3,366 | 0 |
| 3,366 | 3,927 | 1 |
| 3,927 | 4,488 | 1 |
| 4,488 | 5,049 | 0 |
| 5,049 | 5,610 | 0 |
| 5,610 | 6,171 | 1 |
Figure 49. Find point clusters: Wildlife sightings over time 102
| period | series | value |
|---|---|---|
| 2020-01-01 | elephant | 9 |
| 2020-01-01 | buffalo | 9 |
| 2020-01-01 | giraffe | 5 |
| 2020-01-01 | hippo | 8 |
| 2020-01-01 | red lechwe | 9 |
| 2020-01-01 | Other | 10 |
| 2020-04-01 | elephant | 18 |
| 2020-04-01 | buffalo | 12 |
| 2020-04-01 | giraffe | 3 |
| 2020-04-01 | hippo | 3 |
| 2020-04-01 | red lechwe | 5 |
| 2020-04-01 | Other | 15 |
| 2020-07-01 | elephant | 22 |
| 2020-07-01 | buffalo | 14 |
| 2020-07-01 | giraffe | 14 |
| 2020-07-01 | hippo | 14 |
| 2020-07-01 | red lechwe | 10 |
| 2020-07-01 | Other | 27 |
| 2020-10-01 | elephant | 22 |
| 2020-10-01 | buffalo | 9 |
| 2020-10-01 | giraffe | 13 |
| 2020-10-01 | hippo | 7 |
| 2020-10-01 | red lechwe | 9 |
| 2020-10-01 | Other | 22 |
| 2021-01-01 | elephant | 18 |
| 2021-01-01 | buffalo | 11 |
| 2021-01-01 | giraffe | 9 |
| 2021-01-01 | hippo | 9 |
| 2021-01-01 | red lechwe | 4 |
| 2021-01-01 | Other | 10 |
| 2021-04-01 | elephant | 22 |
| 2021-04-01 | buffalo | 13 |
| 2021-04-01 | giraffe | 16 |
| 2021-04-01 | hippo | 9 |
| 2021-04-01 | red lechwe | 8 |
| 2021-04-01 | Other | 23 |
| 2021-07-01 | elephant | 25 |
| 2021-07-01 | buffalo | 19 |
| 2021-07-01 | giraffe | 11 |
| 2021-07-01 | hippo | 9 |
| 2021-07-01 | red lechwe | 17 |
| 2021-07-01 | Other | 27 |
| 2021-10-01 | elephant | 28 |
| 2021-10-01 | buffalo | 11 |
| 2021-10-01 | giraffe | 8 |
| 2021-10-01 | hippo | 14 |
| 2021-10-01 | red lechwe | 5 |
| 2021-10-01 | Other | 28 |
| 2022-01-01 | elephant | 22 |
| 2022-01-01 | buffalo | 12 |
| 2022-01-01 | giraffe | 4 |
| 2022-01-01 | hippo | 1 |
| 2022-01-01 | red lechwe | 5 |
| 2022-01-01 | Other | 12 |
| 2022-04-01 | elephant | 26 |
| 2022-04-01 | buffalo | 13 |
| 2022-04-01 | giraffe | 10 |
| 2022-04-01 | hippo | 8 |
| 2022-04-01 | red lechwe | 10 |
| 2022-04-01 | Other | 18 |
| 2022-07-01 | elephant | 33 |
| 2022-07-01 | buffalo | 22 |
| 2022-07-01 | giraffe | 11 |
| 2022-07-01 | hippo | 12 |
| 2022-07-01 | red lechwe | 11 |
| 2022-07-01 | Other | 28 |
| 2022-10-01 | elephant | 31 |
| 2022-10-01 | buffalo | 12 |
| 2022-10-01 | giraffe | 15 |
| 2022-10-01 | hippo | 14 |
| 2022-10-01 | red lechwe | 13 |
| 2022-10-01 | Other | 28 |
| 2023-01-01 | elephant | 23 |
| 2023-01-01 | buffalo | 7 |
| 2023-01-01 | giraffe | 10 |
| 2023-01-01 | hippo | 6 |
| 2023-01-01 | red lechwe | 6 |
| 2023-01-01 | Other | 15 |
| 2023-04-01 | elephant | 15 |
| 2023-04-01 | buffalo | 7 |
| 2023-04-01 | giraffe | 11 |
| 2023-04-01 | hippo | 9 |
| 2023-04-01 | red lechwe | 8 |
| 2023-04-01 | Other | 14 |
| 2023-07-01 | elephant | 35 |
| 2023-07-01 | buffalo | 22 |
| 2023-07-01 | giraffe | 10 |
| 2023-07-01 | hippo | 3 |
| 2023-07-01 | red lechwe | 7 |
| 2023-07-01 | Other | 19 |
| 2023-10-01 | elephant | 36 |
| 2023-10-01 | buffalo | 15 |
| 2023-10-01 | giraffe | 18 |
| 2023-10-01 | hippo | 7 |
| 2023-10-01 | red lechwe | 9 |
| 2023-10-01 | Other | 19 |
| 2024-01-01 | elephant | 19 |
| 2024-01-01 | buffalo | 6 |
| 2024-01-01 | giraffe | 3 |
| 2024-01-01 | hippo | 3 |
| 2024-01-01 | red lechwe | 5 |
| 2024-01-01 | Other | 14 |
| 2024-04-01 | elephant | 21 |
| 2024-04-01 | buffalo | 7 |
| 2024-04-01 | giraffe | 10 |
| 2024-04-01 | hippo | 8 |
| 2024-04-01 | red lechwe | 7 |
| 2024-04-01 | Other | 20 |
| 2024-07-01 | elephant | 33 |
| 2024-07-01 | buffalo | 19 |
| 2024-07-01 | giraffe | 4 |
| 2024-07-01 | hippo | 6 |
| 2024-07-01 | red lechwe | 4 |
| 2024-07-01 | Other | 28 |
| 2024-10-01 | elephant | 21 |
| 2024-10-01 | buffalo | 8 |
| 2024-10-01 | giraffe | 11 |
| 2024-10-01 | hippo | 11 |
| 2024-10-01 | red lechwe | 10 |
| 2024-10-01 | Other | 24 |
| 2025-01-01 | elephant | 17 |
| 2025-01-01 | buffalo | 10 |
| 2025-01-01 | giraffe | 9 |
| 2025-01-01 | hippo | 5 |
| 2025-01-01 | red lechwe | 8 |
| 2025-01-01 | Other | 18 |
| 2025-04-01 | elephant | 19 |
| 2025-04-01 | buffalo | 12 |
| 2025-04-01 | giraffe | 8 |
| 2025-04-01 | hippo | 9 |
| 2025-04-01 | red lechwe | 7 |
| 2025-04-01 | Other | 18 |
| 2025-07-01 | elephant | 29 |
| 2025-07-01 | buffalo | 21 |
| 2025-07-01 | giraffe | 9 |
| 2025-07-01 | hippo | 13 |
| 2025-07-01 | red lechwe | 15 |
| 2025-07-01 | Other | 32 |
| 2025-10-01 | elephant | 26 |
| 2025-10-01 | buffalo | 19 |
| 2025-10-01 | giraffe | 10 |
| 2025-10-01 | hippo | 13 |
| 2025-10-01 | red lechwe | 6 |
| 2025-10-01 | Other | 20 |
Figure 50. Hot spot analysis: Wildlife sightings over time 103
| period | series | value |
|---|---|---|
| 2020-01-01 | not_significant | 38 |
| 2020-01-01 | hot_95 | 6 |
| 2020-01-01 | hot_90 | 0 |
| 2020-01-01 | cold_90 | 4 |
| 2020-01-01 | cold_95 | 1 |
| 2020-01-01 | Other | 1 |
| 2020-04-01 | not_significant | 52 |
| 2020-04-01 | hot_95 | 1 |
| 2020-04-01 | hot_90 | 0 |
| 2020-04-01 | cold_90 | 2 |
| 2020-04-01 | cold_95 | 0 |
| 2020-04-01 | Other | 1 |
| 2020-07-01 | not_significant | 87 |
| 2020-07-01 | hot_95 | 4 |
| 2020-07-01 | hot_90 | 4 |
| 2020-07-01 | cold_90 | 1 |
| 2020-07-01 | cold_95 | 4 |
| 2020-07-01 | Other | 1 |
| 2020-10-01 | not_significant | 70 |
| 2020-10-01 | hot_95 | 0 |
| 2020-10-01 | hot_90 | 7 |
| 2020-10-01 | cold_90 | 2 |
| 2020-10-01 | cold_95 | 3 |
| 2020-10-01 | Other | 0 |
| 2021-01-01 | not_significant | 53 |
| 2021-01-01 | hot_95 | 3 |
| 2021-01-01 | hot_90 | 2 |
| 2021-01-01 | cold_90 | 3 |
| 2021-01-01 | cold_95 | 0 |
| 2021-01-01 | Other | 0 |
| 2021-04-01 | not_significant | 83 |
| 2021-04-01 | hot_95 | 1 |
| 2021-04-01 | hot_90 | 1 |
| 2021-04-01 | cold_90 | 2 |
| 2021-04-01 | cold_95 | 3 |
| 2021-04-01 | Other | 1 |
| 2021-07-01 | not_significant | 89 |
| 2021-07-01 | hot_95 | 6 |
| 2021-07-01 | hot_90 | 8 |
| 2021-07-01 | cold_90 | 2 |
| 2021-07-01 | cold_95 | 1 |
| 2021-07-01 | Other | 2 |
| 2021-10-01 | not_significant | 75 |
| 2021-10-01 | hot_95 | 6 |
| 2021-10-01 | hot_90 | 4 |
| 2021-10-01 | cold_90 | 4 |
| 2021-10-01 | cold_95 | 4 |
| 2021-10-01 | Other | 1 |
| 2022-01-01 | not_significant | 53 |
| 2022-01-01 | hot_95 | 3 |
| 2022-01-01 | hot_90 | 0 |
| 2022-01-01 | cold_90 | 0 |
| 2022-01-01 | cold_95 | 0 |
| 2022-01-01 | Other | 0 |
| 2022-04-01 | not_significant | 63 |
| 2022-04-01 | hot_95 | 5 |
| 2022-04-01 | hot_90 | 6 |
| 2022-04-01 | cold_90 | 10 |
| 2022-04-01 | cold_95 | 1 |
| 2022-04-01 | Other | 0 |
| 2022-07-01 | not_significant | 96 |
| 2022-07-01 | hot_95 | 8 |
| 2022-07-01 | hot_90 | 7 |
| 2022-07-01 | cold_90 | 3 |
| 2022-07-01 | cold_95 | 1 |
| 2022-07-01 | Other | 2 |
| 2022-10-01 | not_significant | 95 |
| 2022-10-01 | hot_95 | 6 |
| 2022-10-01 | hot_90 | 4 |
| 2022-10-01 | cold_90 | 3 |
| 2022-10-01 | cold_95 | 3 |
| 2022-10-01 | Other | 2 |
| 2023-01-01 | not_significant | 54 |
| 2023-01-01 | hot_95 | 4 |
| 2023-01-01 | hot_90 | 0 |
| 2023-01-01 | cold_90 | 4 |
| 2023-01-01 | cold_95 | 4 |
| 2023-01-01 | Other | 1 |
| 2023-04-01 | not_significant | 62 |
| 2023-04-01 | hot_95 | 0 |
| 2023-04-01 | hot_90 | 0 |
| 2023-04-01 | cold_90 | 0 |
| 2023-04-01 | cold_95 | 1 |
| 2023-04-01 | Other | 1 |
| 2023-07-01 | not_significant | 73 |
| 2023-07-01 | hot_95 | 7 |
| 2023-07-01 | hot_90 | 6 |
| 2023-07-01 | cold_90 | 4 |
| 2023-07-01 | cold_95 | 1 |
| 2023-07-01 | Other | 5 |
| 2023-10-01 | not_significant | 94 |
| 2023-10-01 | hot_95 | 2 |
| 2023-10-01 | hot_90 | 1 |
| 2023-10-01 | cold_90 | 4 |
| 2023-10-01 | cold_95 | 2 |
| 2023-10-01 | Other | 1 |
| 2024-01-01 | not_significant | 45 |
| 2024-01-01 | hot_95 | 1 |
| 2024-01-01 | hot_90 | 2 |
| 2024-01-01 | cold_90 | 2 |
| 2024-01-01 | cold_95 | 0 |
| 2024-01-01 | Other | 0 |
| 2024-04-01 | not_significant | 65 |
| 2024-04-01 | hot_95 | 4 |
| 2024-04-01 | hot_90 | 1 |
| 2024-04-01 | cold_90 | 2 |
| 2024-04-01 | cold_95 | 1 |
| 2024-04-01 | Other | 0 |
| 2024-07-01 | not_significant | 79 |
| 2024-07-01 | hot_95 | 5 |
| 2024-07-01 | hot_90 | 4 |
| 2024-07-01 | cold_90 | 4 |
| 2024-07-01 | cold_95 | 0 |
| 2024-07-01 | Other | 2 |
| 2024-10-01 | not_significant | 71 |
| 2024-10-01 | hot_95 | 3 |
| 2024-10-01 | hot_90 | 6 |
| 2024-10-01 | cold_90 | 3 |
| 2024-10-01 | cold_95 | 1 |
| 2024-10-01 | Other | 1 |
| 2025-01-01 | not_significant | 56 |
| 2025-01-01 | hot_95 | 2 |
| 2025-01-01 | hot_90 | 6 |
| 2025-01-01 | cold_90 | 3 |
| 2025-01-01 | cold_95 | 0 |
| 2025-01-01 | Other | 0 |
| 2025-04-01 | not_significant | 65 |
| 2025-04-01 | hot_95 | 1 |
| 2025-04-01 | hot_90 | 2 |
| 2025-04-01 | cold_90 | 2 |
| 2025-04-01 | cold_95 | 1 |
| 2025-04-01 | Other | 2 |
| 2025-07-01 | not_significant | 104 |
| 2025-07-01 | hot_95 | 3 |
| 2025-07-01 | hot_90 | 2 |
| 2025-07-01 | cold_90 | 6 |
| 2025-07-01 | cold_95 | 1 |
| 2025-07-01 | Other | 3 |
| 2025-10-01 | not_significant | 79 |
| 2025-10-01 | hot_95 | 2 |
| 2025-10-01 | hot_90 | 6 |
| 2025-10-01 | cold_90 | 2 |
| 2025-10-01 | cold_95 | 3 |
| 2025-10-01 | Other | 2 |
Figure 51. Repeat and near repeat classification: Wildlife sightings over time 104
| period | series | value |
|---|---|---|
| 2020-01-01 | elephant | 9 |
| 2020-01-01 | buffalo | 9 |
| 2020-01-01 | giraffe | 5 |
| 2020-01-01 | hippo | 8 |
| 2020-01-01 | red lechwe | 9 |
| 2020-01-01 | Other | 10 |
| 2020-04-01 | elephant | 18 |
| 2020-04-01 | buffalo | 12 |
| 2020-04-01 | giraffe | 3 |
| 2020-04-01 | hippo | 3 |
| 2020-04-01 | red lechwe | 5 |
| 2020-04-01 | Other | 15 |
| 2020-07-01 | elephant | 22 |
| 2020-07-01 | buffalo | 14 |
| 2020-07-01 | giraffe | 14 |
| 2020-07-01 | hippo | 14 |
| 2020-07-01 | red lechwe | 10 |
| 2020-07-01 | Other | 27 |
| 2020-10-01 | elephant | 22 |
| 2020-10-01 | buffalo | 9 |
| 2020-10-01 | giraffe | 13 |
| 2020-10-01 | hippo | 7 |
| 2020-10-01 | red lechwe | 9 |
| 2020-10-01 | Other | 22 |
| 2021-01-01 | elephant | 18 |
| 2021-01-01 | buffalo | 11 |
| 2021-01-01 | giraffe | 9 |
| 2021-01-01 | hippo | 9 |
| 2021-01-01 | red lechwe | 4 |
| 2021-01-01 | Other | 10 |
| 2021-04-01 | elephant | 22 |
| 2021-04-01 | buffalo | 13 |
| 2021-04-01 | giraffe | 16 |
| 2021-04-01 | hippo | 9 |
| 2021-04-01 | red lechwe | 8 |
| 2021-04-01 | Other | 23 |
| 2021-07-01 | elephant | 25 |
| 2021-07-01 | buffalo | 19 |
| 2021-07-01 | giraffe | 11 |
| 2021-07-01 | hippo | 9 |
| 2021-07-01 | red lechwe | 17 |
| 2021-07-01 | Other | 27 |
| 2021-10-01 | elephant | 28 |
| 2021-10-01 | buffalo | 11 |
| 2021-10-01 | giraffe | 8 |
| 2021-10-01 | hippo | 14 |
| 2021-10-01 | red lechwe | 5 |
| 2021-10-01 | Other | 28 |
| 2022-01-01 | elephant | 22 |
| 2022-01-01 | buffalo | 12 |
| 2022-01-01 | giraffe | 4 |
| 2022-01-01 | hippo | 1 |
| 2022-01-01 | red lechwe | 5 |
| 2022-01-01 | Other | 12 |
| 2022-04-01 | elephant | 26 |
| 2022-04-01 | buffalo | 13 |
| 2022-04-01 | giraffe | 10 |
| 2022-04-01 | hippo | 8 |
| 2022-04-01 | red lechwe | 10 |
| 2022-04-01 | Other | 18 |
| 2022-07-01 | elephant | 33 |
| 2022-07-01 | buffalo | 22 |
| 2022-07-01 | giraffe | 11 |
| 2022-07-01 | hippo | 12 |
| 2022-07-01 | red lechwe | 11 |
| 2022-07-01 | Other | 28 |
| 2022-10-01 | elephant | 31 |
| 2022-10-01 | buffalo | 12 |
| 2022-10-01 | giraffe | 15 |
| 2022-10-01 | hippo | 14 |
| 2022-10-01 | red lechwe | 13 |
| 2022-10-01 | Other | 28 |
| 2023-01-01 | elephant | 23 |
| 2023-01-01 | buffalo | 7 |
| 2023-01-01 | giraffe | 10 |
| 2023-01-01 | hippo | 6 |
| 2023-01-01 | red lechwe | 6 |
| 2023-01-01 | Other | 15 |
| 2023-04-01 | elephant | 15 |
| 2023-04-01 | buffalo | 7 |
| 2023-04-01 | giraffe | 11 |
| 2023-04-01 | hippo | 9 |
| 2023-04-01 | red lechwe | 8 |
| 2023-04-01 | Other | 14 |
| 2023-07-01 | elephant | 35 |
| 2023-07-01 | buffalo | 22 |
| 2023-07-01 | giraffe | 10 |
| 2023-07-01 | hippo | 3 |
| 2023-07-01 | red lechwe | 7 |
| 2023-07-01 | Other | 19 |
| 2023-10-01 | elephant | 36 |
| 2023-10-01 | buffalo | 15 |
| 2023-10-01 | giraffe | 18 |
| 2023-10-01 | hippo | 7 |
| 2023-10-01 | red lechwe | 9 |
| 2023-10-01 | Other | 19 |
| 2024-01-01 | elephant | 19 |
| 2024-01-01 | buffalo | 6 |
| 2024-01-01 | giraffe | 3 |
| 2024-01-01 | hippo | 3 |
| 2024-01-01 | red lechwe | 5 |
| 2024-01-01 | Other | 14 |
| 2024-04-01 | elephant | 21 |
| 2024-04-01 | buffalo | 7 |
| 2024-04-01 | giraffe | 10 |
| 2024-04-01 | hippo | 8 |
| 2024-04-01 | red lechwe | 7 |
| 2024-04-01 | Other | 20 |
| 2024-07-01 | elephant | 33 |
| 2024-07-01 | buffalo | 19 |
| 2024-07-01 | giraffe | 4 |
| 2024-07-01 | hippo | 6 |
| 2024-07-01 | red lechwe | 4 |
| 2024-07-01 | Other | 28 |
| 2024-10-01 | elephant | 21 |
| 2024-10-01 | buffalo | 8 |
| 2024-10-01 | giraffe | 11 |
| 2024-10-01 | hippo | 11 |
| 2024-10-01 | red lechwe | 10 |
| 2024-10-01 | Other | 24 |
| 2025-01-01 | elephant | 17 |
| 2025-01-01 | buffalo | 10 |
| 2025-01-01 | giraffe | 9 |
| 2025-01-01 | hippo | 5 |
| 2025-01-01 | red lechwe | 8 |
| 2025-01-01 | Other | 18 |
| 2025-04-01 | elephant | 19 |
| 2025-04-01 | buffalo | 12 |
| 2025-04-01 | giraffe | 8 |
| 2025-04-01 | hippo | 9 |
| 2025-04-01 | red lechwe | 7 |
| 2025-04-01 | Other | 18 |
| 2025-07-01 | elephant | 29 |
| 2025-07-01 | buffalo | 21 |
| 2025-07-01 | giraffe | 9 |
| 2025-07-01 | hippo | 13 |
| 2025-07-01 | red lechwe | 15 |
| 2025-07-01 | Other | 32 |
| 2025-10-01 | elephant | 26 |
| 2025-10-01 | buffalo | 19 |
| 2025-10-01 | giraffe | 10 |
| 2025-10-01 | hippo | 13 |
| 2025-10-01 | red lechwe | 6 |
| 2025-10-01 | Other | 20 |
GeoBit Large Spatial Model. Findings are labeled Evidenced (computed by a tool), Inferred (a reading or reasoning) or Unverified (no evidence yet).