Sample: Renewable energy, Ouarzazate: report
Project: Sample: Renewable energy, Ouarzazate
Goal: Describe the project Sample: Renewable energy, Ouarzazate: run the analyses that tell the most about its data, draw every result, and write a cited report.
Run: 895bf965-1c68-4de6-be27-d405f321db83 (running, 11 agent run(s))
Generated: 2026-10-18T05:22:03Z, version 1
Model cost: USD 0.0000 over 0 model call(s)
Data used
| Data | Kind | Rows | Time span | Summary | Source |
|---|---|---|---|---|---|
| Transmission lines | vector, LineString | 2 | 2 line features; 'voltage_kv' 60 to 225 (mean 142.5); 'spare_capacity_mw' 35 to 180 (mean 107.5); total length 18.77 km; extent -6.9733,30.8748 to -6.8270,30.9182. Lines (Transmission lines) such as routes or networks. | 76 | |
| Substations | vector, Point | 5 | 5 point features; 'voltage_kv' 60 to 225 (mean 93); 'spare_capacity_mw' 21 to 152 (mean 107.4); named by 'name' (e.g. Plateau 225 kV substation, East 60 kV substation, South 60 kV substation); extent -6.9659,30.8775 to -6.8414,30.9250. Point locations of Substations. | 77 | |
| Exclusion zones | vector, Polygon | 8 | 8 polygon (area) features; 'buffer_m' 100 to 250 (mean 156.2); named by 'reason' (e.g. Wadi flood zone north, Wadi flood zone south, Village and buffer); total area 44.58 km2; extent -6.9737,30.8811 to -6.8264,30.9624. Areas (Exclusion zones) with buffer_m to compare and map. | 78 | |
| Candidate sites | vector, Polygon | 30 | 30 polygon (area) features; 'owner' has 3 values (top: state 13, communal 9, private 8); 'ghi_kwh_m2_yr' 2,256 to 2,432 (mean 2333); 'area_ha' 46.6 to 122.9 (mean 76.6); 'grid_km' 0 to 4.4 (mean 1.907); named by 'name' (e.g. Site S01, Site S02, Site S03); total area 22.98 km2; extent -6.9638,30.8781 to -6.8324,30.9643. Areas (Candidate sites) with ghi_kwh_m2_yr to compare and map. | 79 | |
| Met masts | vector, Point | 4 | 4 point features; 'height_m' 80 to 80 (mean 80); 'installed_year' 2,024 to 2,024 (mean 2024); named by 'name' (e.g. Met mast 1, Met mast 2, Met mast 3); extent -6.9434,30.8923 to -6.8640,30.9432. Point locations of Met masts. | 80 | |
| Bird surveys | vector, Point | 650 | 2025-03-01 to 2026-05-31 | 650 point features; dated by 'observed_at' from 2025-03-01 to 2026-05-31; 'species' has 5 values (top: lanner falcon 140, houbara bustard 137, booted eagle 129); 'count' 1 to 9 (mean 2.923); 'flight_height_m' 4 to 553 (mean 56.87); extent -6.9724,30.8746 to -6.8270,30.9658. Dated point events by species: where and when Bird surveys happen. | 2 |
| Dust storms | vector, Polygon | 14 | 2024-02-01 to 2025-06-28 | 14 polygon (area) features; dated by 'date' from 2024-02-01 to 2025-06-28; 'pm10_peak' 524 to 1,684 (mean 989.1); 'visibility_m' 726 to 2,922 (mean 1712); total area 246.4 km2; extent -6.9742,30.8738 to -6.8259,30.9658. Areas (Dust storms) with pm10_peak to compare and map. | 3 |
| Access roads | vector, LineString | 11 | 11 line features; 'surface' has 2 values (top: track 10, paved 1); total length 57.28 km; extent -6.9740,30.8791 to -6.8277,30.9572. Lines (Access roads) such as routes or networks. | 81 | |
| Plateau terrain model (DEM) | raster | 1-band float32 raster (dem), 467 x 333 cells; resolution 30; band 1 1056 to 1409; extent -6.9742,30.8738 to -6.8257,30.9663. An elevation surface for terrain analysis. | 82 | ||
| Site irradiance by month | table | 360 | 2025-01-01 to 2025-12-01 | Table of 360 rows and 4 columns without geometry; dated by 'month' from 2025-01-01 to 2025-12-01; 'ghi_kwh_m2_day' 4.61 to 8.31 (mean 6.397); 'soiling_loss_pct' 0 to 9.3 (mean 3.562). A table of Site irradiance by month without locations. | 4 |
| Land status of sites | table | 30 | Table of 30 rows and 4 columns without geometry; 'owner_type' has 3 values (top: private 14, state 12, communal 4); 'lease_status' has 4 values (top: available 12, negotiating 10, disputed 4); 'price_mad_ha_yr' 5,575 to 18,710 (mean 9426). A table of Land status of sites without locations. | 83 | |
| Site screening memo | document | 1-page md document 'Site screening memo'; language en; mentions 9 place(s): Site S01 (1), Site S13 (1), Site S16 (1), Plateau 225 kV substation (1), Bird corridor (1). A document about Site S01, Site S13, Site S16. | 84 | ||
| Sample: Renewable energy, Ouarzazate | record | 85 | |||
| Summarize within: Exclusion zones | layer, Polygon | 8 | 86 | ||
| Summarize within: Exclusion zones | layer, Polygon | 8 | 87 | ||
| Summarize within: Exclusion zones | layer, Polygon | 8 | 88 | ||
| Emerging hot spots: Bird surveys | layer, Polygon | 156 | 89 | ||
| Hot spot analysis: Bird surveys | layer, Point | 650 | 90 | ||
| Calculate density: Bird surveys | layer, Polygon | 699 | 91 | ||
| Find point clusters: Bird surveys | layer, Point | 650 | 92 | ||
| Find point clusters: cluster hulls | layer, Polygon | 1 | 93 | ||
| Find outliers: Exclusion zones | layer, Polygon | 8 | 94 | ||
| Find outliers: Dust storms | layer, Polygon | 14 | 95 | ||
| Find outliers: Candidate sites | layer, Polygon | 30 | 96 |
Timeline
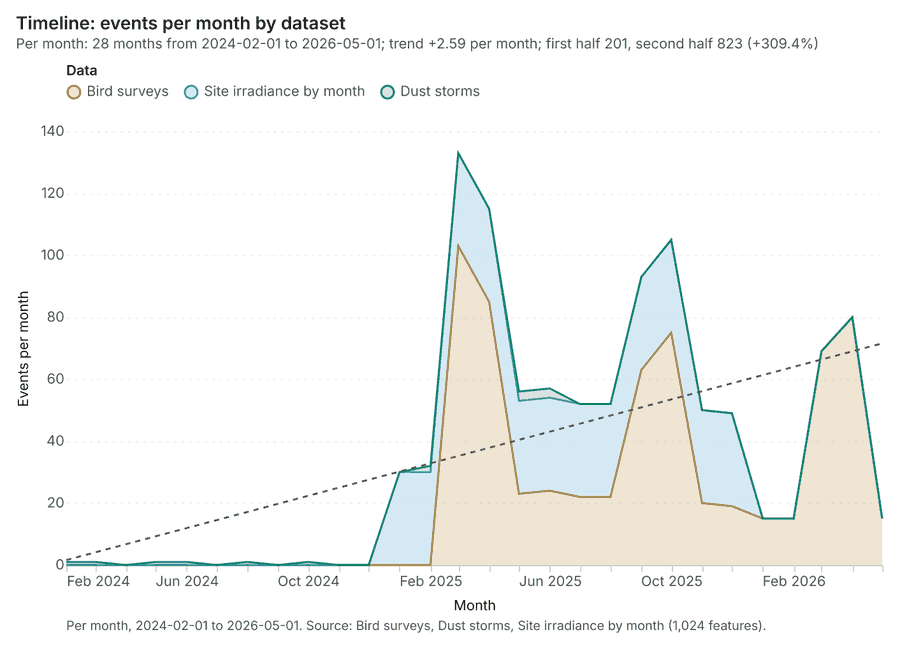
The timeline counts 1,024 dated events in Bird surveys, Dust storms, Site irradiance by month per month, from February 2024 to May 2026 1234. By dataset: Bird surveys 650; Site irradiance by month 360; Dust storms 14 1. The trend is +2.59 events per month; the second half of the months has 823 against 201 in the first (+309.4%) 1. 5 of the 28 months had no events 1.
Busiest months
Quietest months with events
Summarize within
What this analysis is. Summarize within: Count and aggregate the features inside each polygon (or bin), proportionally for lines and polygons 5. In ArcGIS it is Summarize Within or Aggregate Points; in QGIS, native:countpointsinpolygon or native:sumlinelengths 5.
Why it was run on this data. Count Met masts inside each feature of Exclusion zones; the counts map as a choropleth (natural breaks, sequential colors) 6.
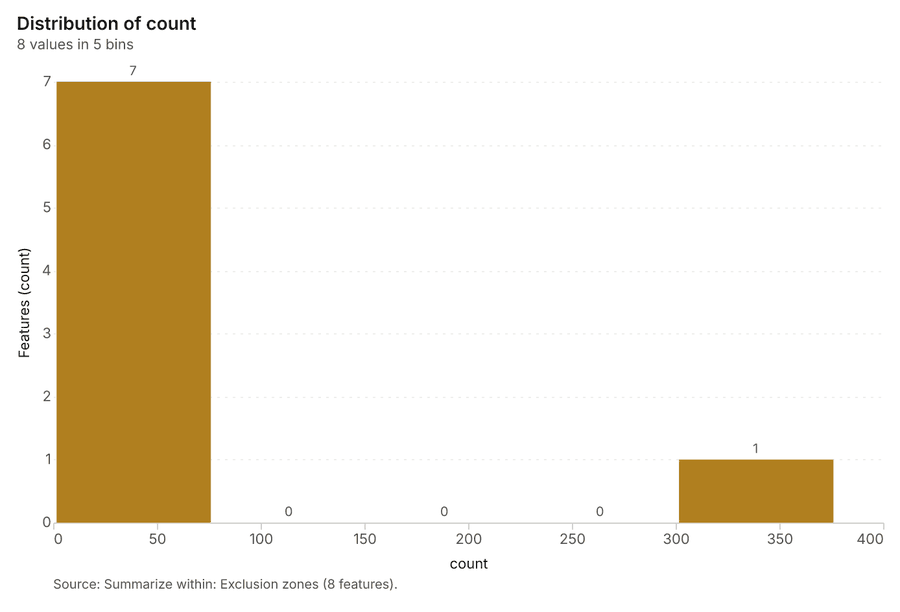
What it found. Summarize within on Met masts, Exclusion zones: Summarize within: 1 layer saved: Summarize within: Exclusion zones (8 features) 789. It reported result, count 8; result, elapsed ms 3; billing, cost 0.01024; billing, list price 0.01024; billing, upstream cost 0 7.
| Result | Value |
|---|---|
| result, count | 8 |
| result, elapsed ms | 3 |
| billing, cost | 0.01024 |
| billing, list price | 0.01024 |
| billing, upstream cost | 0 |
Findings
- Evidenced: Summarize within on Met masts, Exclusion zones: Summarize within: 1 layer saved: Summarize within: Exclusion zones (8 features) 789.
- Evidenced: It reported result, count 8; result, elapsed ms 3; billing, cost 0.01024; billing, list price 0.01024; billing, upstream cost 0 7.
Tool gp_summarize_within; parameters {"stats": [], "project": "8e181d65-6b3c-4526-9cff-cfc25a7f3e07", "features": {"layer": "Met masts (46ca6de8)"}, "polygons": {"layer": "Exclusion zones (f76641f5)"}}
Summarize within
What this analysis is. Summarize within: Count and aggregate the features inside each polygon (or bin), proportionally for lines and polygons 5. In ArcGIS it is Summarize Within or Aggregate Points; in QGIS, native:countpointsinpolygon or native:sumlinelengths 5.
Why it was run on this data. Count Met masts inside each feature of Exclusion zones; the counts map as a choropleth (natural breaks, sequential colors) 6.
What it found. Summarize within on Substations, Exclusion zones: Summarize within: 1 layer saved: Summarize within: Exclusion zones (8 features) 91011. It reported result, count 8; result, elapsed ms 3; billing, cost 0.01028; billing, list price 0.01028; billing, upstream cost 0 10.
| Result | Value |
|---|---|
| result, count | 8 |
| result, elapsed ms | 3 |
| billing, cost | 0.01028 |
| billing, list price | 0.01028 |
| billing, upstream cost | 0 |
Findings
- Evidenced: Summarize within on Substations, Exclusion zones: Summarize within: 1 layer saved: Summarize within: Exclusion zones (8 features) 91011.
- Evidenced: It reported result, count 8; result, elapsed ms 3; billing, cost 0.01028; billing, list price 0.01028; billing, upstream cost 0 10.
A model draft was discarded because a sentence did not cite a source of this section.
Tool gp_summarize_within; parameters {"stats": [{"stat": "sum", "field": "voltage_kv"}], "project": "8e181d65-6b3c-4526-9cff-cfc25a7f3e07", "features": {"layer": "Substations (9024da37)"}, "polygons": {"layer": "Exclusion zones (f76641f5)"}}
Summarize within
What this analysis is. Summarize within: Count and aggregate the features inside each polygon (or bin), proportionally for lines and polygons 5. In ArcGIS it is Summarize Within or Aggregate Points; in QGIS, native:countpointsinpolygon or native:sumlinelengths 5.
Why it was run on this data. Count Met masts inside each feature of Exclusion zones; the counts map as a choropleth (natural breaks, sequential colors) 6.
What it found. Summarize within on Bird surveys, Exclusion zones: Summarize within: 1 layer saved: Summarize within: Exclusion zones (8 features) 91213. It reported result, count 8; result, elapsed ms 5; billing, cost 0.02318; billing, list price 0.02318; billing, upstream cost 0 12.
| Result | Value |
|---|---|
| result, count | 8 |
| result, elapsed ms | 5 |
| billing, cost | 0.02318 |
| billing, list price | 0.02318 |
| billing, upstream cost | 0 |
Findings
- Evidenced: Summarize within on Bird surveys, Exclusion zones: Summarize within: 1 layer saved: Summarize within: Exclusion zones (8 features) 91213.
- Evidenced: It reported result, count 8; result, elapsed ms 5; billing, cost 0.02318; billing, list price 0.02318; billing, upstream cost 0 12.
Tool gp_summarize_within; parameters {"stats": [{"stat": "sum", "field": "count"}], "project": "8e181d65-6b3c-4526-9cff-cfc25a7f3e07", "features": {"layer": "Bird surveys (a5b49489)"}, "group_by": "species", "polygons": {"layer": "Exclusion zones (f76641f5)"}}
Zonal statistics
What this analysis is. Zonal statistics: count/min/max/mean/std/sum/median/majority per polygon as a table and as GeoJSON 14. In ArcGIS it is Zonal Statistics as Table (polygons) 14.
Why it was run on this data. Statistics of Plateau terrain model (DEM) inside each feature of Exclusion zones 15.
What it found. The zonal statistics analysis was performed using the tool rs_zonal_statistics 16. The tool summary indicated that Zonal statistics produced 8 row(s) 16. Additionally, the process analyzed 8 zones 16.
Findings
Tool rs_zonal_statistics; parameters {"stats": ["mean", "min", "max", "std"], "zones": "Exclusion zones (f76641f5)", "raster_id": "Plateau terrain model (DEM) (918994c5)"}
Zonal statistics
What this analysis is. Zonal statistics: count/min/max/mean/std/sum/median/majority per polygon as a table and as GeoJSON 14. In ArcGIS it is Zonal Statistics as Table (polygons) 14.
Why it was run on this data. Statistics of Plateau terrain model (DEM) inside each feature of Exclusion zones 15.
What it found. The tool rs_zonal_statistics processed 14 row(s) 17. This tool involved 14 zones 17.
Findings
Tool rs_zonal_statistics; parameters {"stats": ["mean", "min", "max", "std"], "zones": "Dust storms (aeb5849f)", "raster_id": "Plateau terrain model (DEM) (918994c5)"}
Zonal statistics
What this analysis is. Zonal statistics: count/min/max/mean/std/sum/median/majority per polygon as a table and as GeoJSON 14. In ArcGIS it is Zonal Statistics as Table (polygons) 14.
Why it was run on this data. Statistics of Plateau terrain model (DEM) inside each feature of Exclusion zones 15.
What it found. The Zonal statistics analysis used the tool rs_zonal_statistics 18. The resulting data structure contains 30 row(s) spanning 30 zones 18.
Findings
Tool rs_zonal_statistics; parameters {"stats": ["mean", "min", "max", "std"], "zones": "Candidate sites (d70250d1)", "raster_id": "Plateau terrain model (DEM) (918994c5)"}
Space time hot spots
What this analysis is. Emerging hot spots: Where hot spots are new, consecutive, intensifying, persistent, diminishing, sporadic, oscillating or historical over time 19. In ArcGIS it is Emerging Hot Spot Analysis or Create Space Time Cube 19.
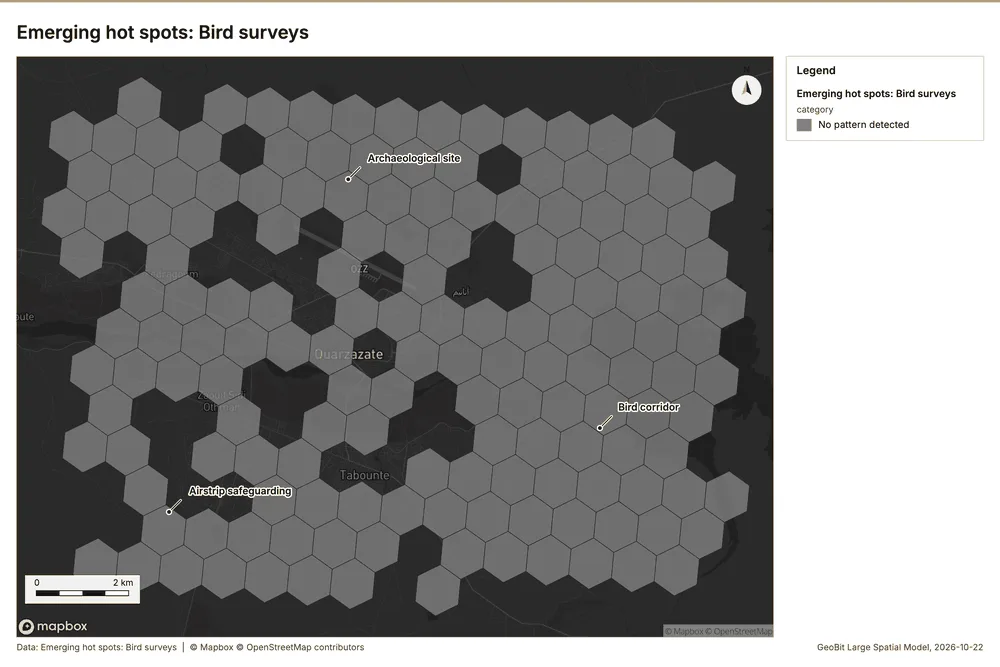
Why it was run on this data. Bird surveys carry dates in 'observed_at': emerging hot spot analysis finds new, intensifying and fading hot spots per month 20.
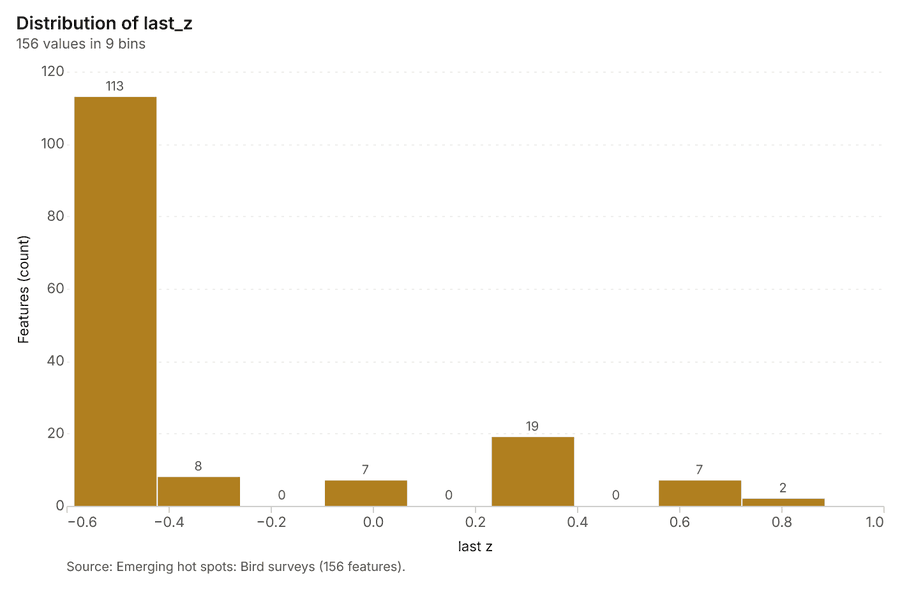
What it found. Space time hot spots on Bird surveys: Emerging hot spots: 1 layer saved: Emerging hot spots: Bird surveys (156 features) 1321. It reported result, count 156; result, elapsed ms 22; result, resolution 8; result, features used 650; result, time neighbors 0; billing, cost 0.1325 21.
| Result | Value |
|---|---|
| result, count | 156 |
| result, elapsed ms | 22 |
| result, resolution | 8 |
| result, features used | 650 |
| result, time neighbors | 0 |
| billing, cost | 0.1325 |
| billing, list price | 0.1325 |
| billing, upstream cost | 0 |
Findings
- Evidenced: Space time hot spots on Bird surveys: Emerging hot spots: 1 layer saved: Emerging hot spots: Bird surveys (156 features) 1321.
- Evidenced: It reported result, count 156; result, elapsed ms 22; result, resolution 8; result, features used 650; result, time neighbors 0; billing, cost 0.1325 21.
A model draft was discarded because a sentence did not cite a source of this section.
Tool gp_space_time_hot_spots; parameters {"agg": "sum", "project": "8e181d65-6b3c-4526-9cff-cfc25a7f3e07", "features": {"layer": "Bird surveys (a5b49489)"}, "interval": "month", "bin_shape": "h3", "resolution": 8, "time_field": "observed_at", "value_field": "count"}
Hot spots
What this analysis is. Hot spot analysis: Getis-Ord Gi* hot and cold spots with z-scores, p-values and confidence bins 22. In ArcGIS it is Find Hot Spots or Hot Spot Analysis (Getis-Ord Gi*); in QGIS, qgis:hotspot (plugin) 22.
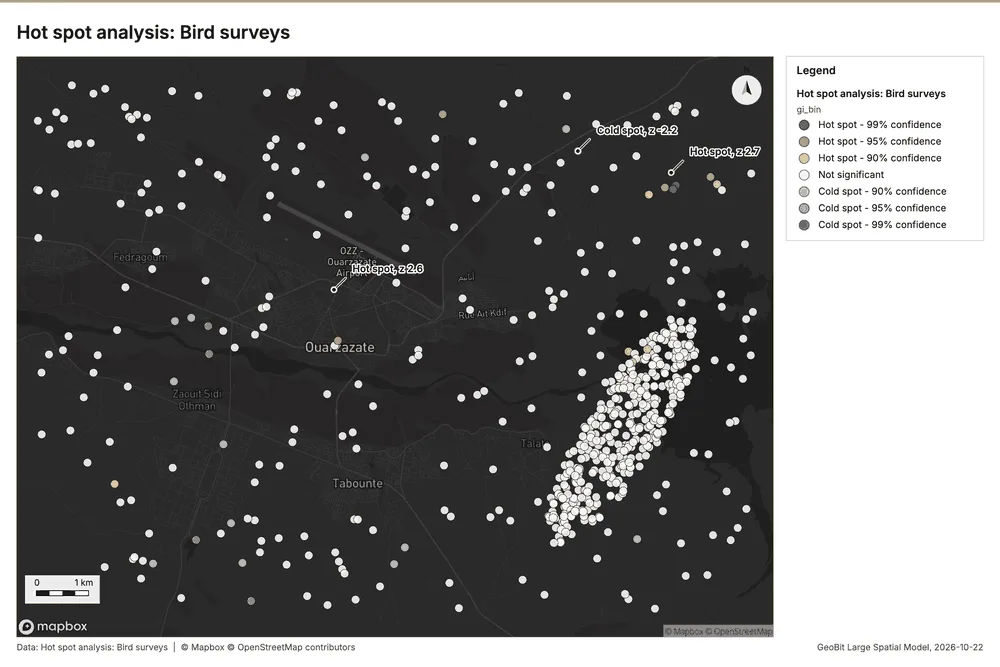
Why it was run on this data. 650 points: Getis-Ord Gi* tests whether the concentrations in Bird surveys are statistically significant 23.
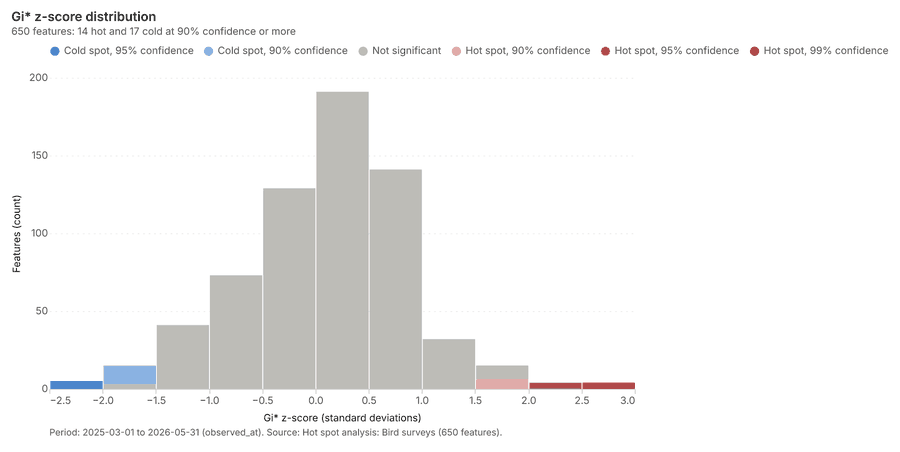
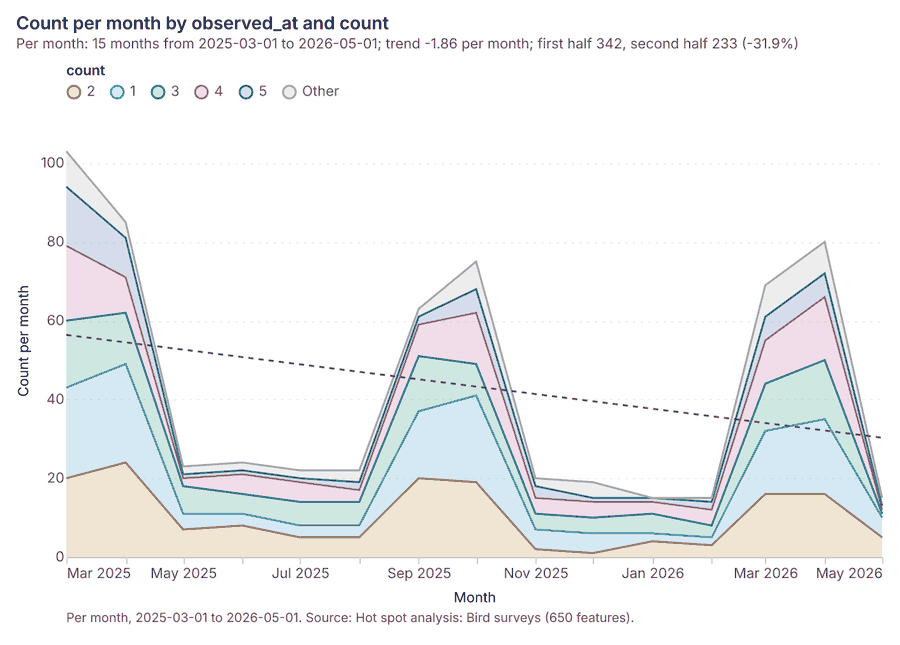
What it found. The hot spot analysis utilized the Bird surveys layer 13 and resulted in 650 features [
| Result | Value |
|---|---|
| result, count | 650 |
| result, elapsed ms | 13 |
| result, excluded null | 0 |
| result, distance band m | 1,000 |
| billing, cost | 0.063 |
| billing, list price | 0.063 |
| billing, upstream cost | 0 |
Findings
- Evidenced: Hot spots on Bird surveys: Hot spot analysis: 1 layer saved: Hot spot analysis: Bird surveys (650 features) 1324.
- Evidenced: It reported result, count 650; result, elapsed ms 13; result, excluded null 0; result, distance band m 1,000; billing, cost 0.063; billing, list price 0.063 24.
Tool gp_hot_spots; parameters {"field": "count", "project": "8e181d65-6b3c-4526-9cff-cfc25a7f3e07", "features": {"layer": "Bird surveys (a5b49489)"}, "aggregation": "hexagon", "cell_size_m": 1000.0, "distance_band_m": 1000.0}
Calculate density
What this analysis is. Calculate density: Kernel density per square kilometer on a grid 25. In ArcGIS it is Calculate Density or Kernel Density; in QGIS, native:heatmapkerneldensityestimation 25.
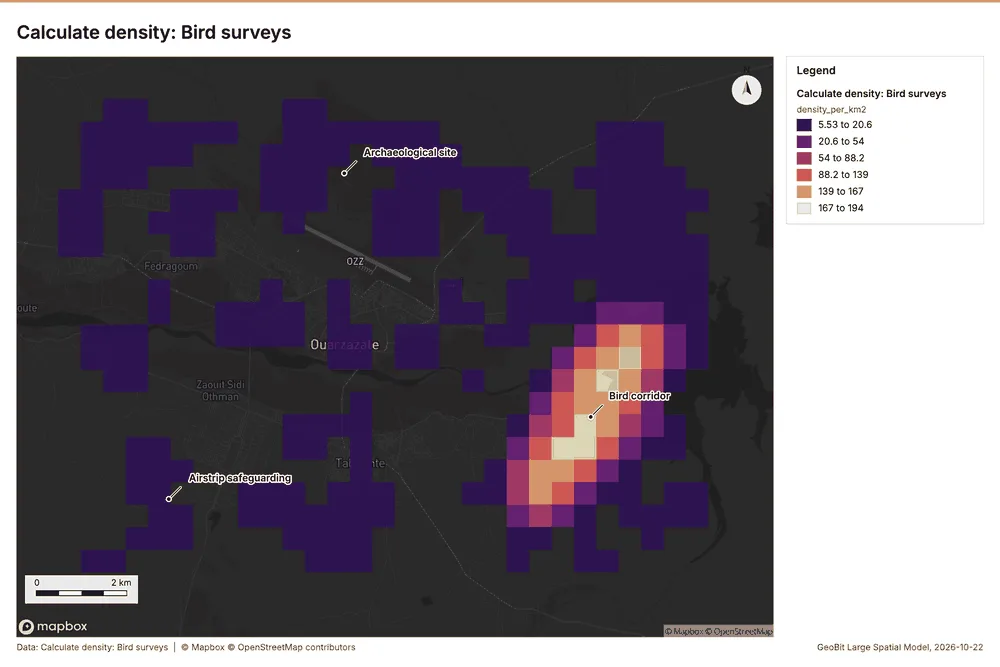
Why it was run on this data. 650 points in Bird surveys: a density surface shows where they concentrate 26.
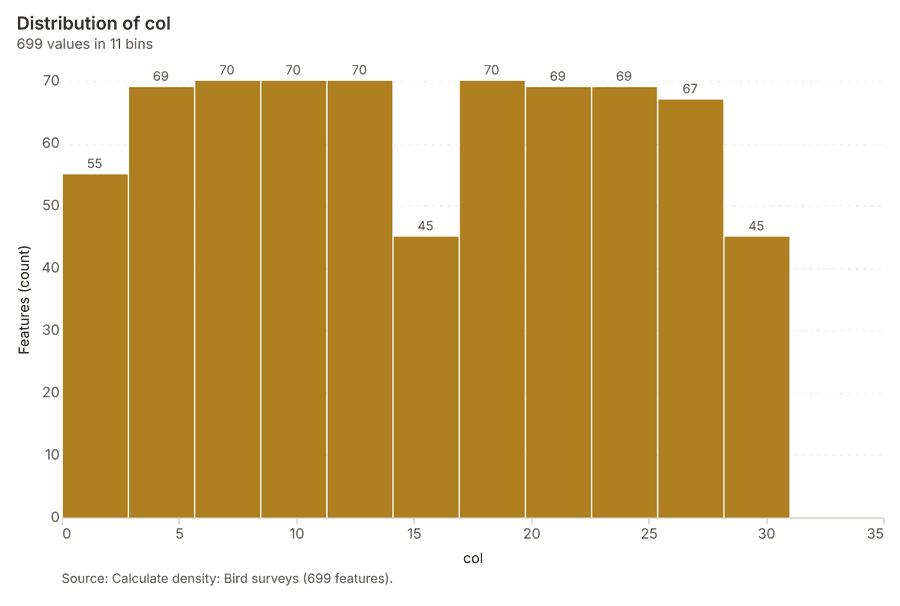
What it found. The density calculation tool was run on the Bird surveys layer 27, yielding 699 features 27. The resulting density data showed a maximum of 194.2 per km² 27. Key parameters for the calculation included a bandwidth of 1,000 m and a cell size of 500 m 27. The cost associated with this operation was 0.063 27.
| Result | Value |
|---|---|
| result, count | 699 |
| result, elapsed ms | 21 |
| result, bandwidth m | 1,000 |
| result, cell size m | 500 |
| result, excluded null | 0 |
| result, max density per km2 | 194.2 |
| billing, cost | 0.063 |
| billing, list price | 0.063 |
| billing, upstream cost | 0 |
Findings
- Evidenced: Calculate density on Bird surveys: Calculate density: 1 layer saved: Calculate density: Bird surveys (699 features) 1327.
- Evidenced: It reported result, count 699; result, elapsed ms 21; result, bandwidth m 1,000; result, cell size m 500; result, excluded null 0; result, max density per km2 194.2 27.
Tool gp_calculate_density; parameters {"kernel": "quartic", "project": "8e181d65-6b3c-4526-9cff-cfc25a7f3e07", "features": {"layer": "Bird surveys (a5b49489)"}, "bandwidth_m": 1000.0, "cell_size_m": 500.0, "weight_field": "count"}
Find point clusters
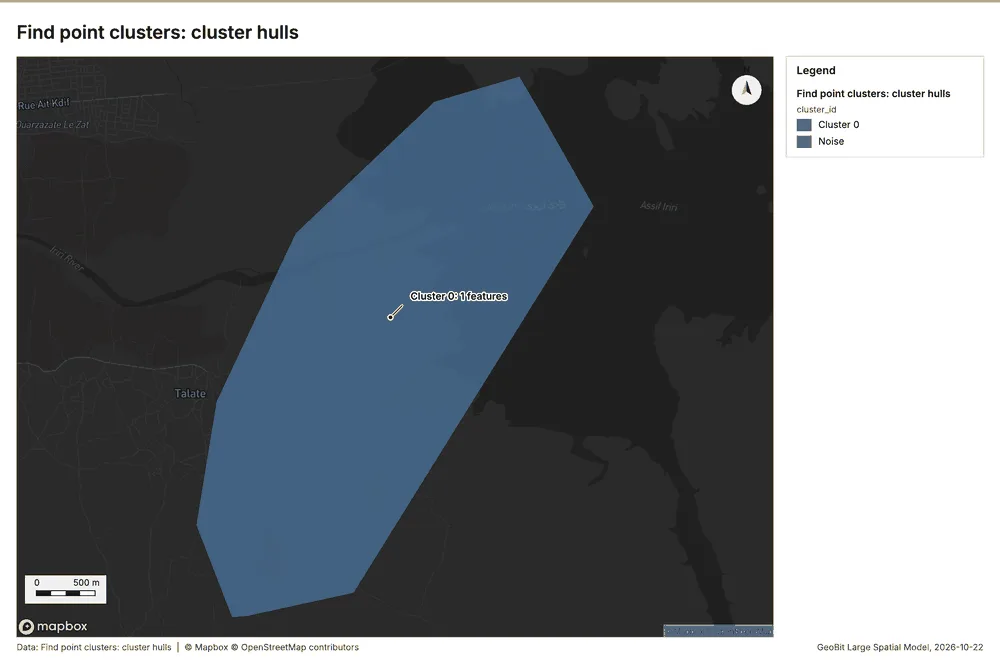
What this analysis is. Find point clusters: Density-based clusters (DBSCAN, HDBSCAN or OPTICS, optionally space-time) with hulls and noise 28. In ArcGIS it is Find Point Clusters or Density-based Clustering; in QGIS, native:dbscanclustering or native:stdbscanclustering 28.
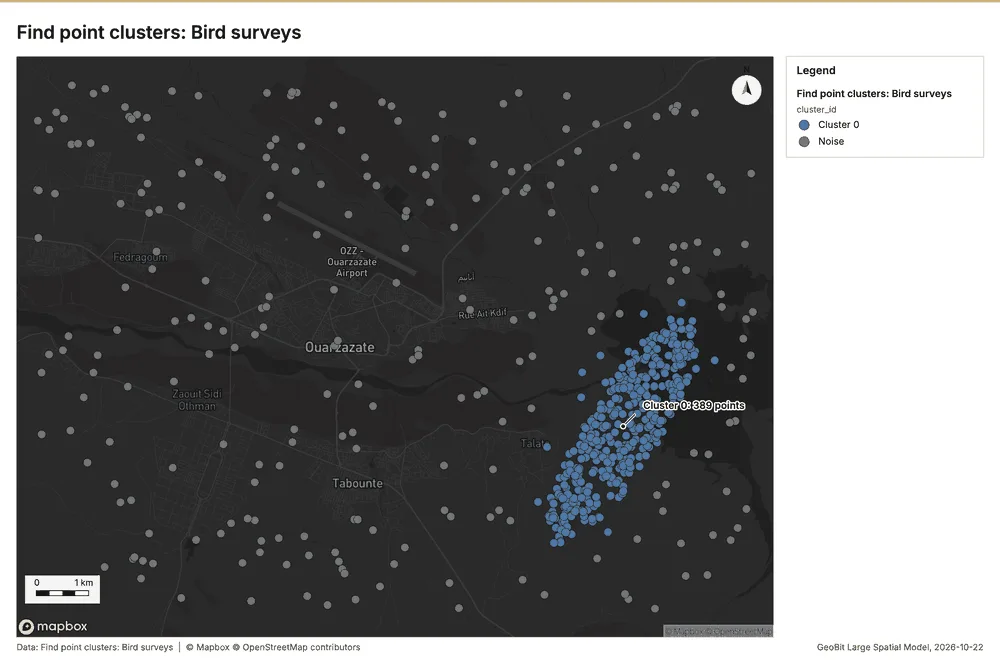
Why it was run on this data. DBSCAN finds dense groups of Bird surveys and separates noise 29.
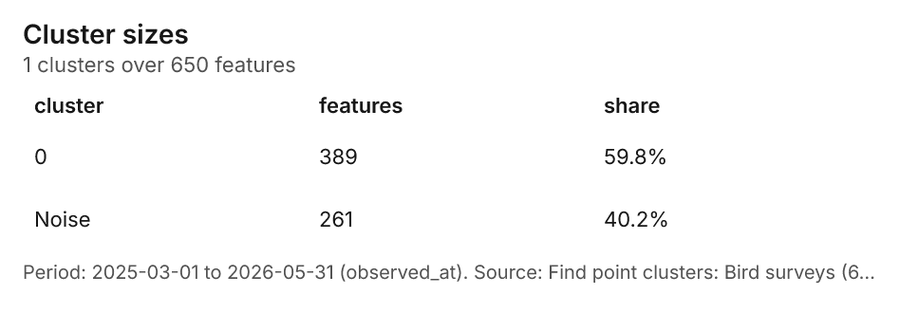
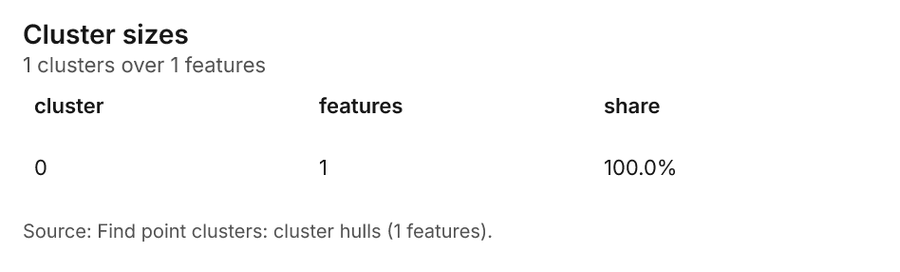
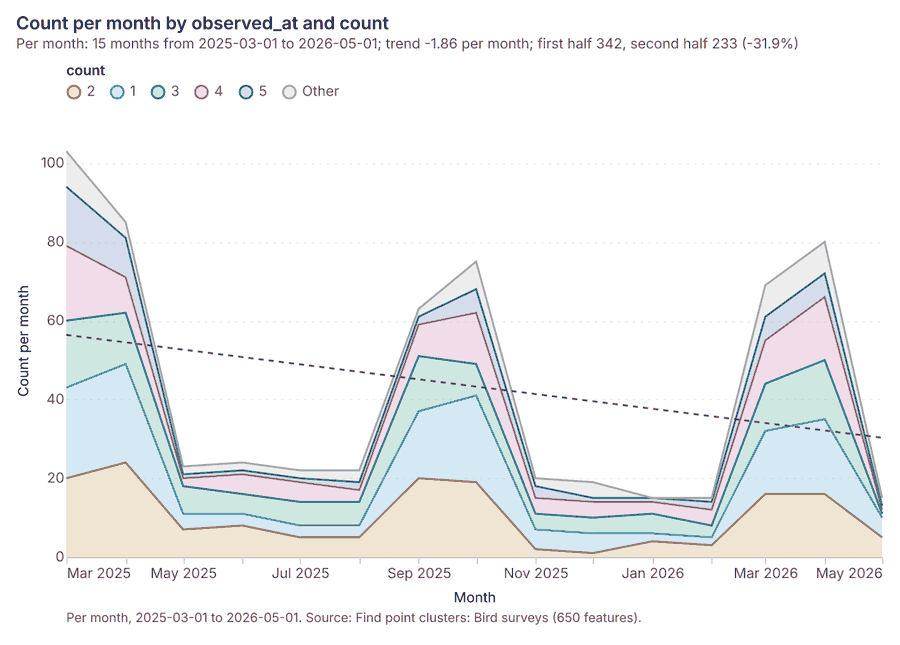
What it found. Find point clusters on Bird surveys: Find point clusters: 2 layers saved: Find point clusters: Bird surveys (650 features); Find point clusters: cluster hulls (1 feature) 1330. It reported result, count 650; result, noise 261; result, distance m 500; result, elapsed ms 11; result, min points 16; billing, cost 0.063 30.
| Result | Value |
|---|---|
| result, count | 650 |
| result, noise | 261 |
| result, distance m | 500 |
| result, elapsed ms | 11 |
| result, min points | 16 |
| billing, cost | 0.063 |
| billing, list price | 0.063 |
| billing, upstream cost | 0 |
Findings
- Evidenced: Find point clusters on Bird surveys: Find point clusters: 2 layers saved: Find point clusters: Bird surveys (650 features); Find point clusters: cluster hulls (1 feature) 1330.
- Evidenced: It reported result, count 650; result, noise 261; result, distance m 500; result, elapsed ms 11; result, min points 16; billing, cost 0.063 30.
Tool gp_find_point_clusters; parameters {"method": "dbscan", "project": "8e181d65-6b3c-4526-9cff-cfc25a7f3e07", "features": {"layer": "Bird surveys (a5b49489)"}, "distance_m": 500.0, "min_points": 16}
Nearest neighbor index
What this analysis is. Average nearest neighbor: Clark-Evans ratio: clustered, dispersed or random 31. In ArcGIS it is Average Nearest Neighbor; in QGIS, native:nearestneighbouranalysis 31.
Why it was run on this data. The average nearest neighbor ratio says whether Substations are clustered, random or dispersed 32.
What it found. Nearest neighbor index on Substations: Average nearest neighbor: done; no map output 1133. It reported result, n 5; result, p value 0; result, z score 8.856; result, elapsed ms 0; result, study area m2 30,876,054; result, nearest neighbor ratio 3.07 33.
| Result | Value |
|---|---|
| result, n | 5 |
| result, p value | 0 |
| result, z score | 8.856 |
| result, elapsed ms | 0 |
| result, study area m2 | 30,876,054 |
| result, nearest neighbor ratio | 3.07 |
| result, expected mean distance m | 1,242 |
| result, observed mean distance m | 3,815 |
| billing, cost | 0.02 |
| billing, list price | 0.02 |
| billing, upstream cost | 0 |
Findings
- Evidenced: Nearest neighbor index on Substations: Average nearest neighbor: done; no map output 1133.
- Evidenced: It reported result, n 5; result, p value 0; result, z score 8.856; result, elapsed ms 0; result, study area m2 30,876,054; result, nearest neighbor ratio 3.07 33.
Tool gp_nearest_neighbor_index; parameters {"project": "8e181d65-6b3c-4526-9cff-cfc25a7f3e07", "features": {"layer": "Substations (9024da37)"}}
Nearest neighbor index
What this analysis is. Average nearest neighbor: Clark-Evans ratio: clustered, dispersed or random 31. In ArcGIS it is Average Nearest Neighbor; in QGIS, native:nearestneighbouranalysis 31.
Why it was run on this data. The average nearest neighbor ratio says whether Bird surveys are clustered, random or dispersed 34.
What it found. Nearest neighbor index on Bird surveys: Average nearest neighbor: done; no map output 1335. It reported result, n 650; result, p value 0; result, z score -9.837; result, elapsed ms 3; result, study area m2 134,387,893; result, nearest neighbor ratio 0.7983 35.
| Result | Value |
|---|---|
| result, n | 650 |
| result, p value | 0 |
| result, z score | -9.837 |
| result, elapsed ms | 3 |
| result, study area m2 | 134,387,893 |
| result, nearest neighbor ratio | 0.7983 |
| result, expected mean distance m | 227.3 |
| result, observed mean distance m | 181.5 |
| billing, cost | 0.02 |
| billing, list price | 0.02 |
| billing, upstream cost | 0 |
Findings
- Evidenced: Nearest neighbor index on Bird surveys: Average nearest neighbor: done; no map output 1335.
- Evidenced: It reported result, n 650; result, p value 0; result, z score -9.837; result, elapsed ms 3; result, study area m2 134,387,893; result, nearest neighbor ratio 0.7983 35.
Tool gp_nearest_neighbor_index; parameters {"project": "8e181d65-6b3c-4526-9cff-cfc25a7f3e07", "features": {"layer": "Bird surveys (a5b49489)"}}
Outliers
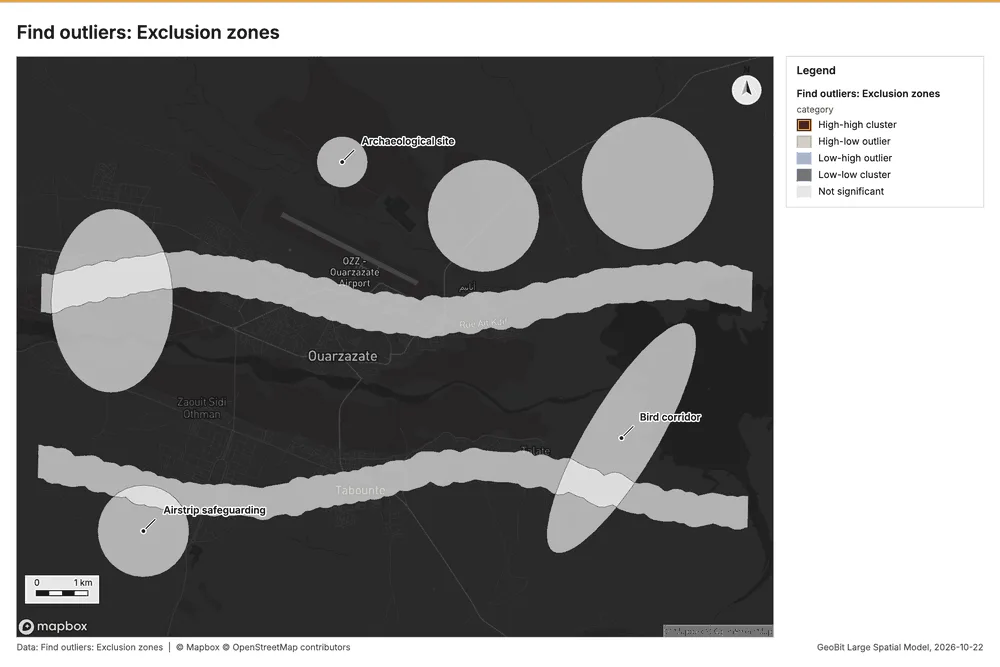
What this analysis is. Find outliers: Anselin local Moran’s I: HH, LL clusters and HL, LH outliers 36. In ArcGIS it is Find Outliers or Cluster and Outlier Analysis (Anselin Local Moran’s I) 36.
Why it was run on this data. Local Moran's I maps clusters and outliers of 'buffer_m' 37.
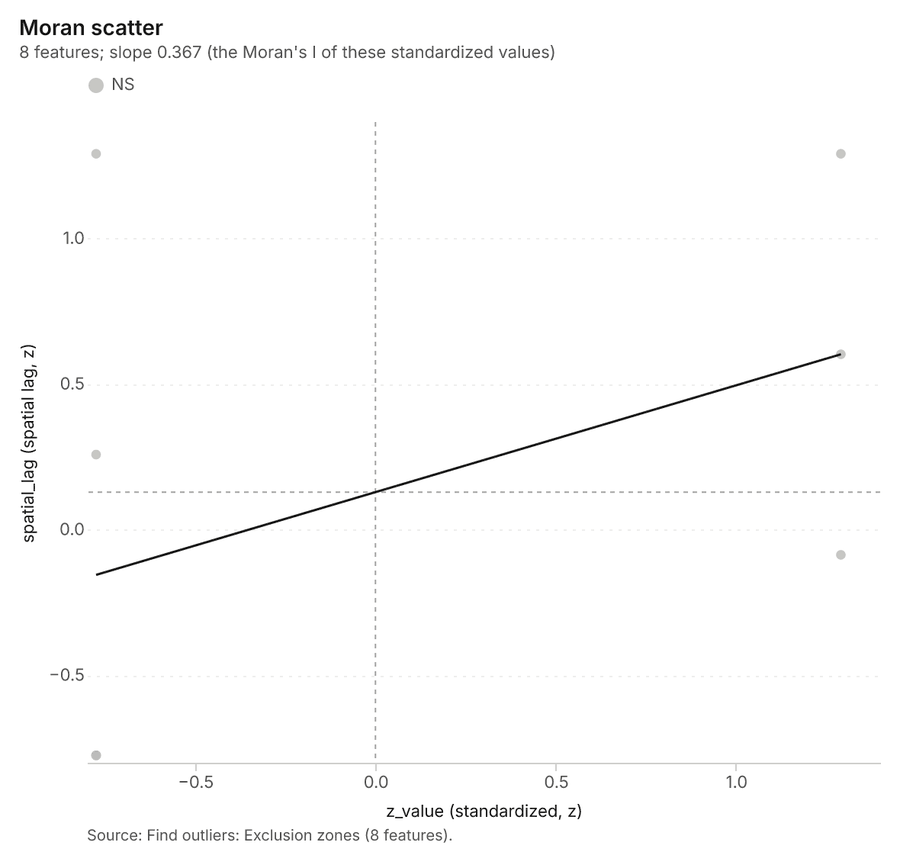
What it found. The gp_outliers tool identified outliers and processed the Exclusion zones [38, 9]. The execution found 1 layer saved and reported a total count of 8 results 38.
| Result | Value |
|---|---|
| result, count | 8 |
| result, elapsed ms | 10 |
| result, permutations | 199 |
| result, excluded null | 0 |
| result, distance band m | 4,662 |
| billing, cost | 0.05024 |
| billing, list price | 0.05024 |
| billing, upstream cost | 0 |
Findings
- Evidenced: Outliers on Exclusion zones: Find outliers: 1 layer saved: Find outliers: Exclusion zones (8 features) 938.
- Evidenced: It reported result, count 8; result, elapsed ms 10; result, permutations 199; result, excluded null 0; result, distance band m 4,662; billing, cost 0.05024 38.
Tool gp_outliers; parameters {"field": "buffer_m", "project": "8e181d65-6b3c-4526-9cff-cfc25a7f3e07", "features": {"layer": "Exclusion zones (f76641f5)"}, "aggregation": "hexagon"}
Outliers
What this analysis is. Find outliers: Anselin local Moran’s I: HH, LL clusters and HL, LH outliers 36. In ArcGIS it is Find Outliers or Cluster and Outlier Analysis (Anselin Local Moran’s I) 36.
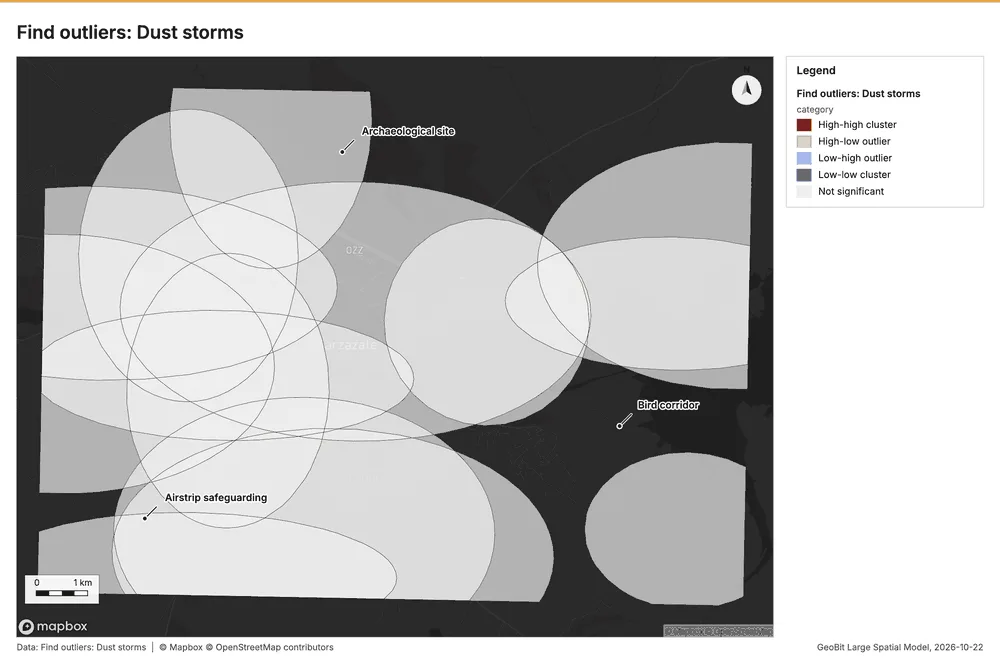
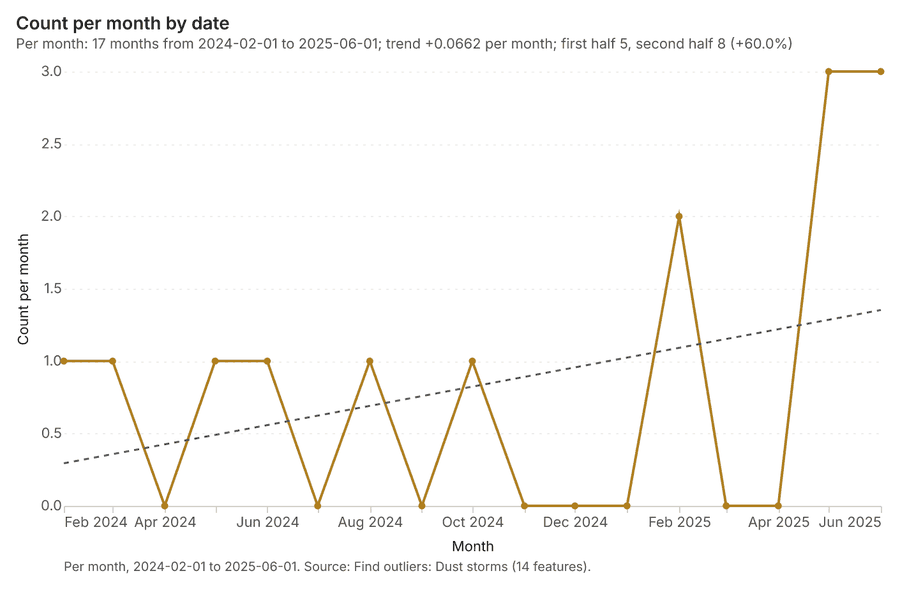
Why it was run on this data. Local Moran's I maps clusters and outliers of 'pm10_peak' 39.
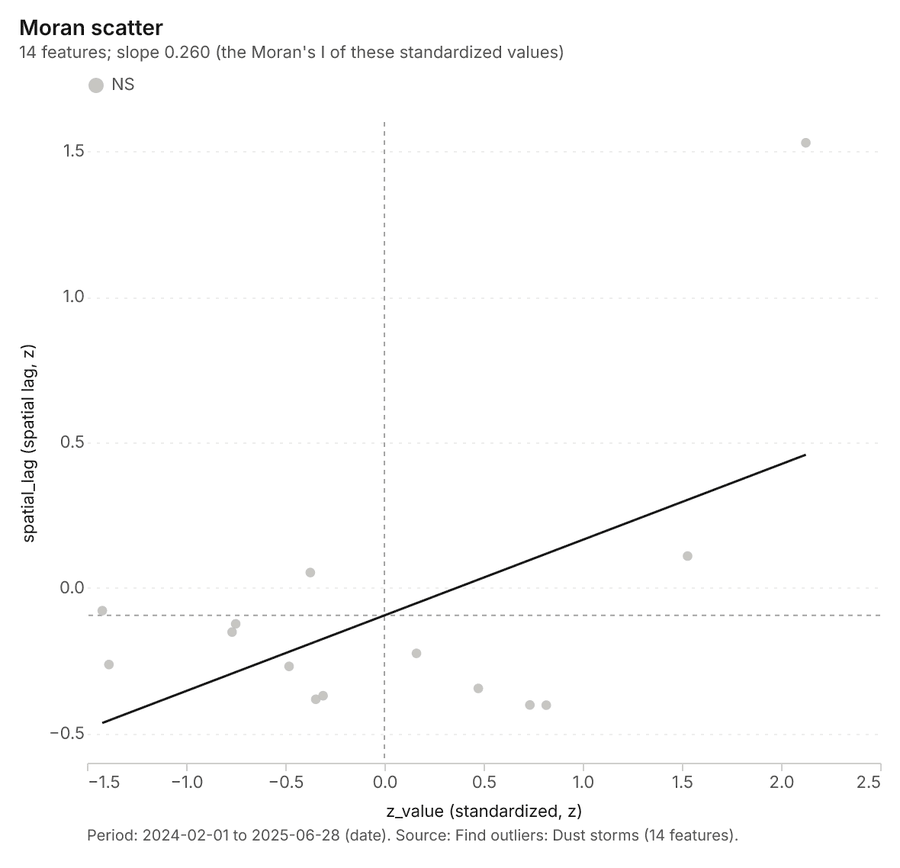
What it found. The analysis utilized the gp_outliers tool 40 on the Dust storms layer 41. The function identified a count of 14 results 40, and the entire operation took 5 ms to complete 40. Billing details indicated a list price of 0.05042 40 for processing the 14 features 40.
| Result | Value |
|---|---|
| result, count | 14 |
| result, elapsed ms | 5 |
| result, permutations | 199 |
| result, excluded null | 0 |
| result, distance band m | 4,561 |
| billing, cost | 0.05042 |
| billing, list price | 0.05042 |
| billing, upstream cost | 0 |
Findings
- Evidenced: Outliers on Dust storms: Find outliers: 1 layer saved: Find outliers: Dust storms (14 features) 4041.
- Evidenced: It reported result, count 14; result, elapsed ms 5; result, permutations 199; result, excluded null 0; result, distance band m 4,561; billing, cost 0.05042 40.
Tool gp_outliers; parameters {"field": "pm10_peak", "project": "8e181d65-6b3c-4526-9cff-cfc25a7f3e07", "features": {"layer": "Dust storms (aeb5849f)"}, "aggregation": "hexagon"}
Outliers
What this analysis is. Find outliers: Anselin local Moran’s I: HH, LL clusters and HL, LH outliers 36. In ArcGIS it is Find Outliers or Cluster and Outlier Analysis (Anselin Local Moran’s I) 36.
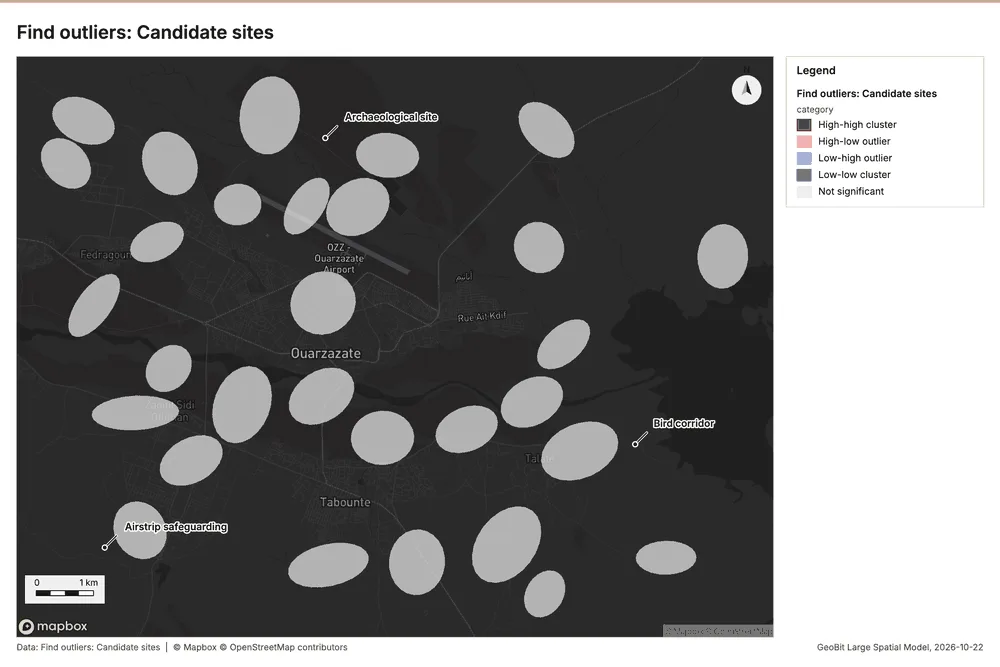
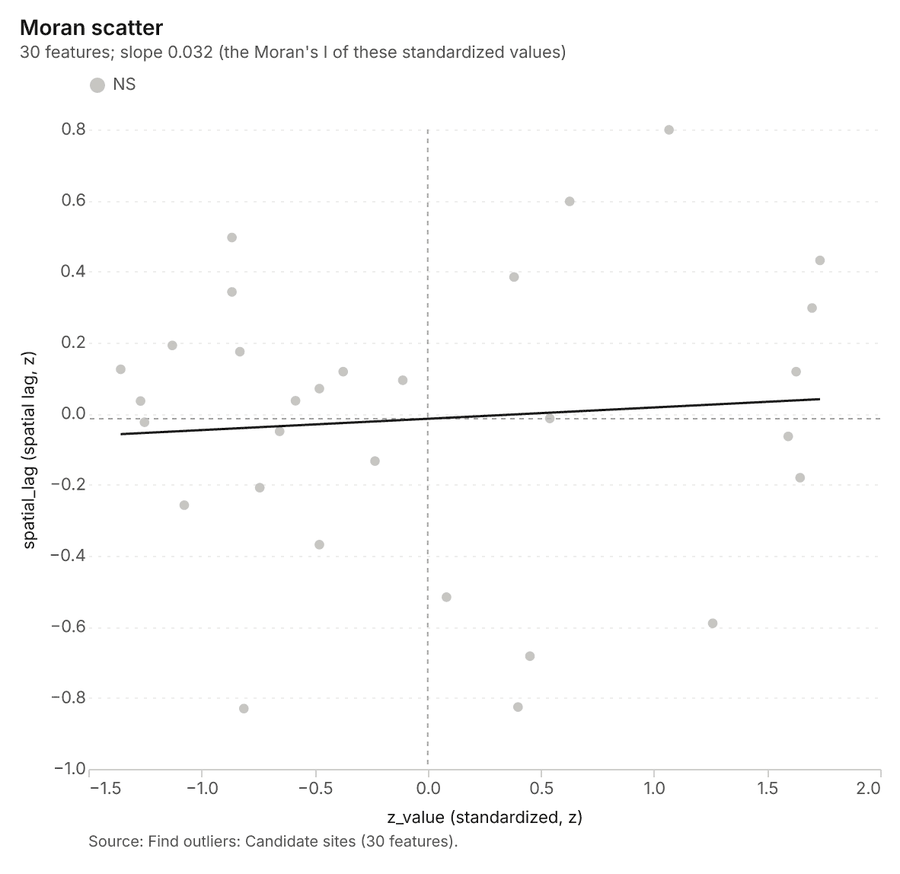
Why it was run on this data. Local Moran's I maps clusters and outliers of 'ghi_kwh_m2_yr' 42.
What it found. Outliers on Candidate sites: Find outliers: 1 layer saved: Find outliers: Candidate sites (30 features) 4344. It reported result, count 30; result, elapsed ms 8; result, permutations 199; result, excluded null 0; result, distance band m 3,255; billing, cost 0.0509 43.
| Result | Value |
|---|---|
| result, count | 30 |
| result, elapsed ms | 8 |
| result, permutations | 199 |
| result, excluded null | 0 |
| result, distance band m | 3,255 |
| billing, cost | 0.0509 |
| billing, list price | 0.0509 |
| billing, upstream cost | 0 |
Findings
- Evidenced: Outliers on Candidate sites: Find outliers: 1 layer saved: Find outliers: Candidate sites (30 features) 4344.
- Evidenced: It reported result, count 30; result, elapsed ms 8; result, permutations 199; result, excluded null 0; result, distance band m 3,255; billing, cost 0.0509 43.
Tool gp_outliers; parameters {"field": "ghi_kwh_m2_yr", "project": "8e181d65-6b3c-4526-9cff-cfc25a7f3e07", "features": {"layer": "Candidate sites (d70250d1)"}, "aggregation": "hexagon"}
Maps and charts
The run also made 14 map image(s) 4546474849505152535455565758 and 17 chart(s) 5960616263646566676869707172737475.
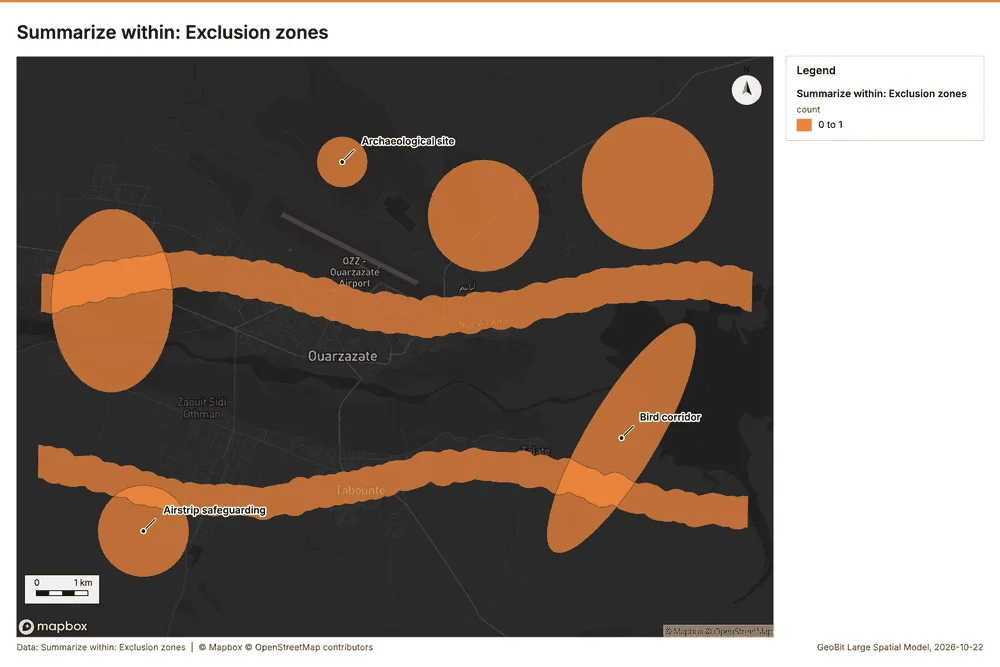
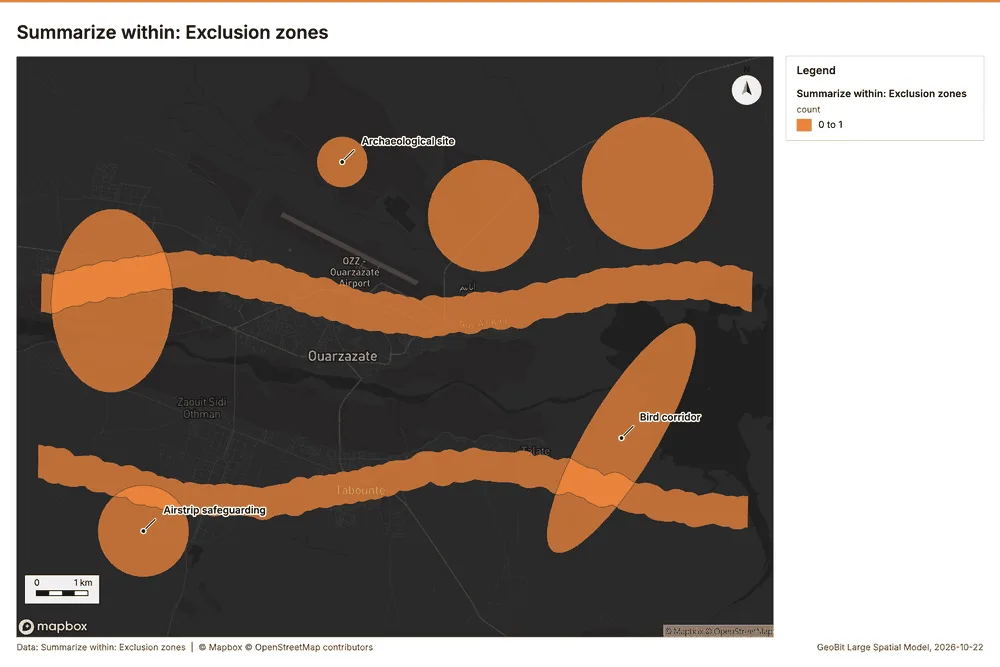
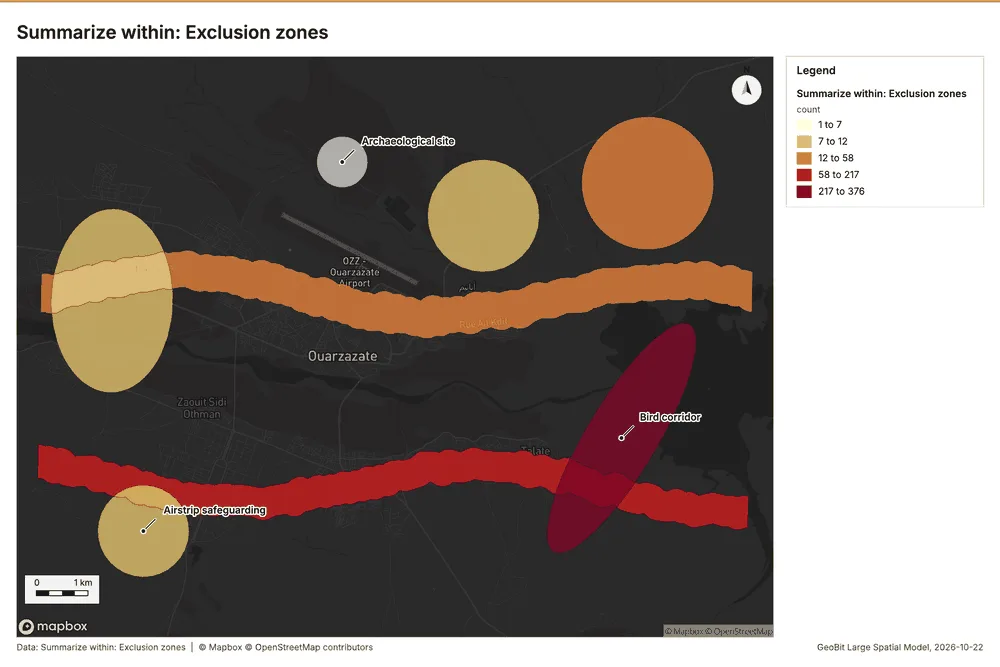
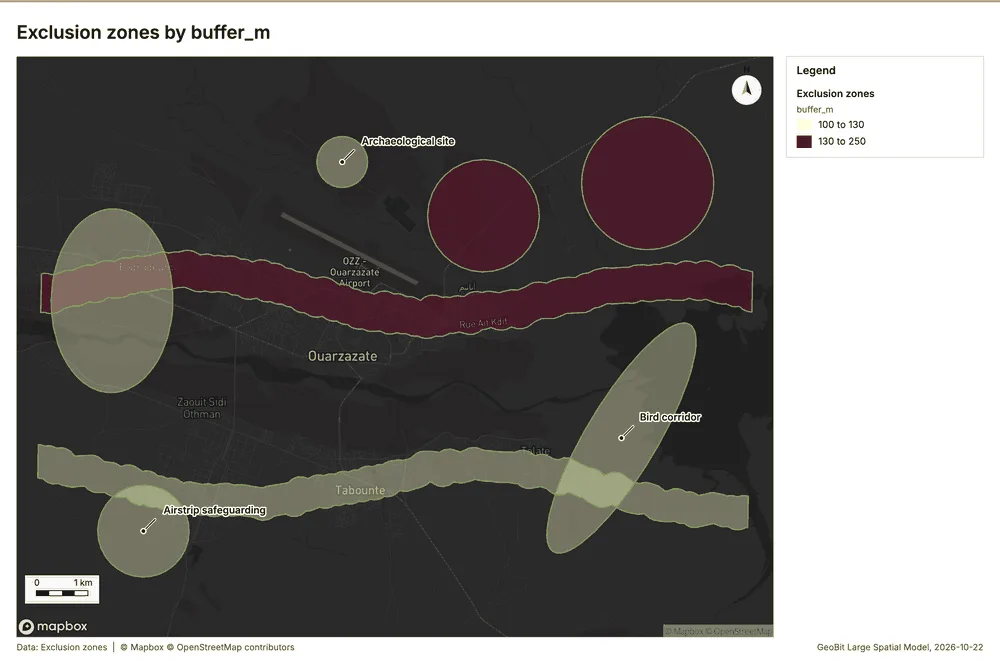
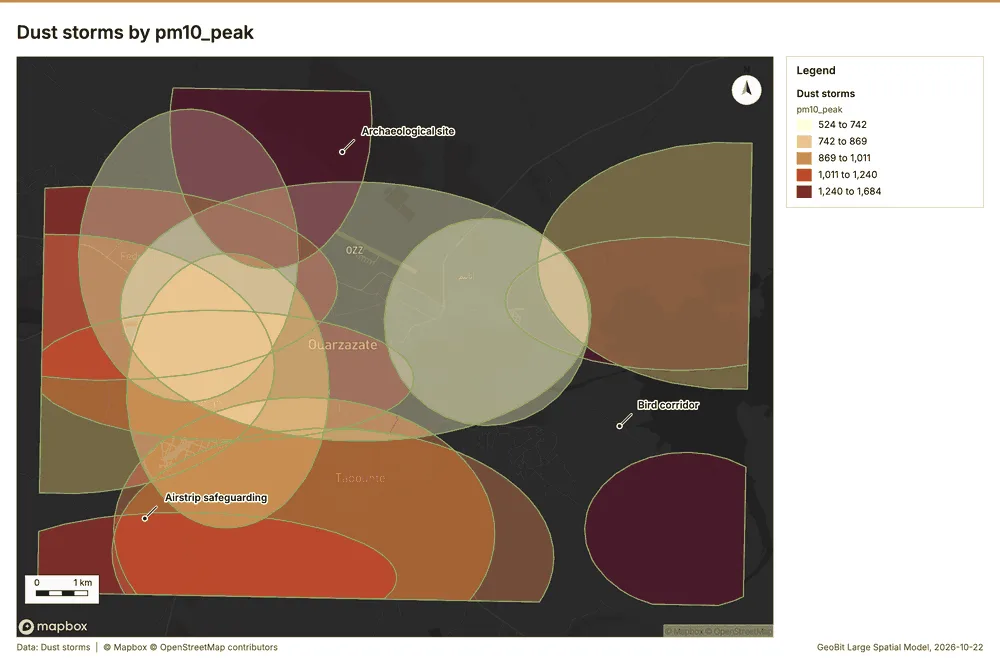
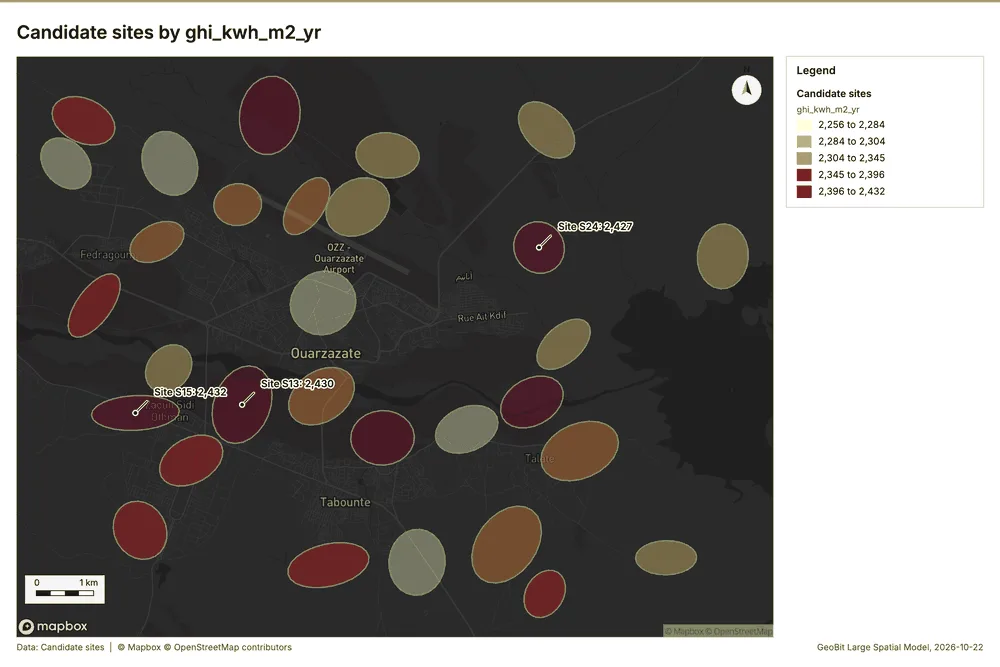
What the map shows. The map displays the summarized count of "Exclusion zones" within the area, using 0 to 1 as indicated in the legend. High counts, represented by darker orange, are clustered in several prominent, sinuous bands running horizontally across the mapped view. Additionally, distinct areas of high counts are visible as larger, circular patches that are scattered across 46
Inferred: read from the image by gemma4:e4b, not evidence.
Changes since the last run
This is the first report of this project.
Sources
- 1Rendering: Chart: Timeline: events per month by dataset. 84 rows id 241ff431-2463-4d2b-9969-bfa5a0f6ce84
- 2Dataset: Bird surveys. vector, 650 rows id 7a5a9074-3838-427a-8c24-d286446838ad
- 3Dataset: Dust storms. vector, 14 rows id 8ead6725-8b61-44df-a3b4-cdb7f223347a
- 4Dataset: Site irradiance by month. table, 360 rows id c78442cd-f73b-403e-8ff1-86fb1c7bc591
- 5Catalog: Summarize within (operation catalog, gp_summarize_within). Count and aggregate the features inside each polygon (or bin), proportionally for lines and polygons. ArcGIS: Summarize Within, Aggregate Points. QGIS: native:countpointsinpolygon, native:sumlinelengths. id gp_summarize_within
- 6Plan: Met masts per feature of Exclusion zones (the Start plan's candidate c_41c08b6712ff). Count Met masts inside each feature of Exclusion zones; the counts map as a choropleth (natural breaks, sequential colors). id 4467f0bd-c718-4e32-858e-fdc23c1206ed:c_41c08b6712ff
- 7Tool result: gp_summarize_within, step 0. Summarize within: 1 layer saved: Summarize within: Exclusion zones (8 features). id 94fd8ddf-f2f8-40c7-9baa-40dbb152522d:0
- 8Layer: Met masts. 4 features id 46ca6de8-1f52-4cae-8a9c-aa89cdfb58ed
- 9Layer: Exclusion zones. 8 features id f76641f5-146c-4958-8885-d9250aa67fc6
- 10Tool result: gp_summarize_within, step 1. Summarize within: 1 layer saved: Summarize within: Exclusion zones (8 features). id 94fd8ddf-f2f8-40c7-9baa-40dbb152522d:1
- 11Layer: Substations. 5 features id 9024da37-5b4c-4500-b90a-7838a0cefe33
- 12Tool result: gp_summarize_within, step 2. Summarize within: 1 layer saved: Summarize within: Exclusion zones (8 features). id 94fd8ddf-f2f8-40c7-9baa-40dbb152522d:2
- 13Layer: Bird surveys. 650 features id a5b49489-c432-4eb3-aa5e-37524f1a4db9
- 14Catalog: Zonal statistics (analysis catalog, rs_zonal_statistics). count/min/max/mean/std/sum/median/majority per polygon as a table and as GeoJSON. ArcGIS: Zonal Statistics as Table (polygons). id rs_zonal_statistics
- 15Plan: Zonal statistics of Plateau terrain model (DEM) and Exclusion zones (the Start plan's candidate c_66d31df1c394). Statistics of Plateau terrain model (DEM) inside each feature of Exclusion zones. id 4467f0bd-c718-4e32-858e-fdc23c1206ed:c_66d31df1c394
- 16Tool result: rs_zonal_statistics, step 0. Zonal statistics: 8 row(s). zones 8. id f33d2406-6d8e-4b9d-ac3e-7cda4a6fb94a:0
- 17Tool result: rs_zonal_statistics, step 1. Zonal statistics: 14 row(s). zones 14. id f33d2406-6d8e-4b9d-ac3e-7cda4a6fb94a:1
- 18Tool result: rs_zonal_statistics, step 2. Zonal statistics: 30 row(s). zones 30. id f33d2406-6d8e-4b9d-ac3e-7cda4a6fb94a:2
- 19Catalog: Emerging hot spots (operation catalog, gp_space_time_hot_spots). Where hot spots are new, consecutive, intensifying, persistent, diminishing, sporadic, oscillating or historical over time. ArcGIS: Emerging Hot Spot Analysis, Create Space Time Cube. id gp_space_time_hot_spots
- 20Plan: Space time hot spots of Bird surveys (the Start plan's candidate c_0a376e0f7bee). Bird surveys carry dates in 'observed_at': emerging hot spot analysis finds new, intensifying and fading hot spots per month. id 4467f0bd-c718-4e32-858e-fdc23c1206ed:c_0a376e0f7bee
- 21Tool result: gp_space_time_hot_spots, step 0. Emerging hot spots: 1 layer saved: Emerging hot spots: Bird surveys (156 features). id 57aa9228-065c-4727-b2e2-360559185796:0
- 22Catalog: Hot spot analysis (operation catalog, gp_hot_spots). Getis-Ord Gi* hot and cold spots with z-scores, p-values and confidence bins. ArcGIS: Find Hot Spots, Hot Spot Analysis (Getis-Ord Gi*). QGIS: qgis:hotspot (plugin). id gp_hot_spots
- 23Plan: Hot spots of Bird surveys (the Start plan's candidate c_c119c8fa5c0a). 650 points: Getis-Ord Gi* tests whether the concentrations in Bird surveys are statistically significant. id 4467f0bd-c718-4e32-858e-fdc23c1206ed:c_c119c8fa5c0a
- 24Tool result: gp_hot_spots, step 0. Hot spot analysis: 1 layer saved: Hot spot analysis: Bird surveys (650 features). id 1a6fb48c-a16d-4ea8-b7b2-c8198bec40da:0
- 25Catalog: Calculate density (operation catalog, gp_calculate_density). Kernel density per square kilometer on a grid. ArcGIS: Calculate Density, Kernel Density. QGIS: native:heatmapkerneldensityestimation. id gp_calculate_density
- 26Plan: Kernel density of Bird surveys (the Start plan's candidate c_d8957b1a8e52). 650 points in Bird surveys: a density surface shows where they concentrate. id 4467f0bd-c718-4e32-858e-fdc23c1206ed:c_d8957b1a8e52
- 27Tool result: gp_calculate_density, step 0. Calculate density: 1 layer saved: Calculate density: Bird surveys (699 features). id 36d3dffd-9398-4987-9589-70b885baa263:0
- 28Catalog: Find point clusters (operation catalog, gp_find_point_clusters). Density-based clusters (DBSCAN, HDBSCAN or OPTICS, optionally space-time) with hulls and noise. ArcGIS: Find Point Clusters, Density-based Clustering. QGIS: native:dbscanclustering, native:stdbscanclustering. id gp_find_point_clusters
- 29Plan: Cluster points of Bird surveys (the Start plan's candidate c_c55469a968f2). DBSCAN finds dense groups of Bird surveys and separates noise. id 4467f0bd-c718-4e32-858e-fdc23c1206ed:c_c55469a968f2
- 30Tool result: gp_find_point_clusters, step 0. Find point clusters: 2 layers saved: Find point clusters: Bird surveys (650 features); Find point clusters: cluster hulls (1 feature). id 739720b8-96fb-4b1d-aada-de004de8b3a1:0
- 31Catalog: Average nearest neighbor (operation catalog, gp_nearest_neighbor_index). Clark-Evans ratio: clustered, dispersed or random. ArcGIS: Average Nearest Neighbor. QGIS: native:nearestneighbouranalysis. id gp_nearest_neighbor_index
- 32Plan: Nearest neighbor index of Substations (the Start plan's candidate c_dca4b687a126). The average nearest neighbor ratio says whether Substations are clustered, random or dispersed. id 4467f0bd-c718-4e32-858e-fdc23c1206ed:c_dca4b687a126
- 33Tool result: gp_nearest_neighbor_index, step 1. Average nearest neighbor: done; no map output. id 739720b8-96fb-4b1d-aada-de004de8b3a1:1
- 34Plan: Nearest neighbor index of Bird surveys (the Start plan's candidate c_de3169143bcf). The average nearest neighbor ratio says whether Bird surveys are clustered, random or dispersed. id 4467f0bd-c718-4e32-858e-fdc23c1206ed:c_de3169143bcf
- 35Tool result: gp_nearest_neighbor_index, step 2. Average nearest neighbor: done; no map output. id 739720b8-96fb-4b1d-aada-de004de8b3a1:2
- 36Catalog: Find outliers (operation catalog, gp_outliers). Anselin local Moran’s I: HH, LL clusters and HL, LH outliers. ArcGIS: Find Outliers, Cluster and Outlier Analysis (Anselin Local Moran’s I). id gp_outliers
- 37Plan: Local morans i of Exclusion zones (the Start plan's candidate c_dacb1f86eb85). Local Moran's I maps clusters and outliers of 'buffer_m'. id 4467f0bd-c718-4e32-858e-fdc23c1206ed:c_dacb1f86eb85
- 38Tool result: gp_outliers, step 0. Find outliers: 1 layer saved: Find outliers: Exclusion zones (8 features). id 7c480adb-51cb-4581-babf-bcb4de29270c:0
- 39Plan: Local morans i of Dust storms (the Start plan's candidate c_263cf93eb691). Local Moran's I maps clusters and outliers of 'pm10_peak'. id 4467f0bd-c718-4e32-858e-fdc23c1206ed:c_263cf93eb691
- 40Tool result: gp_outliers, step 1. Find outliers: 1 layer saved: Find outliers: Dust storms (14 features). id 7c480adb-51cb-4581-babf-bcb4de29270c:1
- 41Layer: Dust storms. 14 features id aeb5849f-590f-4591-8605-6f335d2d6985
- 42Plan: Local morans i of Candidate sites (the Start plan's candidate c_d8df894e1c0f). Local Moran's I maps clusters and outliers of 'ghi_kwh_m2_yr'. id 4467f0bd-c718-4e32-858e-fdc23c1206ed:c_d8df894e1c0f
- 43Tool result: gp_outliers, step 2. Find outliers: 1 layer saved: Find outliers: Candidate sites (30 features). id 7c480adb-51cb-4581-babf-bcb4de29270c:2
- 44Layer: Candidate sites. 30 features id d70250d1-ef9b-4ddd-affc-598a99acfac1
- 45Rendering: Map: Summarize within: Exclusion zones id a6518854-804b-4606-8c78-3199b664ea13
- 46Rendering: Map: Summarize within: Exclusion zones id b8f965ce-a6f5-4252-b925-2dbd5333312e
- 47Rendering: Map: Summarize within: Exclusion zones id 742ea1fc-81db-4b13-b650-6578d5c142d3
- 48Rendering: Map: Emerging hot spots: Bird surveys id f6e21899-5e59-44b5-ab88-0cf929b7c84a
- 49Rendering: Map: Hot spot analysis: Bird surveys id e2916412-7427-4ec7-92e5-508880e59378
- 50Rendering: Map: Calculate density: Bird surveys id 2f7731ce-3173-4b98-9998-48d6cc94da15
- 51Rendering: Map: Find point clusters: Bird surveys id fbf99427-4ce6-4f52-85a1-e32846f89b0c
- 52Rendering: Map: Find point clusters: cluster hulls id 619927ad-be3e-49a4-aa08-fba883794bd1
- 53Rendering: Map: Exclusion zones by buffer_m id 8ce2fa47-92bc-4870-bcc6-b08df1d28697
- 54Rendering: Map: Dust storms by pm10_peak id 61c52e96-09d1-4502-95f4-8391fe90a3bc
- 55Rendering: Map: Candidate sites by ghi_kwh_m2_yr id 51ce9254-115e-470f-b51a-065a90143ec1
- 56Rendering: Map: Find outliers: Exclusion zones id 8aa42480-628b-456e-8317-a63ecb0a3405
- 57Rendering: Map: Find outliers: Dust storms id 819c4713-4920-4e42-8580-4a2e18d6730f
- 58Rendering: Map: Find outliers: Candidate sites id c0057f5e-4079-4e34-9de6-ea0fbb863445
- 59Rendering: Chart: Met masts over time (installed_year). 1 rows id e00e30b9-644b-46ca-b655-11a6de9b9737
- 60Rendering: Chart: Dust storms over time (date). 17 rows id 6f802689-3e28-49da-ae1e-e7352a53f3df
- 61Rendering: Chart: Site irradiance by month over time (month). 49 rows id 1b214c3b-e27f-45d7-b3e9-37007a7bbfe8
- 62Rendering: Chart: Summarize within: Exclusion zones. 5 rows id 4cc2f224-b101-495c-a15a-534e73cf325f
- 63Rendering: Chart: Summarize within: Exclusion zones. 5 rows id 606dca1a-e6b3-4dad-9d26-a3ad7f095ac1
- 64Rendering: Chart: Summarize within: Exclusion zones. 5 rows id d5e79060-d2fb-47a5-9f50-9cb8841d67ab
- 65Rendering: Chart: Emerging hot spots: Bird surveys. 9 rows id fecf206e-e20a-4599-95cf-bda738a0cfae
- 66Rendering: Chart: Hot spot analysis: Bird surveys. 13 rows id f43915bf-27f4-479b-93aa-2d0c28bacc51
- 67Rendering: Chart: Calculate density: Bird surveys. 11 rows id 5f555a81-736e-4cef-810b-a5130a1af5c7
- 68Rendering: Chart: Find point clusters: Bird surveys. 2 rows id 6c497926-d4b4-4ef7-91e9-b21976c56e1a
- 69Rendering: Chart: Find point clusters: cluster hulls. 1 rows id 984b2fed-7ac4-4992-977a-54a6579cc974
- 70Rendering: Chart: Find outliers: Exclusion zones. 8 rows id 3f91f867-567e-4007-a379-87ff1c2ec1f5
- 71Rendering: Chart: Find outliers: Dust storms. 14 rows id e873d7a4-2ae8-4b97-92b4-45515b61c9e7
- 72Rendering: Chart: Find outliers: Candidate sites. 30 rows id 78f7a5da-e0e2-4a91-9914-a69b6ea9d7a2
- 73Rendering: Chart: Find outliers: Dust storms over time. 17 rows id 4568b65f-edd9-4f11-8d2b-857d4a5222a3
- 74Rendering: Chart: Find point clusters: Bird surveys over time. 90 rows id 62e514e8-affd-48d5-ae06-637bb1e12776
- 75Rendering: Chart: Hot spot analysis: Bird surveys over time. 90 rows id 3ad09906-2ab7-474e-9978-693d44d049e9
- 76Dataset: Transmission lines. vector, 2 rows id 81e40578-e11f-4cb0-864c-1046f98bd22f
- 77Dataset: Substations. vector, 5 rows id 72dd1bf3-452e-470d-be4e-83dcb0b85cab
- 78Dataset: Exclusion zones. vector, 8 rows id 6cafb793-ef1d-4f2e-bff7-5825f0e576c7
- 79Dataset: Candidate sites. vector, 30 rows id e6ff1e61-6ff4-4123-91b0-a52d86d2f216
- 80Dataset: Met masts. vector, 4 rows id 091a72d3-dd86-4a99-a88e-e5d49ad70868
- 81Dataset: Access roads. vector, 11 rows id 3294b702-ed92-4c49-96ee-c739d04c98f7
- 82Dataset: Plateau terrain model (DEM). raster, ? rows id 4f619ad8-009f-4070-940a-dc92f2424eda
- 83Dataset: Land status of sites. table, 30 rows id 8d37fb84-9a33-4798-a0da-2027e38ee102
- 84Dataset: Site screening memo. document, ? rows id 7f171779-1185-43a2-ac02-a1442e6426c2
- 85Record: Sample: Renewable energy, Ouarzazate id 8e181d65-6b3c-4526-9cff-cfc25a7f3e07
- 86Layer: Summarize within: Exclusion zones. 8 features id c30aa790-7338-4207-a249-4ce0e2af6afe
- 87Layer: Summarize within: Exclusion zones. 8 features id f3d21de8-7328-4a27-aca4-768ddfaee0c5
- 88Layer: Summarize within: Exclusion zones. 8 features id e4d609b6-cd02-4a55-b91b-7453cea46f48
- 89Layer: Emerging hot spots: Bird surveys. 156 features id d5d16299-e985-46e4-8b02-95e30d5f391d
- 90Layer: Hot spot analysis: Bird surveys. 650 features id 40e70c81-7b21-4bc1-95c1-f82d27de5cb5
- 91Layer: Calculate density: Bird surveys. 699 features id ffc41d66-b6e8-4e66-874f-7f196e443401
- 92Layer: Find point clusters: Bird surveys. 650 features id 595715b9-59fc-4d3b-9302-d6088eb0b54e
- 93Layer: Find point clusters: cluster hulls. 1 features id 9d1168bd-46a8-44f2-9151-b8f90e9969ce
- 94Layer: Find outliers: Exclusion zones. 8 features id 51682486-1e75-4431-9877-84e23905da06
- 95Layer: Find outliers: Dust storms. 14 features id 30d0b0fa-9659-4bb8-9bc1-dde109be98eb
- 96Layer: Find outliers: Candidate sites. 30 features id fdc1035f-c5c6-4b5a-9a27-a2211ccf6ee1
Appendix: the data behind the chartsShow
Figure 1. Timeline: events per month by dataset 1
| period | series | value |
|---|---|---|
| 2024-02-01 | Bird surveys | 0 |
| 2024-02-01 | Site irradiance by month | 0 |
| 2024-02-01 | Dust storms | 1 |
| 2024-03-01 | Bird surveys | 0 |
| 2024-03-01 | Site irradiance by month | 0 |
| 2024-03-01 | Dust storms | 1 |
| 2024-04-01 | Bird surveys | 0 |
| 2024-04-01 | Site irradiance by month | 0 |
| 2024-04-01 | Dust storms | 0 |
| 2024-05-01 | Bird surveys | 0 |
| 2024-05-01 | Site irradiance by month | 0 |
| 2024-05-01 | Dust storms | 1 |
| 2024-06-01 | Bird surveys | 0 |
| 2024-06-01 | Site irradiance by month | 0 |
| 2024-06-01 | Dust storms | 1 |
| 2024-07-01 | Bird surveys | 0 |
| 2024-07-01 | Site irradiance by month | 0 |
| 2024-07-01 | Dust storms | 0 |
| 2024-08-01 | Bird surveys | 0 |
| 2024-08-01 | Site irradiance by month | 0 |
| 2024-08-01 | Dust storms | 1 |
| 2024-09-01 | Bird surveys | 0 |
| 2024-09-01 | Site irradiance by month | 0 |
| 2024-09-01 | Dust storms | 0 |
| 2024-10-01 | Bird surveys | 0 |
| 2024-10-01 | Site irradiance by month | 0 |
| 2024-10-01 | Dust storms | 1 |
| 2024-11-01 | Bird surveys | 0 |
| 2024-11-01 | Site irradiance by month | 0 |
| 2024-11-01 | Dust storms | 0 |
| 2024-12-01 | Bird surveys | 0 |
| 2024-12-01 | Site irradiance by month | 0 |
| 2024-12-01 | Dust storms | 0 |
| 2025-01-01 | Bird surveys | 0 |
| 2025-01-01 | Site irradiance by month | 30 |
| 2025-01-01 | Dust storms | 0 |
| 2025-02-01 | Bird surveys | 0 |
| 2025-02-01 | Site irradiance by month | 30 |
| 2025-02-01 | Dust storms | 2 |
| 2025-03-01 | Bird surveys | 103 |
| 2025-03-01 | Site irradiance by month | 30 |
| 2025-03-01 | Dust storms | 0 |
| 2025-04-01 | Bird surveys | 85 |
| 2025-04-01 | Site irradiance by month | 30 |
| 2025-04-01 | Dust storms | 0 |
| 2025-05-01 | Bird surveys | 23 |
| 2025-05-01 | Site irradiance by month | 30 |
| 2025-05-01 | Dust storms | 3 |
| 2025-06-01 | Bird surveys | 24 |
| 2025-06-01 | Site irradiance by month | 30 |
| 2025-06-01 | Dust storms | 3 |
| 2025-07-01 | Bird surveys | 22 |
| 2025-07-01 | Site irradiance by month | 30 |
| 2025-07-01 | Dust storms | 0 |
| 2025-08-01 | Bird surveys | 22 |
| 2025-08-01 | Site irradiance by month | 30 |
| 2025-08-01 | Dust storms | 0 |
| 2025-09-01 | Bird surveys | 63 |
| 2025-09-01 | Site irradiance by month | 30 |
| 2025-09-01 | Dust storms | 0 |
| 2025-10-01 | Bird surveys | 75 |
| 2025-10-01 | Site irradiance by month | 30 |
| 2025-10-01 | Dust storms | 0 |
| 2025-11-01 | Bird surveys | 20 |
| 2025-11-01 | Site irradiance by month | 30 |
| 2025-11-01 | Dust storms | 0 |
| 2025-12-01 | Bird surveys | 19 |
| 2025-12-01 | Site irradiance by month | 30 |
| 2025-12-01 | Dust storms | 0 |
| 2026-01-01 | Bird surveys | 15 |
| 2026-01-01 | Site irradiance by month | 0 |
| 2026-01-01 | Dust storms | 0 |
| 2026-02-01 | Bird surveys | 15 |
| 2026-02-01 | Site irradiance by month | 0 |
| 2026-02-01 | Dust storms | 0 |
| 2026-03-01 | Bird surveys | 69 |
| 2026-03-01 | Site irradiance by month | 0 |
| 2026-03-01 | Dust storms | 0 |
| 2026-04-01 | Bird surveys | 80 |
| 2026-04-01 | Site irradiance by month | 0 |
| 2026-04-01 | Dust storms | 0 |
| 2026-05-01 | Bird surveys | 15 |
| 2026-05-01 | Site irradiance by month | 0 |
| 2026-05-01 | Dust storms | 0 |
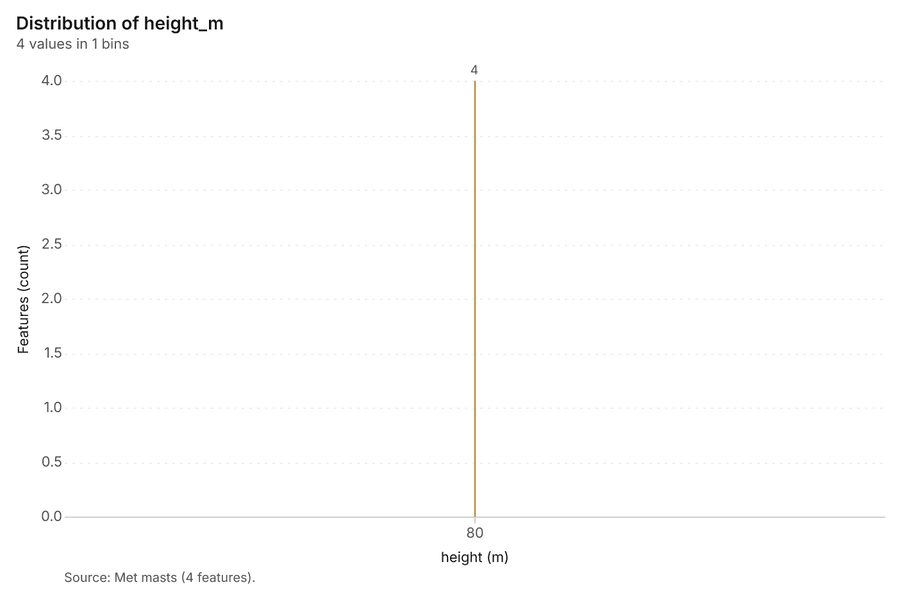
Figure 16. Met masts over time (installed_year) 59
| bin_start | bin_end | count |
|---|---|---|
| 80 | 80 | 4 |
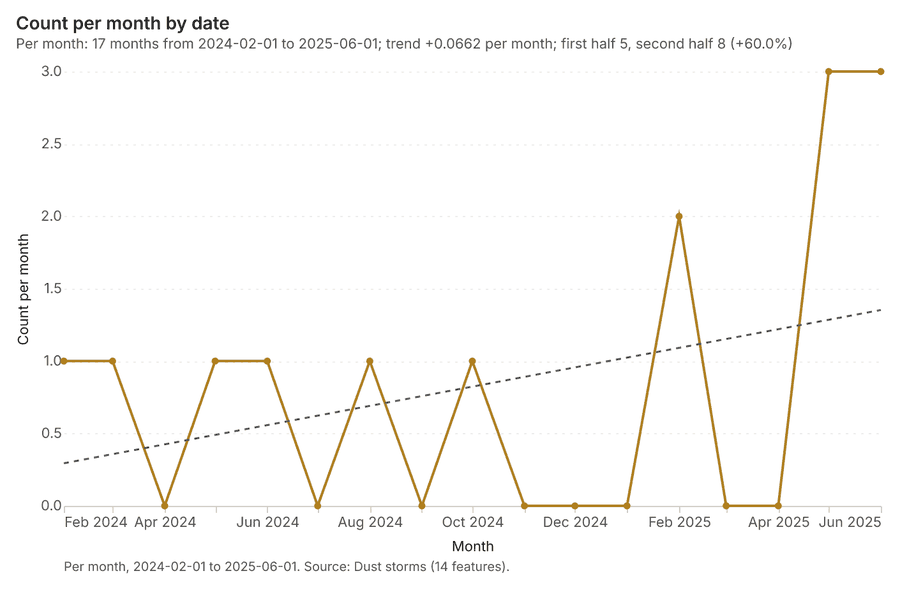
Figure 17. Dust storms over time (date) 60
| period | value |
|---|---|
| 2024-02-01 | 1 |
| 2024-03-01 | 1 |
| 2024-04-01 | 0 |
| 2024-05-01 | 1 |
| 2024-06-01 | 1 |
| 2024-07-01 | 0 |
| 2024-08-01 | 1 |
| 2024-09-01 | 0 |
| 2024-10-01 | 1 |
| 2024-11-01 | 0 |
| 2024-12-01 | 0 |
| 2025-01-01 | 0 |
| 2025-02-01 | 2 |
| 2025-03-01 | 0 |
| 2025-04-01 | 0 |
| 2025-05-01 | 3 |
| 2025-06-01 | 3 |
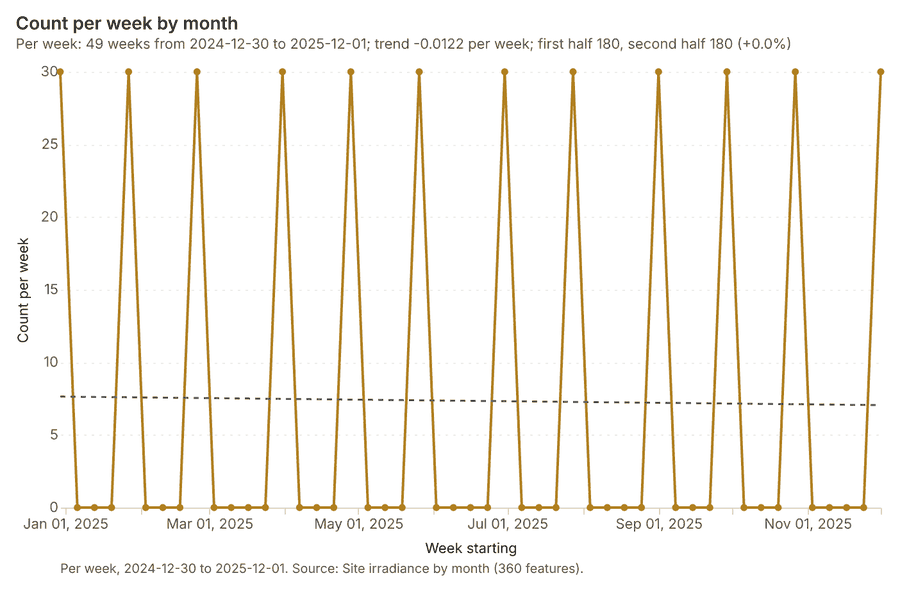
Figure 18. Site irradiance by month over time (month) 61
| period | value |
|---|---|
| 2024-12-30 | 30 |
| 2025-01-06 | 0 |
| 2025-01-13 | 0 |
| 2025-01-20 | 0 |
| 2025-01-27 | 30 |
| 2025-02-03 | 0 |
| 2025-02-10 | 0 |
| 2025-02-17 | 0 |
| 2025-02-24 | 30 |
| 2025-03-03 | 0 |
| 2025-03-10 | 0 |
| 2025-03-17 | 0 |
| 2025-03-24 | 0 |
| 2025-03-31 | 30 |
| 2025-04-07 | 0 |
| 2025-04-14 | 0 |
| 2025-04-21 | 0 |
| 2025-04-28 | 30 |
| 2025-05-05 | 0 |
| 2025-05-12 | 0 |
| 2025-05-19 | 0 |
| 2025-05-26 | 30 |
| 2025-06-02 | 0 |
| 2025-06-09 | 0 |
| 2025-06-16 | 0 |
| 2025-06-23 | 0 |
| 2025-06-30 | 30 |
| 2025-07-07 | 0 |
| 2025-07-14 | 0 |
| 2025-07-21 | 0 |
| 2025-07-28 | 30 |
| 2025-08-04 | 0 |
| 2025-08-11 | 0 |
| 2025-08-18 | 0 |
| 2025-08-25 | 0 |
| 2025-09-01 | 30 |
| 2025-09-08 | 0 |
| 2025-09-15 | 0 |
| 2025-09-22 | 0 |
| 2025-09-29 | 30 |
| 2025-10-06 | 0 |
| 2025-10-13 | 0 |
| 2025-10-20 | 0 |
| 2025-10-27 | 30 |
| 2025-11-03 | 0 |
| 2025-11-10 | 0 |
| 2025-11-17 | 0 |
| 2025-11-24 | 0 |
| 2025-12-01 | 30 |
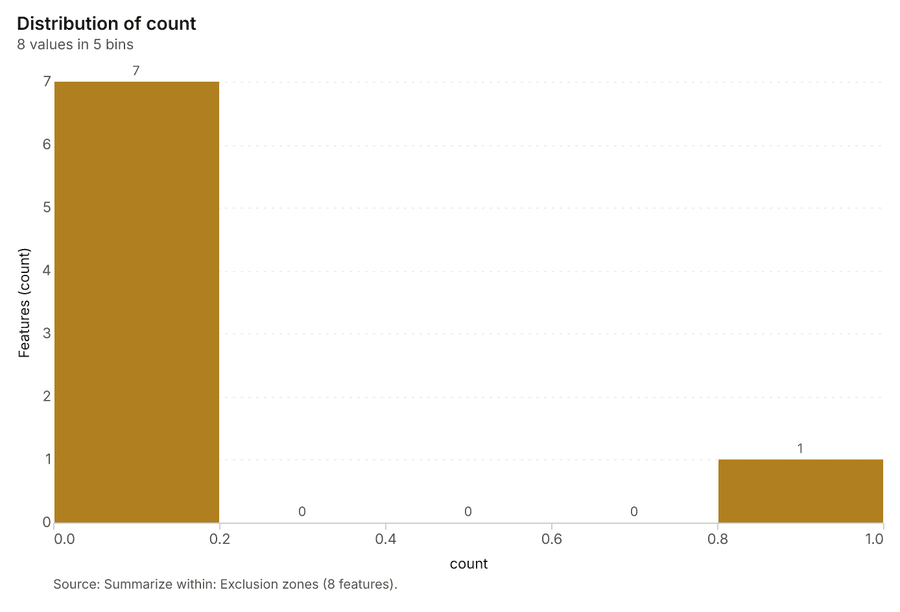
Figure 19. Summarize within: Exclusion zones 62
| bin_start | bin_end | count |
|---|---|---|
| 0 | 0.2 | 7 |
| 0.2 | 0.4 | 0 |
| 0.4 | 0.6 | 0 |
| 0.6 | 0.8 | 0 |
| 0.8 | 1 | 1 |
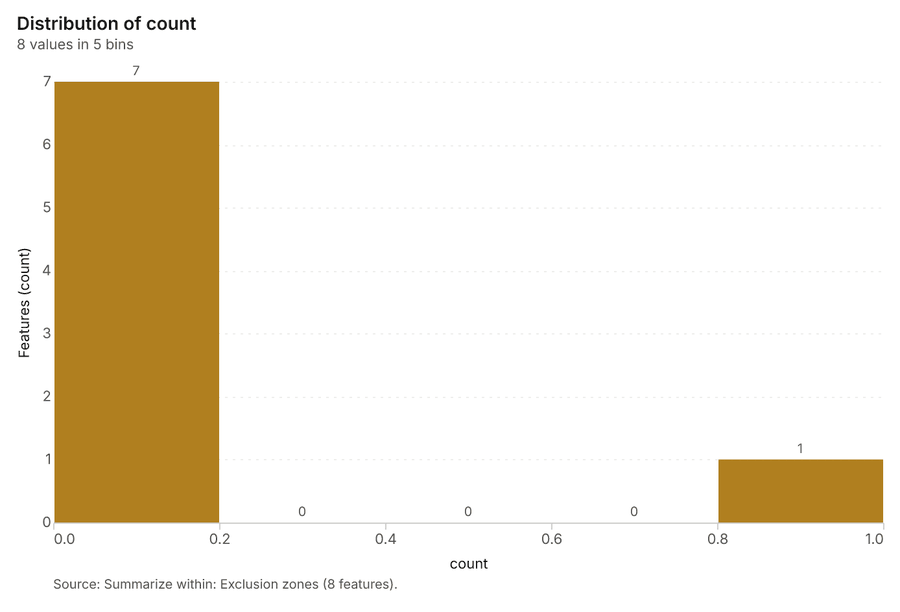
Figure 20. Summarize within: Exclusion zones 63
| bin_start | bin_end | count |
|---|---|---|
| 0 | 0.2 | 7 |
| 0.2 | 0.4 | 0 |
| 0.4 | 0.6 | 0 |
| 0.6 | 0.8 | 0 |
| 0.8 | 1 | 1 |
Figure 21. Summarize within: Exclusion zones 64
| bin_start | bin_end | count |
|---|---|---|
| 1 | 76 | 7 |
| 76 | 151 | 0 |
| 151 | 226 | 0 |
| 226 | 301 | 0 |
| 301 | 376 | 1 |
Figure 22. Emerging hot spots: Bird surveys 65
| bin_start | bin_end | count |
|---|---|---|
| -0.587 | -0.4234 | 113 |
| -0.4234 | -0.2599 | 8 |
| -0.2599 | -0.09633 | 0 |
| -0.09633 | 0.06722 | 7 |
| 0.06722 | 0.2308 | 0 |
| 0.2308 | 0.3943 | 19 |
| 0.3943 | 0.5579 | 0 |
| 0.5579 | 0.7214 | 7 |
| 0.7214 | 0.885 | 2 |
Figure 23. Hot spot analysis: Bird surveys 66
| bin_start | bin_end | band | band_label | count |
|---|---|---|---|---|
| -2.5 | -2 | cold_95 | Cold spot, 95% confidence | 5 |
| -2 | -1.5 | cold_90 | Cold spot, 90% confidence | 12 |
| -2 | -1.5 | not_significant | Not significant | 3 |
| -1.5 | -1 | not_significant | Not significant | 41 |
| -1 | -0.5 | not_significant | Not significant | 73 |
| -0.5 | 0 | not_significant | Not significant | 129 |
| 0 | 0.5 | not_significant | Not significant | 191 |
| 0.5 | 1 | not_significant | Not significant | 141 |
| 1 | 1.5 | not_significant | Not significant | 32 |
| 1.5 | 2 | hot_90 | Hot spot, 90% confidence | 6 |
| 1.5 | 2 | not_significant | Not significant | 9 |
| 2 | 2.5 | hot_95 | Hot spot, 95% confidence | 4 |
| 2.5 | 3 | hot_99 | Hot spot, 99% confidence | 4 |
Figure 24. Calculate density: Bird surveys 67
| bin_start | bin_end | count |
|---|---|---|
| 0 | 2.818 | 55 |
| 2.818 | 5.636 | 69 |
| 5.636 | 8.455 | 70 |
| 8.455 | 11.27 | 70 |
| 11.27 | 14.09 | 70 |
| 14.09 | 16.91 | 45 |
| 16.91 | 19.73 | 70 |
| 19.73 | 22.55 | 69 |
| 22.55 | 25.36 | 69 |
| 25.36 | 28.18 | 67 |
| 28.18 | 31 | 45 |
Figure 25. Find point clusters: Bird surveys 68
| cluster | features | fraction | share |
|---|---|---|---|
| 0 | 389 | 0.5985 | 59.8% |
| Noise | 261 | 0.4015 | 40.2% |
Figure 26. Find point clusters: cluster hulls 69
| cluster | features | fraction | share |
|---|---|---|---|
| 0 | 1 | 1 | 100.0% |
Figure 27. Find outliers: Exclusion zones 70
| value | lag | type |
|---|---|---|
| 1.291 | -0.0861 | NS |
| -0.7746 | 0.2582 | NS |
| 1.291 | 0.6025 | NS |
| -0.7746 | -0.7746 | NS |
| -0.7746 | -0.7746 | NS |
| -0.7746 | 1.291 | NS |
| 1.291 | 1.291 | NS |
| -0.7746 | -0.7746 | NS |
Figure 28. Find outliers: Dust storms 71
| value | lag | type |
|---|---|---|
| 0.1617 | -0.2244 | NS |
| 2.125 | 1.529 | NS |
| 1.529 | 0.1097 | NS |
| -0.346 | -0.3822 | NS |
| -0.4806 | -0.2691 | NS |
| 0.7336 | -0.4016 | NS |
| -0.3093 | -0.3699 | NS |
| -0.7681 | -0.1513 | NS |
| 0.4736 | -0.3448 | NS |
| -0.7498 | -0.1231 | NS |
| -0.3736 | 0.0531 | NS |
| -1.423 | -0.0779 | NS |
| -1.389 | -0.2628 | NS |
| 0.8162 | -0.4023 | NS |
Figure 29. Find outliers: Candidate sites 72
| value | lag | type |
|---|---|---|
| -0.3735 | 0.1182 | NS |
| -1.269 | 0.0355 | NS |
| -0.4788 | -0.3687 | NS |
| -1.357 | 0.1248 | NS |
| -0.8652 | 0.3426 | NS |
| 0.3992 | -0.8257 | NS |
| 0.4519 | -0.6826 | NS |
| 1.629 | 0.1182 | NS |
| -0.8652 | 0.4958 | NS |
| 0.3817 | 0.3846 | NS |
| 0.6275 | 0.5974 | NS |
| 1.26 | -0.5901 | NS |
| 1.699 | 0.2974 | NS |
| -1.129 | 0.192 | NS |
| 1.734 | 0.4314 | NS |
| -0.8301 | 0.1744 | NS |
| -0.1101 | 0.0941 | NS |
| -0.6545 | -0.0498 | NS |
| 0.0831 | -0.5165 | NS |
| -1.076 | -0.2576 | NS |
| 1.593 | -0.064 | NS |
| -0.5842 | 0.0363 | NS |
| -1.252 | -0.0242 | NS |
| 1.646 | -0.1803 | NS |
| -0.7423 | -0.2084 | NS |
| 0.5397 | -0.0135 | NS |
| 1.067 | 0.7988 | NS |
| -0.8125 | -0.8301 | NS |
| -0.233 | -0.1335 | NS |
| -0.4788 | 0.0704 | NS |
Figure 30. Find outliers: Dust storms over time 73
| period | value |
|---|---|
| 2024-02-01 | 1 |
| 2024-03-01 | 1 |
| 2024-04-01 | 0 |
| 2024-05-01 | 1 |
| 2024-06-01 | 1 |
| 2024-07-01 | 0 |
| 2024-08-01 | 1 |
| 2024-09-01 | 0 |
| 2024-10-01 | 1 |
| 2024-11-01 | 0 |
| 2024-12-01 | 0 |
| 2025-01-01 | 0 |
| 2025-02-01 | 2 |
| 2025-03-01 | 0 |
| 2025-04-01 | 0 |
| 2025-05-01 | 3 |
| 2025-06-01 | 3 |
Figure 31. Find point clusters: Bird surveys over time 74
| period | series | value |
|---|---|---|
| 2025-03-01 | 2 | 20 |
| 2025-03-01 | 1 | 23 |
| 2025-03-01 | 3 | 17 |
| 2025-03-01 | 4 | 19 |
| 2025-03-01 | 5 | 15 |
| 2025-03-01 | Other | 9 |
| 2025-04-01 | 2 | 24 |
| 2025-04-01 | 1 | 25 |
| 2025-04-01 | 3 | 13 |
| 2025-04-01 | 4 | 9 |
| 2025-04-01 | 5 | 10 |
| 2025-04-01 | Other | 4 |
| 2025-05-01 | 2 | 7 |
| 2025-05-01 | 1 | 4 |
| 2025-05-01 | 3 | 7 |
| 2025-05-01 | 4 | 2 |
| 2025-05-01 | 5 | 1 |
| 2025-05-01 | Other | 2 |
| 2025-06-01 | 2 | 8 |
| 2025-06-01 | 1 | 3 |
| 2025-06-01 | 3 | 5 |
| 2025-06-01 | 4 | 5 |
| 2025-06-01 | 5 | 1 |
| 2025-06-01 | Other | 2 |
| 2025-07-01 | 2 | 5 |
| 2025-07-01 | 1 | 3 |
| 2025-07-01 | 3 | 6 |
| 2025-07-01 | 4 | 5 |
| 2025-07-01 | 5 | 1 |
| 2025-07-01 | Other | 2 |
| 2025-08-01 | 2 | 5 |
| 2025-08-01 | 1 | 3 |
| 2025-08-01 | 3 | 6 |
| 2025-08-01 | 4 | 3 |
| 2025-08-01 | 5 | 2 |
| 2025-08-01 | Other | 3 |
| 2025-09-01 | 2 | 20 |
| 2025-09-01 | 1 | 17 |
| 2025-09-01 | 3 | 14 |
| 2025-09-01 | 4 | 8 |
| 2025-09-01 | 5 | 2 |
| 2025-09-01 | Other | 2 |
| 2025-10-01 | 2 | 19 |
| 2025-10-01 | 1 | 22 |
| 2025-10-01 | 3 | 8 |
| 2025-10-01 | 4 | 13 |
| 2025-10-01 | 5 | 6 |
| 2025-10-01 | Other | 7 |
| 2025-11-01 | 2 | 2 |
| 2025-11-01 | 1 | 5 |
| 2025-11-01 | 3 | 4 |
| 2025-11-01 | 4 | 4 |
| 2025-11-01 | 5 | 3 |
| 2025-11-01 | Other | 2 |
| 2025-12-01 | 2 | 1 |
| 2025-12-01 | 1 | 5 |
| 2025-12-01 | 3 | 4 |
| 2025-12-01 | 4 | 4 |
| 2025-12-01 | 5 | 1 |
| 2025-12-01 | Other | 4 |
| 2026-01-01 | 2 | 4 |
| 2026-01-01 | 1 | 2 |
| 2026-01-01 | 3 | 5 |
| 2026-01-01 | 4 | 3 |
| 2026-01-01 | 5 | 1 |
| 2026-01-01 | Other | 0 |
| 2026-02-01 | 2 | 3 |
| 2026-02-01 | 1 | 2 |
| 2026-02-01 | 3 | 3 |
| 2026-02-01 | 4 | 4 |
| 2026-02-01 | 5 | 2 |
| 2026-02-01 | Other | 1 |
| 2026-03-01 | 2 | 16 |
| 2026-03-01 | 1 | 16 |
| 2026-03-01 | 3 | 12 |
| 2026-03-01 | 4 | 11 |
| 2026-03-01 | 5 | 6 |
| 2026-03-01 | Other | 8 |
| 2026-04-01 | 2 | 16 |
| 2026-04-01 | 1 | 19 |
| 2026-04-01 | 3 | 15 |
| 2026-04-01 | 4 | 16 |
| 2026-04-01 | 5 | 6 |
| 2026-04-01 | Other | 8 |
| 2026-05-01 | 2 | 5 |
| 2026-05-01 | 1 | 5 |
| 2026-05-01 | 3 | 1 |
| 2026-05-01 | 4 | 1 |
| 2026-05-01 | 5 | 1 |
| 2026-05-01 | Other | 2 |
Figure 32. Hot spot analysis: Bird surveys over time 75
| period | series | value |
|---|---|---|
| 2025-03-01 | 2 | 20 |
| 2025-03-01 | 1 | 23 |
| 2025-03-01 | 3 | 17 |
| 2025-03-01 | 4 | 19 |
| 2025-03-01 | 5 | 15 |
| 2025-03-01 | Other | 9 |
| 2025-04-01 | 2 | 24 |
| 2025-04-01 | 1 | 25 |
| 2025-04-01 | 3 | 13 |
| 2025-04-01 | 4 | 9 |
| 2025-04-01 | 5 | 10 |
| 2025-04-01 | Other | 4 |
| 2025-05-01 | 2 | 7 |
| 2025-05-01 | 1 | 4 |
| 2025-05-01 | 3 | 7 |
| 2025-05-01 | 4 | 2 |
| 2025-05-01 | 5 | 1 |
| 2025-05-01 | Other | 2 |
| 2025-06-01 | 2 | 8 |
| 2025-06-01 | 1 | 3 |
| 2025-06-01 | 3 | 5 |
| 2025-06-01 | 4 | 5 |
| 2025-06-01 | 5 | 1 |
| 2025-06-01 | Other | 2 |
| 2025-07-01 | 2 | 5 |
| 2025-07-01 | 1 | 3 |
| 2025-07-01 | 3 | 6 |
| 2025-07-01 | 4 | 5 |
| 2025-07-01 | 5 | 1 |
| 2025-07-01 | Other | 2 |
| 2025-08-01 | 2 | 5 |
| 2025-08-01 | 1 | 3 |
| 2025-08-01 | 3 | 6 |
| 2025-08-01 | 4 | 3 |
| 2025-08-01 | 5 | 2 |
| 2025-08-01 | Other | 3 |
| 2025-09-01 | 2 | 20 |
| 2025-09-01 | 1 | 17 |
| 2025-09-01 | 3 | 14 |
| 2025-09-01 | 4 | 8 |
| 2025-09-01 | 5 | 2 |
| 2025-09-01 | Other | 2 |
| 2025-10-01 | 2 | 19 |
| 2025-10-01 | 1 | 22 |
| 2025-10-01 | 3 | 8 |
| 2025-10-01 | 4 | 13 |
| 2025-10-01 | 5 | 6 |
| 2025-10-01 | Other | 7 |
| 2025-11-01 | 2 | 2 |
| 2025-11-01 | 1 | 5 |
| 2025-11-01 | 3 | 4 |
| 2025-11-01 | 4 | 4 |
| 2025-11-01 | 5 | 3 |
| 2025-11-01 | Other | 2 |
| 2025-12-01 | 2 | 1 |
| 2025-12-01 | 1 | 5 |
| 2025-12-01 | 3 | 4 |
| 2025-12-01 | 4 | 4 |
| 2025-12-01 | 5 | 1 |
| 2025-12-01 | Other | 4 |
| 2026-01-01 | 2 | 4 |
| 2026-01-01 | 1 | 2 |
| 2026-01-01 | 3 | 5 |
| 2026-01-01 | 4 | 3 |
| 2026-01-01 | 5 | 1 |
| 2026-01-01 | Other | 0 |
| 2026-02-01 | 2 | 3 |
| 2026-02-01 | 1 | 2 |
| 2026-02-01 | 3 | 3 |
| 2026-02-01 | 4 | 4 |
| 2026-02-01 | 5 | 2 |
| 2026-02-01 | Other | 1 |
| 2026-03-01 | 2 | 16 |
| 2026-03-01 | 1 | 16 |
| 2026-03-01 | 3 | 12 |
| 2026-03-01 | 4 | 11 |
| 2026-03-01 | 5 | 6 |
| 2026-03-01 | Other | 8 |
| 2026-04-01 | 2 | 16 |
| 2026-04-01 | 1 | 19 |
| 2026-04-01 | 3 | 15 |
| 2026-04-01 | 4 | 16 |
| 2026-04-01 | 5 | 6 |
| 2026-04-01 | Other | 8 |
| 2026-05-01 | 2 | 5 |
| 2026-05-01 | 1 | 5 |
| 2026-05-01 | 3 | 1 |
| 2026-05-01 | 4 | 1 |
| 2026-05-01 | 5 | 1 |
| 2026-05-01 | Other | 2 |
GeoBit Large Spatial Model. Findings are labeled Evidenced (computed by a tool), Inferred (a reading or reasoning) or Unverified (no evidence yet).