Sample: Corporate security and travel risk, Mexico City: report
Project: Sample: Corporate security and travel risk, Mexico City
Goal: Describe the project Sample: Corporate security and travel risk, Mexico City: run the analyses that tell the most about its data, draw every result, and write a cited report.
Run: 294d550b-9eea-4398-b429-6280256992ba (running, 11 agent run(s))
Generated: 2026-10-18T05:29:33Z, version 1
Model cost: USD 0.0000 over 0 model call(s)
Data used
| Data | Kind | Rows | Time span | Summary | Source |
|---|---|---|---|---|---|
| Company sites | vector, Point | 8 | 8 point features; 'type' has 4 values (top: office 3, warehouse 2, client 2); 'security_level' has 2 values (top: standard 6, enhanced 2); 'staff' 8 to 420 (mean 97.5); named by 'name' (e.g. Head office, Distribution center, Sales office Norte); extent -99.1652,19.4107 to -99.1046,19.4578. Point locations of Company sites by type. | 107 | |
| Hotels | vector, Point | 30 | 30 point features; 'approved' has 2 values (top: True 17, False 13); 'stars' 3 to 5 (mean 4.067); named by 'name' (e.g. Hotel Los Pinos 1, Hotel El Cerro 2, Hotel La Fuente 3); extent -99.1728,19.4108 to -99.1024,19.4643. Point locations of Hotels by approved. | 108 | |
| Travel routes | vector, LineString | 10 | 10 line features; 'mode' has 2 values (top: approved taxi 8, company car 2); 'typical_min' 19 to 44 (mean 30.2); named by 'name' (e.g. Airport to Head office, Airport to Hotel Los Pinos 1, Hotel Los Pinos 1 to Head office); total length 51.24 km; extent -99.1652,19.4105 to -99.0901,19.4643. Lines (Travel routes) such as routes or networks. | 109 | |
| Security incidents | vector, Point | 1,700 | 2025-10-01 to 2026-09-30 | 1,700 point features; dated by 'occurred_at' from 2025-10-01 to 2026-09-30; 'type' has 8 values (top: robbery 456, theft 390, vandalism 252); 'severity' has 3 values (top: low 832, medium 610, high 258); extent -99.1802,19.3971 to -99.0859,19.4682. Dated point events by type: where and when Security incidents happen. | 2 |
| Risk zones | vector, Polygon | 14 | 14 polygon (area) features; 'night_travel' has 3 values (top: escort 5, allowed 5, avoid 4); 'risk_score' 1 to 10 (mean 6.143); named by 'name' (e.g. La Ribera, Los Pinos, El Cerro); total area 80.06 km2; extent -99.1809,19.3964 to -99.0856,19.4688. Areas (Risk zones) with risk_score to compare and map. | 110 | |
| Hospitals | vector, Point | 15 | 15 point features; 'english_speaking' has 2 values (top: False 9, True 6); 'trauma_level' 1 to 3 (mean 1.6); named by 'name' (e.g. Hospital Las Acacias, Hospital El Puerto Viejo, Hospital La Alameda); extent -99.1691,19.4018 to -99.0923,19.4672. Point locations of Hospitals by english_speaking. | 111 | |
| Safe havens | vector, Point | 12 | 12 point features; 'type' has 4 values (top: partner office 4, embassy 4, hotel 3); 'open_24h' has 2 values (top: True 6, False 6); extent -99.1732,19.4029 to -99.0999,19.4675. Point locations of Safe havens by type. | 112 | |
| Protest events | vector, Point | 80 | 2026-01-05 to 2026-09-28 | 80 point features; dated by 'date' from 2026-01-05 to 2026-09-28; 'size' has 3 values (top: large 32, small 28, medium 20); 'theme' has 4 values (top: education 23, water 22, labor 21); extent -99.1465,19.4258 to -99.1195,19.4519. Dated point events by size: where and when Protest events happen. | 3 |
| Travel log | table | 400 | 2025-10-01 to 2026-09-30 | Table of 400 rows and 6 columns without geometry; dated by 'date' from 2025-10-01 to 2026-09-30; 'incident_reported' has 2 values (top: False 390, True 10); 'travellers' 1 to 4 (mean 2.56); 'delay_min' 0 to 24 (mean 6.668). A table of Travel log without locations. | 4 |
| Site guard roster | table | 16 | Table of 16 rows and 4 columns without geometry; 'shift' has 2 values (top: day 8, night 8); 'armed' has 2 values (top: False 15, True 1); 'guards' 1 to 6 (mean 4.188). A table of Site guard roster without locations. | 113 | |
| Country security briefing | document | 1-page pdf document 'Country security briefing'; language en; mentions 7 place(s): Head office to Distribution center (1), Head of (1), Distribution (1), La Ribera (1), Head office (1). A document about Head office to Distribution center, Head of, Distribution. | 114 | ||
| Hotel security assessment | document | 1-page md document 'Hotel security assessment'; language en; mentions 4 place(s): Hotel Los Pinos 1 (1), Hotel El Cerro 2 (1), Head office (1), Hotel La Fuente 3 (1). A document about Hotel Los Pinos 1, Hotel El Cerro 2, Head office. | 115 | ||
| Sample: Corporate security and travel risk, Mexico City | record | 116 | |||
| Hot spot analysis: Protest events | layer, Polygon | 29 | 117 | ||
| Hot spot analysis: Hotels | layer, Polygon | 14 | 118 | ||
| Hot spot analysis: Security incidents | layer, Polygon | 353 | 119 | ||
| Emerging hot spots: Protest events | layer, Polygon | 14 | 120 | ||
| Emerging hot spots: Security incidents | layer, Polygon | 108 | 121 | ||
| Repeat and near repeat classification: Protest events | layer, Point | 80 | 122 | ||
| Summarize within: Risk zones | layer, Polygon | 14 | 123 | ||
| Summarize within: Risk zones | layer, Polygon | 14 | 124 | ||
| Summarize within: Risk zones | layer, Polygon | 14 | 125 | ||
| Find point clusters: Hospitals | layer, Point | 15 | 126 | ||
| Find point clusters: cluster hulls | layer, Polygon | 1 | 127 | ||
| Find point clusters: Safe havens | layer, Point | 12 | 128 | ||
| Find point clusters: cluster hulls | layer, Polygon | 2 | 129 | ||
| Find point clusters: Protest events | layer, Point | 80 | 130 | ||
| Find point clusters: cluster hulls | layer, Polygon | 1 | 131 | ||
| Calculate density: Protest events | layer, Polygon | 386 | 132 | ||
| Calculate density: Hotels | layer, Polygon | 82 | 133 | ||
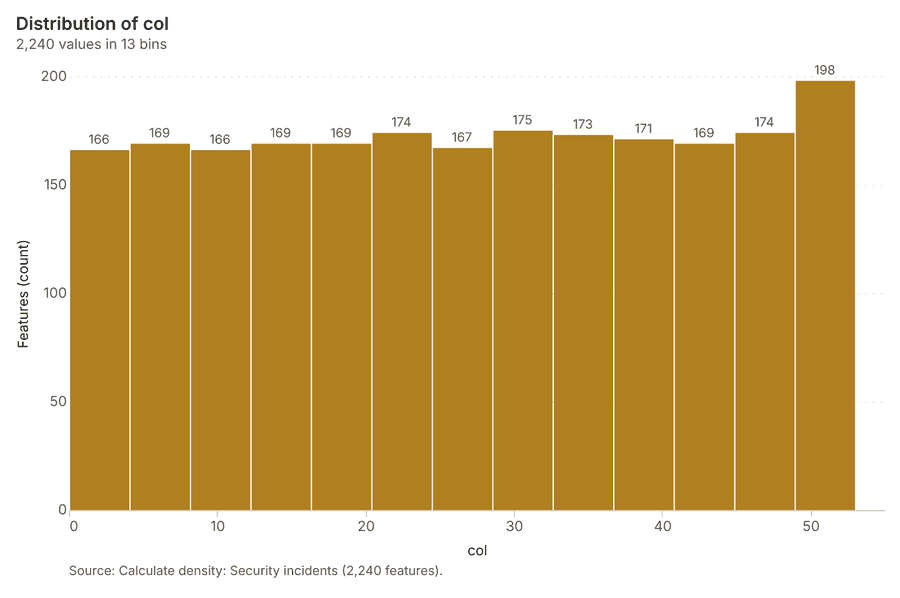
| Calculate density: Security incidents | layer, Polygon | 2,240 | 134 | ||
| Find outliers: Risk zones | layer, Polygon | 14 | 135 | ||
| Find nearest: Hospitals | layer, Point | 14 | 136 | ||
| Find nearest: Hospitals | layer, Point | 14 | 137 | ||
| Find nearest: Hospitals | layer, Point | 6 | 138 |
Timeline
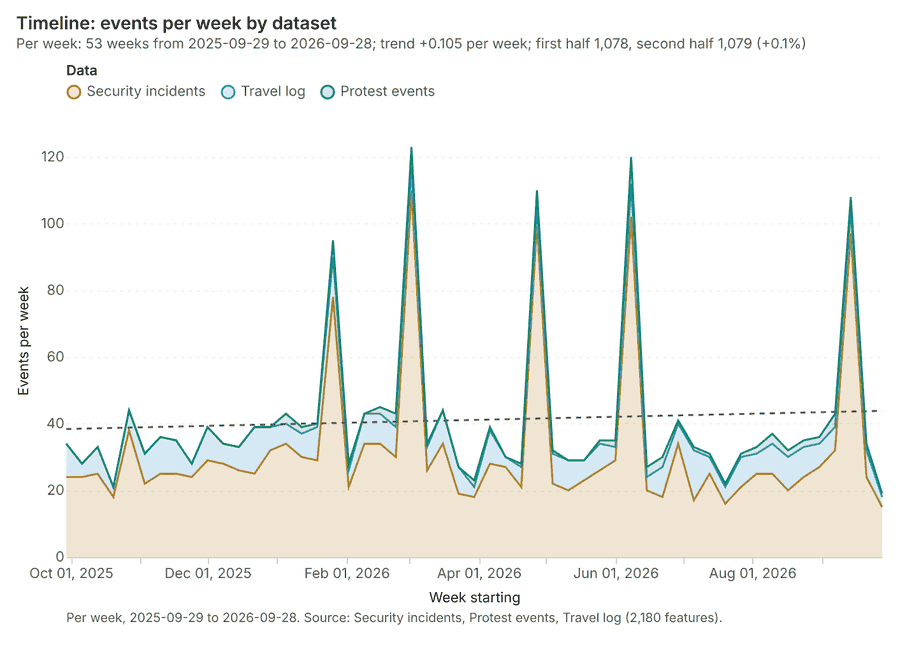
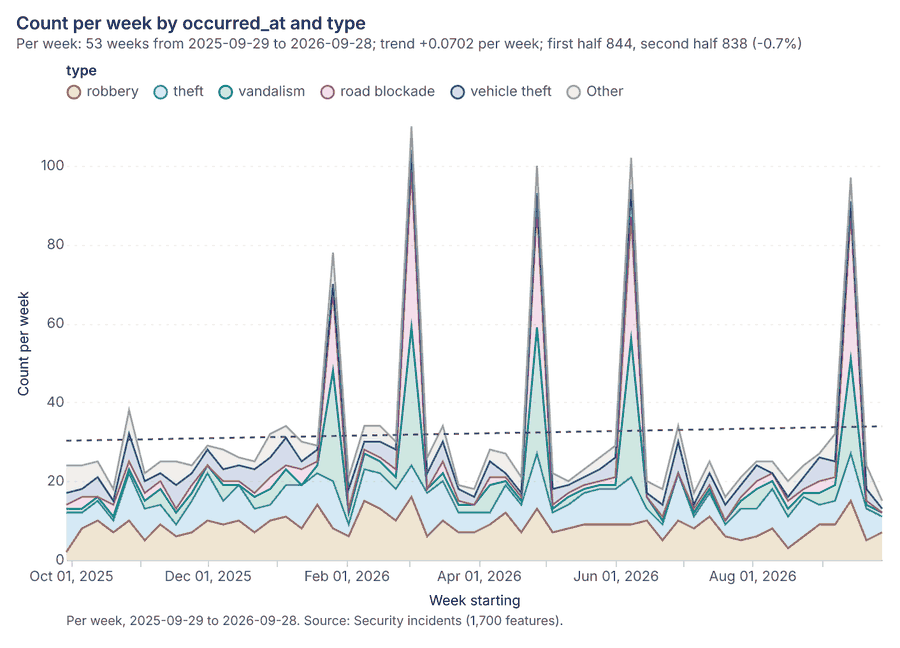
The timeline counts 2,180 dated events in Security incidents, Protest events, Travel log per week, from week of 2025-09-29 to week of 2026-09-28 1234. By dataset: Security incidents 1,700; Travel log 400; Protest events 80 1. The trend is +0.105 events per week; the second half of the weeks has 1,079 against 1,078 in the first (+0.1%) 1.
Busiest weeks
Quietest weeks
Hot spots
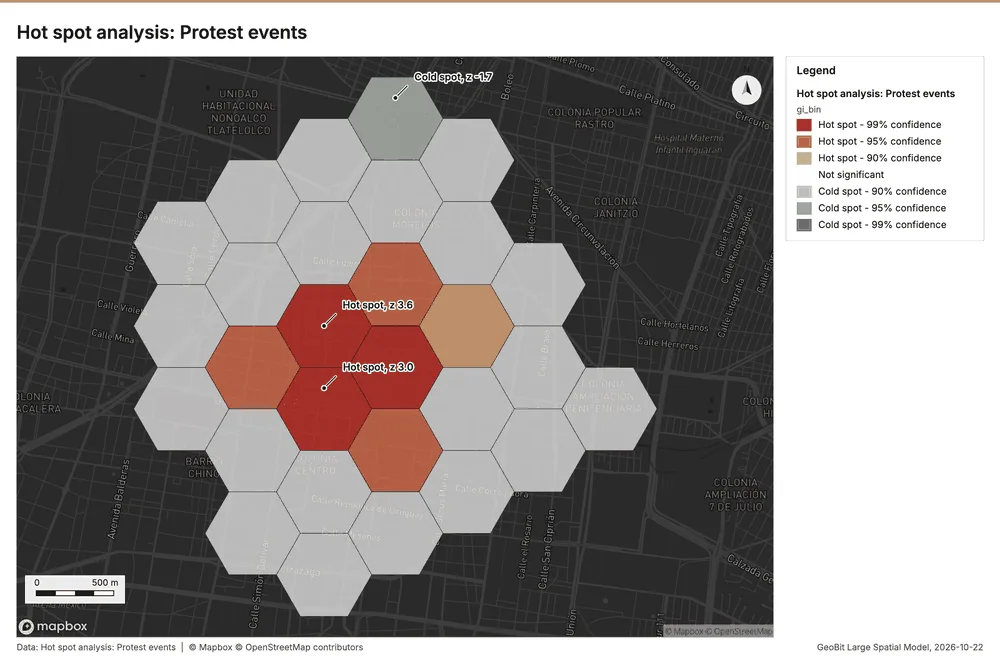
What this analysis is. Hot spot analysis: Getis-Ord Gi* hot and cold spots with z-scores, p-values and confidence bins 5. In ArcGIS it is Find Hot Spots or Hot Spot Analysis (Getis-Ord Gi*); in QGIS, qgis:hotspot (plugin) 5.
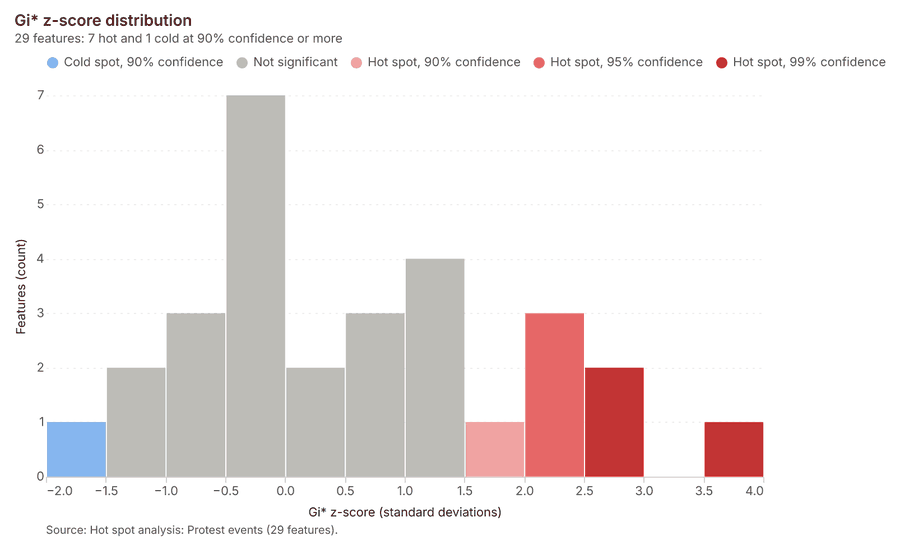
Why it was run on this data. 80 points: Getis-Ord Gi* tests whether the concentrations in Protest events are statistically significant 6.
What it found. Hot spots on Protest events: Hot spot analysis: 1 layer saved: Hot spot analysis: Protest events (29 features) 78. It reported result, bins 29; result, count 29; result, elapsed ms 5; result, cell size m 500; result, incidents used 80; result, distance band m 1,000 7.
| Result | Value |
|---|---|
| result, bins | 29 |
| result, count | 29 |
| result, elapsed ms | 5 |
| result, cell size m | 500 |
| result, incidents used | 80 |
| result, distance band m | 1,000 |
| billing, cost | 0.0516 |
| billing, list price | 0.0516 |
| billing, upstream cost | 0 |
Findings
- Evidenced: Hot spots on Protest events: Hot spot analysis: 1 layer saved: Hot spot analysis: Protest events (29 features) 78.
- Evidenced: It reported result, bins 29; result, count 29; result, elapsed ms 5; result, cell size m 500; result, incidents used 80; result, distance band m 1,000 7.
A model draft was discarded because a sentence did not cite a source of this section.
Tool gp_hot_spots; parameters {"project": "188436ed-c19a-4e7c-ab43-b58fe7291e56", "features": {"layer": "Protest events (cf75e6b1)"}, "aggregation": "hexagon", "cell_size_m": 500.0, "distance_band_m": 1000.0}
Hot spots
What this analysis is. Hot spot analysis: Getis-Ord Gi* hot and cold spots with z-scores, p-values and confidence bins 5. In ArcGIS it is Find Hot Spots or Hot Spot Analysis (Getis-Ord Gi*); in QGIS, qgis:hotspot (plugin) 5.
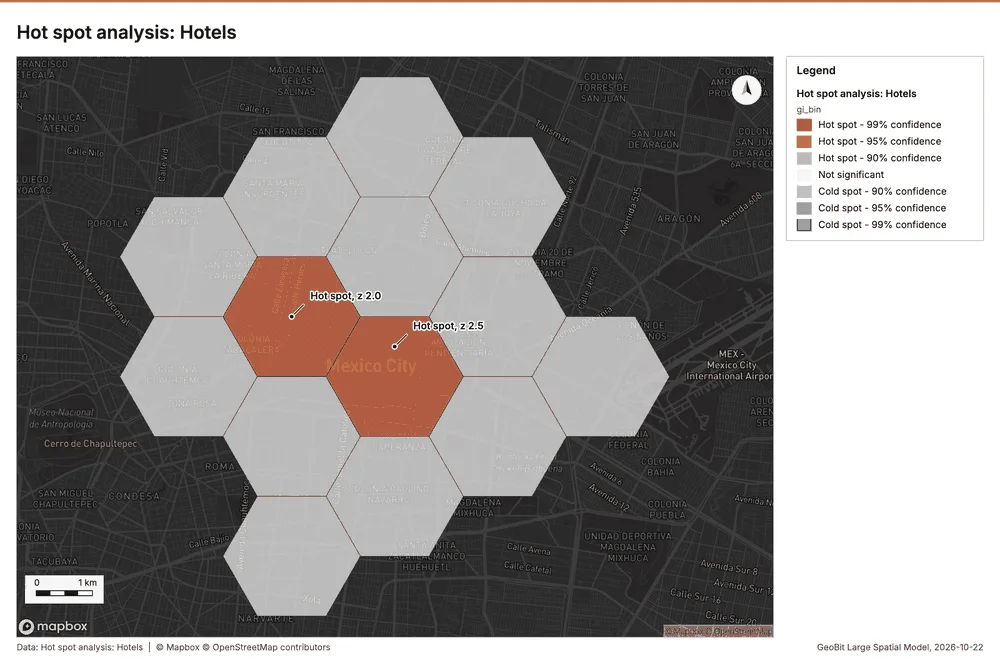
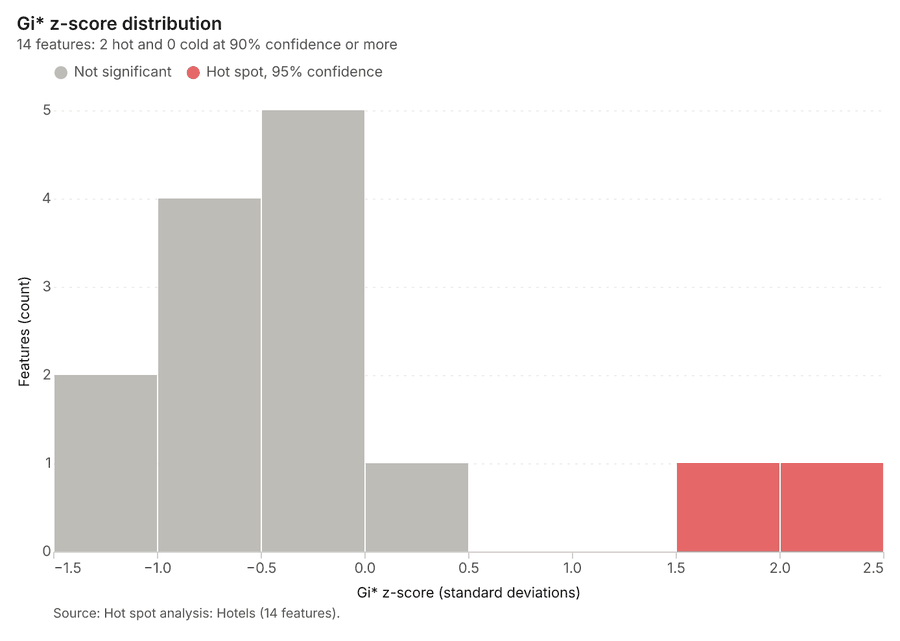
Why it was run on this data. 30 points: Getis-Ord Gi* tests whether the concentrations in Hotels are statistically significant 9.
What it found. The hot spot analysis generated 14 features 10 after processing the Hotels layer 11. The analysis used 30 incidents and set both the distance band and cell size to 2,000 m 10. The process completed quickly, taking 2 ms 10. The billing for this analysis was 0.0506 10.
| Result | Value |
|---|---|
| result, bins | 14 |
| result, count | 14 |
| result, elapsed ms | 2 |
| result, cell size m | 2,000 |
| result, incidents used | 30 |
| result, distance band m | 2,000 |
| billing, cost | 0.0506 |
| billing, list price | 0.0506 |
| billing, upstream cost | 0 |
Findings
- Evidenced: Hot spots on Hotels: Hot spot analysis: 1 layer saved: Hot spot analysis: Hotels (14 features) 1011.
- Evidenced: It reported result, bins 14; result, count 14; result, elapsed ms 2; result, cell size m 2,000; result, incidents used 30; result, distance band m 2,000 10.
Tool gp_hot_spots; parameters {"project": "188436ed-c19a-4e7c-ab43-b58fe7291e56", "features": {"layer": "Hotels (28842e9c)"}, "aggregation": "hexagon", "cell_size_m": 2000.0, "distance_band_m": 2000.0}
Hot spots
What this analysis is. Hot spot analysis: Getis-Ord Gi* hot and cold spots with z-scores, p-values and confidence bins 5. In ArcGIS it is Find Hot Spots or Hot Spot Analysis (Getis-Ord Gi*); in QGIS, qgis:hotspot (plugin) 5.
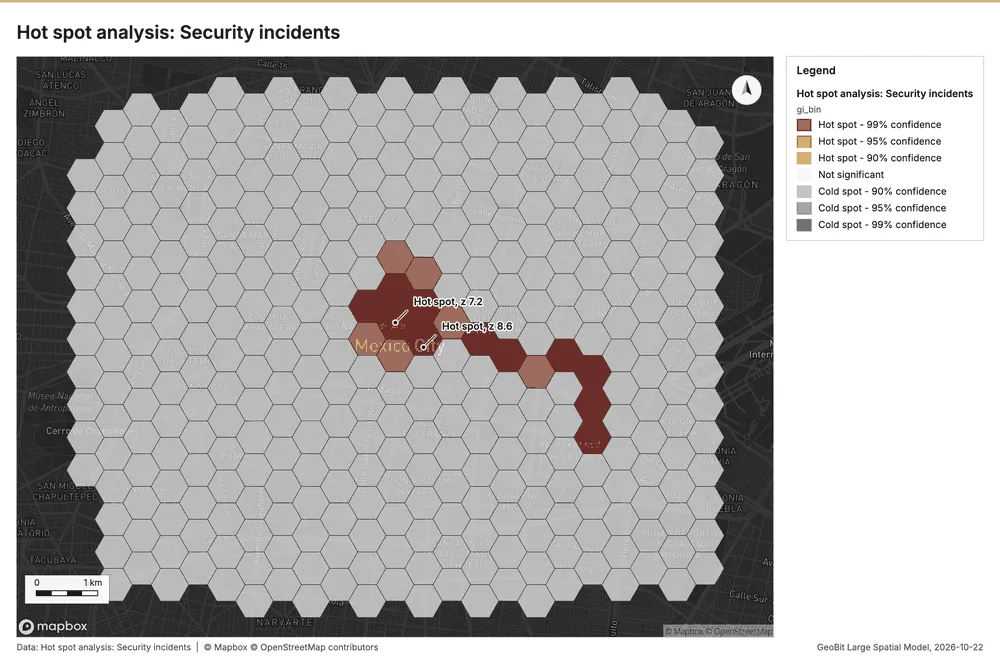
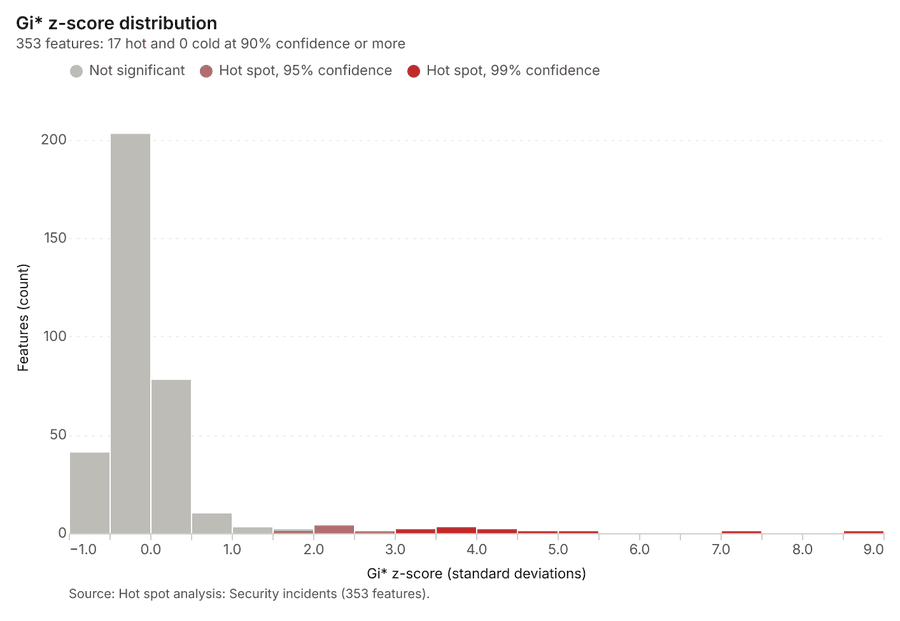
Why it was run on this data. 1700 points: Getis-Ord Gi* tests whether the concentrations in Security incidents are statistically significant 12.
What it found. Hot spots on Security incidents: Hot spot analysis: 1 layer saved: Hot spot analysis: Security incidents (353 features) 1314. It reported result, bins 353; result, count 353; result, elapsed ms 18; result, cell size m 500; result, incidents used 1,700; result, distance band m 500 13.
| Result | Value |
|---|---|
| result, bins | 353 |
| result, count | 353 |
| result, elapsed ms | 18 |
| result, cell size m | 500 |
| result, incidents used | 1,700 |
| result, distance band m | 500 |
| billing, cost | 0.084 |
| billing, list price | 0.084 |
| billing, upstream cost | 0 |
Findings
- Evidenced: Hot spots on Security incidents: Hot spot analysis: 1 layer saved: Hot spot analysis: Security incidents (353 features) 1314.
- Evidenced: It reported result, bins 353; result, count 353; result, elapsed ms 18; result, cell size m 500; result, incidents used 1,700; result, distance band m 500 13.
Tool gp_hot_spots; parameters {"project": "188436ed-c19a-4e7c-ab43-b58fe7291e56", "features": {"layer": "Security incidents (afb5d90c)"}, "aggregation": "hexagon", "cell_size_m": 500.0, "distance_band_m": 500.0}
Space time hot spots
What this analysis is. Emerging hot spots: Where hot spots are new, consecutive, intensifying, persistent, diminishing, sporadic, oscillating or historical over time 15. In ArcGIS it is Emerging Hot Spot Analysis or Create Space Time Cube 15.
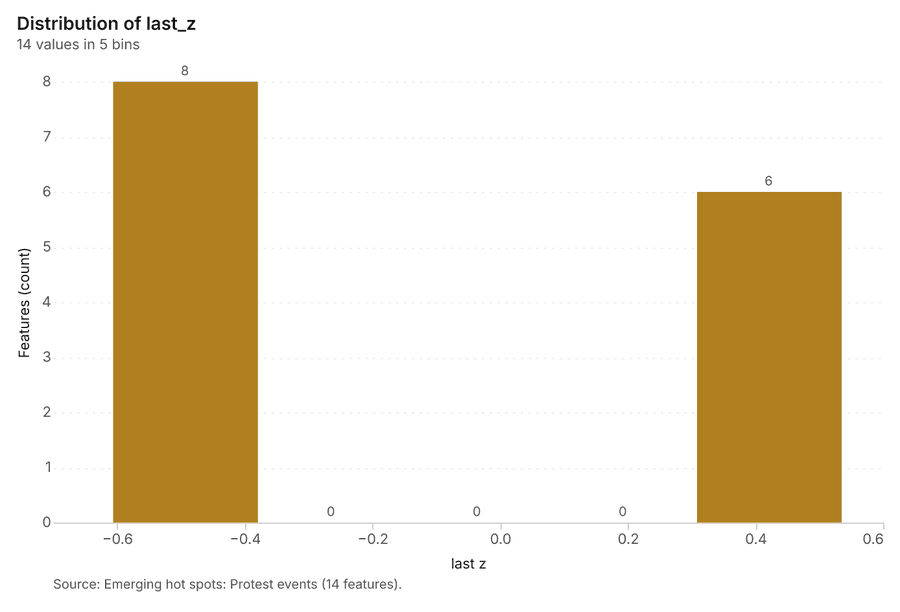
Why it was run on this data. Protest events carry dates in 'date': emerging hot spot analysis finds new, intensifying and fading hot spots per week 16.
What it found. Space time hot spots on Protest events: Emerging hot spots: 1 layer saved: Emerging hot spots: Protest events (14 features) 817. It reported result, count 14; result, elapsed ms 4; result, resolution 8; result, features used 80; result, time neighbors 0; billing, cost 0.104 17.
| Result | Value |
|---|---|
| result, count | 14 |
| result, elapsed ms | 4 |
| result, resolution | 8 |
| result, features used | 80 |
| result, time neighbors | 0 |
| billing, cost | 0.104 |
| billing, list price | 0.104 |
| billing, upstream cost | 0 |
Findings
- Evidenced: Space time hot spots on Protest events: Emerging hot spots: 1 layer saved: Emerging hot spots: Protest events (14 features) 817.
- Evidenced: It reported result, count 14; result, elapsed ms 4; result, resolution 8; result, features used 80; result, time neighbors 0; billing, cost 0.104 17.
A model draft was discarded because a sentence did not cite a source of this section.
Tool gp_space_time_hot_spots; parameters {"project": "188436ed-c19a-4e7c-ab43-b58fe7291e56", "features": {"layer": "Protest events (cf75e6b1)"}, "interval": "week", "bin_shape": "h3", "resolution": 8, "time_field": "date"}
Space time hot spots
What this analysis is. Emerging hot spots: Where hot spots are new, consecutive, intensifying, persistent, diminishing, sporadic, oscillating or historical over time 15. In ArcGIS it is Emerging Hot Spot Analysis or Create Space Time Cube 15.
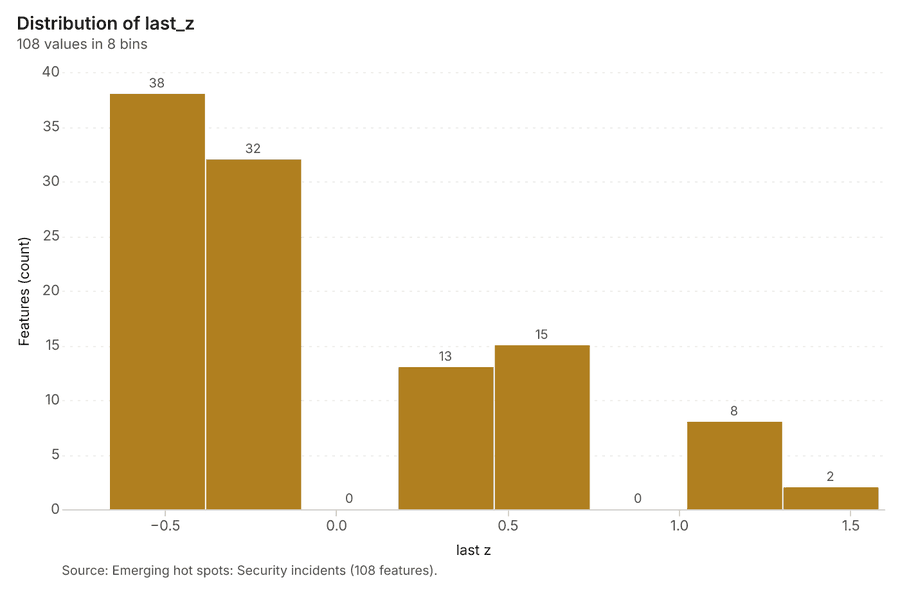
Why it was run on this data. Security incidents carry dates in 'occurred_at': emerging hot spot analysis finds new, intensifying and fading hot spots per week 18.
What it found. Space time hot spots on Security incidents: Emerging hot spots: 1 layer saved: Emerging hot spots: Security incidents (108 features) 1419. It reported result, count 108; result, elapsed ms 21; result, resolution 8; result, features used 1,700; result, time neighbors 0; billing, cost 0.185 19.
| Result | Value |
|---|---|
| result, count | 108 |
| result, elapsed ms | 21 |
| result, resolution | 8 |
| result, features used | 1,700 |
| result, time neighbors | 0 |
| billing, cost | 0.185 |
| billing, list price | 0.185 |
| billing, upstream cost | 0 |
Findings
- Evidenced: Space time hot spots on Security incidents: Emerging hot spots: 1 layer saved: Emerging hot spots: Security incidents (108 features) 1419.
- Evidenced: It reported result, count 108; result, elapsed ms 21; result, resolution 8; result, features used 1,700; result, time neighbors 0; billing, cost 0.185 19.
Tool gp_space_time_hot_spots; parameters {"project": "188436ed-c19a-4e7c-ab43-b58fe7291e56", "features": {"layer": "Security incidents (afb5d90c)"}, "interval": "week", "bin_shape": "h3", "resolution": 8, "time_field": "occurred_at"}
Near repeat
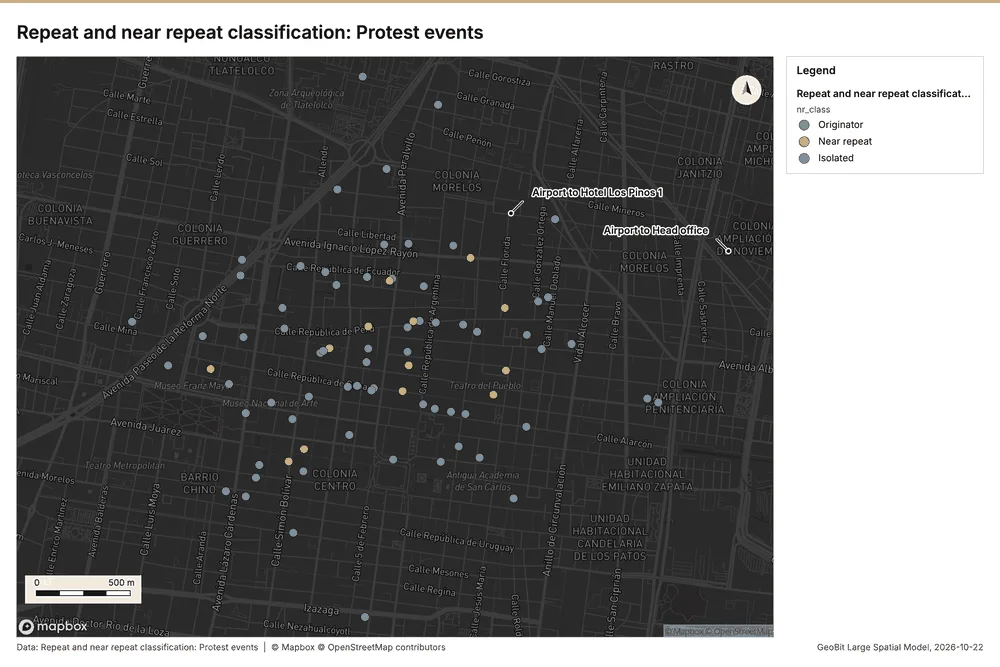
What this analysis is. Repeat and near repeat classification: Classify incidents as originators, repeats (same place) or near repeats within a distance and time window, with a Knox test table 20. In ArcGIS it is Repeat and Near Repeat Classification or Near Repeat Calculator 20.
Why it was run on this data. Near repeat analysis tests whether Protest events close in space also follow each other within 27 days 21.
What it found. The tool executed used the Protest events data 8 to classify near repeats 22. The resulting dataset contained a count of 80 pairs 22, with 11 total chains identified 22. Furthermore, 15 pairs were linked, and the average distance was reported as 200 m 22.
| Result | Value |
|---|---|
| result, days | 27 |
| result, count | 80 |
| result, chains | 11 |
| result, distance m | 200 |
| result, elapsed ms | 4 |
| result, pairs linked | 15 |
| billing, cost | 0.0524 |
| billing, list price | 0.0524 |
| billing, upstream cost | 0 |
Findings
- Evidenced: Near repeat on Protest events: Repeat and near repeat classification: 1 layer saved: Repeat and near repeat classification: Protest events (80 features) 822.
- Evidenced: It reported result, days 27; result, count 80; result, chains 11; result, distance m 200; result, elapsed ms 4; result, pairs linked 15 22.
Tool gp_near_repeat; parameters {"days": 27, "project": "188436ed-c19a-4e7c-ab43-b58fe7291e56", "features": {"layer": "Protest events (cf75e6b1)"}, "distance_m": 200.0, "time_field": "date"}
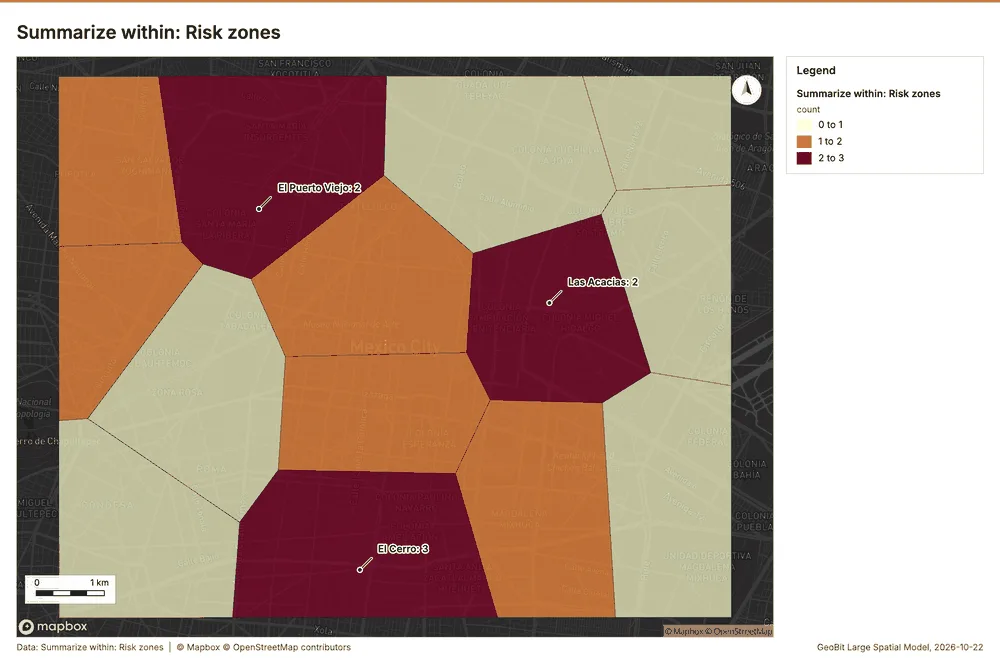
Summarize within
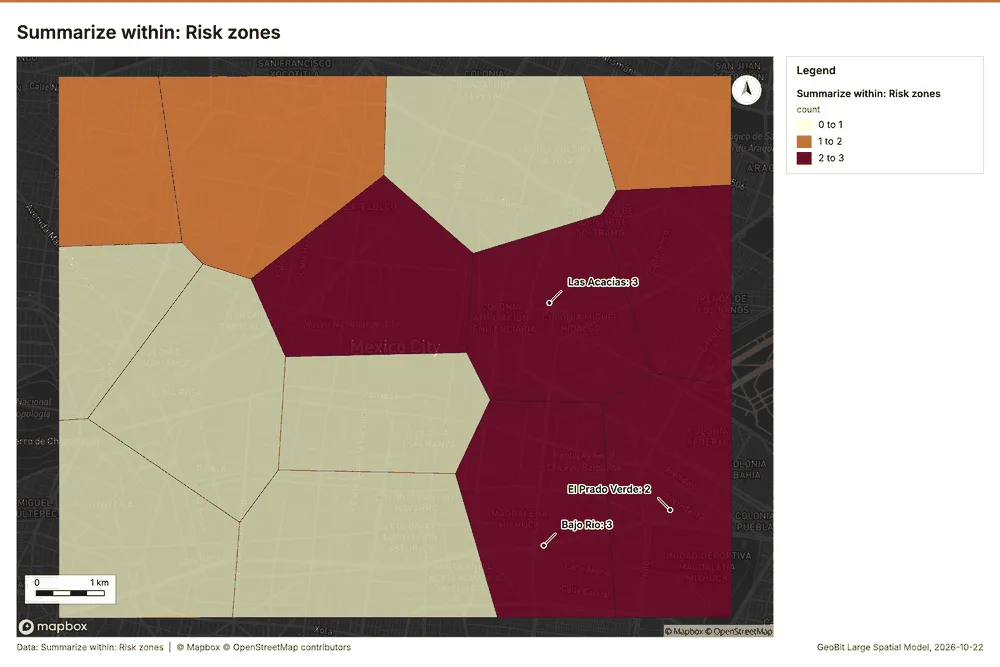
What this analysis is. Summarize within: Count and aggregate the features inside each polygon (or bin), proportionally for lines and polygons 23. In ArcGIS it is Summarize Within or Aggregate Points; in QGIS, native:countpointsinpolygon or native:sumlinelengths 23.
Why it was run on this data. Count Hospitals inside each feature of Risk zones by english_speaking; the counts map as a choropleth (natural breaks, sequential colors) 24.
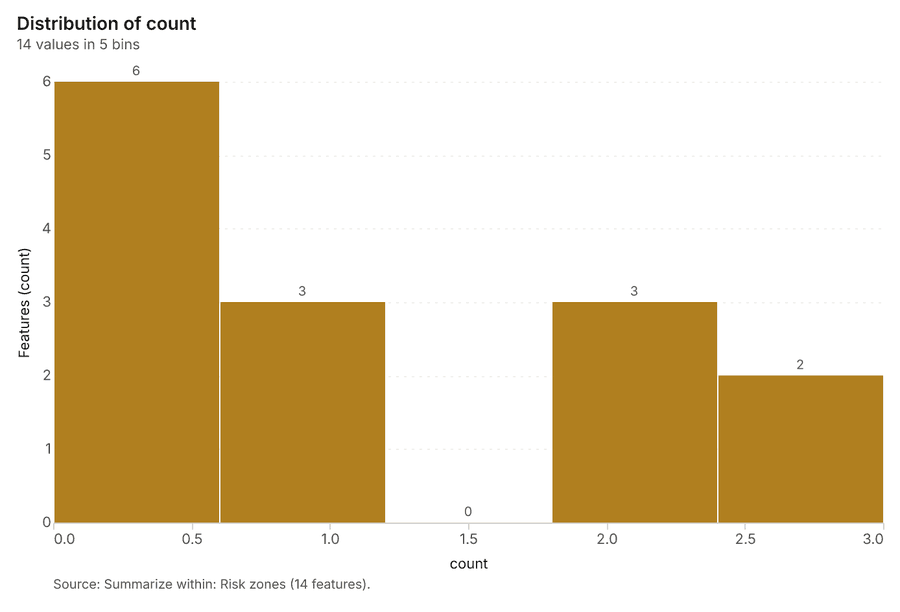
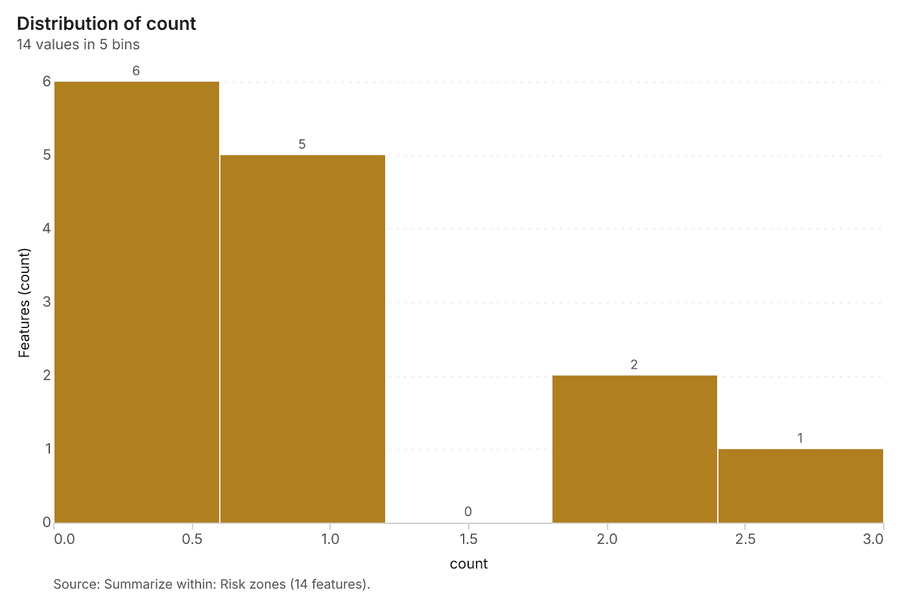
What it found. Summarize within on Hospitals, Risk zones: Summarize within: 1 layer saved: Summarize within: Risk zones (14 features) 252627. It reported result, count 14; result, elapsed ms 0; billing, cost 0.0106; billing, list price 0.0106; billing, upstream cost 0 25.
| Result | Value |
|---|---|
| result, count | 14 |
| result, elapsed ms | 0 |
| billing, cost | 0.0106 |
| billing, list price | 0.0106 |
| billing, upstream cost | 0 |
Findings
- Evidenced: Summarize within on Hospitals, Risk zones: Summarize within: 1 layer saved: Summarize within: Risk zones (14 features) 252627.
- Evidenced: It reported result, count 14; result, elapsed ms 0; billing, cost 0.0106; billing, list price 0.0106; billing, upstream cost 0 25.
Tool gp_summarize_within; parameters {"stats": [{"stat": "sum", "field": "trauma_level"}], "project": "188436ed-c19a-4e7c-ab43-b58fe7291e56", "features": {"layer": "Hospitals (8a96a3d4)"}, "group_by": "english_speaking", "polygons": {"layer": "Risk zones (a4d2e294)"}}
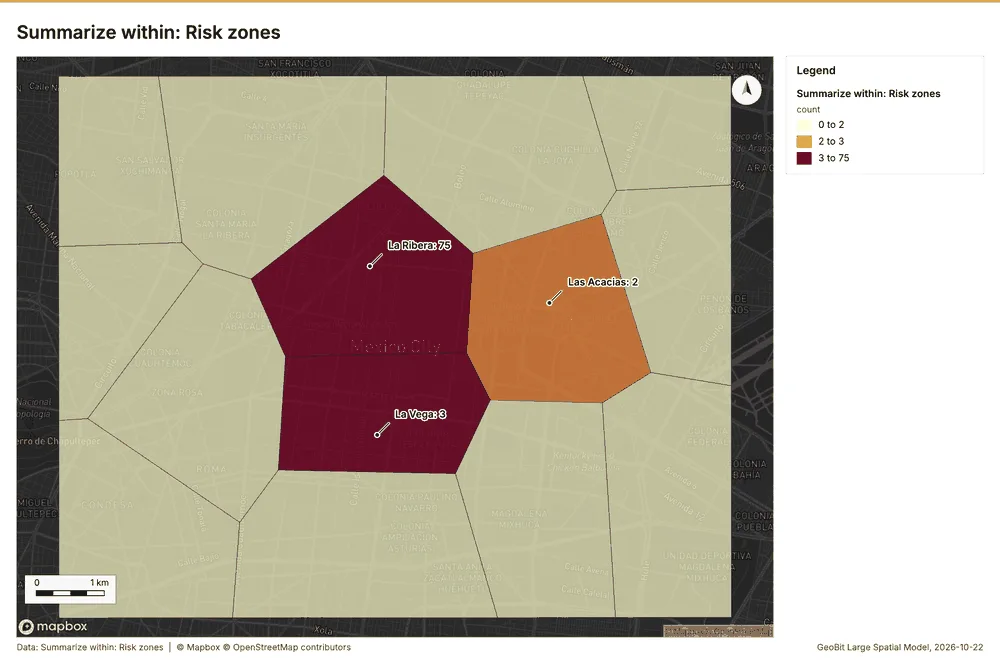
Summarize within
What this analysis is. Summarize within: Count and aggregate the features inside each polygon (or bin), proportionally for lines and polygons 23. In ArcGIS it is Summarize Within or Aggregate Points; in QGIS, native:countpointsinpolygon or native:sumlinelengths 23.
Why it was run on this data. Count Hospitals inside each feature of Risk zones by english_speaking; the counts map as a choropleth (natural breaks, sequential colors) 24.
What it found. Summarize within on Safe havens, Risk zones: Summarize within: 1 layer saved: Summarize within: Risk zones (14 features) 272829. It reported result, count 14; result, elapsed ms 0; billing, cost 0.01052; billing, list price 0.01052; billing, upstream cost 0 28.
| Result | Value |
|---|---|
| result, count | 14 |
| result, elapsed ms | 0 |
| billing, cost | 0.01052 |
| billing, list price | 0.01052 |
| billing, upstream cost | 0 |
Findings
- Evidenced: Summarize within on Safe havens, Risk zones: Summarize within: 1 layer saved: Summarize within: Risk zones (14 features) 272829.
- Evidenced: It reported result, count 14; result, elapsed ms 0; billing, cost 0.01052; billing, list price 0.01052; billing, upstream cost 0 28.
Tool gp_summarize_within; parameters {"stats": [], "project": "188436ed-c19a-4e7c-ab43-b58fe7291e56", "features": {"layer": "Safe havens (d7ec6bb0)"}, "group_by": "type", "polygons": {"layer": "Risk zones (a4d2e294)"}}
Summarize within
What this analysis is. Summarize within: Count and aggregate the features inside each polygon (or bin), proportionally for lines and polygons 23. In ArcGIS it is Summarize Within or Aggregate Points; in QGIS, native:countpointsinpolygon or native:sumlinelengths 23.
Why it was run on this data. Count Hospitals inside each feature of Risk zones by english_speaking; the counts map as a choropleth (natural breaks, sequential colors) 24.
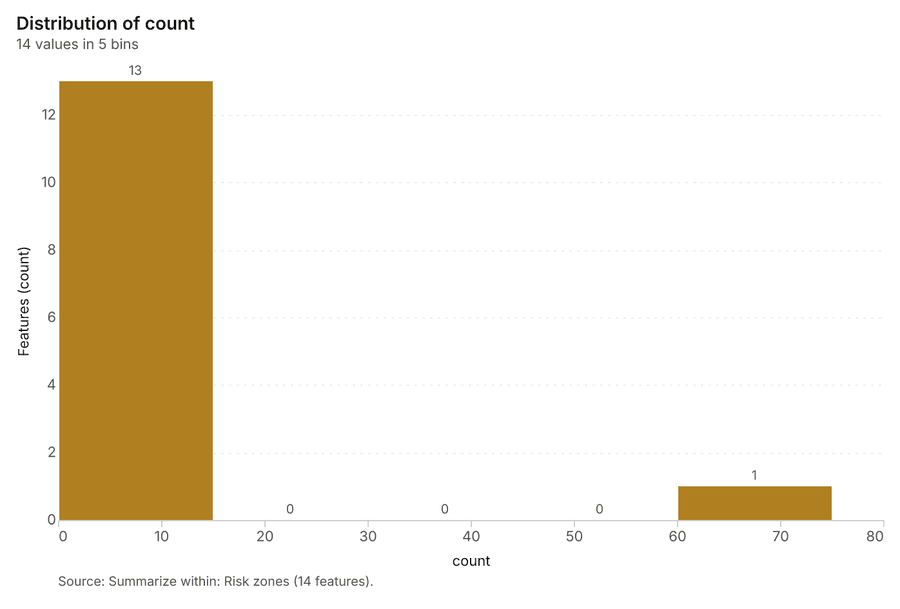
What it found. The analysis employed the gp_summarize_within tool 30, accepting Protest events 8 and Risk zones 27 as inputs 30. This process yielded a result count of 14 30.
| Result | Value |
|---|---|
| result, count | 14 |
| result, elapsed ms | 0 |
| billing, cost | 0.01188 |
| billing, list price | 0.01188 |
| billing, upstream cost | 0 |
Findings
- Evidenced: Summarize within on Protest events, Risk zones: Summarize within: 1 layer saved: Summarize within: Risk zones (14 features) 82730.
- Evidenced: It reported result, count 14; result, elapsed ms 0; billing, cost 0.01188; billing, list price 0.01188; billing, upstream cost 0 30.
Tool gp_summarize_within; parameters {"stats": [], "project": "188436ed-c19a-4e7c-ab43-b58fe7291e56", "features": {"layer": "Protest events (cf75e6b1)"}, "group_by": "size", "polygons": {"layer": "Risk zones (a4d2e294)"}}
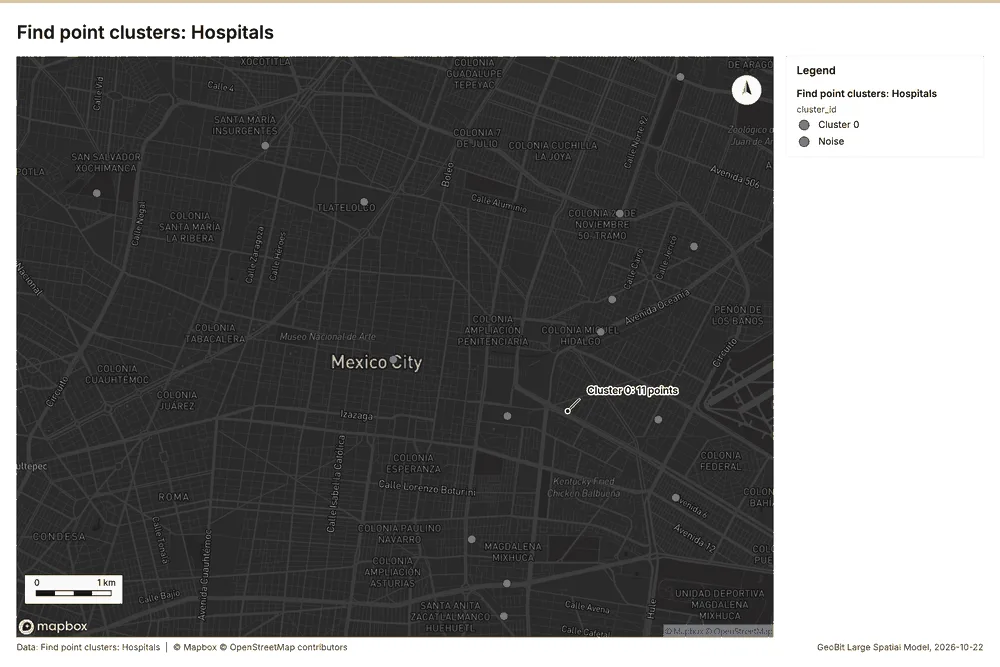
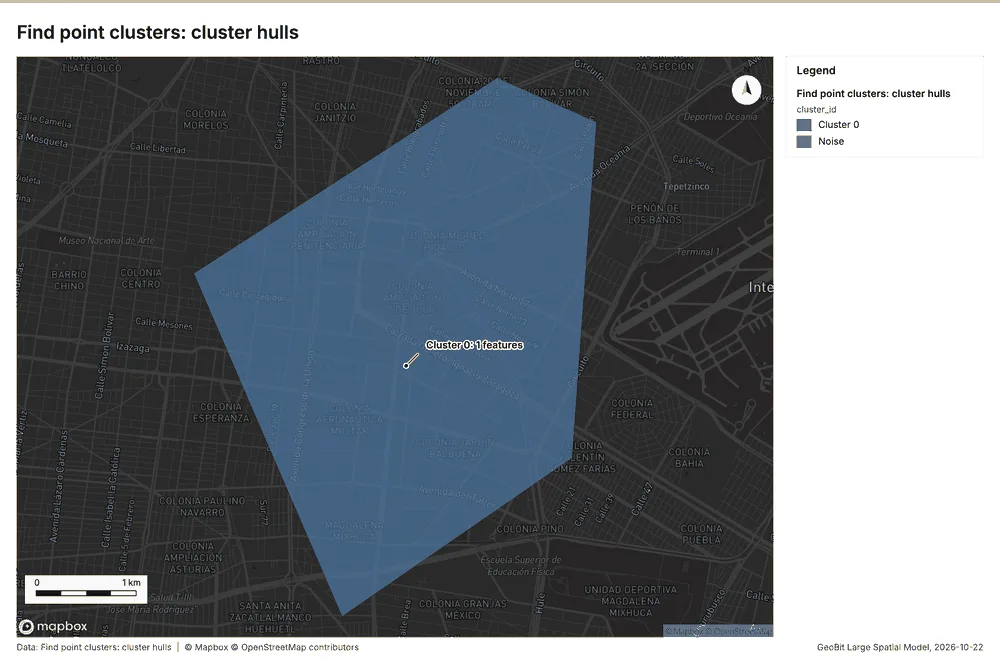
Find point clusters
What this analysis is. Find point clusters: Density-based clusters (DBSCAN, HDBSCAN or OPTICS, optionally space-time) with hulls and noise 31. In ArcGIS it is Find Point Clusters or Density-based Clustering; in QGIS, native:dbscanclustering or native:stdbscanclustering 31.
Why it was run on this data. DBSCAN finds dense groups of Hospitals and separates noise 32.
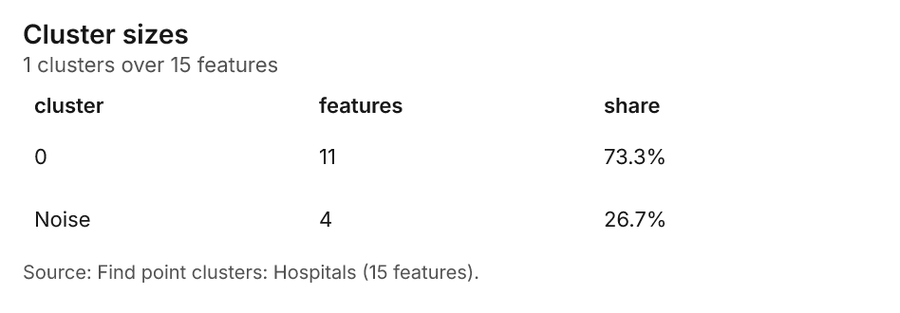
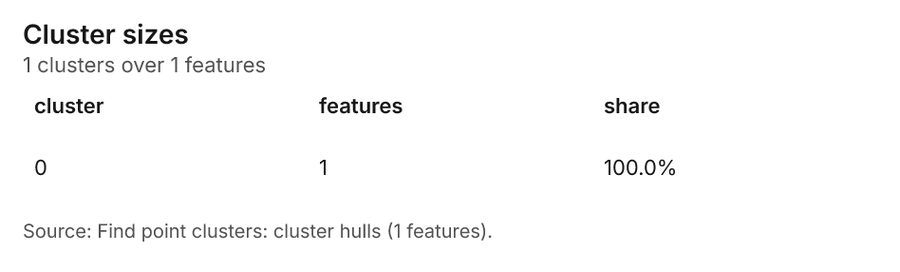
What it found. Find point clusters on Hospitals: Find point clusters: 2 layers saved: Find point clusters: Hospitals (15 features); Find point clusters: cluster hulls (1 feature) 2633. It reported result, count 15; result, noise 4; result, distance m 2,000; result, elapsed ms 2; result, min points 3; billing, cost 0.0503 33.
| Result | Value |
|---|---|
| result, count | 15 |
| result, noise | 4 |
| result, distance m | 2,000 |
| result, elapsed ms | 2 |
| result, min points | 3 |
| billing, cost | 0.0503 |
| billing, list price | 0.0503 |
| billing, upstream cost | 0 |
Findings
- Evidenced: Find point clusters on Hospitals: Find point clusters: 2 layers saved: Find point clusters: Hospitals (15 features); Find point clusters: cluster hulls (1 feature) 2633.
- Evidenced: It reported result, count 15; result, noise 4; result, distance m 2,000; result, elapsed ms 2; result, min points 3; billing, cost 0.0503 33.
Tool gp_find_point_clusters; parameters {"method": "dbscan", "project": "188436ed-c19a-4e7c-ab43-b58fe7291e56", "features": {"layer": "Hospitals (8a96a3d4)"}, "distance_m": 2000.0, "min_points": 3}
Find point clusters
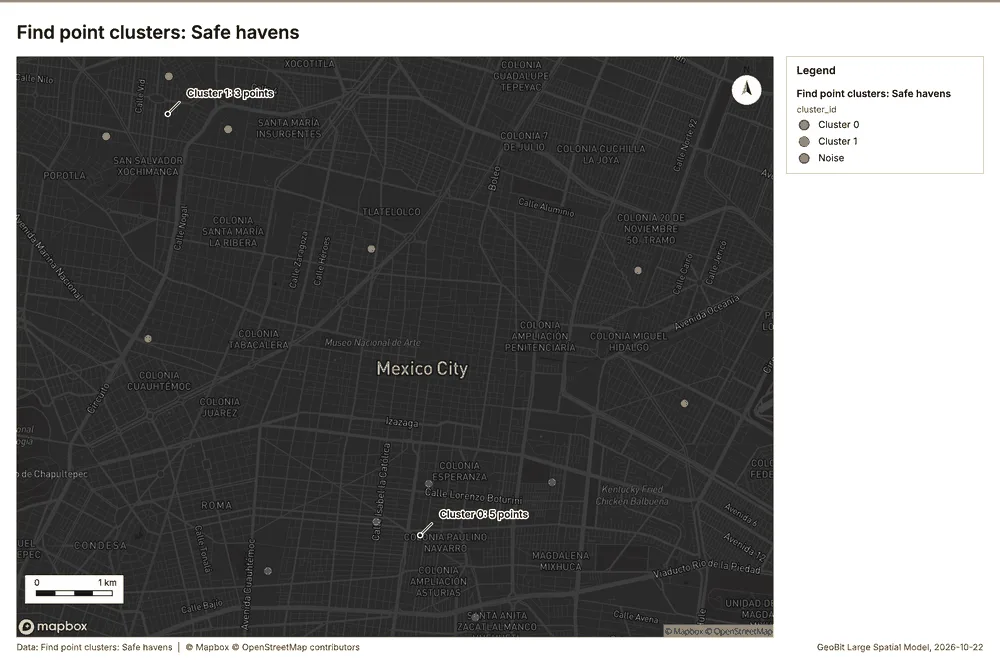
What this analysis is. Find point clusters: Density-based clusters (DBSCAN, HDBSCAN or OPTICS, optionally space-time) with hulls and noise 31. In ArcGIS it is Find Point Clusters or Density-based Clustering; in QGIS, native:dbscanclustering or native:stdbscanclustering 31.
Why it was run on this data. DBSCAN finds dense groups of Safe havens and separates noise 34.
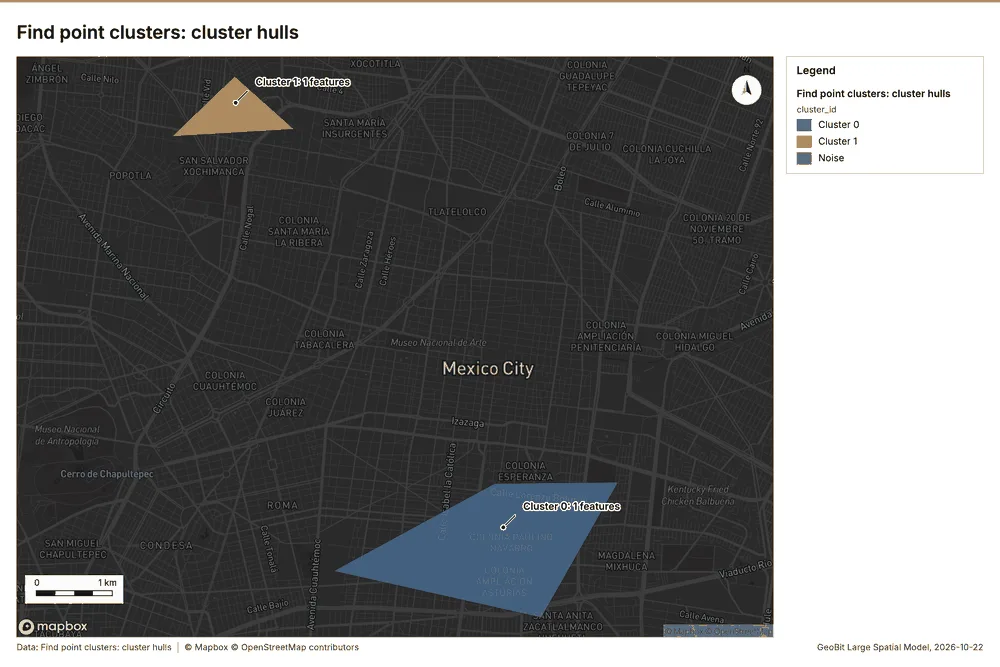
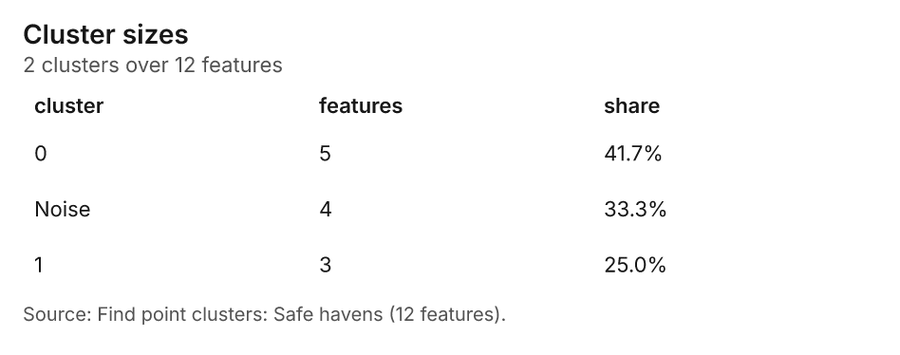
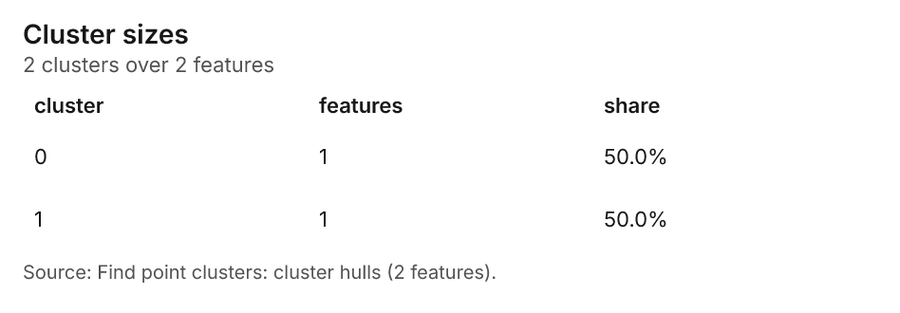
What it found. The tool saved 2 layers: Find point clusters: Safe havens found 12 features, and Find point clusters: cluster hulls found 2 features 35. The process resulted in 12 points, with 4 points categorized as noise 35.
| Result | Value |
|---|---|
| result, count | 12 |
| result, noise | 4 |
| result, distance m | 2,000 |
| result, elapsed ms | 1 |
| result, min points | 3 |
| billing, cost | 0.05024 |
| billing, list price | 0.05024 |
| billing, upstream cost | 0 |
Findings
- Evidenced: Find point clusters on Safe havens: Find point clusters: 2 layers saved: Find point clusters: Safe havens (12 features); Find point clusters: cluster hulls (2 features) 2935.
- Evidenced: It reported result, count 12; result, noise 4; result, distance m 2,000; result, elapsed ms 1; result, min points 3; billing, cost 0.05024 35.
Tool gp_find_point_clusters; parameters {"method": "dbscan", "project": "188436ed-c19a-4e7c-ab43-b58fe7291e56", "features": {"layer": "Safe havens (d7ec6bb0)"}, "distance_m": 2000.0, "min_points": 3}
Find point clusters
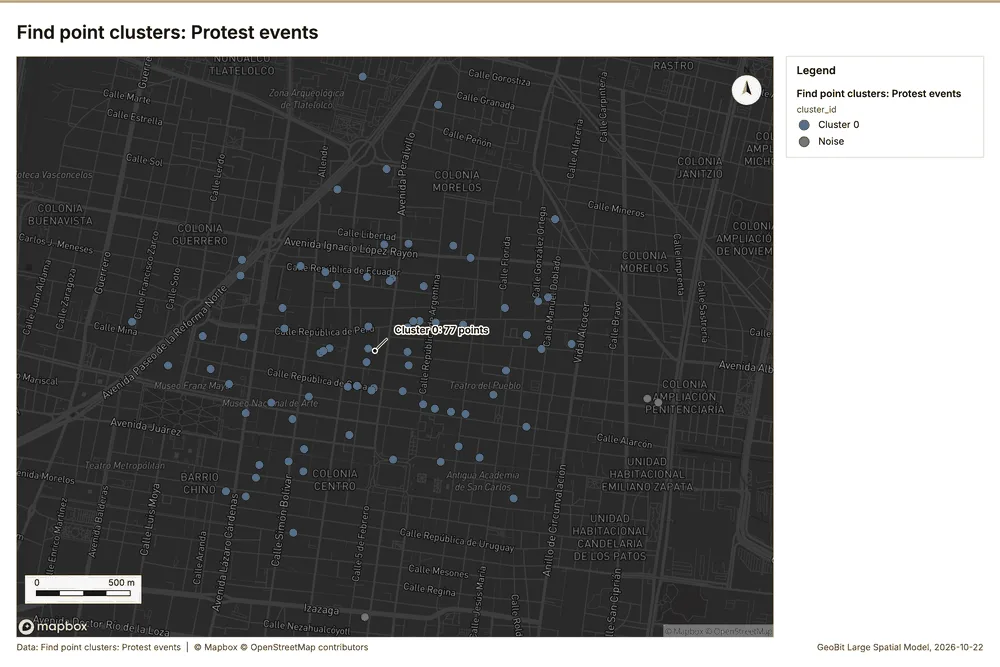
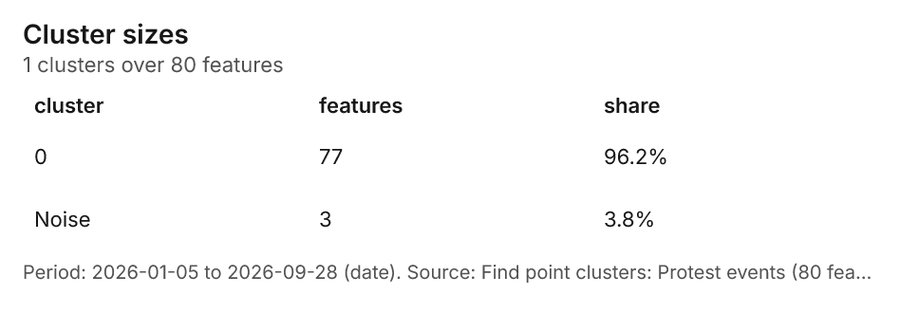
What this analysis is. Find point clusters: Density-based clusters (DBSCAN, HDBSCAN or OPTICS, optionally space-time) with hulls and noise 31. In ArcGIS it is Find Point Clusters or Density-based Clustering; in QGIS, native:dbscanclustering or native:stdbscanclustering 31.
Why it was run on this data. DBSCAN finds dense groups of Protest events and separates noise 36.
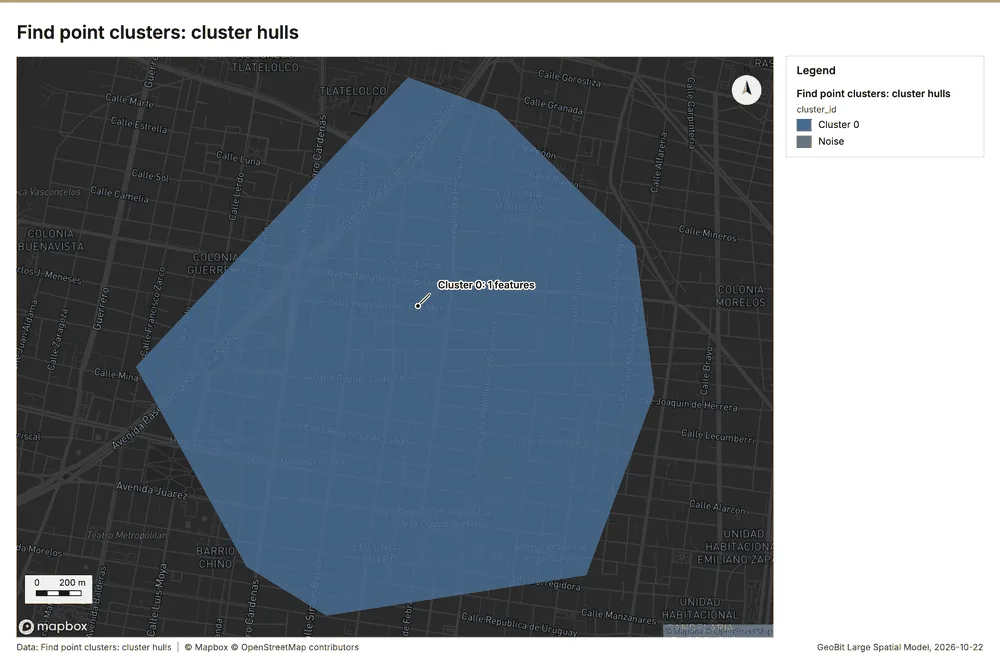
What it found. Find point clusters on Protest events: Find point clusters: 2 layers saved: Find point clusters: Protest events (80 features); Find point clusters: cluster hulls (1 feature) 837. It reported result, count 80; result, noise 3; result, distance m 500; result, elapsed ms 2; result, min points 3; billing, cost 0.0516 37.
| Result | Value |
|---|---|
| result, count | 80 |
| result, noise | 3 |
| result, distance m | 500 |
| result, elapsed ms | 2 |
| result, min points | 3 |
| billing, cost | 0.0516 |
| billing, list price | 0.0516 |
| billing, upstream cost | 0 |
Findings
- Evidenced: Find point clusters on Protest events: Find point clusters: 2 layers saved: Find point clusters: Protest events (80 features); Find point clusters: cluster hulls (1 feature) 837.
- Evidenced: It reported result, count 80; result, noise 3; result, distance m 500; result, elapsed ms 2; result, min points 3; billing, cost 0.0516 37.
Tool gp_find_point_clusters; parameters {"method": "dbscan", "project": "188436ed-c19a-4e7c-ab43-b58fe7291e56", "features": {"layer": "Protest events (cf75e6b1)"}, "distance_m": 500.0, "min_points": 3}
Calculate density
What this analysis is. Calculate density: Kernel density per square kilometer on a grid 38. In ArcGIS it is Calculate Density or Kernel Density; in QGIS, native:heatmapkerneldensityestimation 38.
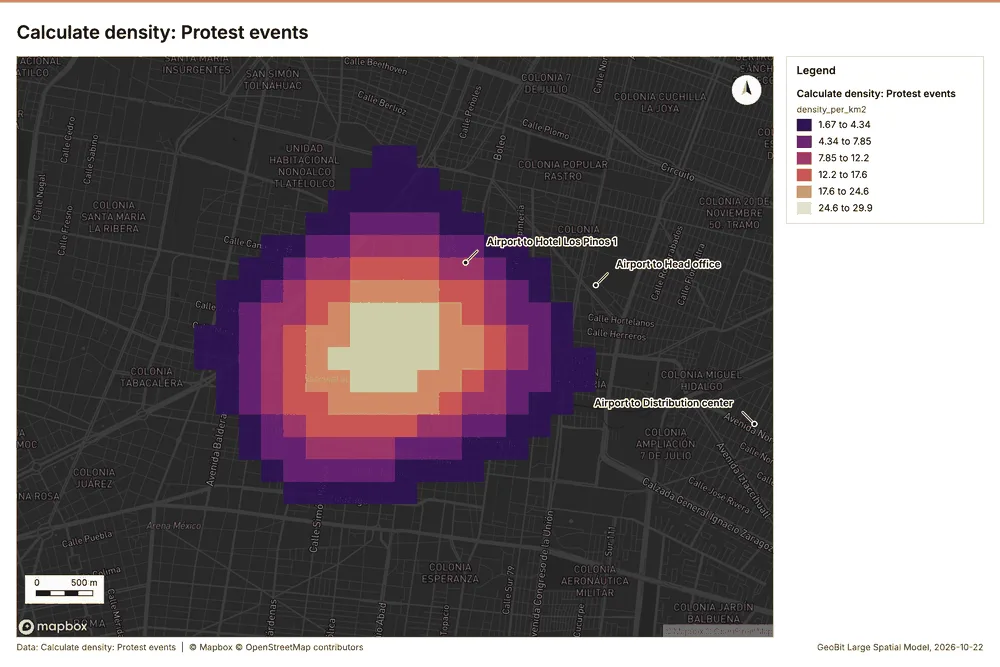
Why it was run on this data. 80 points in Protest events: a density surface shows where they concentrate 39.
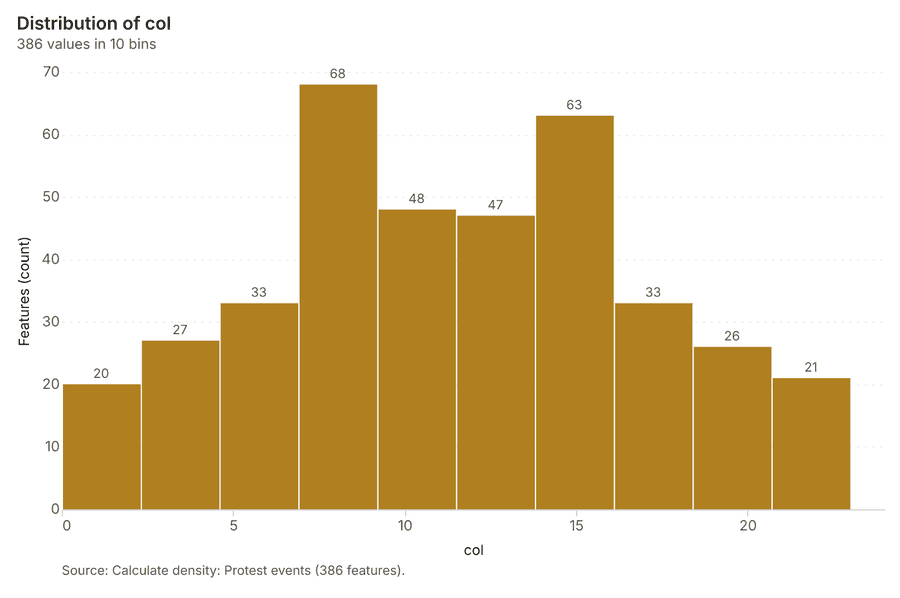
What it found. Calculate density on Protest events: Calculate density: 1 layer saved: Calculate density: Protest events (386 features) 840. It reported result, count 386; result, elapsed ms 11; result, bandwidth m 1,000; result, cell size m 200; result, excluded null 0; result, max density per km2 29.94 40.
| Result | Value |
|---|---|
| result, count | 386 |
| result, elapsed ms | 11 |
| result, bandwidth m | 1,000 |
| result, cell size m | 200 |
| result, excluded null | 0 |
| result, max density per km2 | 29.94 |
| billing, cost | 0.0516 |
| billing, list price | 0.0516 |
| billing, upstream cost | 0 |
Findings
- Evidenced: Calculate density on Protest events: Calculate density: 1 layer saved: Calculate density: Protest events (386 features) 840.
- Evidenced: It reported result, count 386; result, elapsed ms 11; result, bandwidth m 1,000; result, cell size m 200; result, excluded null 0; result, max density per km2 29.94 40.
Tool gp_calculate_density; parameters {"kernel": "quartic", "project": "188436ed-c19a-4e7c-ab43-b58fe7291e56", "features": {"layer": "Protest events (cf75e6b1)"}, "bandwidth_m": 1000.0, "cell_size_m": 200.0}
Calculate density
What this analysis is. Calculate density: Kernel density per square kilometer on a grid 38. In ArcGIS it is Calculate Density or Kernel Density; in QGIS, native:heatmapkerneldensityestimation 38.
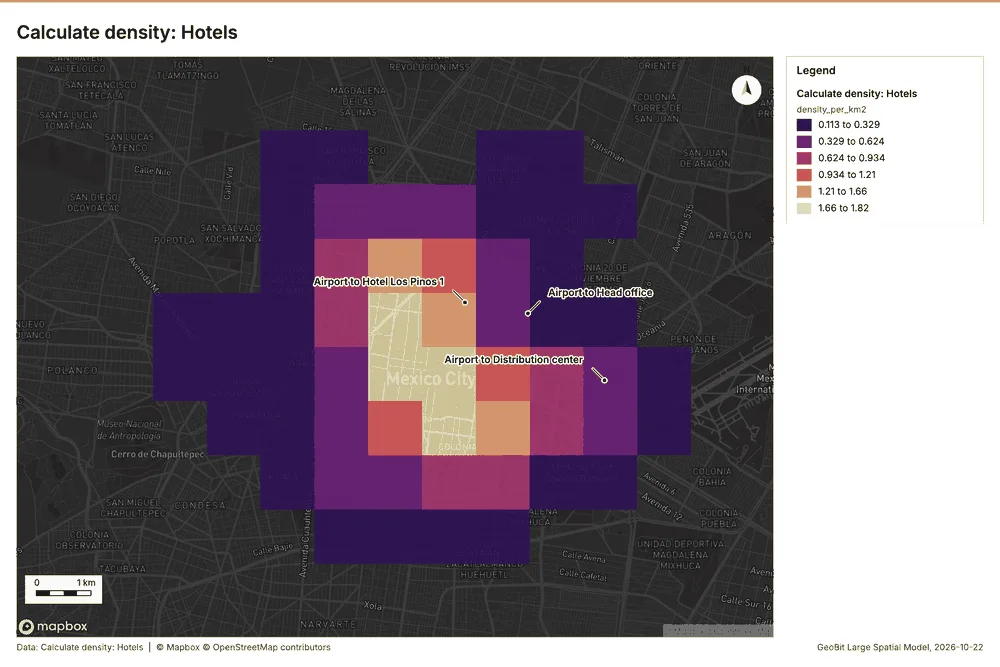
Why it was run on this data. 30 points in Hotels: a density surface shows where they concentrate 41.
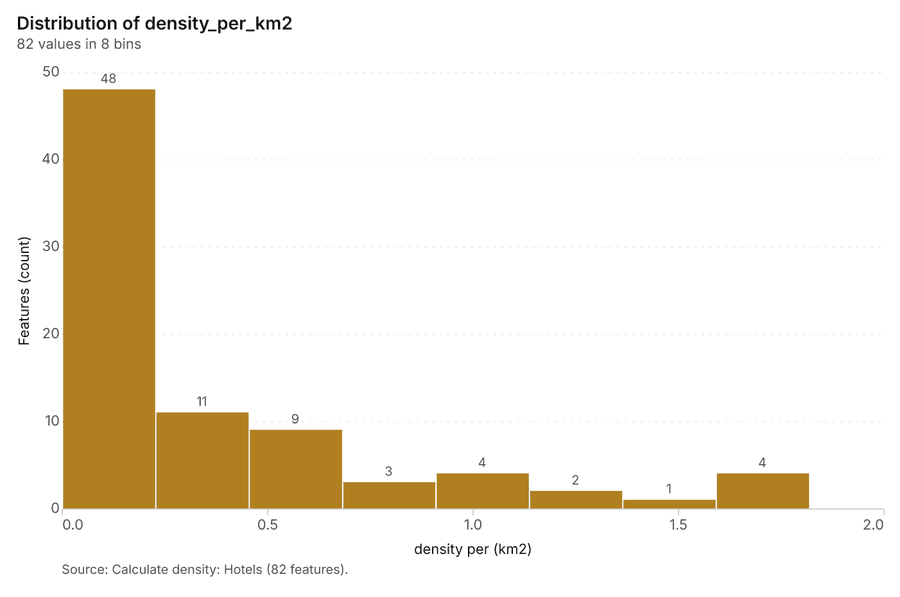
What it found. The density calculation was run on the Hotels layer 11 by utilizing the gp_calculate_density tool 42.
| Result | Value |
|---|---|
| result, count | 82 |
| result, elapsed ms | 3 |
| result, bandwidth m | 2,000 |
| result, cell size m | 1,000 |
| result, excluded null | 0 |
| result, max density per km2 | 1.819 |
| billing, cost | 0.0506 |
| billing, list price | 0.0506 |
| billing, upstream cost | 0 |
Findings
- Evidenced: Calculate density on Hotels: Calculate density: 1 layer saved: Calculate density: Hotels (82 features) 1142.
- Evidenced: It reported result, count 82; result, elapsed ms 3; result, bandwidth m 2,000; result, cell size m 1,000; result, excluded null 0; result, max density per km2 1.819 42.
Tool gp_calculate_density; parameters {"kernel": "quartic", "project": "188436ed-c19a-4e7c-ab43-b58fe7291e56", "features": {"layer": "Hotels (28842e9c)"}, "bandwidth_m": 2000.0, "cell_size_m": 1000.0}
Calculate density
What this analysis is. Calculate density: Kernel density per square kilometer on a grid 38. In ArcGIS it is Calculate Density or Kernel Density; in QGIS, native:heatmapkerneldensityestimation 38.
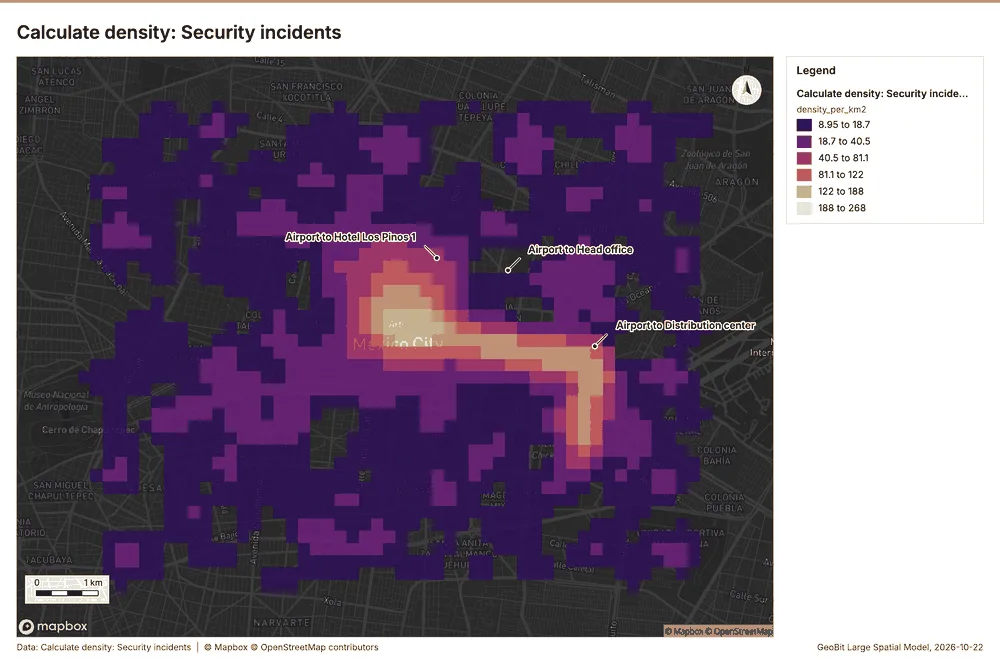
Why it was run on this data. 1700 points in Security incidents: a density surface shows where they concentrate 43.
What it found. Calculate density on Security incidents: Calculate density: 1 layer saved: Calculate density: Security incidents (2240 features) 1444. It reported result, count 2,240; result, elapsed ms 60; result, bandwidth m 500; result, cell size m 200; result, excluded null 0; result, max density per km2 267.9 44.
| Result | Value |
|---|---|
| result, count | 2,240 |
| result, elapsed ms | 60 |
| result, bandwidth m | 500 |
| result, cell size m | 200 |
| result, excluded null | 0 |
| result, max density per km2 | 267.9 |
| billing, cost | 0.084 |
| billing, list price | 0.084 |
| billing, upstream cost | 0 |
Findings
- Evidenced: Calculate density on Security incidents: Calculate density: 1 layer saved: Calculate density: Security incidents (2240 features) 1444.
- Evidenced: It reported result, count 2,240; result, elapsed ms 60; result, bandwidth m 500; result, cell size m 200; result, excluded null 0; result, max density per km2 267.9 44.
Tool gp_calculate_density; parameters {"kernel": "quartic", "project": "188436ed-c19a-4e7c-ab43-b58fe7291e56", "features": {"layer": "Security incidents (afb5d90c)"}, "bandwidth_m": 500.0, "cell_size_m": 200.0}
Outliers
What this analysis is. Find outliers: Anselin local Moran’s I: HH, LL clusters and HL, LH outliers 45. In ArcGIS it is Find Outliers or Cluster and Outlier Analysis (Anselin Local Moran’s I) 45.
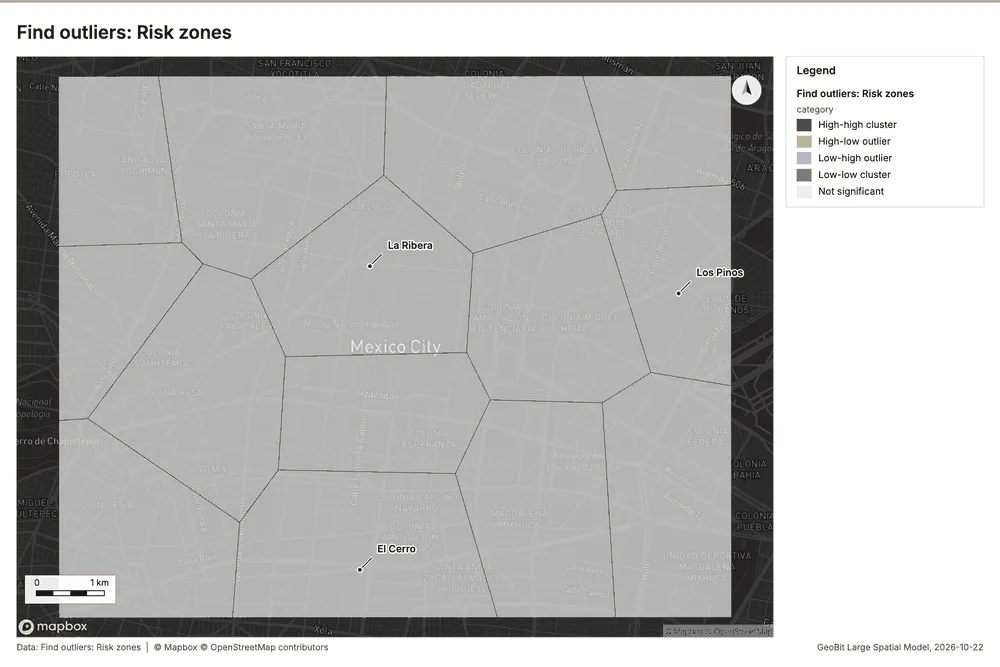
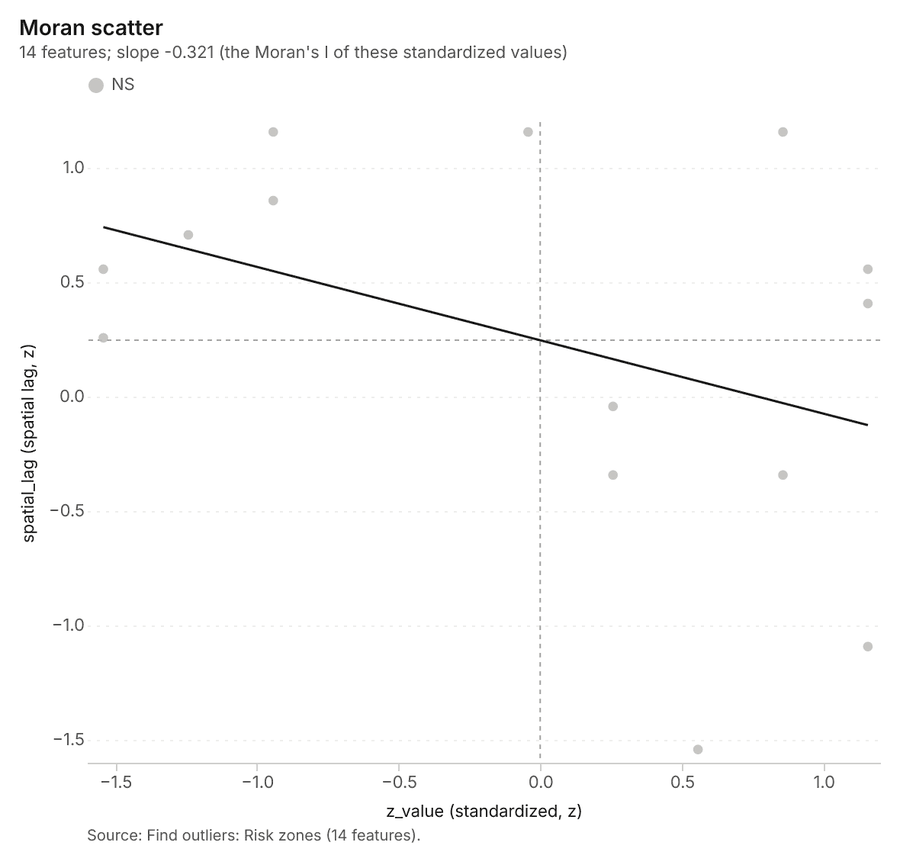
Why it was run on this data. Local Moran's I maps clusters and outliers of 'risk_score' 46.
What it found. Outliers on Risk zones: Find outliers: 1 layer saved: Find outliers: Risk zones (14 features) 2747. It reported result, count 14; result, elapsed ms 2; result, permutations 199; result, excluded null 0; result, distance band m 2,548; billing, cost 0.05042 47.
| Result | Value |
|---|---|
| result, count | 14 |
| result, elapsed ms | 2 |
| result, permutations | 199 |
| result, excluded null | 0 |
| result, distance band m | 2,548 |
| billing, cost | 0.05042 |
| billing, list price | 0.05042 |
| billing, upstream cost | 0 |
Findings
- Evidenced: Outliers on Risk zones: Find outliers: 1 layer saved: Find outliers: Risk zones (14 features) 2747.
- Evidenced: It reported result, count 14; result, elapsed ms 2; result, permutations 199; result, excluded null 0; result, distance band m 2,548; billing, cost 0.05042 47.
Tool gp_outliers; parameters {"field": "risk_score", "project": "188436ed-c19a-4e7c-ab43-b58fe7291e56", "features": {"layer": "Risk zones (a4d2e294)"}, "aggregation": "hexagon"}
Spatial autocorrelation
What this analysis is. Spatial autocorrelation: Global Moran’s I: is the pattern clustered, dispersed or random 48. In ArcGIS it is Spatial Autocorrelation (Global Moran’s I) 48.
Why it was run on this data. Global Moran's I says whether similar values of 'risk_score' sit next to each other 49.
What it found. The spatial autocorrelation tool was run using the Risk zones input 27, completing without generating a map output 50.
| Result | Value |
|---|---|
| result, n | 14 |
| result, p value | 0.6185 |
| result, z score | -0.498 |
| result, morans i | -0.2235 |
| result, variance | 0.08664 |
| result, elapsed ms | 1 |
| result, expected i | -0.07692 |
| result, excluded null | 0 |
| result, distance band m | 2,548 |
| result, p value normality | 0.6003 |
| result, z score normality | -0.5239 |
| result, variance normality | 0.0783 |
| billing, cost | 0.02 |
| billing, list price | 0.02 |
| billing, upstream cost | 0 |
Findings
- Evidenced: Spatial autocorrelation on Risk zones: Spatial autocorrelation: done; no map output 2750.
- Evidenced: It reported result, n 14; result, p value 0.6185; result, z score -0.498; result, morans i -0.2235; result, variance 0.08664; result, elapsed ms 1 50.
Tool gp_spatial_autocorrelation; parameters {"field": "risk_score", "project": "188436ed-c19a-4e7c-ab43-b58fe7291e56", "features": {"layer": "Risk zones (a4d2e294)"}}
Find nearest
What this analysis is. Find nearest: The k nearest features for each input, with geodesic distance and bearing 51. In ArcGIS it is Find Nearest or Near; in QGIS, native:joinbynearest or native:nearestneighbouranalysis 51.
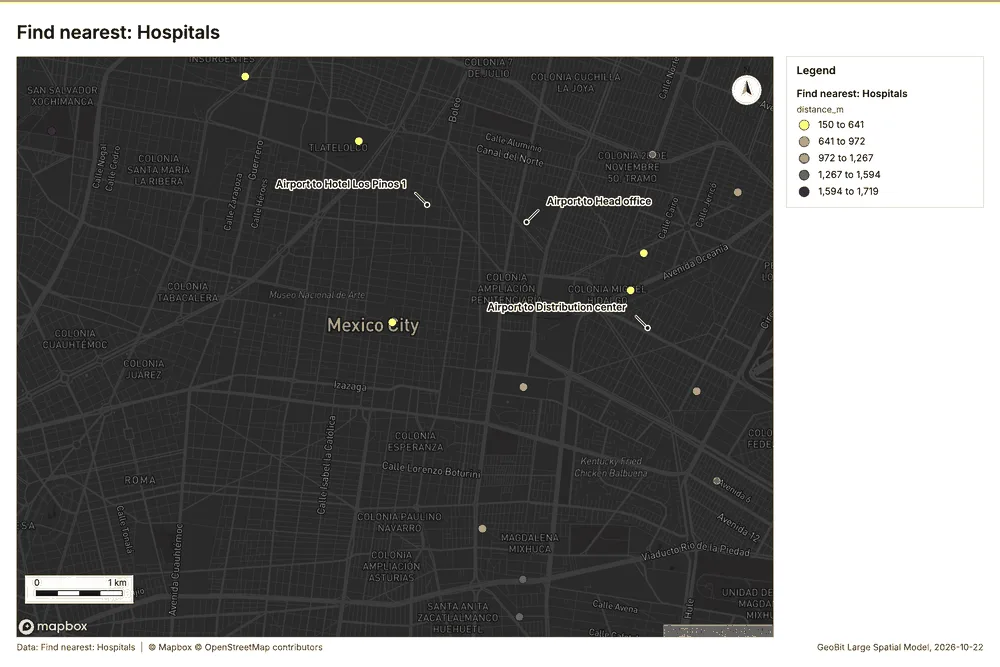
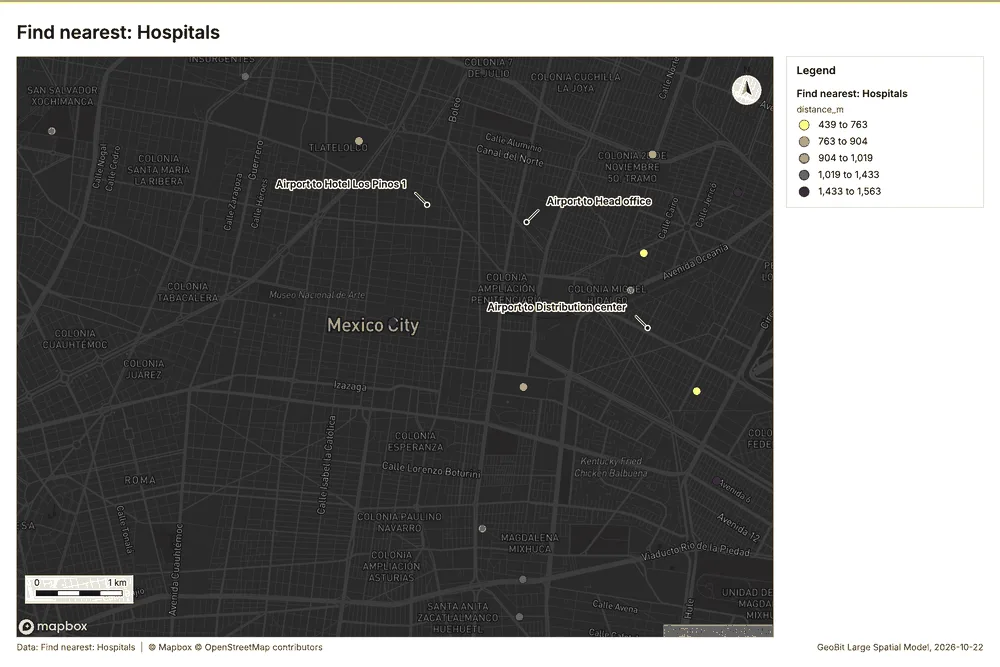
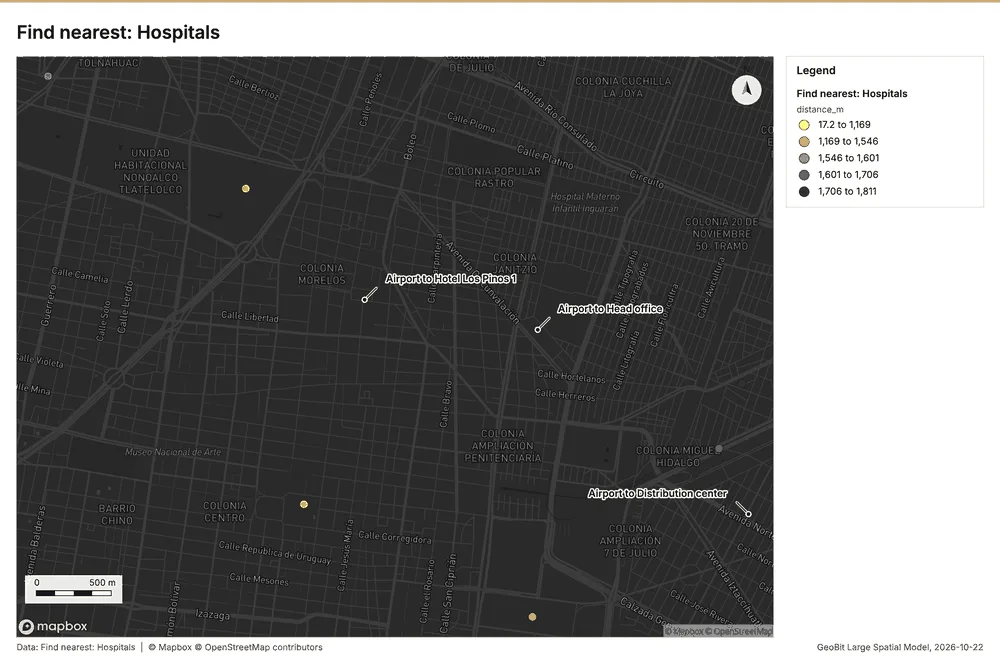
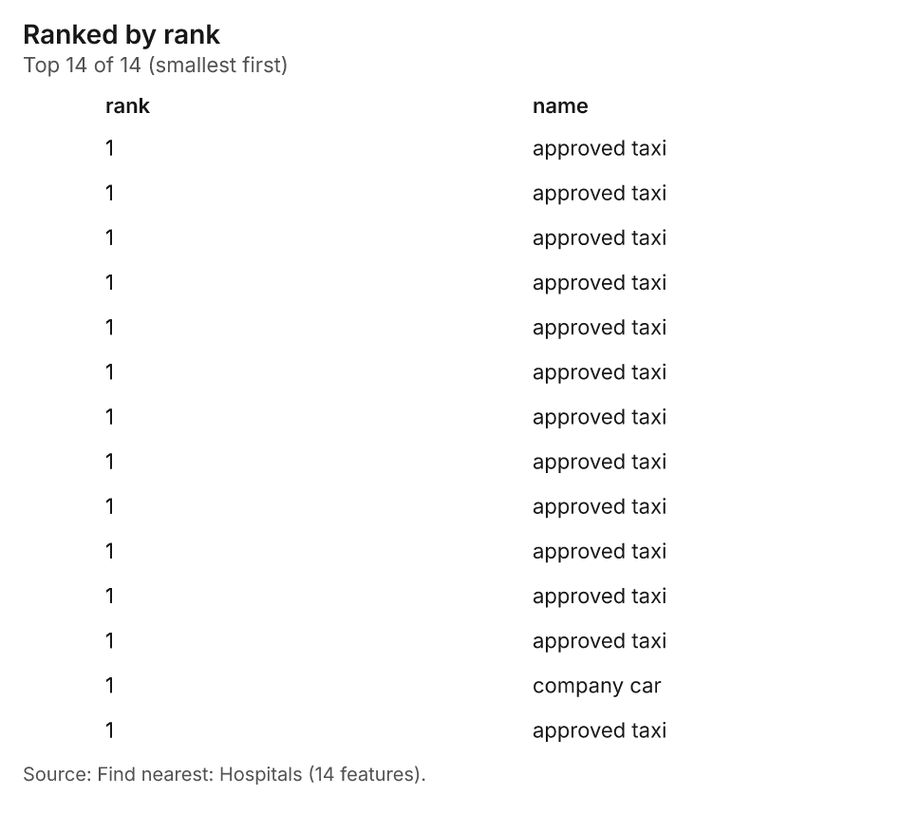
Why it was run on this data. The nearest of Travel routes to each of Hospitals, with distances 52.
What it found. Find nearest on Travel routes, Hospitals: Find nearest: 1 layer saved: Find nearest: Hospitals (14 features) 265354. It reported result, count 14; result, elapsed ms 10; billing, cost 0.0105; billing, list price 0.0105; billing, upstream cost 0 53.
| Result | Value |
|---|---|
| result, count | 14 |
| result, elapsed ms | 10 |
| billing, cost | 0.0105 |
| billing, list price | 0.0105 |
| billing, upstream cost | 0 |
Findings
- Evidenced: Find nearest on Travel routes, Hospitals: Find nearest: 1 layer saved: Find nearest: Hospitals (14 features) 265354.
- Evidenced: It reported result, count 14; result, elapsed ms 10; billing, cost 0.0105; billing, list price 0.0105; billing, upstream cost 0 53.
Tool gp_find_nearest; parameters {"k": 1, "to": {"layer": "Travel routes (17118d2e)"}, "from": {"layer": "Hospitals (8a96a3d4)"}, "project": "188436ed-c19a-4e7c-ab43-b58fe7291e56", "max_distance_m": 2000.0}
Find nearest
What this analysis is. Find nearest: The k nearest features for each input, with geodesic distance and bearing 51. In ArcGIS it is Find Nearest or Near; in QGIS, native:joinbynearest or native:nearestneighbouranalysis 51.
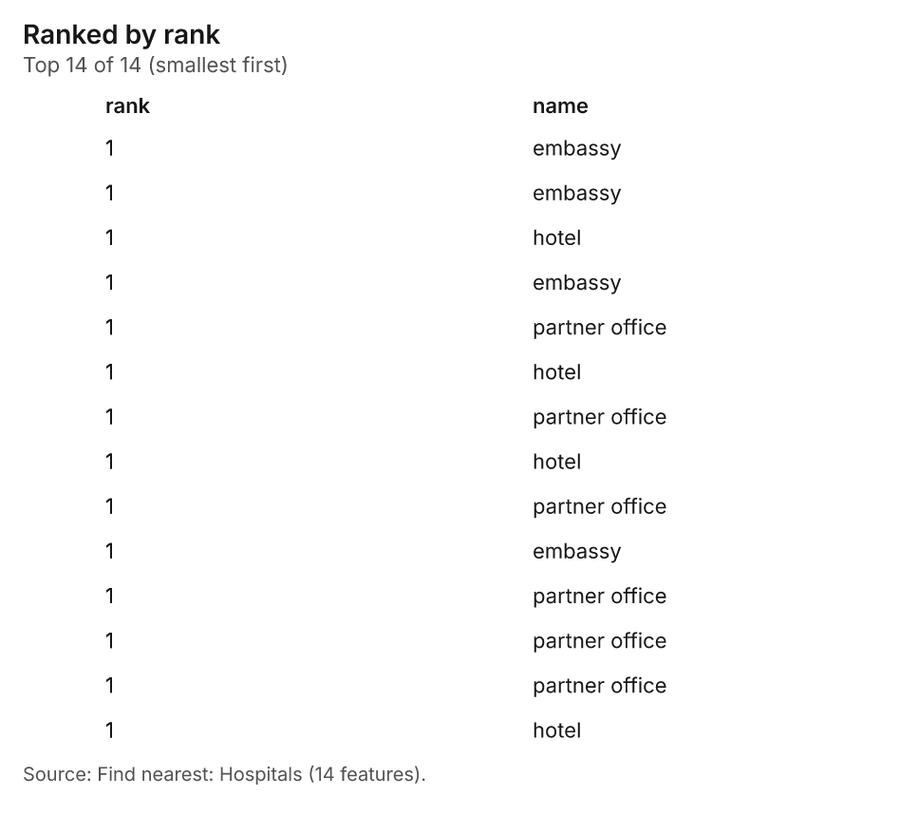
Why it was run on this data. The nearest of Travel routes to each of Hospitals, with distances 52.
What it found. Find nearest on Safe havens, Hospitals: Find nearest: 1 layer saved: Find nearest: Hospitals (14 features) 262955. It reported result, count 14; result, elapsed ms 1; billing, cost 0.01054; billing, list price 0.01054; billing, upstream cost 0 55.
| Result | Value |
|---|---|
| result, count | 14 |
| result, elapsed ms | 1 |
| billing, cost | 0.01054 |
| billing, list price | 0.01054 |
| billing, upstream cost | 0 |
Findings
- Evidenced: Find nearest on Safe havens, Hospitals: Find nearest: 1 layer saved: Find nearest: Hospitals (14 features) 262955.
- Evidenced: It reported result, count 14; result, elapsed ms 1; billing, cost 0.01054; billing, list price 0.01054; billing, upstream cost 0 55.
Tool gp_find_nearest; parameters {"k": 1, "to": {"layer": "Safe havens (d7ec6bb0)"}, "from": {"layer": "Hospitals (8a96a3d4)"}, "project": "188436ed-c19a-4e7c-ab43-b58fe7291e56", "max_distance_m": 2000.0}
Find nearest
What this analysis is. Find nearest: The k nearest features for each input, with geodesic distance and bearing 51. In ArcGIS it is Find Nearest or Near; in QGIS, native:joinbynearest or native:nearestneighbouranalysis 51.
Why it was run on this data. The nearest of Travel routes to each of Hospitals, with distances 52.
What it found. The gp_find_nearest tool was utilized with Protest events 8 and Hospitals 26 56. This process found 6 results 56. The execution was quick, completing in 1 elapsed ms 56. The billing cost associated with this operation was 0.0119 56.
| Result | Value |
|---|---|
| result, count | 6 |
| result, elapsed ms | 1 |
| billing, cost | 0.0119 |
| billing, list price | 0.0119 |
| billing, upstream cost | 0 |
Findings
- Evidenced: Find nearest on Protest events, Hospitals: Find nearest: 1 layer saved: Find nearest: Hospitals (6 features) 82656.
- Evidenced: It reported result, count 6; result, elapsed ms 1; billing, cost 0.0119; billing, list price 0.0119; billing, upstream cost 0 56.
Tool gp_find_nearest; parameters {"k": 1, "to": {"layer": "Protest events (cf75e6b1)"}, "from": {"layer": "Hospitals (8a96a3d4)"}, "project": "188436ed-c19a-4e7c-ab43-b58fe7291e56", "max_distance_m": 2000.0}
Maps and charts
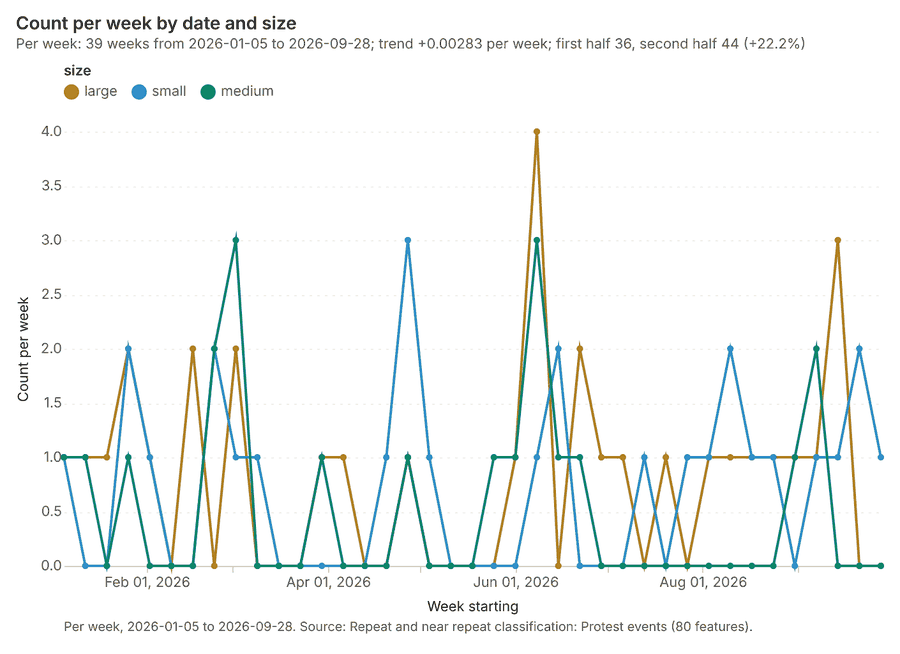
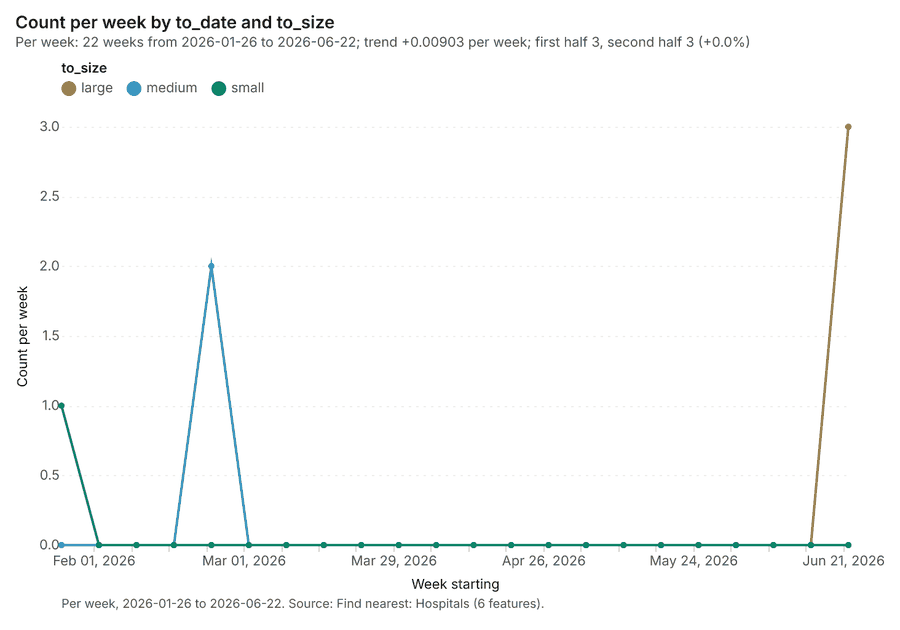
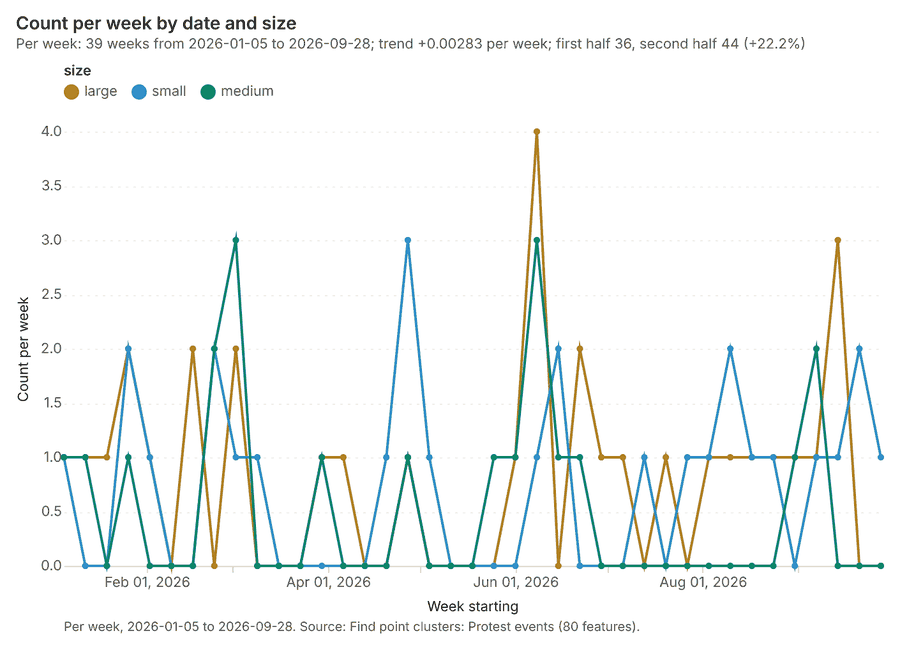
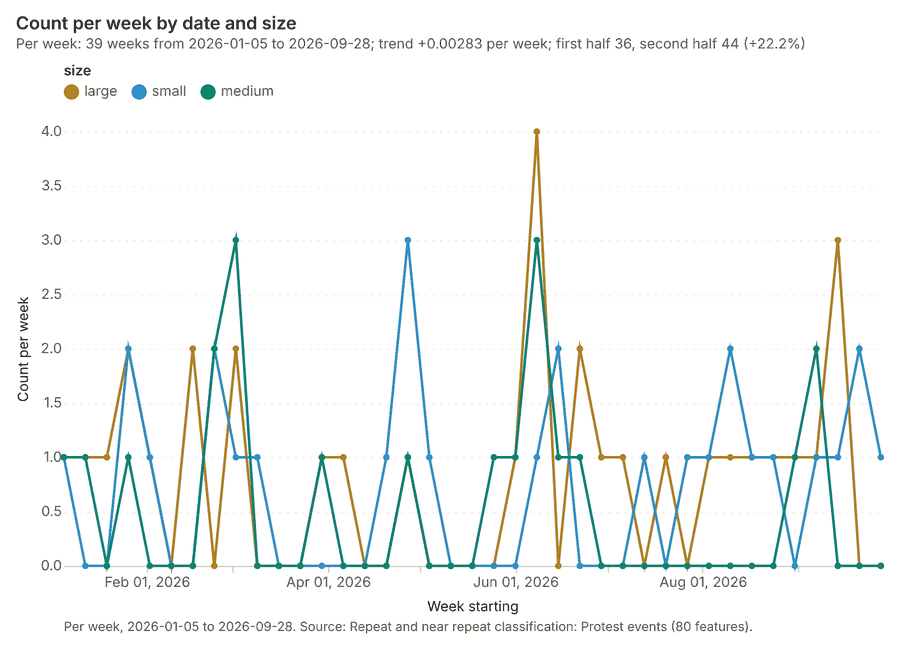
The run also made 23 map image(s) 5758596061626364656667686970717273747576777879 and 27 chart(s) 8081828384858687888990919293949596979899100101102103104105106.
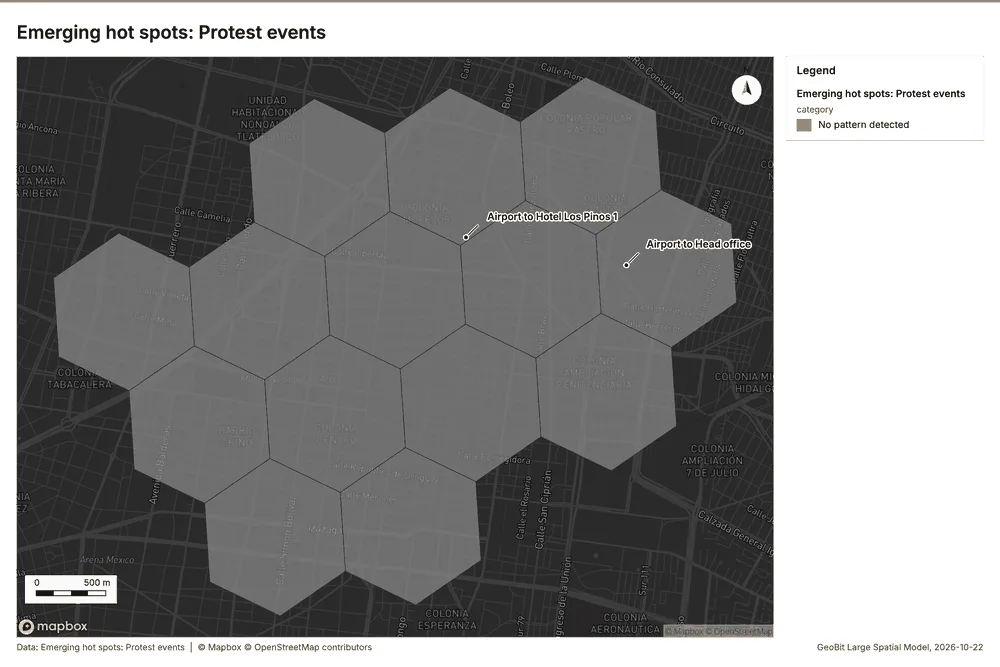
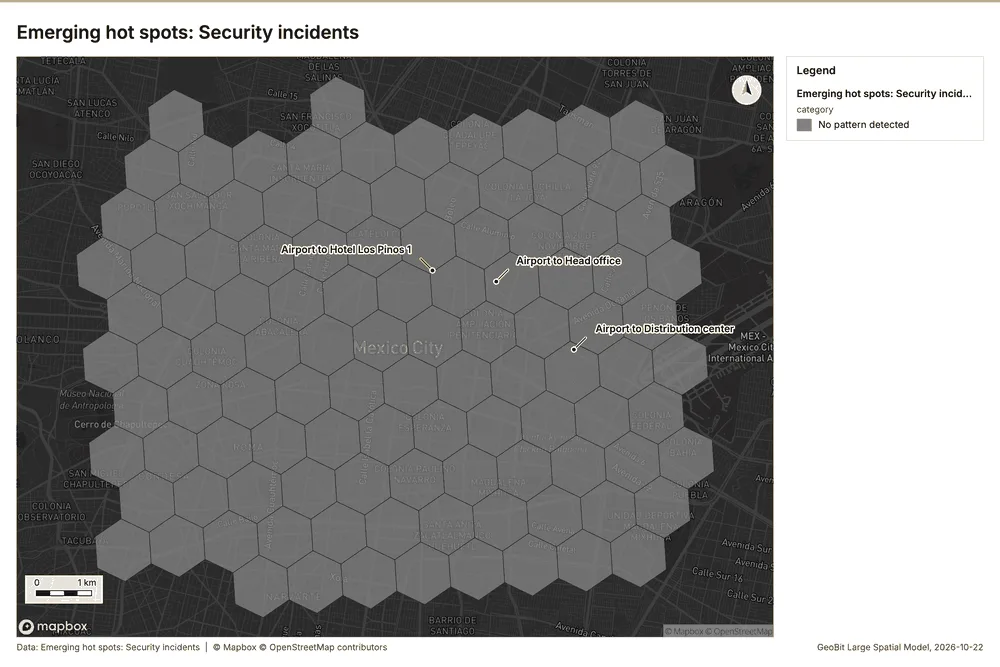
What the map shows. This map, titled "Emerging hot spots: Protest events," analyzes a specific geographic area running from longitude -99.15818 to -99.10583 and latitude 19.41925 to 19.45709. The analysis indicates that there is no identifiable pattern of "Emerging 60
Inferred: read from the image by gemma4:e4b, not evidence.
Changes since the last run
This is the first report of this project.
Sources
- 1Rendering: Chart: Timeline: events per week by dataset. 159 rows id f07ed5b6-9486-4c24-a7ad-e2c1b9a45323
- 2Dataset: Security incidents. vector, 1700 rows id e157aa87-0056-48e2-affe-2abe8c8f035b
- 3Dataset: Protest events. vector, 80 rows id 61b11bf6-a94e-410d-bc75-a441daea9e2e
- 4Dataset: Travel log. table, 400 rows id 91769657-5256-4993-90ae-bea93e5d9277
- 5Catalog: Hot spot analysis (operation catalog, gp_hot_spots). Getis-Ord Gi* hot and cold spots with z-scores, p-values and confidence bins. ArcGIS: Find Hot Spots, Hot Spot Analysis (Getis-Ord Gi*). QGIS: qgis:hotspot (plugin). id gp_hot_spots
- 6Plan: Hot spots of Protest events (the Start plan's candidate c_e4c60efa6297). 80 points: Getis-Ord Gi* tests whether the concentrations in Protest events are statistically significant. id 2f94775f-544a-4c5f-9cbe-3a9e3ee974e2:c_e4c60efa6297
- 7Tool result: gp_hot_spots, step 0. Hot spot analysis: 1 layer saved: Hot spot analysis: Protest events (29 features). id cb954b77-a9f1-40f9-ba2a-8936e0981670:0
- 8Layer: Protest events. 80 features id cf75e6b1-838e-4795-85d8-20e39702882e
- 9Plan: Hot spots of Hotels (the Start plan's candidate c_d9214e0b2e9c). 30 points: Getis-Ord Gi* tests whether the concentrations in Hotels are statistically significant. id 2f94775f-544a-4c5f-9cbe-3a9e3ee974e2:c_d9214e0b2e9c
- 10Tool result: gp_hot_spots, step 1. Hot spot analysis: 1 layer saved: Hot spot analysis: Hotels (14 features). id cb954b77-a9f1-40f9-ba2a-8936e0981670:1
- 11Layer: Hotels. 30 features id 28842e9c-fa0f-4fa0-ab60-50616b38e2eb
- 12Plan: Hot spots of Security incidents (the Start plan's candidate c_2cf7cb199846). 1700 points: Getis-Ord Gi* tests whether the concentrations in Security incidents are statistically significant. id 2f94775f-544a-4c5f-9cbe-3a9e3ee974e2:c_2cf7cb199846
- 13Tool result: gp_hot_spots, step 2. Hot spot analysis: 1 layer saved: Hot spot analysis: Security incidents (353 features). id cb954b77-a9f1-40f9-ba2a-8936e0981670:2
- 14Layer: Security incidents. 1,700 features id afb5d90c-b04a-45b5-86de-02dd48a97b15
- 15Catalog: Emerging hot spots (operation catalog, gp_space_time_hot_spots). Where hot spots are new, consecutive, intensifying, persistent, diminishing, sporadic, oscillating or historical over time. ArcGIS: Emerging Hot Spot Analysis, Create Space Time Cube. id gp_space_time_hot_spots
- 16Plan: Space time hot spots of Protest events (the Start plan's candidate c_7097f355a4d8). Protest events carry dates in 'date': emerging hot spot analysis finds new, intensifying and fading hot spots per week. id 2f94775f-544a-4c5f-9cbe-3a9e3ee974e2:c_7097f355a4d8
- 17Tool result: gp_space_time_hot_spots, step 0. Emerging hot spots: 1 layer saved: Emerging hot spots: Protest events (14 features). id 4ce981f8-e618-4a52-ab5e-deb572cf8a18:0
- 18Plan: Space time hot spots of Security incidents (the Start plan's candidate c_333ac7b0a6a6). Security incidents carry dates in 'occurred_at': emerging hot spot analysis finds new, intensifying and fading hot spots per week. id 2f94775f-544a-4c5f-9cbe-3a9e3ee974e2:c_333ac7b0a6a6
- 19Tool result: gp_space_time_hot_spots, step 1. Emerging hot spots: 1 layer saved: Emerging hot spots: Security incidents (108 features). id 4ce981f8-e618-4a52-ab5e-deb572cf8a18:1
- 20Catalog: Repeat and near repeat classification (operation catalog, gp_near_repeat). Classify incidents as originators, repeats (same place) or near repeats within a distance and time window, with a Knox test table. ArcGIS: Repeat and Near Repeat Classification, Near Repeat Calculator. id gp_near_repeat
- 21Plan: Near repeat of Protest events (the Start plan's candidate c_f95b4db5e496). Near repeat analysis tests whether Protest events close in space also follow each other within 27 days. id 2f94775f-544a-4c5f-9cbe-3a9e3ee974e2:c_f95b4db5e496
- 22Tool result: gp_near_repeat, step 2. Repeat and near repeat classification: 1 layer saved: Repeat and near repeat classification: Protest events (80 features). id 4ce981f8-e618-4a52-ab5e-deb572cf8a18:2
- 23Catalog: Summarize within (operation catalog, gp_summarize_within). Count and aggregate the features inside each polygon (or bin), proportionally for lines and polygons. ArcGIS: Summarize Within, Aggregate Points. QGIS: native:countpointsinpolygon, native:sumlinelengths. id gp_summarize_within
- 24Plan: Hospitals per feature of Risk zones (the Start plan's candidate c_6520524d187a). Count Hospitals inside each feature of Risk zones by english_speaking; the counts map as a choropleth (natural breaks, sequential colors). id 2f94775f-544a-4c5f-9cbe-3a9e3ee974e2:c_6520524d187a
- 25Tool result: gp_summarize_within, step 0. Summarize within: 1 layer saved: Summarize within: Risk zones (14 features). id 4db35232-a32c-47e1-9154-89fbc3620126:0
- 26Layer: Hospitals. 15 features id 8a96a3d4-1867-4c29-8033-2a6817b92b2c
- 27Layer: Risk zones. 14 features id a4d2e294-c13c-4572-b6fc-2b8ef4e9c955
- 28Tool result: gp_summarize_within, step 1. Summarize within: 1 layer saved: Summarize within: Risk zones (14 features). id 4db35232-a32c-47e1-9154-89fbc3620126:1
- 29Layer: Safe havens. 12 features id d7ec6bb0-8b36-474d-8157-931bdc40122a
- 30Tool result: gp_summarize_within, step 2. Summarize within: 1 layer saved: Summarize within: Risk zones (14 features). id 4db35232-a32c-47e1-9154-89fbc3620126:2
- 31Catalog: Find point clusters (operation catalog, gp_find_point_clusters). Density-based clusters (DBSCAN, HDBSCAN or OPTICS, optionally space-time) with hulls and noise. ArcGIS: Find Point Clusters, Density-based Clustering. QGIS: native:dbscanclustering, native:stdbscanclustering. id gp_find_point_clusters
- 32Plan: Cluster points of Hospitals (the Start plan's candidate c_65a1f33e9e5e). DBSCAN finds dense groups of Hospitals and separates noise. id 2f94775f-544a-4c5f-9cbe-3a9e3ee974e2:c_65a1f33e9e5e
- 33Tool result: gp_find_point_clusters, step 0. Find point clusters: 2 layers saved: Find point clusters: Hospitals (15 features); Find point clusters: cluster hulls (1 feature). id 86c36cc2-95cb-4bfa-aac6-db9cc2913cc1:0
- 34Plan: Cluster points of Safe havens (the Start plan's candidate c_5ba3c571cd04). DBSCAN finds dense groups of Safe havens and separates noise. id 2f94775f-544a-4c5f-9cbe-3a9e3ee974e2:c_5ba3c571cd04
- 35Tool result: gp_find_point_clusters, step 1. Find point clusters: 2 layers saved: Find point clusters: Safe havens (12 features); Find point clusters: cluster hulls (2 features). id 86c36cc2-95cb-4bfa-aac6-db9cc2913cc1:1
- 36Plan: Cluster points of Protest events (the Start plan's candidate c_ae60a45625a8). DBSCAN finds dense groups of Protest events and separates noise. id 2f94775f-544a-4c5f-9cbe-3a9e3ee974e2:c_ae60a45625a8
- 37Tool result: gp_find_point_clusters, step 2. Find point clusters: 2 layers saved: Find point clusters: Protest events (80 features); Find point clusters: cluster hulls (1 feature). id 86c36cc2-95cb-4bfa-aac6-db9cc2913cc1:2
- 38Catalog: Calculate density (operation catalog, gp_calculate_density). Kernel density per square kilometer on a grid. ArcGIS: Calculate Density, Kernel Density. QGIS: native:heatmapkerneldensityestimation. id gp_calculate_density
- 39Plan: Kernel density of Protest events (the Start plan's candidate c_7c8acce6dd51). 80 points in Protest events: a density surface shows where they concentrate. id 2f94775f-544a-4c5f-9cbe-3a9e3ee974e2:c_7c8acce6dd51
- 40Tool result: gp_calculate_density, step 0. Calculate density: 1 layer saved: Calculate density: Protest events (386 features). id 72e7e894-08fe-429b-84d0-f973eac006a1:0
- 41Plan: Kernel density of Hotels (the Start plan's candidate c_fb39ef5f9446). 30 points in Hotels: a density surface shows where they concentrate. id 2f94775f-544a-4c5f-9cbe-3a9e3ee974e2:c_fb39ef5f9446
- 42Tool result: gp_calculate_density, step 1. Calculate density: 1 layer saved: Calculate density: Hotels (82 features). id 72e7e894-08fe-429b-84d0-f973eac006a1:1
- 43Plan: Kernel density of Security incidents (the Start plan's candidate c_8b75d0e8f5bf). 1700 points in Security incidents: a density surface shows where they concentrate. id 2f94775f-544a-4c5f-9cbe-3a9e3ee974e2:c_8b75d0e8f5bf
- 44Tool result: gp_calculate_density, step 2. Calculate density: 1 layer saved: Calculate density: Security incidents (2240 features). id 72e7e894-08fe-429b-84d0-f973eac006a1:2
- 45Catalog: Find outliers (operation catalog, gp_outliers). Anselin local Moran’s I: HH, LL clusters and HL, LH outliers. ArcGIS: Find Outliers, Cluster and Outlier Analysis (Anselin Local Moran’s I). id gp_outliers
- 46Plan: Local morans i of Risk zones (the Start plan's candidate c_b57bb9ae247a). Local Moran's I maps clusters and outliers of 'risk_score'. id 2f94775f-544a-4c5f-9cbe-3a9e3ee974e2:c_b57bb9ae247a
- 47Tool result: gp_outliers, step 0. Find outliers: 1 layer saved: Find outliers: Risk zones (14 features). id 8804c2f2-0669-4232-a6ea-33b246fdbe10:0
- 48Catalog: Spatial autocorrelation (operation catalog, gp_spatial_autocorrelation). Global Moran’s I: is the pattern clustered, dispersed or random. ArcGIS: Spatial Autocorrelation (Global Moran’s I). id gp_spatial_autocorrelation
- 49Plan: Global morans i of Risk zones (the Start plan's candidate c_e8c49b66ee35). Global Moran's I says whether similar values of 'risk_score' sit next to each other. id 2f94775f-544a-4c5f-9cbe-3a9e3ee974e2:c_e8c49b66ee35
- 50Tool result: gp_spatial_autocorrelation, step 1. Spatial autocorrelation: done; no map output. id 8804c2f2-0669-4232-a6ea-33b246fdbe10:1
- 51Catalog: Find nearest (operation catalog, gp_find_nearest). The k nearest features for each input, with geodesic distance and bearing. ArcGIS: Find Nearest, Near, Generate Near Table. QGIS: native:joinbynearest, native:nearestneighbouranalysis. id gp_find_nearest
- 52Plan: Find nearest of Hospitals and Travel routes (the Start plan's candidate c_6c9de7d7d3b4). The nearest of Travel routes to each of Hospitals, with distances. id 2f94775f-544a-4c5f-9cbe-3a9e3ee974e2:c_6c9de7d7d3b4
- 53Tool result: gp_find_nearest, step 0. Find nearest: 1 layer saved: Find nearest: Hospitals (14 features). id d72a65fe-570d-4b7e-bb1f-3397ddd3dff0:0
- 54Layer: Travel routes. 10 features id 17118d2e-4c8a-4e58-a365-56ed0dccddeb
- 55Tool result: gp_find_nearest, step 1. Find nearest: 1 layer saved: Find nearest: Hospitals (14 features). id d72a65fe-570d-4b7e-bb1f-3397ddd3dff0:1
- 56Tool result: gp_find_nearest, step 2. Find nearest: 1 layer saved: Find nearest: Hospitals (6 features). id d72a65fe-570d-4b7e-bb1f-3397ddd3dff0:2
- 57Rendering: Map: Hot spot analysis: Protest events id 500df2bf-0773-4df4-997b-e52faf1d7b86
- 58Rendering: Map: Hot spot analysis: Hotels id a9b20642-0e6f-4981-a664-da575f4c0f47
- 59Rendering: Map: Hot spot analysis: Security incidents id dfc0443f-8eec-4850-bcf5-b167e4b25bb2
- 60Rendering: Map: Emerging hot spots: Protest events id 0099fe22-7871-4a15-a0e8-1feae00a5bfe
- 61Rendering: Map: Emerging hot spots: Security incidents id ac12c726-afc7-4f73-bcad-180032253879
- 62Rendering: Map: Repeat and near repeat classification: Protest events id 88da8834-5528-4120-a9c9-c2d8f343794a
- 63Rendering: Map: Summarize within: Risk zones id 00bc1476-064e-4f9d-b9df-58b7176702f7
- 64Rendering: Map: Summarize within: Risk zones id 097e7003-7459-4810-8b27-5f7a0070cb99
- 65Rendering: Map: Summarize within: Risk zones id 0f0f8452-fff5-40e3-9da5-e4b1a4e0c9c3
- 66Rendering: Map: Find point clusters: Hospitals id 47eb8a01-1990-4474-b495-5bf2f8a9ea58
- 67Rendering: Map: Find point clusters: cluster hulls id 9199cde6-d3cd-466f-bbdb-c545c614f5d9
- 68Rendering: Map: Find point clusters: Safe havens id b7163651-cc15-45dd-85df-b9a1e1a0c2ab
- 69Rendering: Map: Find point clusters: cluster hulls id b07c64b4-3212-4751-b9fe-884c92e2af0b
- 70Rendering: Map: Find point clusters: Protest events id 09c181e5-fd50-4a4d-8fb9-c372f05b7087
- 71Rendering: Map: Find point clusters: cluster hulls id 837965dd-bd8f-4eda-8fc0-9ce4211449eb
- 72Rendering: Map: Calculate density: Protest events id 26c2dd95-9903-4e3a-9502-b9d59a00d91f
- 73Rendering: Map: Calculate density: Hotels id 87642b35-e16d-4168-a04d-24944d0ea7c8
- 74Rendering: Map: Calculate density: Security incidents id db714770-2476-4110-af9b-826c0fda7266
- 75Rendering: Map: Risk zones by risk_score id acd51039-768b-4034-9aa3-0fa9355f4884
- 76Rendering: Map: Find outliers: Risk zones id 5323e5c1-28e1-44b3-8f9c-44f34efbf17f
- 77Rendering: Map: Find nearest: Hospitals id a1567a83-3fb0-4dcf-8d6c-71ba8b4ed7d7
- 78Rendering: Map: Find nearest: Hospitals id b16977bf-56c6-43a5-bf88-4d5b01a2648c
- 79Rendering: Map: Find nearest: Hospitals id 11bfd2f1-7879-4693-a32a-915be104a231
- 80Rendering: Chart: Security incidents over time (occurred_at). 318 rows id e4bbd9ee-6938-4976-afea-98b10b22455f
- 81Rendering: Chart: Protest events over time (date). 117 rows id f828e7a2-d14d-4bc3-b257-85cd520ee1ef
- 82Rendering: Chart: Travel log over time (date). 106 rows id 66c88c61-6c69-4dc0-a55d-5c961369ab06
- 83Rendering: Chart: Hot spot analysis: Protest events. 11 rows id 66439a0c-ac69-4219-b24e-6f7ff88f70d2
- 84Rendering: Chart: Hot spot analysis: Hotels. 6 rows id c52e7b32-d25d-4aed-abe8-9ebb7f603bfd
- 85Rendering: Chart: Hot spot analysis: Security incidents. 16 rows id ca9f7204-df1a-4b6c-b63a-414bc07961a3
- 86Rendering: Chart: Emerging hot spots: Protest events. 5 rows id a0edbd15-0e36-4d00-9145-33631fafb0d4
- 87Rendering: Chart: Emerging hot spots: Security incidents. 8 rows id 0b5d890b-d25b-4e32-8200-951dc01149f7
- 88Rendering: Chart: Repeat and near repeat classification: Protest events. 117 rows id 2306aa49-d791-4cd3-8d4c-28e6660067db
- 89Rendering: Chart: Summarize within: Risk zones. 5 rows id c94ab553-318c-4a5e-bfe3-5ceb6088a6d2
- 90Rendering: Chart: Summarize within: Risk zones. 5 rows id 67037acd-9bb9-4174-b327-02e297418724
- 91Rendering: Chart: Summarize within: Risk zones. 5 rows id 923af0d1-ab6e-4ce5-b3d9-81d29ab8cc03
- 92Rendering: Chart: Find point clusters: Hospitals. 2 rows id 20d9b93a-9f38-4502-8832-0c3847923a24
- 93Rendering: Chart: Find point clusters: cluster hulls. 1 rows id f9da01d9-7689-4ba1-b714-0a48053eb1ae
- 94Rendering: Chart: Find point clusters: Safe havens. 3 rows id b1d7e3a3-1643-4aea-87c6-3d0616a865de
- 95Rendering: Chart: Find point clusters: cluster hulls. 2 rows id 4093c918-1c9f-481a-8b57-2adef8395ab8
- 96Rendering: Chart: Find point clusters: Protest events. 2 rows id 83853866-50d0-468b-8c71-7faa0aa71c50
- 97Rendering: Chart: Find point clusters: cluster hulls. 1 rows id e5bfd36e-59ac-4d44-805f-ba7f25c9358d
- 98Rendering: Chart: Calculate density: Protest events. 10 rows id 73671b82-b4a3-42c0-a8ae-b1d27cba0ec2
- 99Rendering: Chart: Calculate density: Hotels. 8 rows id c0aefbfb-9735-4f03-a2e6-d27fabd30313
- 100Rendering: Chart: Calculate density: Security incidents. 13 rows id a8231907-9048-4318-9575-1e7364e4238a
- 101Rendering: Chart: Find outliers: Risk zones. 14 rows id 491c699f-46c0-4622-98ad-1183374f76e1
- 102Rendering: Chart: Find nearest: Hospitals. 14 rows id 9cc7d0a7-efe8-4e46-9c45-e42681c0944f
- 103Rendering: Chart: Find nearest: Hospitals. 14 rows id e56bd3f0-499e-402f-a74a-cca2f35b3bc9
- 104Rendering: Chart: Find nearest: Hospitals over time. 66 rows id 51a6266c-78a0-4146-87ab-d79e4d6ba260
- 105Rendering: Chart: Find point clusters: Protest events over time. 117 rows id 86bdb528-cab1-4fff-aa57-5ee0311a2b43
- 106Rendering: Chart: Repeat and near repeat classification: Protest events over time. 117 rows id 4dfde3d2-01b3-45b2-90c2-09129de0912c
- 107Dataset: Company sites. vector, 8 rows id a57e5e2e-a25d-409d-9272-6ca1c1ae23ab
- 108Dataset: Hotels. vector, 30 rows id 960da6f9-a119-47d2-8c4c-73faa6425317
- 109Dataset: Travel routes. vector, 10 rows id 1008679c-3d12-45ea-a8ce-be53355c90d8
- 110Dataset: Risk zones. vector, 14 rows id a6555125-2ca1-45ce-8a48-57ce5705423b
- 111Dataset: Hospitals. vector, 15 rows id 03c9ffea-5a0a-4d80-8965-c0709759aff3
- 112Dataset: Safe havens. vector, 12 rows id 511f2fd6-d838-46cc-a47c-c29f431a83c0
- 113Dataset: Site guard roster. table, 16 rows id 19276383-dfed-4594-b706-1f9d7ba7b072
- 114Dataset: Country security briefing. document, ? rows id f20d3f16-9057-4bc4-a33a-b2d8b53657a0
- 115Dataset: Hotel security assessment. document, ? rows id e794bded-1be4-41a5-bbf2-086e1a0791f3
- 116Record: Sample: Corporate security and travel risk, Mexico City id 188436ed-c19a-4e7c-ab43-b58fe7291e56
- 117Layer: Hot spot analysis: Protest events. 29 features id db1e7e50-0b84-4c23-a7f1-70d712d84483
- 118Layer: Hot spot analysis: Hotels. 14 features id 236b49e6-718b-468e-9414-fec05e2fd046
- 119Layer: Hot spot analysis: Security incidents. 353 features id 354043da-a305-407a-bbe0-c2d077f68fed
- 120Layer: Emerging hot spots: Protest events. 14 features id d4e930d7-f5cc-45e0-b105-ee6ff35846d6
- 121Layer: Emerging hot spots: Security incidents. 108 features id 7d258e9e-7357-4428-8775-a97375d60dd3
- 122Layer: Repeat and near repeat classification: Protest events. 80 features id c15ea26d-f7bf-43bf-987f-05e0d75a4a76
- 123Layer: Summarize within: Risk zones. 14 features id 46424976-b4de-430a-93e8-53723336e3a7
- 124Layer: Summarize within: Risk zones. 14 features id 66d57619-49ef-4eb7-831b-bedc47b571d1
- 125Layer: Summarize within: Risk zones. 14 features id 705e651a-1e75-493d-a532-0c8927aa40cd
- 126Layer: Find point clusters: Hospitals. 15 features id 991c0297-f207-49c1-9361-29e0d01cd1f5
- 127Layer: Find point clusters: cluster hulls. 1 features id e06a131f-7989-4c9a-bad5-98f65d8d13ee
- 128Layer: Find point clusters: Safe havens. 12 features id 1da076c5-d608-4691-b2c6-0458f1989d7e
- 129Layer: Find point clusters: cluster hulls. 2 features id cb9419c5-0ee1-4dba-a62a-5b39176bab51
- 130Layer: Find point clusters: Protest events. 80 features id 84d6cdb7-cfe3-4875-8ab3-4c85027ca7be
- 131Layer: Find point clusters: cluster hulls. 1 features id baa8dcc7-143d-4f94-a316-947abdb534cf
- 132Layer: Calculate density: Protest events. 386 features id 54008367-d33a-4511-b5e1-8c4a55915ad0
- 133Layer: Calculate density: Hotels. 82 features id c4eba0a4-6712-445b-bc6c-cf0c26bb9cac
- 134Layer: Calculate density: Security incidents. 2,240 features id 57bb3eed-15a3-4c3d-b425-89ac6f7edeaf
- 135Layer: Find outliers: Risk zones. 14 features id e8ee4af5-2649-4990-8578-af9a7ca2a1e6
- 136Layer: Find nearest: Hospitals. 14 features id cc3abbbe-dedb-4bf4-a08f-10d4882a63d2
- 137Layer: Find nearest: Hospitals. 14 features id 39cac909-2a3f-47b4-9123-524c237e05eb
- 138Layer: Find nearest: Hospitals. 6 features id 5b28ce74-706d-460a-b867-4b1ce5f6ed98
Appendix: the data behind the chartsShow
Figure 1. Timeline: events per week by dataset 1
| period | series | value |
|---|---|---|
| 2025-09-29 | Security incidents | 24 |
| 2025-09-29 | Travel log | 10 |
| 2025-09-29 | Protest events | 0 |
| 2025-10-06 | Security incidents | 24 |
| 2025-10-06 | Travel log | 4 |
| 2025-10-06 | Protest events | 0 |
| 2025-10-13 | Security incidents | 25 |
| 2025-10-13 | Travel log | 8 |
| 2025-10-13 | Protest events | 0 |
| 2025-10-20 | Security incidents | 18 |
| 2025-10-20 | Travel log | 3 |
| 2025-10-20 | Protest events | 0 |
| 2025-10-27 | Security incidents | 38 |
| 2025-10-27 | Travel log | 6 |
| 2025-10-27 | Protest events | 0 |
| 2025-11-03 | Security incidents | 22 |
| 2025-11-03 | Travel log | 9 |
| 2025-11-03 | Protest events | 0 |
| 2025-11-10 | Security incidents | 25 |
| 2025-11-10 | Travel log | 11 |
| 2025-11-10 | Protest events | 0 |
| 2025-11-17 | Security incidents | 25 |
| 2025-11-17 | Travel log | 10 |
| 2025-11-17 | Protest events | 0 |
| 2025-11-24 | Security incidents | 24 |
| 2025-11-24 | Travel log | 4 |
| 2025-11-24 | Protest events | 0 |
| 2025-12-01 | Security incidents | 29 |
| 2025-12-01 | Travel log | 10 |
| 2025-12-01 | Protest events | 0 |
| 2025-12-08 | Security incidents | 28 |
| 2025-12-08 | Travel log | 6 |
| 2025-12-08 | Protest events | 0 |
| 2025-12-15 | Security incidents | 26 |
| 2025-12-15 | Travel log | 7 |
| 2025-12-15 | Protest events | 0 |
| 2025-12-22 | Security incidents | 25 |
| 2025-12-22 | Travel log | 14 |
| 2025-12-22 | Protest events | 0 |
| 2025-12-29 | Security incidents | 32 |
| 2025-12-29 | Travel log | 7 |
| 2025-12-29 | Protest events | 0 |
| 2026-01-05 | Security incidents | 34 |
| 2026-01-05 | Travel log | 6 |
| 2026-01-05 | Protest events | 3 |
| 2026-01-12 | Security incidents | 30 |
| 2026-01-12 | Travel log | 7 |
| 2026-01-12 | Protest events | 2 |
| 2026-01-19 | Security incidents | 29 |
| 2026-01-19 | Travel log | 10 |
| 2026-01-19 | Protest events | 1 |
| 2026-01-26 | Security incidents | 78 |
| 2026-01-26 | Travel log | 12 |
| 2026-01-26 | Protest events | 5 |
| 2026-02-02 | Security incidents | 21 |
| 2026-02-02 | Travel log | 5 |
| 2026-02-02 | Protest events | 2 |
| 2026-02-09 | Security incidents | 34 |
| 2026-02-09 | Travel log | 9 |
| 2026-02-09 | Protest events | 0 |
| 2026-02-16 | Security incidents | 34 |
| 2026-02-16 | Travel log | 9 |
| 2026-02-16 | Protest events | 2 |
| 2026-02-23 | Security incidents | 30 |
| 2026-02-23 | Travel log | 9 |
| 2026-02-23 | Protest events | 4 |
| 2026-03-02 | Security incidents | 110 |
| 2026-03-02 | Travel log | 7 |
| 2026-03-02 | Protest events | 6 |
| 2026-03-09 | Security incidents | 26 |
| 2026-03-09 | Travel log | 7 |
| 2026-03-09 | Protest events | 1 |
| 2026-03-16 | Security incidents | 34 |
| 2026-03-16 | Travel log | 10 |
| 2026-03-16 | Protest events | 0 |
| 2026-03-23 | Security incidents | 19 |
| 2026-03-23 | Travel log | 8 |
| 2026-03-23 | Protest events | 0 |
| 2026-03-30 | Security incidents | 18 |
| 2026-03-30 | Travel log | 3 |
| 2026-03-30 | Protest events | 2 |
| 2026-04-06 | Security incidents | 28 |
| 2026-04-06 | Travel log | 10 |
| 2026-04-06 | Protest events | 1 |
| 2026-04-13 | Security incidents | 27 |
| 2026-04-13 | Travel log | 3 |
| 2026-04-13 | Protest events | 0 |
| 2026-04-20 | Security incidents | 21 |
| 2026-04-20 | Travel log | 6 |
| 2026-04-20 | Protest events | 1 |
| 2026-04-27 | Security incidents | 100 |
| 2026-04-27 | Travel log | 5 |
| 2026-04-27 | Protest events | 5 |
| 2026-05-04 | Security incidents | 22 |
| 2026-05-04 | Travel log | 9 |
| 2026-05-04 | Protest events | 1 |
| 2026-05-11 | Security incidents | 20 |
| 2026-05-11 | Travel log | 9 |
| 2026-05-11 | Protest events | 0 |
| 2026-05-18 | Security incidents | 23 |
| 2026-05-18 | Travel log | 6 |
| 2026-05-18 | Protest events | 0 |
| 2026-05-25 | Security incidents | 26 |
| 2026-05-25 | Travel log | 8 |
| 2026-05-25 | Protest events | 1 |
| 2026-06-01 | Security incidents | 29 |
| 2026-06-01 | Travel log | 4 |
| 2026-06-01 | Protest events | 2 |
| 2026-06-08 | Security incidents | 102 |
| 2026-06-08 | Travel log | 10 |
| 2026-06-08 | Protest events | 8 |
| 2026-06-15 | Security incidents | 20 |
| 2026-06-15 | Travel log | 4 |
| 2026-06-15 | Protest events | 3 |
| 2026-06-22 | Security incidents | 18 |
| 2026-06-22 | Travel log | 9 |
| 2026-06-22 | Protest events | 3 |
| 2026-06-29 | Security incidents | 34 |
| 2026-06-29 | Travel log | 6 |
| 2026-06-29 | Protest events | 1 |
| 2026-07-06 | Security incidents | 17 |
| 2026-07-06 | Travel log | 15 |
| 2026-07-06 | Protest events | 1 |
| 2026-07-13 | Security incidents | 25 |
| 2026-07-13 | Travel log | 5 |
| 2026-07-13 | Protest events | 1 |
| 2026-07-20 | Security incidents | 16 |
| 2026-07-20 | Travel log | 5 |
| 2026-07-20 | Protest events | 1 |
| 2026-07-27 | Security incidents | 21 |
| 2026-07-27 | Travel log | 9 |
| 2026-07-27 | Protest events | 1 |
| 2026-08-03 | Security incidents | 25 |
| 2026-08-03 | Travel log | 6 |
| 2026-08-03 | Protest events | 2 |
| 2026-08-10 | Security incidents | 25 |
| 2026-08-10 | Travel log | 9 |
| 2026-08-10 | Protest events | 3 |
| 2026-08-17 | Security incidents | 20 |
| 2026-08-17 | Travel log | 10 |
| 2026-08-17 | Protest events | 2 |
| 2026-08-24 | Security incidents | 24 |
| 2026-08-24 | Travel log | 9 |
| 2026-08-24 | Protest events | 2 |
| 2026-08-31 | Security incidents | 27 |
| 2026-08-31 | Travel log | 7 |
| 2026-08-31 | Protest events | 2 |
| 2026-09-07 | Security incidents | 32 |
| 2026-09-07 | Travel log | 7 |
| 2026-09-07 | Protest events | 4 |
| 2026-09-14 | Security incidents | 97 |
| 2026-09-14 | Travel log | 7 |
| 2026-09-14 | Protest events | 4 |
| 2026-09-21 | Security incidents | 24 |
| 2026-09-21 | Travel log | 8 |
| 2026-09-21 | Protest events | 2 |
| 2026-09-28 | Security incidents | 15 |
| 2026-09-28 | Travel log | 3 |
| 2026-09-28 | Protest events | 1 |
Figure 25. Security incidents over time (occurred_at) 80
| period | series | value |
|---|---|---|
| 2025-09-29 | robbery | 2 |
| 2025-09-29 | theft | 10 |
| 2025-09-29 | vandalism | 1 |
| 2025-09-29 | road blockade | 1 |
| 2025-09-29 | vehicle theft | 3 |
| 2025-09-29 | Other | 7 |
| 2025-10-06 | robbery | 8 |
| 2025-10-06 | theft | 4 |
| 2025-10-06 | vandalism | 1 |
| 2025-10-06 | road blockade | 3 |
| 2025-10-06 | vehicle theft | 2 |
| 2025-10-06 | Other | 6 |
| 2025-10-13 | robbery | 10 |
| 2025-10-13 | theft | 5 |
| 2025-10-13 | vandalism | 1 |
| 2025-10-13 | road blockade | 0 |
| 2025-10-13 | vehicle theft | 5 |
| 2025-10-13 | Other | 4 |
| 2025-10-20 | robbery | 7 |
| 2025-10-20 | theft | 3 |
| 2025-10-20 | vandalism | 1 |
| 2025-10-20 | road blockade | 3 |
| 2025-10-20 | vehicle theft | 1 |
| 2025-10-20 | Other | 3 |
| 2025-10-27 | robbery | 10 |
| 2025-10-27 | theft | 12 |
| 2025-10-27 | vandalism | 1 |
| 2025-10-27 | road blockade | 2 |
| 2025-10-27 | vehicle theft | 7 |
| 2025-10-27 | Other | 6 |
| 2025-11-03 | robbery | 5 |
| 2025-11-03 | theft | 8 |
| 2025-11-03 | vandalism | 2 |
| 2025-11-03 | road blockade | 2 |
| 2025-11-03 | vehicle theft | 3 |
| 2025-11-03 | Other | 2 |
| 2025-11-10 | robbery | 9 |
| 2025-11-10 | theft | 5 |
| 2025-11-10 | vandalism | 4 |
| 2025-11-10 | road blockade | 2 |
| 2025-11-10 | vehicle theft | 2 |
| 2025-11-10 | Other | 3 |
| 2025-11-17 | robbery | 6 |
| 2025-11-17 | theft | 3 |
| 2025-11-17 | vandalism | 3 |
| 2025-11-17 | road blockade | 1 |
| 2025-11-17 | vehicle theft | 6 |
| 2025-11-17 | Other | 6 |
| 2025-11-24 | robbery | 7 |
| 2025-11-24 | theft | 8 |
| 2025-11-24 | vandalism | 2 |
| 2025-11-24 | road blockade | 2 |
| 2025-11-24 | vehicle theft | 3 |
| 2025-11-24 | Other | 2 |
| 2025-12-01 | robbery | 10 |
| 2025-12-01 | theft | 12 |
| 2025-12-01 | vandalism | 2 |
| 2025-12-01 | road blockade | 0 |
| 2025-12-01 | vehicle theft | 4 |
| 2025-12-01 | Other | 1 |
| 2025-12-08 | robbery | 9 |
| 2025-12-08 | theft | 6 |
| 2025-12-08 | vandalism | 4 |
| 2025-12-08 | road blockade | 1 |
| 2025-12-08 | vehicle theft | 3 |
| 2025-12-08 | Other | 5 |
| 2025-12-15 | robbery | 10 |
| 2025-12-15 | theft | 9 |
| 2025-12-15 | vandalism | 0 |
| 2025-12-15 | road blockade | 1 |
| 2025-12-15 | vehicle theft | 4 |
| 2025-12-15 | Other | 2 |
| 2025-12-22 | robbery | 7 |
| 2025-12-22 | theft | 6 |
| 2025-12-22 | vandalism | 3 |
| 2025-12-22 | road blockade | 1 |
| 2025-12-22 | vehicle theft | 6 |
| 2025-12-22 | Other | 2 |
| 2025-12-29 | robbery | 10 |
| 2025-12-29 | theft | 4 |
| 2025-12-29 | vandalism | 4 |
| 2025-12-29 | road blockade | 3 |
| 2025-12-29 | vehicle theft | 5 |
| 2025-12-29 | Other | 6 |
| 2026-01-05 | robbery | 11 |
| 2026-01-05 | theft | 8 |
| 2026-01-05 | vandalism | 4 |
| 2026-01-05 | road blockade | 1 |
| 2026-01-05 | vehicle theft | 7 |
| 2026-01-05 | Other | 3 |
| 2026-01-12 | robbery | 8 |
| 2026-01-12 | theft | 11 |
| 2026-01-12 | vandalism | 0 |
| 2026-01-12 | road blockade | 4 |
| 2026-01-12 | vehicle theft | 2 |
| 2026-01-12 | Other | 5 |
| 2026-01-19 | robbery | 14 |
| 2026-01-19 | theft | 8 |
| 2026-01-19 | vandalism | 2 |
| 2026-01-19 | road blockade | 1 |
| 2026-01-19 | vehicle theft | 3 |
| 2026-01-19 | Other | 1 |
| 2026-01-26 | robbery | 8 |
| 2026-01-26 | theft | 12 |
| 2026-01-26 | vandalism | 28 |
| 2026-01-26 | road blockade | 20 |
| 2026-01-26 | vehicle theft | 2 |
| 2026-01-26 | Other | 8 |
| 2026-02-02 | robbery | 6 |
| 2026-02-02 | theft | 3 |
| 2026-02-02 | vandalism | 3 |
| 2026-02-02 | road blockade | 1 |
| 2026-02-02 | vehicle theft | 5 |
| 2026-02-02 | Other | 3 |
| 2026-02-09 | robbery | 15 |
| 2026-02-09 | theft | 8 |
| 2026-02-09 | vandalism | 4 |
| 2026-02-09 | road blockade | 1 |
| 2026-02-09 | vehicle theft | 2 |
| 2026-02-09 | Other | 4 |
| 2026-02-16 | robbery | 13 |
| 2026-02-16 | theft | 9 |
| 2026-02-16 | vandalism | 3 |
| 2026-02-16 | road blockade | 1 |
| 2026-02-16 | vehicle theft | 4 |
| 2026-02-16 | Other | 4 |
| 2026-02-23 | robbery | 10 |
| 2026-02-23 | theft | 8 |
| 2026-02-23 | vandalism | 3 |
| 2026-02-23 | road blockade | 2 |
| 2026-02-23 | vehicle theft | 5 |
| 2026-02-23 | Other | 2 |
| 2026-03-02 | robbery | 16 |
| 2026-03-02 | theft | 8 |
| 2026-03-02 | vandalism | 35 |
| 2026-03-02 | road blockade | 40 |
| 2026-03-02 | vehicle theft | 5 |
| 2026-03-02 | Other | 6 |
| 2026-03-09 | robbery | 6 |
| 2026-03-09 | theft | 11 |
| 2026-03-09 | vandalism | 1 |
| 2026-03-09 | road blockade | 0 |
| 2026-03-09 | vehicle theft | 4 |
| 2026-03-09 | Other | 4 |
| 2026-03-16 | robbery | 10 |
| 2026-03-16 | theft | 10 |
| 2026-03-16 | vandalism | 2 |
| 2026-03-16 | road blockade | 3 |
| 2026-03-16 | vehicle theft | 5 |
| 2026-03-16 | Other | 4 |
| 2026-03-23 | robbery | 7 |
| 2026-03-23 | theft | 5 |
| 2026-03-23 | vandalism | 2 |
| 2026-03-23 | road blockade | 1 |
| 2026-03-23 | vehicle theft | 3 |
| 2026-03-23 | Other | 1 |
| 2026-03-30 | robbery | 7 |
| 2026-03-30 | theft | 5 |
| 2026-03-30 | vandalism | 2 |
| 2026-03-30 | road blockade | 0 |
| 2026-03-30 | vehicle theft | 2 |
| 2026-03-30 | Other | 2 |
| 2026-04-06 | robbery | 9 |
| 2026-04-06 | theft | 3 |
| 2026-04-06 | vandalism | 7 |
| 2026-04-06 | road blockade | 2 |
| 2026-04-06 | vehicle theft | 4 |
| 2026-04-06 | Other | 3 |
| 2026-04-13 | robbery | 12 |
| 2026-04-13 | theft | 7 |
| 2026-04-13 | vandalism | 1 |
| 2026-04-13 | road blockade | 1 |
| 2026-04-13 | vehicle theft | 1 |
| 2026-04-13 | Other | 5 |
| 2026-04-20 | robbery | 7 |
| 2026-04-20 | theft | 7 |
| 2026-04-20 | vandalism | 1 |
| 2026-04-20 | road blockade | 1 |
| 2026-04-20 | vehicle theft | 1 |
| 2026-04-20 | Other | 4 |
| 2026-04-27 | robbery | 13 |
| 2026-04-27 | theft | 14 |
| 2026-04-27 | vandalism | 32 |
| 2026-04-27 | road blockade | 30 |
| 2026-04-27 | vehicle theft | 4 |
| 2026-04-27 | Other | 7 |
| 2026-05-04 | robbery | 7 |
| 2026-05-04 | theft | 5 |
| 2026-05-04 | vandalism | 1 |
| 2026-05-04 | road blockade | 1 |
| 2026-05-04 | vehicle theft | 4 |
| 2026-05-04 | Other | 4 |
| 2026-05-11 | robbery | 8 |
| 2026-05-11 | theft | 6 |
| 2026-05-11 | vandalism | 2 |
| 2026-05-11 | road blockade | 1 |
| 2026-05-11 | vehicle theft | 2 |
| 2026-05-11 | Other | 1 |
| 2026-05-18 | robbery | 9 |
| 2026-05-18 | theft | 8 |
| 2026-05-18 | vandalism | 1 |
| 2026-05-18 | road blockade | 1 |
| 2026-05-18 | vehicle theft | 2 |
| 2026-05-18 | Other | 2 |
| 2026-05-25 | robbery | 9 |
| 2026-05-25 | theft | 9 |
| 2026-05-25 | vandalism | 1 |
| 2026-05-25 | road blockade | 1 |
| 2026-05-25 | vehicle theft | 3 |
| 2026-05-25 | Other | 3 |
| 2026-06-01 | robbery | 9 |
| 2026-06-01 | theft | 9 |
| 2026-06-01 | vandalism | 1 |
| 2026-06-01 | road blockade | 2 |
| 2026-06-01 | vehicle theft | 5 |
| 2026-06-01 | Other | 3 |
| 2026-06-08 | robbery | 9 |
| 2026-06-08 | theft | 12 |
| 2026-06-08 | vandalism | 35 |
| 2026-06-08 | road blockade | 31 |
| 2026-06-08 | vehicle theft | 7 |
| 2026-06-08 | Other | 8 |
| 2026-06-15 | robbery | 10 |
| 2026-06-15 | theft | 3 |
| 2026-06-15 | vandalism | 3 |
| 2026-06-15 | road blockade | 0 |
| 2026-06-15 | vehicle theft | 1 |
| 2026-06-15 | Other | 3 |
| 2026-06-22 | robbery | 5 |
| 2026-06-22 | theft | 4 |
| 2026-06-22 | vandalism | 1 |
| 2026-06-22 | road blockade | 1 |
| 2026-06-22 | vehicle theft | 3 |
| 2026-06-22 | Other | 4 |
| 2026-06-29 | robbery | 10 |
| 2026-06-29 | theft | 12 |
| 2026-06-29 | vandalism | 0 |
| 2026-06-29 | road blockade | 0 |
| 2026-06-29 | vehicle theft | 8 |
| 2026-06-29 | Other | 4 |
| 2026-07-06 | robbery | 8 |
| 2026-07-06 | theft | 3 |
| 2026-07-06 | vandalism | 1 |
| 2026-07-06 | road blockade | 1 |
| 2026-07-06 | vehicle theft | 1 |
| 2026-07-06 | Other | 3 |
| 2026-07-13 | robbery | 11 |
| 2026-07-13 | theft | 6 |
| 2026-07-13 | vandalism | 1 |
| 2026-07-13 | road blockade | 1 |
| 2026-07-13 | vehicle theft | 3 |
| 2026-07-13 | Other | 3 |
| 2026-07-20 | robbery | 6 |
| 2026-07-20 | theft | 3 |
| 2026-07-20 | vandalism | 1 |
| 2026-07-20 | road blockade | 0 |
| 2026-07-20 | vehicle theft | 4 |
| 2026-07-20 | Other | 2 |
| 2026-07-27 | robbery | 5 |
| 2026-07-27 | theft | 8 |
| 2026-07-27 | vandalism | 2 |
| 2026-07-27 | road blockade | 1 |
| 2026-07-27 | vehicle theft | 3 |
| 2026-07-27 | Other | 2 |
| 2026-08-03 | robbery | 6 |
| 2026-08-03 | theft | 7 |
| 2026-08-03 | vandalism | 5 |
| 2026-08-03 | road blockade | 2 |
| 2026-08-03 | vehicle theft | 4 |
| 2026-08-03 | Other | 1 |
| 2026-08-10 | robbery | 8 |
| 2026-08-10 | theft | 10 |
| 2026-08-10 | vandalism | 2 |
| 2026-08-10 | road blockade | 2 |
| 2026-08-10 | vehicle theft | 0 |
| 2026-08-10 | Other | 3 |
| 2026-08-17 | robbery | 3 |
| 2026-08-17 | theft | 8 |
| 2026-08-17 | vandalism | 2 |
| 2026-08-17 | road blockade | 2 |
| 2026-08-17 | vehicle theft | 1 |
| 2026-08-17 | Other | 4 |
| 2026-08-24 | robbery | 6 |
| 2026-08-24 | theft | 10 |
| 2026-08-24 | vandalism | 1 |
| 2026-08-24 | road blockade | 1 |
| 2026-08-24 | vehicle theft | 3 |
| 2026-08-24 | Other | 3 |
| 2026-08-31 | robbery | 9 |
| 2026-08-31 | theft | 5 |
| 2026-08-31 | vandalism | 3 |
| 2026-08-31 | road blockade | 3 |
| 2026-08-31 | vehicle theft | 6 |
| 2026-08-31 | Other | 1 |
| 2026-09-07 | robbery | 9 |
| 2026-09-07 | theft | 6 |
| 2026-09-07 | vandalism | 4 |
| 2026-09-07 | road blockade | 2 |
| 2026-09-07 | vehicle theft | 4 |
| 2026-09-07 | Other | 7 |
| 2026-09-14 | robbery | 15 |
| 2026-09-14 | theft | 12 |
| 2026-09-14 | vandalism | 24 |
| 2026-09-14 | road blockade | 37 |
| 2026-09-14 | vehicle theft | 3 |
| 2026-09-14 | Other | 6 |
| 2026-09-21 | robbery | 5 |
| 2026-09-21 | theft | 8 |
| 2026-09-21 | vandalism | 1 |
| 2026-09-21 | road blockade | 1 |
| 2026-09-21 | vehicle theft | 3 |
| 2026-09-21 | Other | 6 |
| 2026-09-28 | robbery | 7 |
| 2026-09-28 | theft | 4 |
| 2026-09-28 | vandalism | 1 |
| 2026-09-28 | road blockade | 0 |
| 2026-09-28 | vehicle theft | 1 |
| 2026-09-28 | Other | 2 |
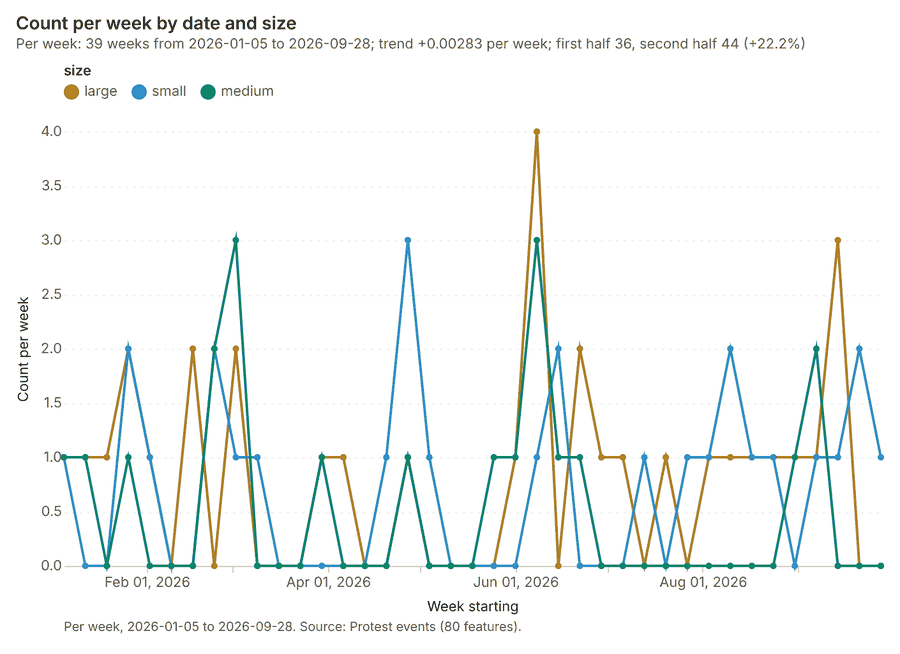
Figure 26. Protest events over time (date) 81
| period | series | value |
|---|---|---|
| 2026-01-05 | large | 1 |
| 2026-01-05 | small | 1 |
| 2026-01-05 | medium | 1 |
| 2026-01-12 | large | 1 |
| 2026-01-12 | small | 0 |
| 2026-01-12 | medium | 1 |
| 2026-01-19 | large | 1 |
| 2026-01-19 | small | 0 |
| 2026-01-19 | medium | 0 |
| 2026-01-26 | large | 2 |
| 2026-01-26 | small | 2 |
| 2026-01-26 | medium | 1 |
| 2026-02-02 | large | 1 |
| 2026-02-02 | small | 1 |
| 2026-02-02 | medium | 0 |
| 2026-02-09 | large | 0 |
| 2026-02-09 | small | 0 |
| 2026-02-09 | medium | 0 |
| 2026-02-16 | large | 2 |
| 2026-02-16 | small | 0 |
| 2026-02-16 | medium | 0 |
| 2026-02-23 | large | 0 |
| 2026-02-23 | small | 2 |
| 2026-02-23 | medium | 2 |
| 2026-03-02 | large | 2 |
| 2026-03-02 | small | 1 |
| 2026-03-02 | medium | 3 |
| 2026-03-09 | large | 0 |
| 2026-03-09 | small | 1 |
| 2026-03-09 | medium | 0 |
| 2026-03-16 | large | 0 |
| 2026-03-16 | small | 0 |
| 2026-03-16 | medium | 0 |
| 2026-03-23 | large | 0 |
| 2026-03-23 | small | 0 |
| 2026-03-23 | medium | 0 |
| 2026-03-30 | large | 1 |
| 2026-03-30 | small | 0 |
| 2026-03-30 | medium | 1 |
| 2026-04-06 | large | 1 |
| 2026-04-06 | small | 0 |
| 2026-04-06 | medium | 0 |
| 2026-04-13 | large | 0 |
| 2026-04-13 | small | 0 |
| 2026-04-13 | medium | 0 |
| 2026-04-20 | large | 0 |
| 2026-04-20 | small | 1 |
| 2026-04-20 | medium | 0 |
| 2026-04-27 | large | 1 |
| 2026-04-27 | small | 3 |
| 2026-04-27 | medium | 1 |
| 2026-05-04 | large | 0 |
| 2026-05-04 | small | 1 |
| 2026-05-04 | medium | 0 |
| 2026-05-11 | large | 0 |
| 2026-05-11 | small | 0 |
| 2026-05-11 | medium | 0 |
| 2026-05-18 | large | 0 |
| 2026-05-18 | small | 0 |
| 2026-05-18 | medium | 0 |
| 2026-05-25 | large | 0 |
| 2026-05-25 | small | 0 |
| 2026-05-25 | medium | 1 |
| 2026-06-01 | large | 1 |
| 2026-06-01 | small | 0 |
| 2026-06-01 | medium | 1 |
| 2026-06-08 | large | 4 |
| 2026-06-08 | small | 1 |
| 2026-06-08 | medium | 3 |
| 2026-06-15 | large | 0 |
| 2026-06-15 | small | 2 |
| 2026-06-15 | medium | 1 |
| 2026-06-22 | large | 2 |
| 2026-06-22 | small | 0 |
| 2026-06-22 | medium | 1 |
| 2026-06-29 | large | 1 |
| 2026-06-29 | small | 0 |
| 2026-06-29 | medium | 0 |
| 2026-07-06 | large | 1 |
| 2026-07-06 | small | 0 |
| 2026-07-06 | medium | 0 |
| 2026-07-13 | large | 0 |
| 2026-07-13 | small | 1 |
| 2026-07-13 | medium | 0 |
| 2026-07-20 | large | 1 |
| 2026-07-20 | small | 0 |
| 2026-07-20 | medium | 0 |
| 2026-07-27 | large | 0 |
| 2026-07-27 | small | 1 |
| 2026-07-27 | medium | 0 |
| 2026-08-03 | large | 1 |
| 2026-08-03 | small | 1 |
| 2026-08-03 | medium | 0 |
| 2026-08-10 | large | 1 |
| 2026-08-10 | small | 2 |
| 2026-08-10 | medium | 0 |
| 2026-08-17 | large | 1 |
| 2026-08-17 | small | 1 |
| 2026-08-17 | medium | 0 |
| 2026-08-24 | large | 1 |
| 2026-08-24 | small | 1 |
| 2026-08-24 | medium | 0 |
| 2026-08-31 | large | 1 |
| 2026-08-31 | small | 0 |
| 2026-08-31 | medium | 1 |
| 2026-09-07 | large | 1 |
| 2026-09-07 | small | 1 |
| 2026-09-07 | medium | 2 |
| 2026-09-14 | large | 3 |
| 2026-09-14 | small | 1 |
| 2026-09-14 | medium | 0 |
| 2026-09-21 | large | 0 |
| 2026-09-21 | small | 2 |
| 2026-09-21 | medium | 0 |
| 2026-09-28 | large | 0 |
| 2026-09-28 | small | 1 |
| 2026-09-28 | medium | 0 |
Figure 27. Travel log over time (date) 82
| period | series | value |
|---|---|---|
| 2025-09-29 | False | 9 |
| 2025-09-29 | True | 1 |
| 2025-10-06 | False | 4 |
| 2025-10-06 | True | 0 |
| 2025-10-13 | False | 8 |
| 2025-10-13 | True | 0 |
| 2025-10-20 | False | 3 |
| 2025-10-20 | True | 0 |
| 2025-10-27 | False | 6 |
| 2025-10-27 | True | 0 |
| 2025-11-03 | False | 9 |
| 2025-11-03 | True | 0 |
| 2025-11-10 | False | 11 |
| 2025-11-10 | True | 0 |
| 2025-11-17 | False | 10 |
| 2025-11-17 | True | 0 |
| 2025-11-24 | False | 4 |
| 2025-11-24 | True | 0 |
| 2025-12-01 | False | 10 |
| 2025-12-01 | True | 0 |
| 2025-12-08 | False | 4 |
| 2025-12-08 | True | 2 |
| 2025-12-15 | False | 7 |
| 2025-12-15 | True | 0 |
| 2025-12-22 | False | 14 |
| 2025-12-22 | True | 0 |
| 2025-12-29 | False | 7 |
| 2025-12-29 | True | 0 |
| 2026-01-05 | False | 6 |
| 2026-01-05 | True | 0 |
| 2026-01-12 | False | 7 |
| 2026-01-12 | True | 0 |
| 2026-01-19 | False | 10 |
| 2026-01-19 | True | 0 |
| 2026-01-26 | False | 11 |
| 2026-01-26 | True | 1 |
| 2026-02-02 | False | 5 |
| 2026-02-02 | True | 0 |
| 2026-02-09 | False | 9 |
| 2026-02-09 | True | 0 |
| 2026-02-16 | False | 9 |
| 2026-02-16 | True | 0 |
| 2026-02-23 | False | 9 |
| 2026-02-23 | True | 0 |
| 2026-03-02 | False | 7 |
| 2026-03-02 | True | 0 |
| 2026-03-09 | False | 7 |
| 2026-03-09 | True | 0 |
| 2026-03-16 | False | 10 |
| 2026-03-16 | True | 0 |
| 2026-03-23 | False | 8 |
| 2026-03-23 | True | 0 |
| 2026-03-30 | False | 3 |
| 2026-03-30 | True | 0 |
| 2026-04-06 | False | 9 |
| 2026-04-06 | True | 1 |
| 2026-04-13 | False | 3 |
| 2026-04-13 | True | 0 |
| 2026-04-20 | False | 6 |
| 2026-04-20 | True | 0 |
| 2026-04-27 | False | 5 |
| 2026-04-27 | True | 0 |
| 2026-05-04 | False | 9 |
| 2026-05-04 | True | 0 |
| 2026-05-11 | False | 8 |
| 2026-05-11 | True | 1 |
| 2026-05-18 | False | 6 |
| 2026-05-18 | True | 0 |
| 2026-05-25 | False | 5 |
| 2026-05-25 | True | 3 |
| 2026-06-01 | False | 4 |
| 2026-06-01 | True | 0 |
| 2026-06-08 | False | 10 |
| 2026-06-08 | True | 0 |
| 2026-06-15 | False | 4 |
| 2026-06-15 | True | 0 |
| 2026-06-22 | False | 9 |
| 2026-06-22 | True | 0 |
| 2026-06-29 | False | 6 |
| 2026-06-29 | True | 0 |
| 2026-07-06 | False | 15 |
| 2026-07-06 | True | 0 |
| 2026-07-13 | False | 5 |
| 2026-07-13 | True | 0 |
| 2026-07-20 | False | 5 |
| 2026-07-20 | True | 0 |
| 2026-07-27 | False | 9 |
| 2026-07-27 | True | 0 |
| 2026-08-03 | False | 5 |
| 2026-08-03 | True | 1 |
| 2026-08-10 | False | 9 |
| 2026-08-10 | True | 0 |
| 2026-08-17 | False | 10 |
| 2026-08-17 | True | 0 |
| 2026-08-24 | False | 9 |
| 2026-08-24 | True | 0 |
| 2026-08-31 | False | 7 |
| 2026-08-31 | True | 0 |
| 2026-09-07 | False | 7 |
| 2026-09-07 | True | 0 |
| 2026-09-14 | False | 7 |
| 2026-09-14 | True | 0 |
| 2026-09-21 | False | 8 |
| 2026-09-21 | True | 0 |
| 2026-09-28 | False | 3 |
| 2026-09-28 | True | 0 |
Figure 28. Hot spot analysis: Protest events 83
| bin_start | bin_end | band | band_label | count |
|---|---|---|---|---|
| -2 | -1.5 | cold_90 | Cold spot, 90% confidence | 1 |
| -1.5 | -1 | not_significant | Not significant | 2 |
| -1 | -0.5 | not_significant | Not significant | 3 |
| -0.5 | 0 | not_significant | Not significant | 7 |
| 0 | 0.5 | not_significant | Not significant | 2 |
| 0.5 | 1 | not_significant | Not significant | 3 |
| 1 | 1.5 | not_significant | Not significant | 4 |
| 1.5 | 2 | hot_90 | Hot spot, 90% confidence | 1 |
| 2 | 2.5 | hot_95 | Hot spot, 95% confidence | 3 |
| 2.5 | 3 | hot_99 | Hot spot, 99% confidence | 2 |
| 3.5 | 4 | hot_99 | Hot spot, 99% confidence | 1 |
Figure 29. Hot spot analysis: Hotels 84
| bin_start | bin_end | band | band_label | count |
|---|---|---|---|---|
| -1.5 | -1 | not_significant | Not significant | 2 |
| -1 | -0.5 | not_significant | Not significant | 4 |
| -0.5 | 0 | not_significant | Not significant | 5 |
| 0 | 0.5 | not_significant | Not significant | 1 |
| 1.5 | 2 | hot_95 | Hot spot, 95% confidence | 1 |
| 2 | 2.5 | hot_95 | Hot spot, 95% confidence | 1 |
Figure 30. Hot spot analysis: Security incidents 85
| bin_start | bin_end | band | band_label | count |
|---|---|---|---|---|
| -1 | -0.5 | not_significant | Not significant | 41 |
| -0.5 | 0 | not_significant | Not significant | 203 |
| 0 | 0.5 | not_significant | Not significant | 78 |
| 0.5 | 1 | not_significant | Not significant | 10 |
| 1 | 1.5 | not_significant | Not significant | 3 |
| 1.5 | 2 | hot_95 | Hot spot, 95% confidence | 1 |
| 1.5 | 2 | not_significant | Not significant | 1 |
| 2 | 2.5 | hot_95 | Hot spot, 95% confidence | 4 |
| 2.5 | 3 | hot_95 | Hot spot, 95% confidence | 1 |
| 3 | 3.5 | hot_99 | Hot spot, 99% confidence | 2 |
| 3.5 | 4 | hot_99 | Hot spot, 99% confidence | 3 |
| 4 | 4.5 | hot_99 | Hot spot, 99% confidence | 2 |
| 4.5 | 5 | hot_99 | Hot spot, 99% confidence | 1 |
| 5 | 5.5 | hot_99 | Hot spot, 99% confidence | 1 |
| 7 | 7.5 | hot_99 | Hot spot, 99% confidence | 1 |
| 8.5 | 9 | hot_99 | Hot spot, 99% confidence | 1 |
Figure 31. Emerging hot spots: Protest events 86
| bin_start | bin_end | count |
|---|---|---|
| -0.608 | -0.3794 | 8 |
| -0.3794 | -0.1508 | 0 |
| -0.1508 | 0.0778 | 0 |
| 0.0778 | 0.3064 | 0 |
| 0.3064 | 0.535 | 6 |
Figure 32. Emerging hot spots: Security incidents 87
| bin_start | bin_end | count |
|---|---|---|
| -0.663 | -0.3824 | 38 |
| -0.3824 | -0.1017 | 32 |
| -0.1017 | 0.1789 | 0 |
| 0.1789 | 0.4595 | 13 |
| 0.4595 | 0.7401 | 15 |
| 0.7401 | 1.021 | 0 |
| 1.021 | 1.301 | 8 |
| 1.301 | 1.582 | 2 |
Figure 33. Repeat and near repeat classification: Protest events 88
| period | series | value |
|---|---|---|
| 2026-01-05 | large | 1 |
| 2026-01-05 | small | 1 |
| 2026-01-05 | medium | 1 |
| 2026-01-12 | large | 1 |
| 2026-01-12 | small | 0 |
| 2026-01-12 | medium | 1 |
| 2026-01-19 | large | 1 |
| 2026-01-19 | small | 0 |
| 2026-01-19 | medium | 0 |
| 2026-01-26 | large | 2 |
| 2026-01-26 | small | 2 |
| 2026-01-26 | medium | 1 |
| 2026-02-02 | large | 1 |
| 2026-02-02 | small | 1 |
| 2026-02-02 | medium | 0 |
| 2026-02-09 | large | 0 |
| 2026-02-09 | small | 0 |
| 2026-02-09 | medium | 0 |
| 2026-02-16 | large | 2 |
| 2026-02-16 | small | 0 |
| 2026-02-16 | medium | 0 |
| 2026-02-23 | large | 0 |
| 2026-02-23 | small | 2 |
| 2026-02-23 | medium | 2 |
| 2026-03-02 | large | 2 |
| 2026-03-02 | small | 1 |
| 2026-03-02 | medium | 3 |
| 2026-03-09 | large | 0 |
| 2026-03-09 | small | 1 |
| 2026-03-09 | medium | 0 |
| 2026-03-16 | large | 0 |
| 2026-03-16 | small | 0 |
| 2026-03-16 | medium | 0 |
| 2026-03-23 | large | 0 |
| 2026-03-23 | small | 0 |
| 2026-03-23 | medium | 0 |
| 2026-03-30 | large | 1 |
| 2026-03-30 | small | 0 |
| 2026-03-30 | medium | 1 |
| 2026-04-06 | large | 1 |
| 2026-04-06 | small | 0 |
| 2026-04-06 | medium | 0 |
| 2026-04-13 | large | 0 |
| 2026-04-13 | small | 0 |
| 2026-04-13 | medium | 0 |
| 2026-04-20 | large | 0 |
| 2026-04-20 | small | 1 |
| 2026-04-20 | medium | 0 |
| 2026-04-27 | large | 1 |
| 2026-04-27 | small | 3 |
| 2026-04-27 | medium | 1 |
| 2026-05-04 | large | 0 |
| 2026-05-04 | small | 1 |
| 2026-05-04 | medium | 0 |
| 2026-05-11 | large | 0 |
| 2026-05-11 | small | 0 |
| 2026-05-11 | medium | 0 |
| 2026-05-18 | large | 0 |
| 2026-05-18 | small | 0 |
| 2026-05-18 | medium | 0 |
| 2026-05-25 | large | 0 |
| 2026-05-25 | small | 0 |
| 2026-05-25 | medium | 1 |
| 2026-06-01 | large | 1 |
| 2026-06-01 | small | 0 |
| 2026-06-01 | medium | 1 |
| 2026-06-08 | large | 4 |
| 2026-06-08 | small | 1 |
| 2026-06-08 | medium | 3 |
| 2026-06-15 | large | 0 |
| 2026-06-15 | small | 2 |
| 2026-06-15 | medium | 1 |
| 2026-06-22 | large | 2 |
| 2026-06-22 | small | 0 |
| 2026-06-22 | medium | 1 |
| 2026-06-29 | large | 1 |
| 2026-06-29 | small | 0 |
| 2026-06-29 | medium | 0 |
| 2026-07-06 | large | 1 |
| 2026-07-06 | small | 0 |
| 2026-07-06 | medium | 0 |
| 2026-07-13 | large | 0 |
| 2026-07-13 | small | 1 |
| 2026-07-13 | medium | 0 |
| 2026-07-20 | large | 1 |
| 2026-07-20 | small | 0 |
| 2026-07-20 | medium | 0 |
| 2026-07-27 | large | 0 |
| 2026-07-27 | small | 1 |
| 2026-07-27 | medium | 0 |
| 2026-08-03 | large | 1 |
| 2026-08-03 | small | 1 |
| 2026-08-03 | medium | 0 |
| 2026-08-10 | large | 1 |
| 2026-08-10 | small | 2 |
| 2026-08-10 | medium | 0 |
| 2026-08-17 | large | 1 |
| 2026-08-17 | small | 1 |
| 2026-08-17 | medium | 0 |
| 2026-08-24 | large | 1 |
| 2026-08-24 | small | 1 |
| 2026-08-24 | medium | 0 |
| 2026-08-31 | large | 1 |
| 2026-08-31 | small | 0 |
| 2026-08-31 | medium | 1 |
| 2026-09-07 | large | 1 |
| 2026-09-07 | small | 1 |
| 2026-09-07 | medium | 2 |
| 2026-09-14 | large | 3 |
| 2026-09-14 | small | 1 |
| 2026-09-14 | medium | 0 |
| 2026-09-21 | large | 0 |
| 2026-09-21 | small | 2 |
| 2026-09-21 | medium | 0 |
| 2026-09-28 | large | 0 |
| 2026-09-28 | small | 1 |
| 2026-09-28 | medium | 0 |
Figure 34. Summarize within: Risk zones 89
| bin_start | bin_end | count |
|---|---|---|
| 0 | 0.6 | 6 |
| 0.6 | 1.2 | 3 |
| 1.2 | 1.8 | 0 |
| 1.8 | 2.4 | 3 |
| 2.4 | 3 | 2 |
Figure 35. Summarize within: Risk zones 90
| bin_start | bin_end | count |
|---|---|---|
| 0 | 0.6 | 6 |
| 0.6 | 1.2 | 5 |
| 1.2 | 1.8 | 0 |
| 1.8 | 2.4 | 2 |
| 2.4 | 3 | 1 |
Figure 36. Summarize within: Risk zones 91
| bin_start | bin_end | count |
|---|---|---|
| 0 | 15 | 13 |
| 15 | 30 | 0 |
| 30 | 45 | 0 |
| 45 | 60 | 0 |
| 60 | 75 | 1 |
Figure 37. Find point clusters: Hospitals 92
| cluster | features | fraction | share |
|---|---|---|---|
| 0 | 11 | 0.7333 | 73.3% |
| Noise | 4 | 0.2667 | 26.7% |
Figure 38. Find point clusters: cluster hulls 93
| cluster | features | fraction | share |
|---|---|---|---|
| 0 | 1 | 1 | 100.0% |
Figure 39. Find point clusters: Safe havens 94
| cluster | features | fraction | share |
|---|---|---|---|
| 0 | 5 | 0.4167 | 41.7% |
| Noise | 4 | 0.3333 | 33.3% |
| 1 | 3 | 0.25 | 25.0% |
Figure 40. Find point clusters: cluster hulls 95
| cluster | features | fraction | share |
|---|---|---|---|
| 0 | 1 | 0.5 | 50.0% |
| 1 | 1 | 0.5 | 50.0% |
Figure 41. Find point clusters: Protest events 96
| cluster | features | fraction | share |
|---|---|---|---|
| 0 | 77 | 0.9625 | 96.2% |
| Noise | 3 | 0.0375 | 3.8% |
Figure 42. Find point clusters: cluster hulls 97
| cluster | features | fraction | share |
|---|---|---|---|
| 0 | 1 | 1 | 100.0% |
Figure 43. Calculate density: Protest events 98
| bin_start | bin_end | count |
|---|---|---|
| 0 | 2.3 | 20 |
| 2.3 | 4.6 | 27 |
| 4.6 | 6.9 | 33 |
| 6.9 | 9.2 | 68 |
| 9.2 | 11.5 | 48 |
| 11.5 | 13.8 | 47 |
| 13.8 | 16.1 | 63 |
| 16.1 | 18.4 | 33 |
| 18.4 | 20.7 | 26 |
| 20.7 | 23 | 21 |
Figure 44. Calculate density: Hotels 99
| bin_start | bin_end | count |
|---|---|---|
| 0.0002631 | 0.2276 | 48 |
| 0.2276 | 0.455 | 11 |
| 0.455 | 0.6823 | 9 |
| 0.6823 | 0.9096 | 3 |
| 0.9096 | 1.137 | 4 |
| 1.137 | 1.364 | 2 |
| 1.364 | 1.592 | 1 |
| 1.592 | 1.819 | 4 |
Figure 45. Calculate density: Security incidents 100
| bin_start | bin_end | count |
|---|---|---|
| 0 | 4.077 | 166 |
| 4.077 | 8.154 | 169 |
| 8.154 | 12.23 | 166 |
| 12.23 | 16.31 | 169 |
| 16.31 | 20.38 | 169 |
| 20.38 | 24.46 | 174 |
| 24.46 | 28.54 | 167 |
| 28.54 | 32.62 | 175 |
| 32.62 | 36.69 | 173 |
| 36.69 | 40.77 | 171 |
| 40.77 | 44.85 | 169 |
| 44.85 | 48.92 | 174 |
| 48.92 | 53 | 198 |
Figure 46. Find outliers: Risk zones 101
| value | lag | type |
|---|---|---|
| -1.242 | 0.7068 | NS |
| 0.257 | -0.3427 | NS |
| -0.9424 | 1.157 | NS |
| 0.8567 | 1.157 | NS |
| -1.542 | 0.257 | NS |
| 0.257 | -0.0428 | NS |
| 1.157 | 0.5569 | NS |
| -0.0428 | 1.157 | NS |
| 0.8567 | -0.3427 | NS |
| 1.157 | -1.092 | NS |
| -0.9424 | 0.8567 | NS |
| -1.542 | 0.5569 | NS |
| 1.157 | 0.4069 | NS |
| 0.5569 | -1.542 | NS |
Figure 47. Find nearest: Hospitals 102
| rank | name |
|---|---|
| 1 | approved taxi |
| 1 | approved taxi |
| 1 | approved taxi |
| 1 | approved taxi |
| 1 | approved taxi |
| 1 | approved taxi |
| 1 | approved taxi |
| 1 | approved taxi |
| 1 | approved taxi |
| 1 | approved taxi |
| 1 | approved taxi |
| 1 | approved taxi |
| 1 | company car |
| 1 | approved taxi |
Figure 48. Find nearest: Hospitals 103
| rank | name |
|---|---|
| 1 | embassy |
| 1 | embassy |
| 1 | hotel |
| 1 | embassy |
| 1 | partner office |
| 1 | hotel |
| 1 | partner office |
| 1 | hotel |
| 1 | partner office |
| 1 | embassy |
| 1 | partner office |
| 1 | partner office |
| 1 | partner office |
| 1 | hotel |
Figure 49. Find nearest: Hospitals over time 104
| period | series | value |
|---|---|---|
| 2026-01-26 | large | 0 |
| 2026-01-26 | medium | 0 |
| 2026-01-26 | small | 1 |
| 2026-02-02 | large | 0 |
| 2026-02-02 | medium | 0 |
| 2026-02-02 | small | 0 |
| 2026-02-09 | large | 0 |
| 2026-02-09 | medium | 0 |
| 2026-02-09 | small | 0 |
| 2026-02-16 | large | 0 |
| 2026-02-16 | medium | 0 |
| 2026-02-16 | small | 0 |
| 2026-02-23 | large | 0 |
| 2026-02-23 | medium | 2 |
| 2026-02-23 | small | 0 |
| 2026-03-02 | large | 0 |
| 2026-03-02 | medium | 0 |
| 2026-03-02 | small | 0 |
| 2026-03-09 | large | 0 |
| 2026-03-09 | medium | 0 |
| 2026-03-09 | small | 0 |
| 2026-03-16 | large | 0 |
| 2026-03-16 | medium | 0 |
| 2026-03-16 | small | 0 |
| 2026-03-23 | large | 0 |
| 2026-03-23 | medium | 0 |
| 2026-03-23 | small | 0 |
| 2026-03-30 | large | 0 |
| 2026-03-30 | medium | 0 |
| 2026-03-30 | small | 0 |
| 2026-04-06 | large | 0 |
| 2026-04-06 | medium | 0 |
| 2026-04-06 | small | 0 |
| 2026-04-13 | large | 0 |
| 2026-04-13 | medium | 0 |
| 2026-04-13 | small | 0 |
| 2026-04-20 | large | 0 |
| 2026-04-20 | medium | 0 |
| 2026-04-20 | small | 0 |
| 2026-04-27 | large | 0 |
| 2026-04-27 | medium | 0 |
| 2026-04-27 | small | 0 |
| 2026-05-04 | large | 0 |
| 2026-05-04 | medium | 0 |
| 2026-05-04 | small | 0 |
| 2026-05-11 | large | 0 |
| 2026-05-11 | medium | 0 |
| 2026-05-11 | small | 0 |
| 2026-05-18 | large | 0 |
| 2026-05-18 | medium | 0 |
| 2026-05-18 | small | 0 |
| 2026-05-25 | large | 0 |
| 2026-05-25 | medium | 0 |
| 2026-05-25 | small | 0 |
| 2026-06-01 | large | 0 |
| 2026-06-01 | medium | 0 |
| 2026-06-01 | small | 0 |
| 2026-06-08 | large | 0 |
| 2026-06-08 | medium | 0 |
| 2026-06-08 | small | 0 |
| 2026-06-15 | large | 0 |
| 2026-06-15 | medium | 0 |
| 2026-06-15 | small | 0 |
| 2026-06-22 | large | 3 |
| 2026-06-22 | medium | 0 |
| 2026-06-22 | small | 0 |
Figure 50. Find point clusters: Protest events over time 105
| period | series | value |
|---|---|---|
| 2026-01-05 | large | 1 |
| 2026-01-05 | small | 1 |
| 2026-01-05 | medium | 1 |
| 2026-01-12 | large | 1 |
| 2026-01-12 | small | 0 |
| 2026-01-12 | medium | 1 |
| 2026-01-19 | large | 1 |
| 2026-01-19 | small | 0 |
| 2026-01-19 | medium | 0 |
| 2026-01-26 | large | 2 |
| 2026-01-26 | small | 2 |
| 2026-01-26 | medium | 1 |
| 2026-02-02 | large | 1 |
| 2026-02-02 | small | 1 |
| 2026-02-02 | medium | 0 |
| 2026-02-09 | large | 0 |
| 2026-02-09 | small | 0 |
| 2026-02-09 | medium | 0 |
| 2026-02-16 | large | 2 |
| 2026-02-16 | small | 0 |
| 2026-02-16 | medium | 0 |
| 2026-02-23 | large | 0 |
| 2026-02-23 | small | 2 |
| 2026-02-23 | medium | 2 |
| 2026-03-02 | large | 2 |
| 2026-03-02 | small | 1 |
| 2026-03-02 | medium | 3 |
| 2026-03-09 | large | 0 |
| 2026-03-09 | small | 1 |
| 2026-03-09 | medium | 0 |
| 2026-03-16 | large | 0 |
| 2026-03-16 | small | 0 |
| 2026-03-16 | medium | 0 |
| 2026-03-23 | large | 0 |
| 2026-03-23 | small | 0 |
| 2026-03-23 | medium | 0 |
| 2026-03-30 | large | 1 |
| 2026-03-30 | small | 0 |
| 2026-03-30 | medium | 1 |
| 2026-04-06 | large | 1 |
| 2026-04-06 | small | 0 |
| 2026-04-06 | medium | 0 |
| 2026-04-13 | large | 0 |
| 2026-04-13 | small | 0 |
| 2026-04-13 | medium | 0 |
| 2026-04-20 | large | 0 |
| 2026-04-20 | small | 1 |
| 2026-04-20 | medium | 0 |
| 2026-04-27 | large | 1 |
| 2026-04-27 | small | 3 |
| 2026-04-27 | medium | 1 |
| 2026-05-04 | large | 0 |
| 2026-05-04 | small | 1 |
| 2026-05-04 | medium | 0 |
| 2026-05-11 | large | 0 |
| 2026-05-11 | small | 0 |
| 2026-05-11 | medium | 0 |
| 2026-05-18 | large | 0 |
| 2026-05-18 | small | 0 |
| 2026-05-18 | medium | 0 |
| 2026-05-25 | large | 0 |
| 2026-05-25 | small | 0 |
| 2026-05-25 | medium | 1 |
| 2026-06-01 | large | 1 |
| 2026-06-01 | small | 0 |
| 2026-06-01 | medium | 1 |
| 2026-06-08 | large | 4 |
| 2026-06-08 | small | 1 |
| 2026-06-08 | medium | 3 |
| 2026-06-15 | large | 0 |
| 2026-06-15 | small | 2 |
| 2026-06-15 | medium | 1 |
| 2026-06-22 | large | 2 |
| 2026-06-22 | small | 0 |
| 2026-06-22 | medium | 1 |
| 2026-06-29 | large | 1 |
| 2026-06-29 | small | 0 |
| 2026-06-29 | medium | 0 |
| 2026-07-06 | large | 1 |
| 2026-07-06 | small | 0 |
| 2026-07-06 | medium | 0 |
| 2026-07-13 | large | 0 |
| 2026-07-13 | small | 1 |
| 2026-07-13 | medium | 0 |
| 2026-07-20 | large | 1 |
| 2026-07-20 | small | 0 |
| 2026-07-20 | medium | 0 |
| 2026-07-27 | large | 0 |
| 2026-07-27 | small | 1 |
| 2026-07-27 | medium | 0 |
| 2026-08-03 | large | 1 |
| 2026-08-03 | small | 1 |
| 2026-08-03 | medium | 0 |
| 2026-08-10 | large | 1 |
| 2026-08-10 | small | 2 |
| 2026-08-10 | medium | 0 |
| 2026-08-17 | large | 1 |
| 2026-08-17 | small | 1 |
| 2026-08-17 | medium | 0 |
| 2026-08-24 | large | 1 |
| 2026-08-24 | small | 1 |
| 2026-08-24 | medium | 0 |
| 2026-08-31 | large | 1 |
| 2026-08-31 | small | 0 |
| 2026-08-31 | medium | 1 |
| 2026-09-07 | large | 1 |
| 2026-09-07 | small | 1 |
| 2026-09-07 | medium | 2 |
| 2026-09-14 | large | 3 |
| 2026-09-14 | small | 1 |
| 2026-09-14 | medium | 0 |
| 2026-09-21 | large | 0 |
| 2026-09-21 | small | 2 |
| 2026-09-21 | medium | 0 |
| 2026-09-28 | large | 0 |
| 2026-09-28 | small | 1 |
| 2026-09-28 | medium | 0 |
Figure 51. Repeat and near repeat classification: Protest events over time 106
| period | series | value |
|---|---|---|
| 2026-01-05 | large | 1 |
| 2026-01-05 | small | 1 |
| 2026-01-05 | medium | 1 |
| 2026-01-12 | large | 1 |
| 2026-01-12 | small | 0 |
| 2026-01-12 | medium | 1 |
| 2026-01-19 | large | 1 |
| 2026-01-19 | small | 0 |
| 2026-01-19 | medium | 0 |
| 2026-01-26 | large | 2 |
| 2026-01-26 | small | 2 |
| 2026-01-26 | medium | 1 |
| 2026-02-02 | large | 1 |
| 2026-02-02 | small | 1 |
| 2026-02-02 | medium | 0 |
| 2026-02-09 | large | 0 |
| 2026-02-09 | small | 0 |
| 2026-02-09 | medium | 0 |
| 2026-02-16 | large | 2 |
| 2026-02-16 | small | 0 |
| 2026-02-16 | medium | 0 |
| 2026-02-23 | large | 0 |
| 2026-02-23 | small | 2 |
| 2026-02-23 | medium | 2 |
| 2026-03-02 | large | 2 |
| 2026-03-02 | small | 1 |
| 2026-03-02 | medium | 3 |
| 2026-03-09 | large | 0 |
| 2026-03-09 | small | 1 |
| 2026-03-09 | medium | 0 |
| 2026-03-16 | large | 0 |
| 2026-03-16 | small | 0 |
| 2026-03-16 | medium | 0 |
| 2026-03-23 | large | 0 |
| 2026-03-23 | small | 0 |
| 2026-03-23 | medium | 0 |
| 2026-03-30 | large | 1 |
| 2026-03-30 | small | 0 |
| 2026-03-30 | medium | 1 |
| 2026-04-06 | large | 1 |
| 2026-04-06 | small | 0 |
| 2026-04-06 | medium | 0 |
| 2026-04-13 | large | 0 |
| 2026-04-13 | small | 0 |
| 2026-04-13 | medium | 0 |
| 2026-04-20 | large | 0 |
| 2026-04-20 | small | 1 |
| 2026-04-20 | medium | 0 |
| 2026-04-27 | large | 1 |
| 2026-04-27 | small | 3 |
| 2026-04-27 | medium | 1 |
| 2026-05-04 | large | 0 |
| 2026-05-04 | small | 1 |
| 2026-05-04 | medium | 0 |
| 2026-05-11 | large | 0 |
| 2026-05-11 | small | 0 |
| 2026-05-11 | medium | 0 |
| 2026-05-18 | large | 0 |
| 2026-05-18 | small | 0 |
| 2026-05-18 | medium | 0 |
| 2026-05-25 | large | 0 |
| 2026-05-25 | small | 0 |
| 2026-05-25 | medium | 1 |
| 2026-06-01 | large | 1 |
| 2026-06-01 | small | 0 |
| 2026-06-01 | medium | 1 |
| 2026-06-08 | large | 4 |
| 2026-06-08 | small | 1 |
| 2026-06-08 | medium | 3 |
| 2026-06-15 | large | 0 |
| 2026-06-15 | small | 2 |
| 2026-06-15 | medium | 1 |
| 2026-06-22 | large | 2 |
| 2026-06-22 | small | 0 |
| 2026-06-22 | medium | 1 |
| 2026-06-29 | large | 1 |
| 2026-06-29 | small | 0 |
| 2026-06-29 | medium | 0 |
| 2026-07-06 | large | 1 |
| 2026-07-06 | small | 0 |
| 2026-07-06 | medium | 0 |
| 2026-07-13 | large | 0 |
| 2026-07-13 | small | 1 |
| 2026-07-13 | medium | 0 |
| 2026-07-20 | large | 1 |
| 2026-07-20 | small | 0 |
| 2026-07-20 | medium | 0 |
| 2026-07-27 | large | 0 |
| 2026-07-27 | small | 1 |
| 2026-07-27 | medium | 0 |
| 2026-08-03 | large | 1 |
| 2026-08-03 | small | 1 |
| 2026-08-03 | medium | 0 |
| 2026-08-10 | large | 1 |
| 2026-08-10 | small | 2 |
| 2026-08-10 | medium | 0 |
| 2026-08-17 | large | 1 |
| 2026-08-17 | small | 1 |
| 2026-08-17 | medium | 0 |
| 2026-08-24 | large | 1 |
| 2026-08-24 | small | 1 |
| 2026-08-24 | medium | 0 |
| 2026-08-31 | large | 1 |
| 2026-08-31 | small | 0 |
| 2026-08-31 | medium | 1 |
| 2026-09-07 | large | 1 |
| 2026-09-07 | small | 1 |
| 2026-09-07 | medium | 2 |
| 2026-09-14 | large | 3 |
| 2026-09-14 | small | 1 |
| 2026-09-14 | medium | 0 |
| 2026-09-21 | large | 0 |
| 2026-09-21 | small | 2 |
| 2026-09-21 | medium | 0 |
| 2026-09-28 | large | 0 |
| 2026-09-28 | small | 1 |
| 2026-09-28 | medium | 0 |
GeoBit Large Spatial Model. Findings are labeled Evidenced (computed by a tool), Inferred (a reading or reasoning) or Unverified (no evidence yet).