Sample: Telecom, Medellin: report
Project: Sample: Telecom, Medellin
Goal: Describe the project Sample: Telecom, Medellin: run the analyses that tell the most about its data, draw every result, and write a cited report.
Run: de496ddc-3bd2-4d81-bcc0-e58d35927cfd (running, 19 agent run(s))
Generated: 2026-10-19T04:49:11Z, version 1
Model cost: USD 0.0000 over 0 model call(s)
Data used
| Data | Kind | Rows | Time span | Summary | Source |
|---|---|---|---|---|---|
| Neighborhoods | vector, Polygon | 16 | 16 polygon (area) features; 'population' 27,852 to 74,163 (mean 4.98e+04); 'subscribers' 7,873 to 29,047 (mean 1.72e+04); named by 'name' (e.g. Barrio Norte, Las Flores, El Molino); total area 72.05 km2; extent -75.6219,6.2080 to -75.5405,6.2804. Areas (Neighborhoods) with population to compare and map. | 329 | |
| Towers | vector, Point | 14 | 14 point features; 'technology' has 2 values (top: 4G/5G 7, 4G 7); 'height_m' 25 to 40 (mean 33.93); 'ground_m' 1490 to 2270 (mean 1768); 'sectors' 3 to 3 (mean 3); named by 'name' (e.g. Tower 01 La Estacion, Tower 02 La Ribera, Tower 03 La Fuente); extent -75.6097,6.2153 to -75.5641,6.2746. Point locations of Towers by technology. | 330 | |
| Dropped calls | vector, Point | 1,800 | 2026-08-03 to 2026-09-27 | 1,800 point features; dated by 'occurred_at' from 2026-08-03 to 2026-09-27; 'cause' has 4 values (top: coverage 646, handover 617, congestion 341); 'technology' has 3 values (top: 4G 895, 5G 455, 3G 450); 'signal_dbm' -128.6 to -73 (mean -103.4); extent -75.6212,6.2088 to -75.5413,6.2798. Dated point events by cause: where and when Dropped calls happen. | 2 |
| Coverage complaints | vector, Point | 420 | 2026-03-01 to 2026-09-30 | 420 point features; dated by 'date' from 2026-03-01 to 2026-09-30; 'issue' has 3 values (top: slow data 154, calls drop 140, no signal indoors 126); 'plan' has 3 values (top: prepaid 147, postpaid 137, business 136); extent -75.6212,6.2087 to -75.5421,6.2796. Dated point events by issue: where and when Coverage complaints happen. | 3 |
| Fiber routes | vector, LineString | 19 | 19 line features; 'owner' has 2 values (top: leased 13, own 6); 'fibres' 24 to 96 (mean 72); total length 61.98 km; extent -75.6097,6.2153 to -75.5641,6.2746. Lines (Fiber routes) such as routes or networks. | 331 | |
| Small cells | vector, Point | 40 | 40 point features; 'status' has 2 values (top: planned 30, live 10); 'band' has 2 values (top: n78 21, B7 19); extent -75.6198,6.2095 to -75.5410,6.2782. Point locations of Small cells by status. | 332 | |
| Valley terrain model (DEM) | raster | 1-band float32 raster (dem), 300 x 267 cells; resolution 30; band 1 1475 to 2759; extent -75.6219,6.2079 to -75.5405,6.2804. An elevation surface for terrain analysis. | 333 | ||
| Cell KPIs by day | table | 784 | 2026-08-03 to 2026-09-27 | Table of 784 rows and 5 columns without geometry; dated by 'date' from 2026-08-03 to 2026-09-27; 'traffic_gb' 429.6 to 2612 (mean 1036); 'drop_rate_pct' 0.1 to 3.81 (mean 1.437); 'availability_pct' 98.43 to 100 (mean 99.57). A table of Cell KPIs by day without locations. | 4 |
| Site leases | table | 14 | Table of 14 rows and 4 columns without geometry; 'landlord_type' has 4 values (top: private 5, municipal 4, church 3); 'lease_end_year' 2,027 to 2,033 (mean 2030); 'monthly_rent_cop' 2,362,560 to 5,612,144 (mean 3,912,966). A table of Site leases without locations. | 334 | |
| Network performance review | document | 1-page md document 'Network performance review, August and September 2026'; language en; mentions 7 place(s): Los Olivos (1), 6.24785, -75.55517 (1), Tower 03 La Fuente (1), Tower (1), Tower 13 Los Pinos (1). A document about Los Olivos, 6.24785, -75.55517, Tower 03 La Fuente; it names event terms congestion, coverage, live. | 335 | ||
| Sample: Telecom, Medellin | record | 336 | |||
| Terrain: Hillshade | layer | 0 | 97 | ||
| Terrain: Elevation (m) | layer | 0 | 23 | ||
| Terrain: Contours (100 m) | layer, LineString | 24 | 100 | ||
| Terrain: Dominant heights | layer, Point | 5 | 22 | ||
| Terrain: Slope (degrees) | layer | 0 | 99 | ||
| Terrain: Aspect (degrees from north) | layer | 0 | 98 | ||
| Terrain: Landforms (geomorphons) | layer | 0 | 93 | ||
| Terrain: Flow accumulation (upstream cells) | layer | 0 | 87 | ||
| Terrain: Watershed boundaries | layer, Polygon | 3 | 82 | ||
| Terrain: Flood-prone areas | layer, Polygon | 2 | 77 | ||
| Terrain: Streams (Strahler order) | layer, LineString | 9 | 85 | ||
| Terrain: MCOO going classes | layer | 0 | 67 | ||
| Terrain: Mobility corridors | layer, Polygon | 2 | 65 | ||
| Terrain: Avenues of approach | layer, LineString | 3 | 62 | ||
| Terrain: Corridor constrictions | layer, Point | 3 | 63 | ||
| Terrain heights: Visible area | layer, Polygon | 5 | 59 | ||
| Terrain: Open flat ground | layer, Polygon | 9 | 89 | ||
| Terrain: Key terrain candidates | layer, Point | 2 | 64 | ||
| Terrain: Total curvature | layer | 0 | 96 | ||
| Terrain: Terrain ruggedness (m) | layer | 0 | 95 | ||
| Terrain: Topographic position (m) | layer | 0 | 94 | ||
| Terrain: Ravines | layer, LineString | 5 | 92 | ||
| Terrain: Ridges | layer, LineString | 36 | 91 | ||
| Terrain: Observation points | layer, Point | 2 | 90 | ||
| Terrain: Terrain masking (cover) | layer, Polygon | 5 | 88 | ||
| Terrain: Flow direction (D8) | layer | 0 | 86 | ||
| Terrain: Pour points | layer, Point | 3 | 84 | ||
| Terrain: Watersheds | layer | 0 | 83 | ||
| Terrain: Pour points (snapped) | layer, Point | 3 | 81 | ||
| Slope (degrees) | layer | 0 | 179 | ||
| Hot spot analysis: Coverage complaints | layer, Polygon | 305 | 337 | ||
| Terrain: Streams (Strahler order) | layer, LineString | 9 | 78 | ||
| Terrain dismounted: Obstacles | layer, Polygon | 1 | 74 | ||
| Terrain wheeled: Obstacles | layer, Polygon | 10 | 71 | ||
| Terrain tracked: Obstacles | layer, Polygon | 1 | 68 | ||
| Terrain: Obstacles | layer, Polygon | 1 | 66 | ||
| Terrain DH-1 DH-2: Sightline | layer, LineString | 1 | 57 | ||
| Terrain DH-1 DH-3: Sightline | layer, LineString | 1 | 56 | ||
| Terrain heights: Observers | layer, Point | 5 | 58 | ||
| Terrain DH-1 DH-3: Ground visible from the observer | layer, LineString | 3 | 55 | ||
| Terrain DH-2 DH-3: Sightline | layer, LineString | 1 | 54 | ||
| Terrain axis: Least-cost routes | layer, LineString | 1 | 53 | ||
| Terrain: Best buildability areas | layer, Polygon | 88 | 37 | ||
| Terrain summits: Least-cost routes | layer, LineString | 1 | 52 | ||
| Terrain axis: Profile line | layer, LineString | 1 | 51 | ||
| Terrain: Height above the nearest stream (m) | layer | 0 | 80 | ||
| Terrain: Best mineability areas | layer, Polygon | 15 | 32 | ||
| Terrain summits: Profile line | layer, LineString | 1 | 50 | ||
| Terrain: Landing zone candidates | layer, Point | 6 | 29 | ||
| Terrain: Flood-prone ground (within 3 m of the stream) | layer | 0 | 79 | ||
| Terrain: Landing points | layer, Polygon | 6 | 28 | ||
| Terrain: Visible area | layer, Polygon | 1 | 25 | ||
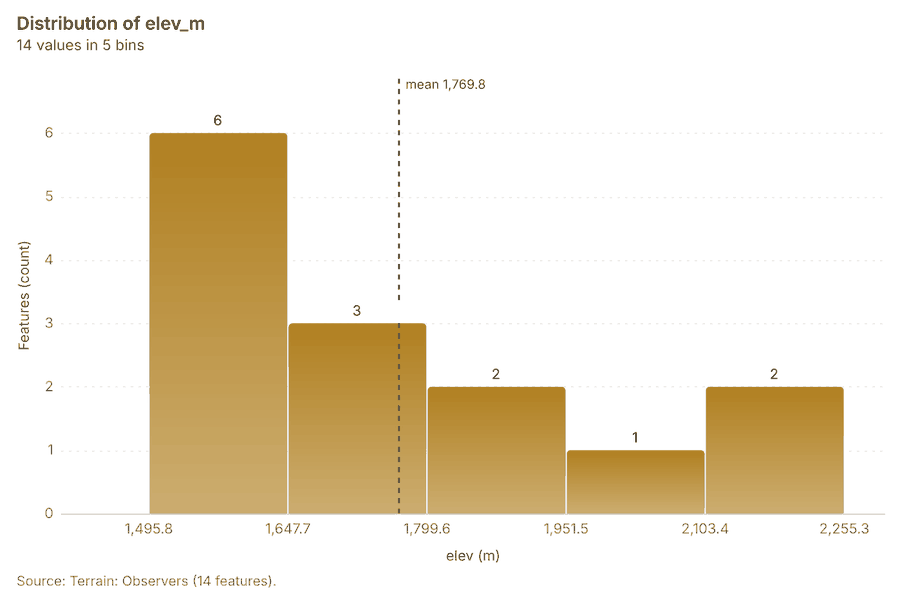
| Terrain: Observers | layer, Point | 14 | 24 | ||
| Terrain dismounted: Going (dismounted) | layer | 0 | 76 | ||
| Terrain: Terrain findings | layer, Point | 9 | 21 | ||
| Terrain dismounted: Off-road speed (km/h) | layer | 0 | 75 | ||
| Terrain wheeled: Going (wheeled) | layer | 0 | 73 | ||
| Terrain wheeled: Off-road speed (km/h) | layer | 0 | 72 | ||
| Terrain tracked: Going (tracked) | layer | 0 | 70 | ||
| Terrain tracked: Off-road speed (km/h) | layer | 0 | 69 | ||
| Terrain heights: Viewshed | layer | 0 | 61 | ||
| Terrain heights: Observers that see each cell | layer | 0 | 60 | ||
| Terrain: Clear-sky insolation (kWh/m2/day) | layer | 0 | 49 | ||
| Terrain: Sky view factor | layer | 0 | 48 | ||
| Terrain: Solar siting class | layer | 0 | 47 | ||
| Terrain: Factor of safety (capped at 100) | layer | 0 | 46 | ||
| Terrain: Stability classes | layer | 0 | 45 | ||
| Terrain: Susceptibility index (0-1) | layer | 0 | 44 | ||
| Terrain: Susceptibility classes | layer | 0 | 43 | ||
| Terrain: Soil loss (t/ha/yr) | layer | 0 | 42 | ||
| Terrain: Erosion risk classes | layer | 0 | 41 | ||
| Terrain: LS factor | layer | 0 | 40 | ||
| Terrain: Buildability score (0-100) | layer | 0 | 39 | ||
| Terrain: Buildability classes | layer | 0 | 38 | ||
| Terrain: Site suitability score (0-100) | layer | 0 | 36 | ||
| Terrain: Site suitability classes | layer | 0 | 35 | ||
| Terrain: Mineability score (0-100) | layer | 0 | 34 | ||
| Terrain: Mineability classes | layer | 0 | 33 | ||
| Terrain: Landing ground | layer | 0 | 31 | ||
| Terrain: Clear ground radius (m) | layer | 0 | 30 | ||
| Terrain: Viewshed | layer | 0 | 27 | ||
| Terrain: Observers that see each cell | layer | 0 | 26 | ||
| Hot spot analysis: Dropped calls | layer, Polygon | 1,798 | 242 | ||
| Hot spot analysis: Small cells | layer, Polygon | 21 | 338 | ||
| Emerging hot spots: Coverage complaints | layer, Polygon | 94 | 339 | ||
| Emerging hot spots: Dropped calls | layer, Polygon | 109 | 340 | ||
| Summarize within: Neighborhoods | layer, Polygon | 16 | 341 | ||
| Summarize within: Neighborhoods | layer, Polygon | 16 | 342 | ||
| Summarize within: Neighborhoods | layer, Polygon | 16 | 236 | ||
| Period change: Dropped calls (week of 2026-08-24 to week of 2026-08-31) | layer, Polygon | 16 | 8 | ||
| Period change: Coverage complaints (week of 2026-08-10 to week of 2026-08-17) | layer, Polygon | 8 | 10 | ||
| Seasonality of Dropped calls | layer, Polygon | 16 | 208 | ||
| Calculate density: Dropped calls | layer, Polygon | 2,034 | 343 | ||
| Calculate density: Coverage complaints | layer, Polygon | 383 | 239 | ||
| Dense areas of coverage complaints | layer, MultiPolygon | 5 | 252 | ||
| Calculate density: Small cells | layer, Polygon | 117 | 344 | ||
| Find point clusters: cluster hulls | layer, Polygon | 2 | 247 | ||
| Find point clusters: Dropped calls | layer, Point | 1,800 | 345 | ||
| Find point clusters: cluster hulls | layer, Polygon | 1 | 346 | ||
| Find point clusters: Coverage complaints | layer, Point | 420 | 347 | ||
| Find outliers: Neighborhoods | layer, Polygon | 16 | 348 | ||
| Change beside the counts per neighborhood | layer, Polygon | 16 | 237 | ||
| Change of dropped calls where density is high | layer, Polygon | 16 | 240 | ||
| Hot cells of dropped calls per neighborhood | layer, Polygon | 16 | 243 | ||
| Nearest tower to each cluster of dropped calls | layer, Polygon | 2 | 248 | ||
| Change of coverage complaints per neighborhood | layer, Polygon | 16 | 254 | ||
| Find point clusters: cluster hulls | layer, Polygon | 3 | 257 | ||
| Clusters of all inputs together: dropped calls and coverage complaints | layer, Point | 2,220 | 258 | ||
| Towers within 250 m of each cluster of dropped calls | layer, Polygon | 2 | 261 |
Timeline
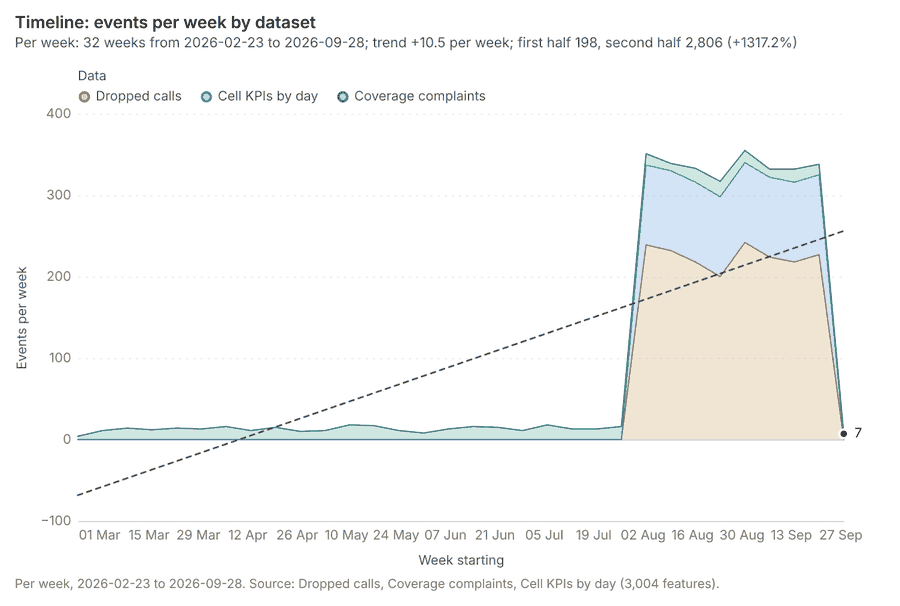
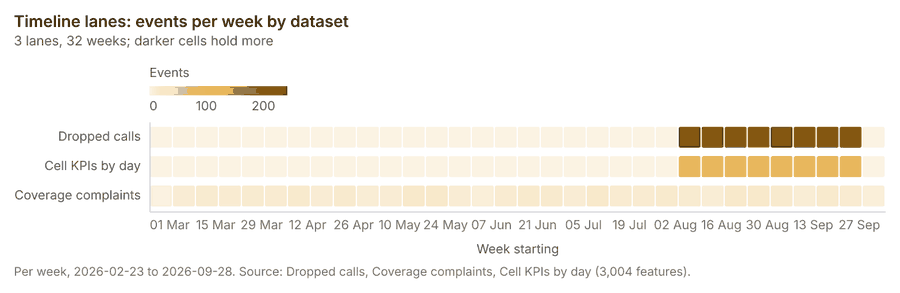
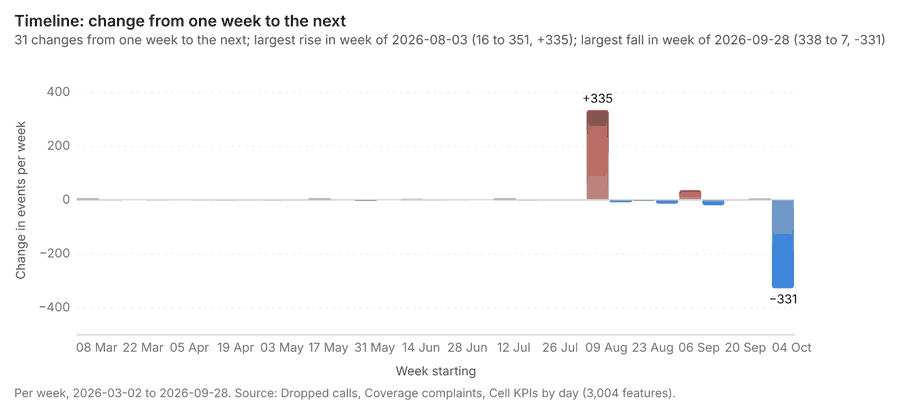
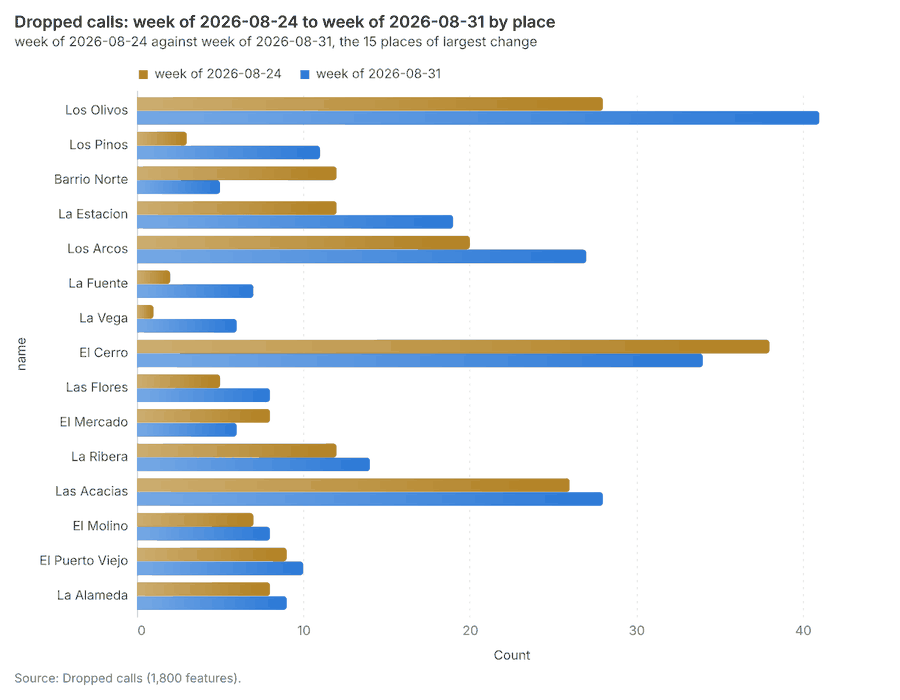
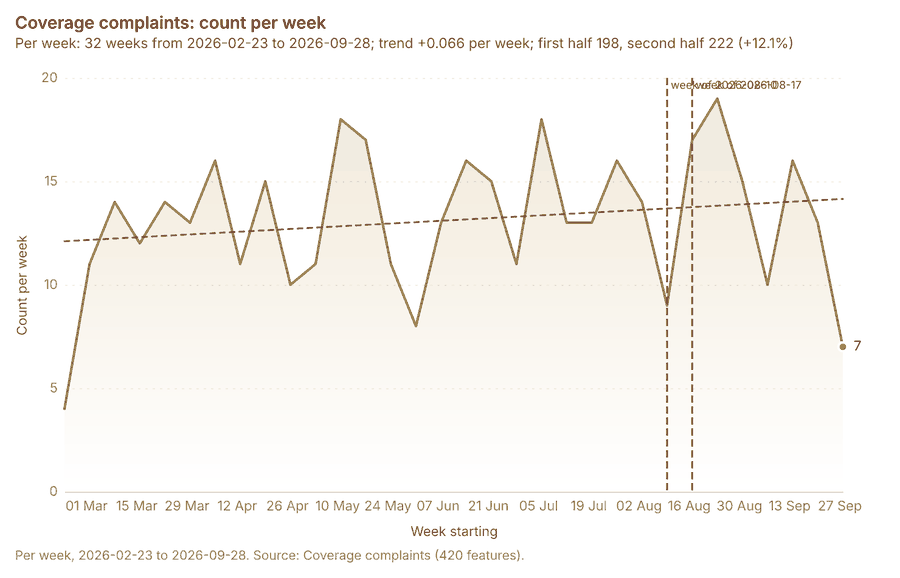
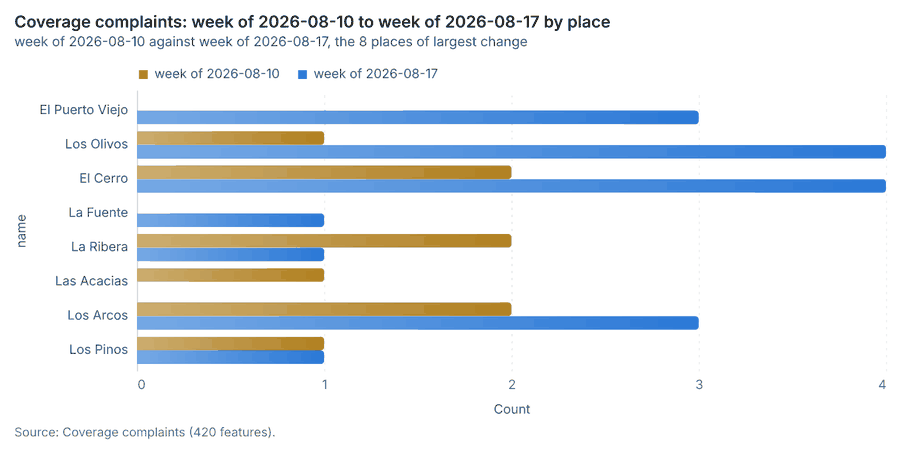
The timeline counts 3,004 dated events in Dropped calls, Coverage complaints, Cell KPIs by day per week, from week of 2026-02-23 to week of 2026-09-28 1234. By dataset: Dropped calls 1,800; Cell KPIs by day 784; Coverage complaints 420 15. The trend is +10.5 events per week; the second half of the weeks has 2,806 against 198 in the first (+1317.2%) 1. Week over week, the largest rise was from week of 2026-07-27 to week of 2026-08-03 (16 to 351, +335) and the largest fall was from week of 2026-09-21 to week of 2026-09-28 (338 to 7, -331) 16. The count rose from 200 in week of 2026-08-24 to 242 in week of 2026-08-31 (+21.0%), within what chance would give (p = 0.051) 78. Between the two, the largest rise was in Los Olivos (28 to 41, +13) and the largest fall in Barrio Norte (12 to 5, -7) 78. The count rose from 9 in week of 2026-08-10 to 17 in week of 2026-08-17 (+88.9%), within what chance would give (p = 0.169) 910. Between the two, the largest rise was in El Puerto Viejo (0 to 3, +3) and the largest fall in La Ribera (2 to 1, -1) 910.
Busiest weeks
Quietest weeks
Overview
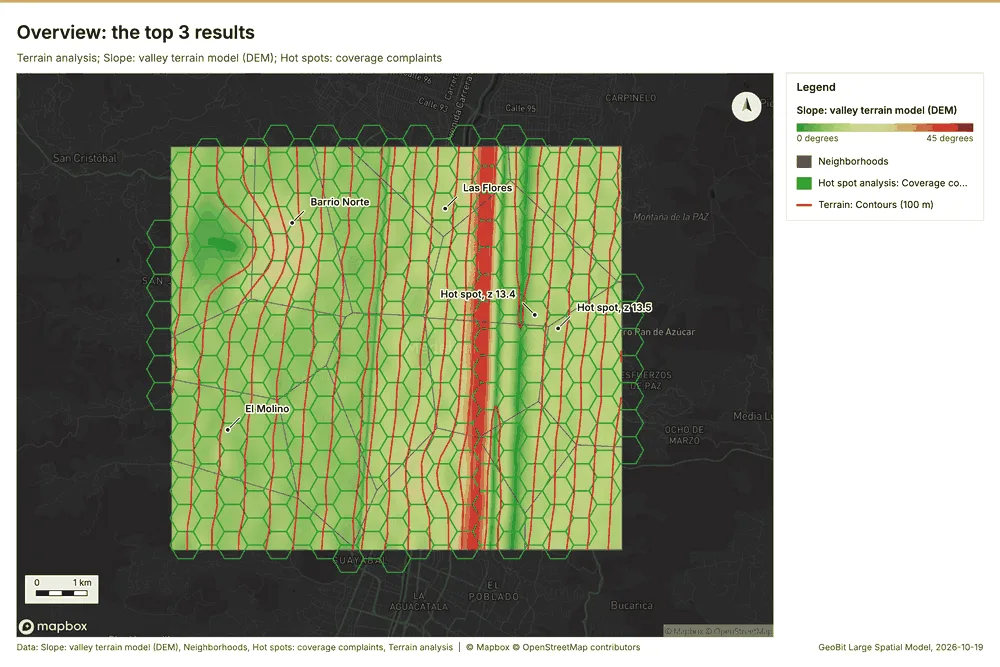
Overview: the top 3 results in the report's order, each in one distinct color, over Neighborhoods as context 11.
Spatial structure
Neighborhoods are 16 areas of 4.503 km2 on average, covering 100 percent of their extent, with no overlap 12. Towers are evenly spread (dispersed) (nearest-neighbor ratio 1.82, z = +5.8; features lie 1.396 km apart on average against 768 m if random) 13. Dropped calls are clustered (nearest-neighbor ratio 0.87, z = -10.7; features lie 85.2 m apart on average against 98.1 m if random) 14. Coverage complaints are clustered (nearest-neighbor ratio 0.87, z = -5.0; features lie 177 m apart on average against 202 m if random) 15. Coverage complaints are dated by 'date' from 2026-03-01 to 2026-09-30 at a week grain 15. Over time the pattern changes: the earlier half is clustered (ratio 0.873) and the later half random (ratio 0.9552); the center moved 305 m 15. Fiber routes form a connected network: 19 lines with 7 junctions and 84 crossings in 1 connected part, 61.98 km in all 16. Small cells are spread at random (nearest-neighbor ratio 1.07, z = +0.8; features lie 686 m apart on average against 643 m if random) 17. 100 percent of Coverage complaints lie inside Neighborhoods (420 of 420) 1215. 100 percent of Dropped calls lie inside Neighborhoods (1800 of 1800) 1214. 100 percent of Fiber routes lie inside Neighborhoods (19 of 19) 1216. 100 percent of Small cells lie inside Neighborhoods (40 of 40) 1217. 100 percent of Towers lie inside Neighborhoods (14 of 14) 1213. Towers lie 0 m from the nearest of Fiber routes (median); 86 percent lie within 100 m 1316. Coverage complaints lie 62.7 m from the nearest of Dropped calls (median); 64 percent lie within 100 m 1415. Small cells lie 91.5 m from the nearest of Dropped calls (median); 52 percent lie within 100 m 1417. Towers lie 134 m from the nearest of Dropped calls (median); 100 percent lie within 500 m 1314. Dropped calls lie 170 m from the nearest of Coverage complaints (median); 94 percent lie within 500 m 1415.
| Result | Value |
|---|---|
| layers profiled | 6 |
| clustered point layers | 2 |
| dispersed point layers | 1 |
| random point layers | 1 |
Findings
- Evidenced: Neighborhoods are 16 areas of 4.503 km2 on average, covering 100 percent of their extent, with no overlap 12.
- Evidenced: Towers are evenly spread (dispersed) (nearest-neighbor ratio 1.82, z = +5.8; features lie 1.396 km apart on average against 768 m if random) 13.
- Evidenced: Dropped calls are clustered (nearest-neighbor ratio 0.87, z = -10.7; features lie 85.2 m apart on average against 98.1 m if random) 14.
- Evidenced: Coverage complaints are clustered (nearest-neighbor ratio 0.87, z = -5.0; features lie 177 m apart on average against 202 m if random) 15.
- Evidenced: Coverage complaints are dated by 'date' from 2026-03-01 to 2026-09-30 at a week grain 15.
- Evidenced: Over time the pattern changes: the earlier half is clustered (ratio 0.873) and the later half random (ratio 0.9552); the center moved 305 m 15.
- Evidenced: Fiber routes form a connected network: 19 lines with 7 junctions and 84 crossings in 1 connected part, 61.98 km in all 16.
- Evidenced: Small cells are spread at random (nearest-neighbor ratio 1.07, z = +0.8; features lie 686 m apart on average against 643 m if random) 17.
- Evidenced: 100 percent of Coverage complaints lie inside Neighborhoods (420 of 420) 1215.
- Evidenced: 100 percent of Dropped calls lie inside Neighborhoods (1800 of 1800) 1214.
- Evidenced: 100 percent of Fiber routes lie inside Neighborhoods (19 of 19) 1216.
- Evidenced: 100 percent of Small cells lie inside Neighborhoods (40 of 40) 1217.
- Evidenced: 100 percent of Towers lie inside Neighborhoods (14 of 14) 1213.
- Evidenced: Towers lie 0 m from the nearest of Fiber routes (median); 86 percent lie within 100 m 1316.
- Evidenced: Coverage complaints lie 62.7 m from the nearest of Dropped calls (median); 64 percent lie within 100 m 1415.
- Evidenced: Small cells lie 91.5 m from the nearest of Dropped calls (median); 52 percent lie within 100 m 1417.
- Evidenced: Towers lie 134 m from the nearest of Dropped calls (median); 100 percent lie within 500 m 1314.
- Evidenced: Dropped calls lie 170 m from the nearest of Coverage complaints (median); 94 percent lie within 500 m 1415.
Terrain analysis
What this analysis is. Terrain analysis: The automatic terrain analysis of an area, with no model call: by default every terrain tool (everything), or a subset (general, mobility, observation, hydrology, site), then the elevation layer, the hypsometric curve, slope distribution, aspect rose and route profiles, the dominant heights, the cited terrain findings (key terrain, chokepoints, corridors, flood-prone ground) and the terrain maps 18. Large areas run coarser with the factor reported 18. In ArcGIS it is No single tool (terrain analysis workflow: Surface Parameters, Viewshed, Hydrology, Distance Accumulation); in QGIS, No single tool (Processing model of GDAL DEM, r.viewshed, r.watershed and r.cost) 18.
Why it was run on this data. Automatic terrain analysis (everything) on the project's DEM Valley terrain model (DEM); observers from the 14 point(s) of Towers: every terrain tool: relief, slope, aspect, hillshade, curvature, roughness, landforms, ravines and ridges, strategic points, hydrology (flow, streams, pour points, watersheds, flood-prone ground), mobility for every mover, the MCOO, viewsheds and lines of sight from th 19.
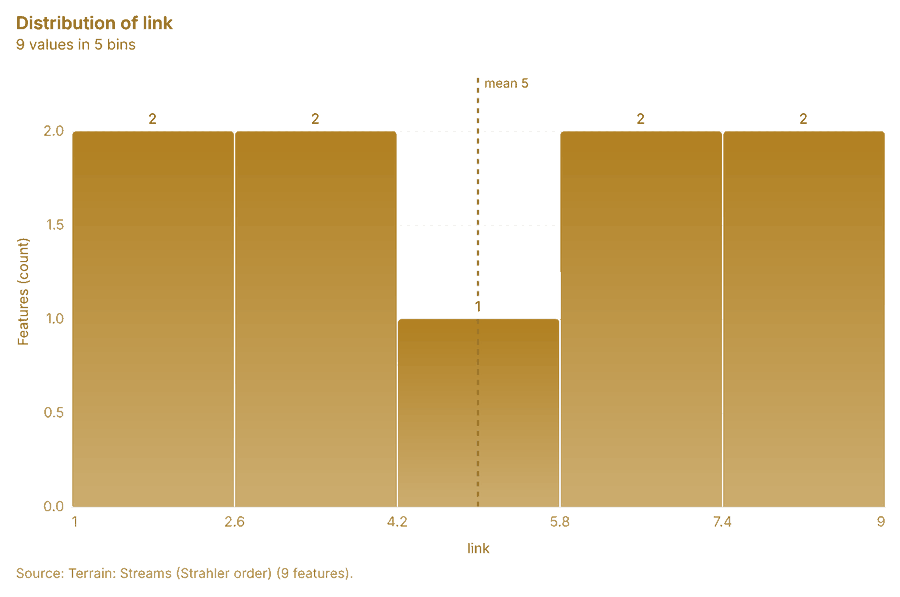
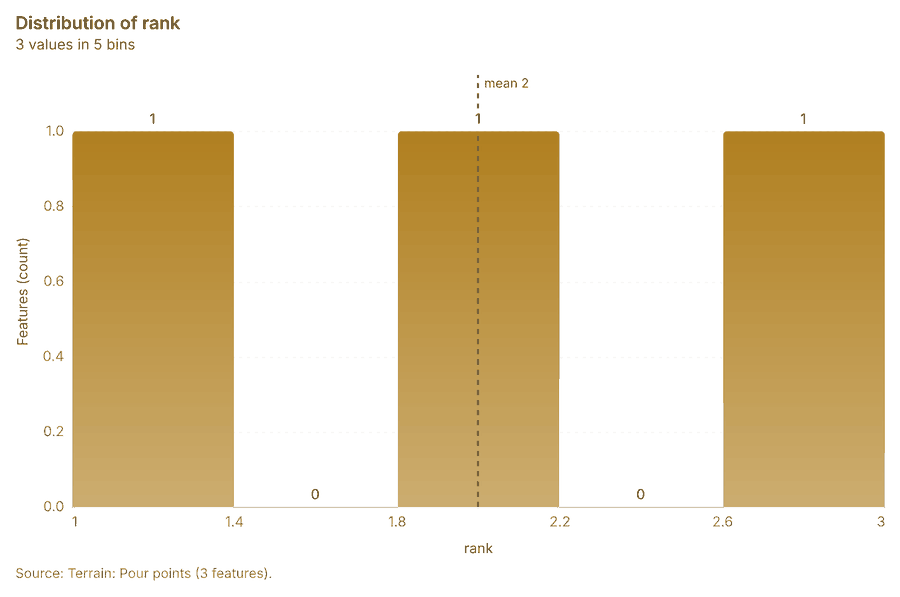
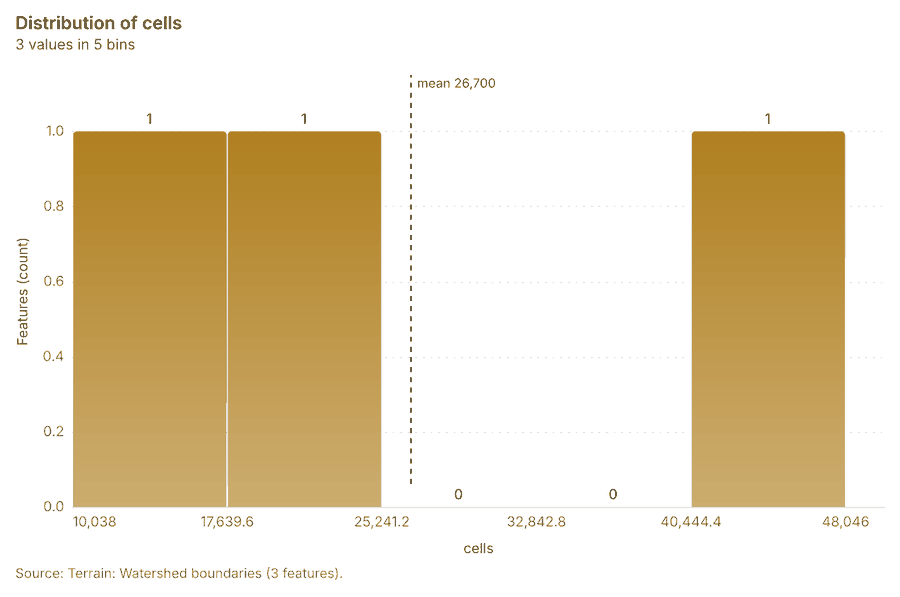
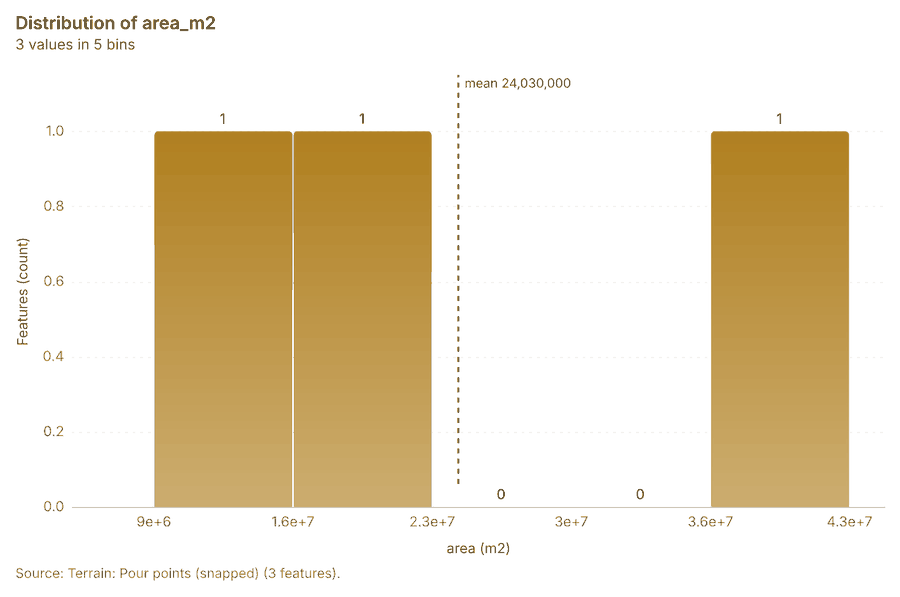
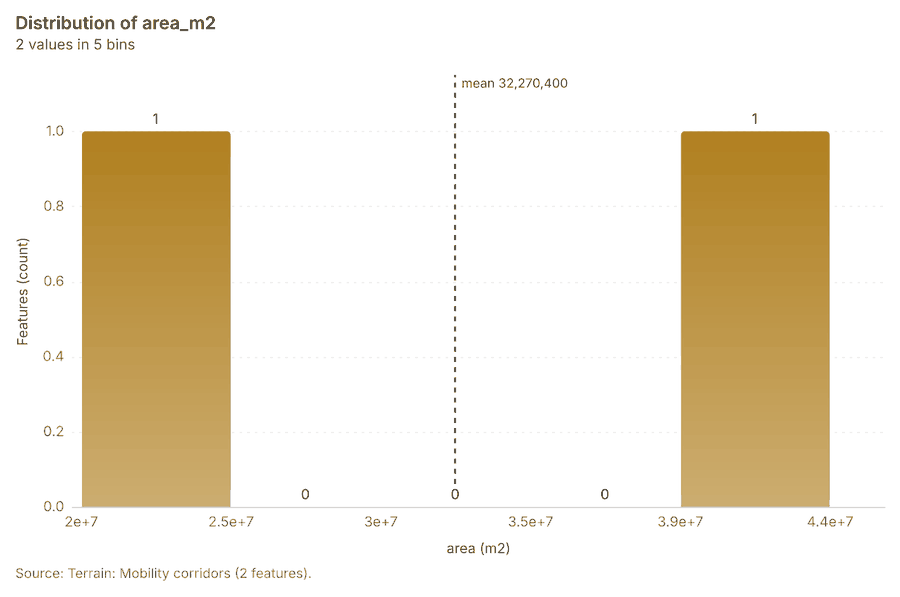
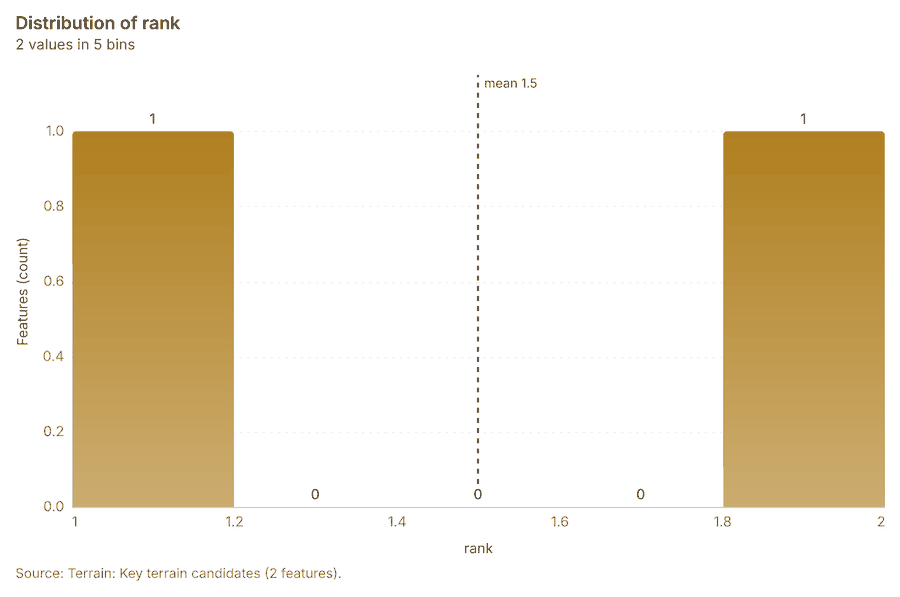
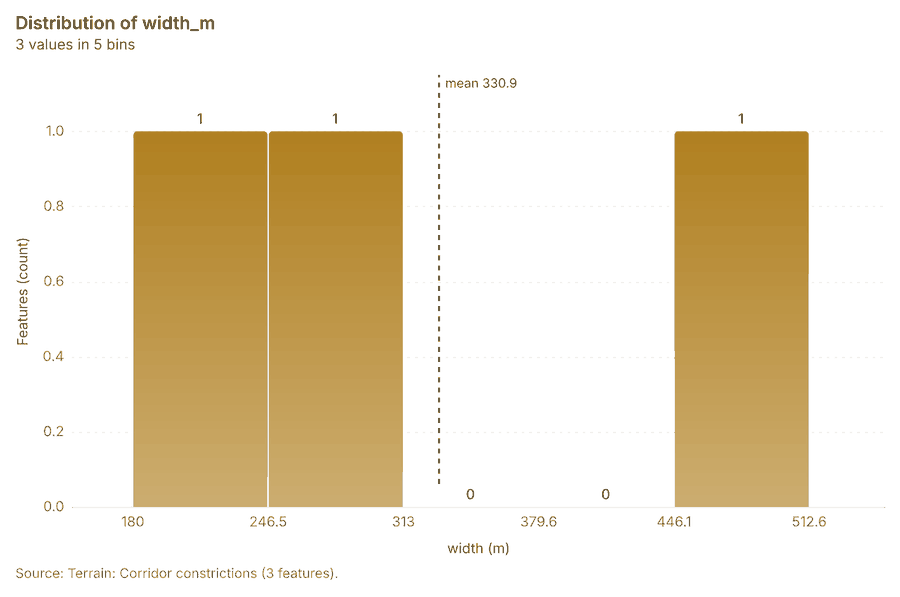
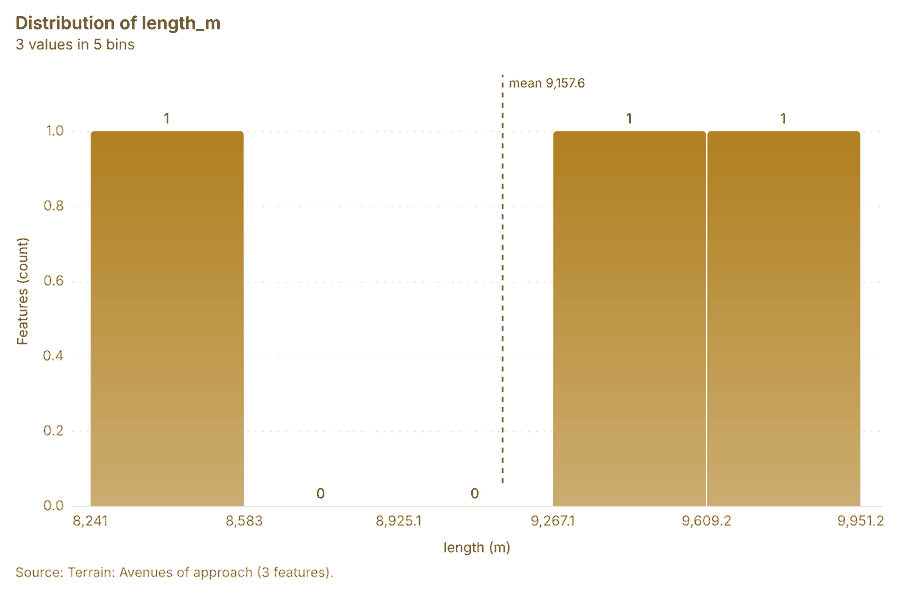
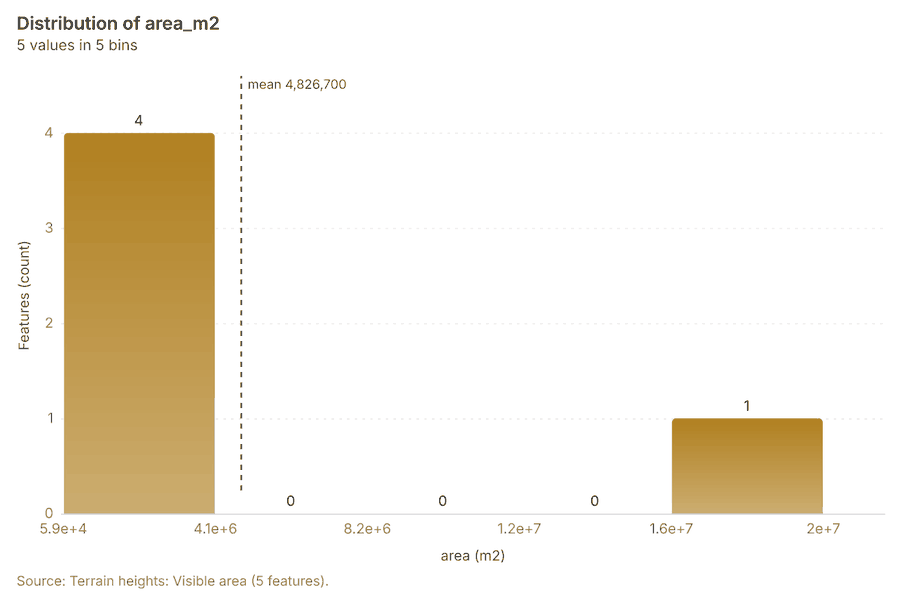
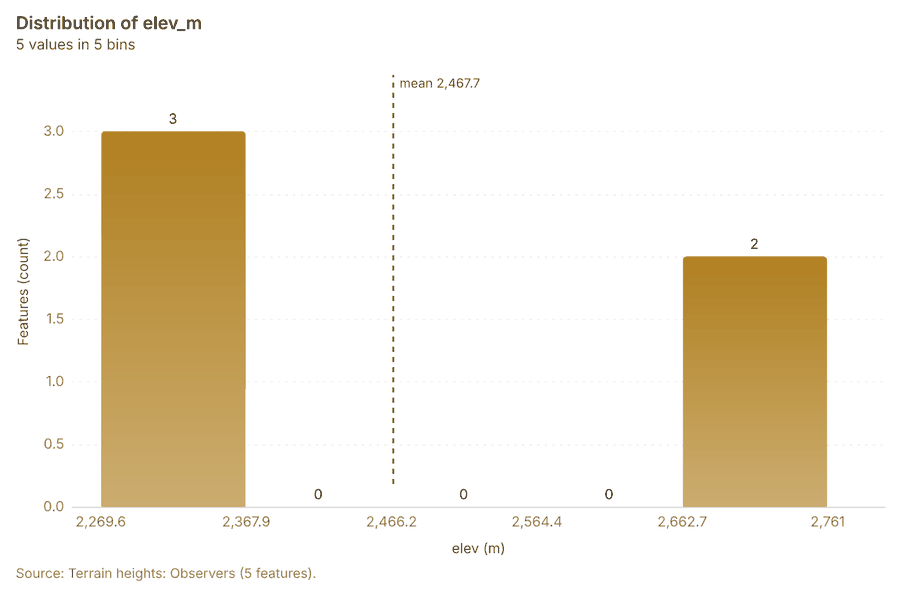
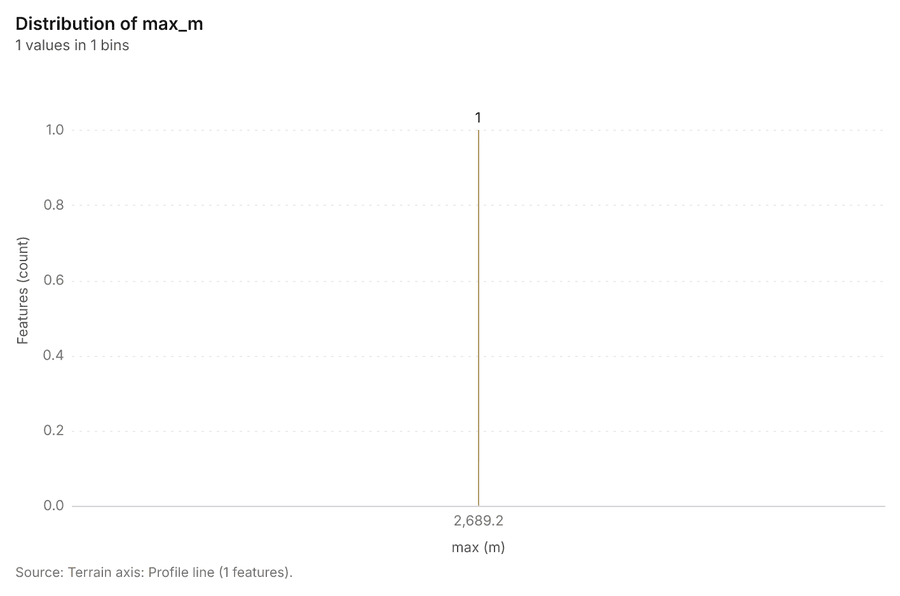
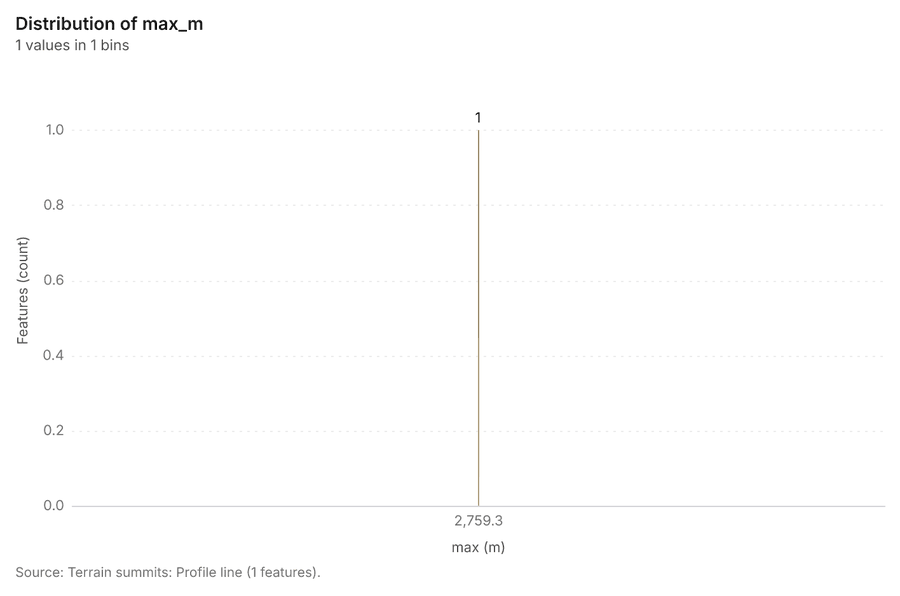
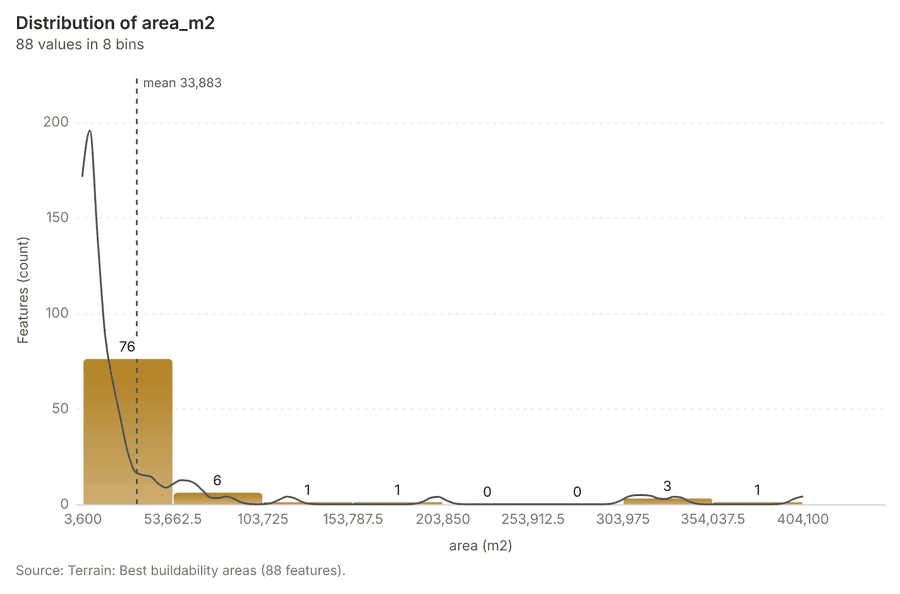
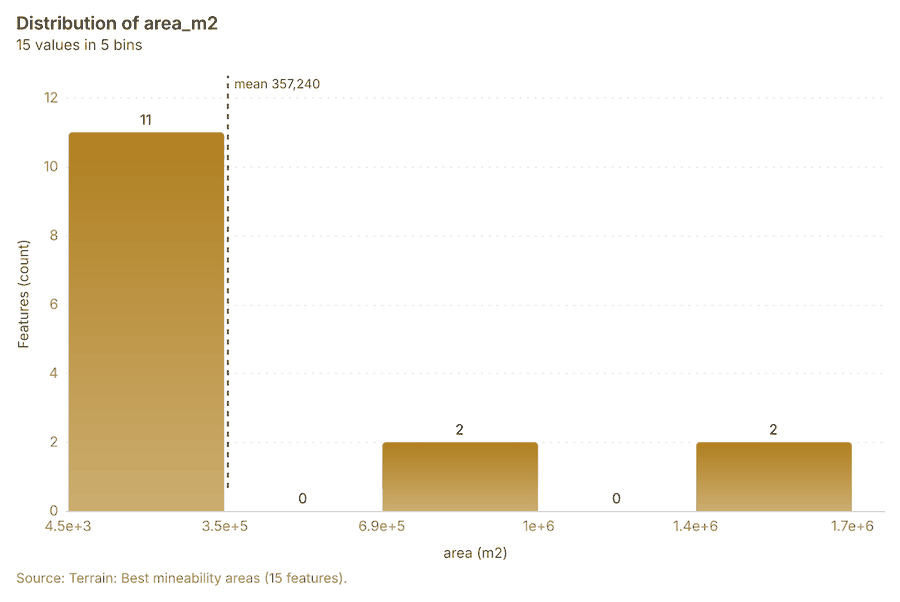
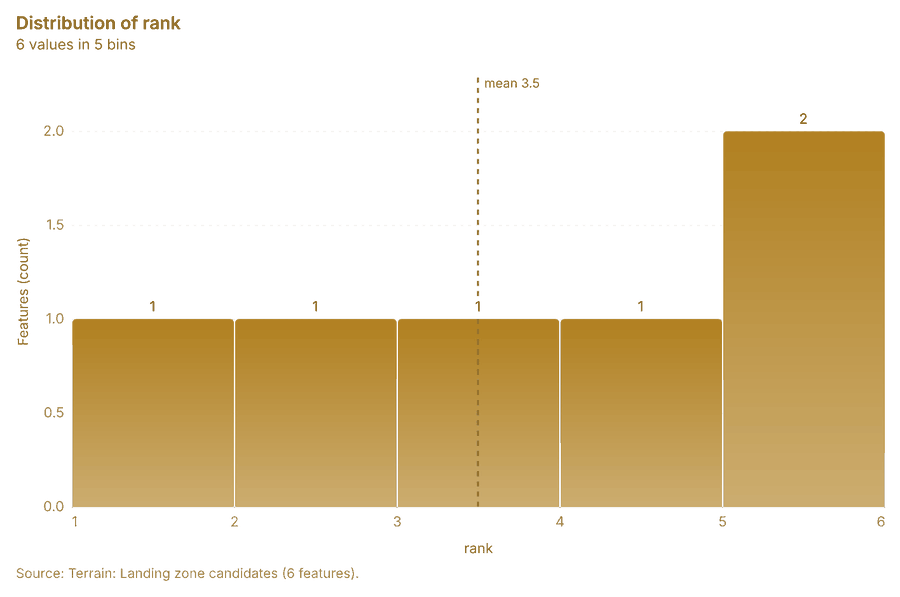
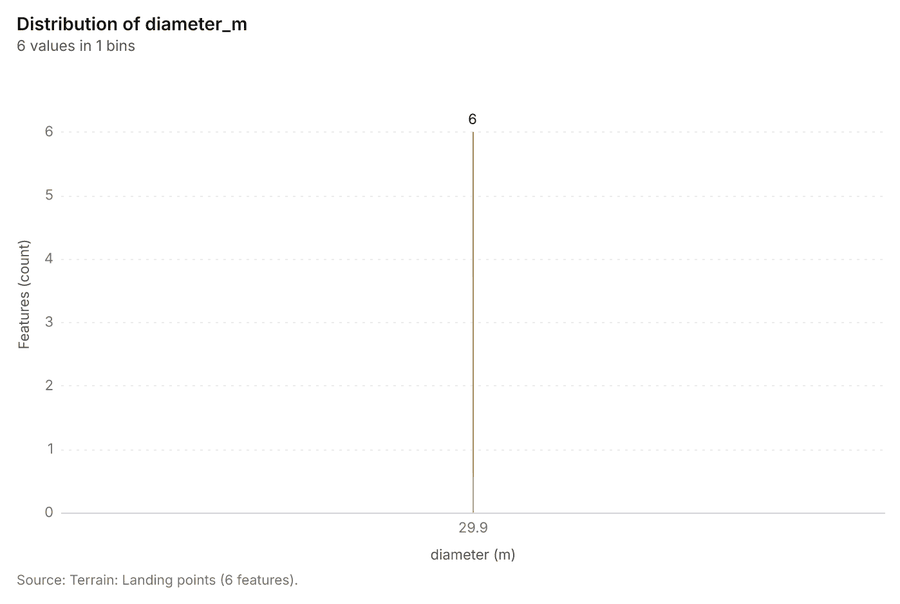
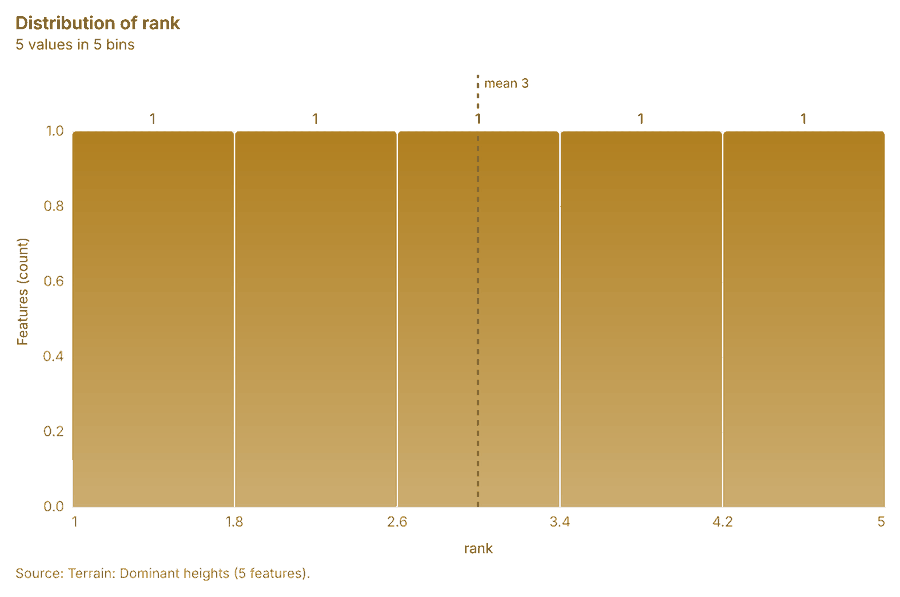
What it found. Terrain analysis produced Terrain: Terrain findings (9 features), Terrain: Dominant heights (5 features), Terrain: Elevation (m) (0 features) 20212223. It reported tokens, usd 0.737; tokens, tokens 737; tokens, tokens in 1; tokens, tokens out 184; numbers, maps 7; numbers, charts 4 20. The chart Hypsometric curve is drawn from 20 rows 131. The chart Slope distribution is drawn from 6 rows 132. The chart Aspect rose is drawn from 8 rows 133. The chart Elevation along the routes is drawn from 320 rows 134. The chart Terrain: Contours (100 m) is drawn from 6 rows 135. The chart Terrain: Ravines is drawn from 5 rows 136. The chart Terrain: Ridges is drawn from 7 rows 137. The chart Terrain: Observation points is drawn from 5 rows 138. The chart Terrain: Open flat ground is drawn from 5 rows 139. The chart Terrain: Terrain masking (cover) is drawn from 5 rows 140. The chart Terrain: Streams (Strahler order) is drawn from 5 rows 141. The chart Terrain: Pour points is drawn from 5 rows 142. The chart Terrain: Watershed boundaries is drawn from 5 rows 143. The chart Terrain: Pour points (snapped) is drawn from 5 rows 144. The chart Terrain: Streams (Strahler order) is drawn from 5 rows 145. The chart Terrain: Flood-prone areas is drawn from 5 rows 146. The chart Terrain dismounted: Obstacles is drawn from 1 rows 147. The chart Terrain wheeled: Obstacles is drawn from 5 rows 148. The chart Terrain tracked: Obstacles is drawn from 1 rows 149. The chart Terrain: Obstacles is drawn from 1 rows 150. The chart Terrain: Mobility corridors is drawn from 5 rows 151. The chart Terrain: Key terrain candidates is drawn from 5 rows 152. The chart Terrain: Corridor constrictions is drawn from 5 rows 153. The chart Terrain: Avenues of approach is drawn from 5 rows 154. The chart Terrain heights: Visible area is drawn from 5 rows 155. The chart Terrain heights: Observers is drawn from 5 rows 156. The chart Terrain DH-1 DH-2: Sightline is drawn from 1 rows 157. The chart Terrain DH-1 DH-3: Sightline is drawn from 1 rows 158. The chart Terrain DH-1 DH-3: Ground visible from the observer is drawn from 5 rows 159. The chart Terrain DH-2 DH-3: Sightline is drawn from 1 rows 160. The chart Terrain axis: Least-cost routes is drawn from 1 rows 161. The chart Terrain summits: Least-cost routes is drawn from 1 rows 162. The chart Terrain axis: Profile line is drawn from 1 rows 163. The chart Terrain summits: Profile line is drawn from 1 rows 164. The chart Terrain: Best buildability areas is drawn from 8 rows 165. The chart Terrain: Best mineability areas is drawn from 5 rows 166. The chart Terrain: Landing zone candidates is drawn from 5 rows 167. The chart Terrain: Landing points is drawn from 1 rows 168. The chart Terrain: Visible area is drawn from 1 rows 169. The chart Terrain: Observers is drawn from 5 rows 170. The chart Terrain: Dominant heights is drawn from 5 rows 171.
| Result | Value |
|---|---|
| tokens, usd | 0.737 |
| tokens, tokens | 737 |
| tokens, tokens in | 1 |
| tokens, tokens out | 184 |
| numbers, maps | 7 |
| numbers, charts | 4 |
| numbers, layers | 80 |
| numbers, area km2 | 72.09 |
| numbers, findings | 55 |
| numbers, flat pct | 0.273 |
| numbers, relief m | 1,284 |
| numbers, corridors | 2 |
| numbers, steps run | 35 |
| numbers, tools run | 28 |
| numbers, chokepoints | 3 |
| numbers, key terrain | 2 |
| numbers, steps failed | 1 |
| numbers, calls skipped | 0 |
| numbers, mean slope deg | 13.16 |
| numbers, elevation max m | 2,759 |
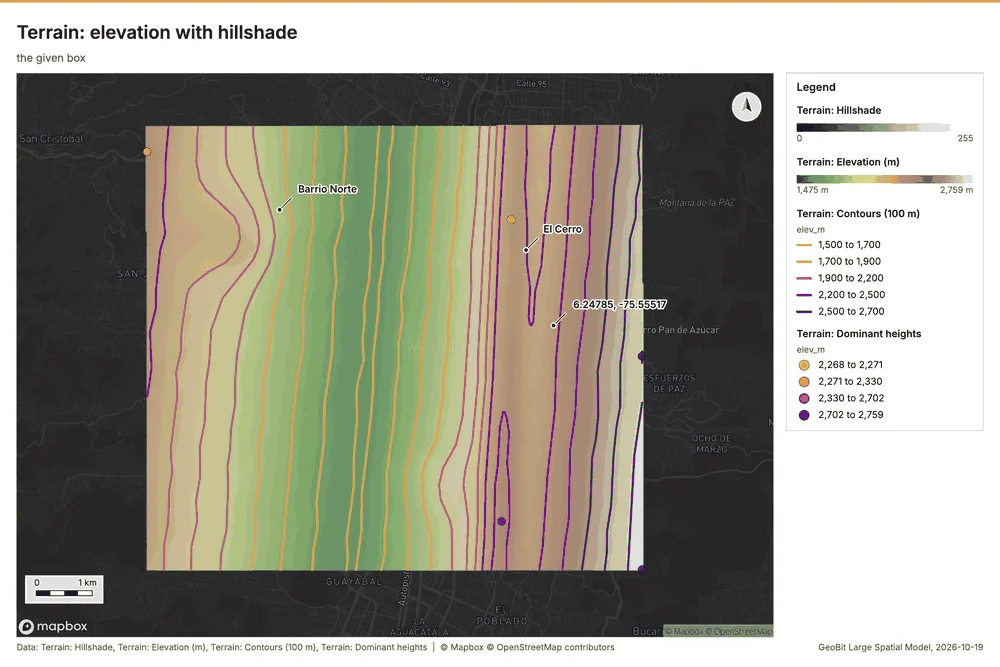
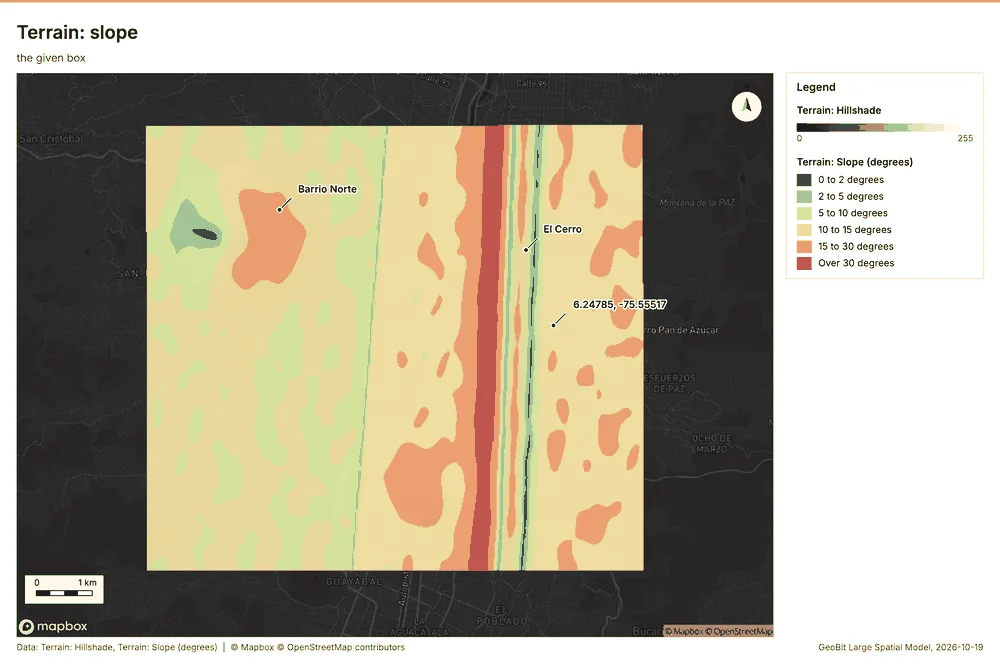
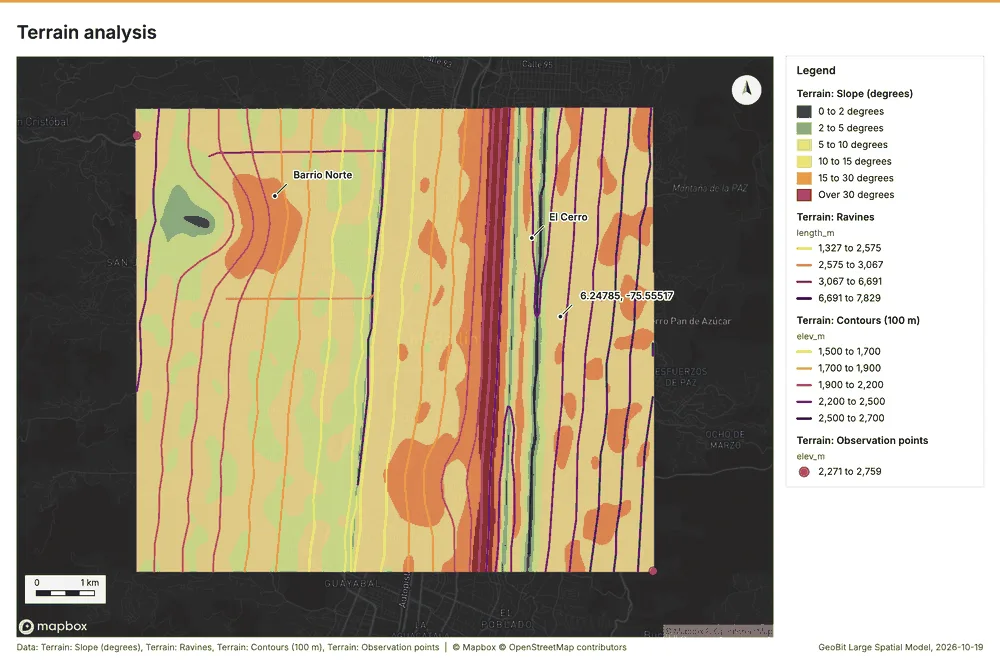
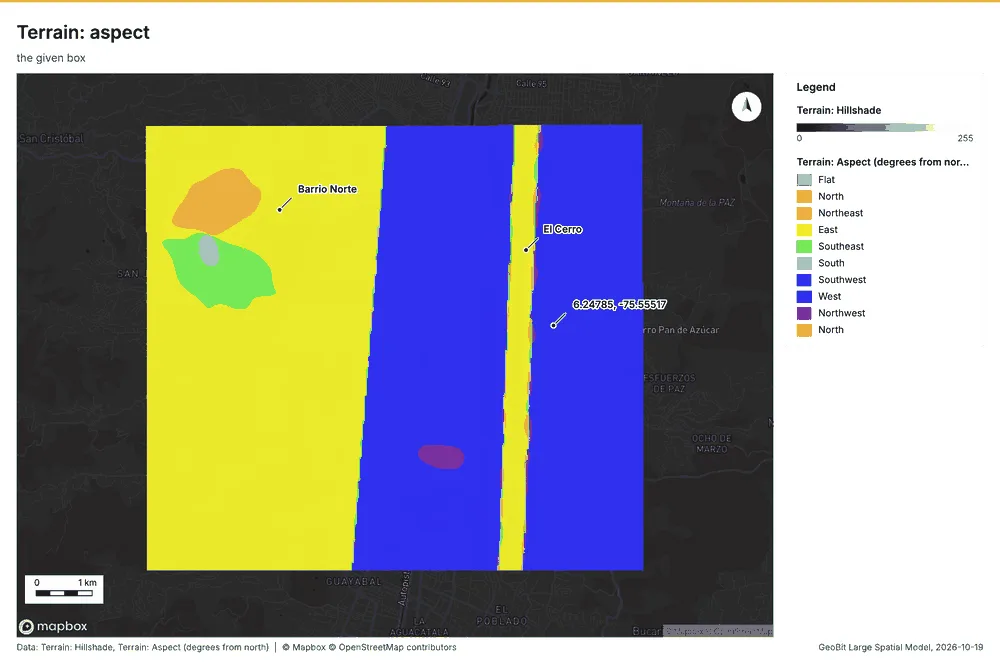
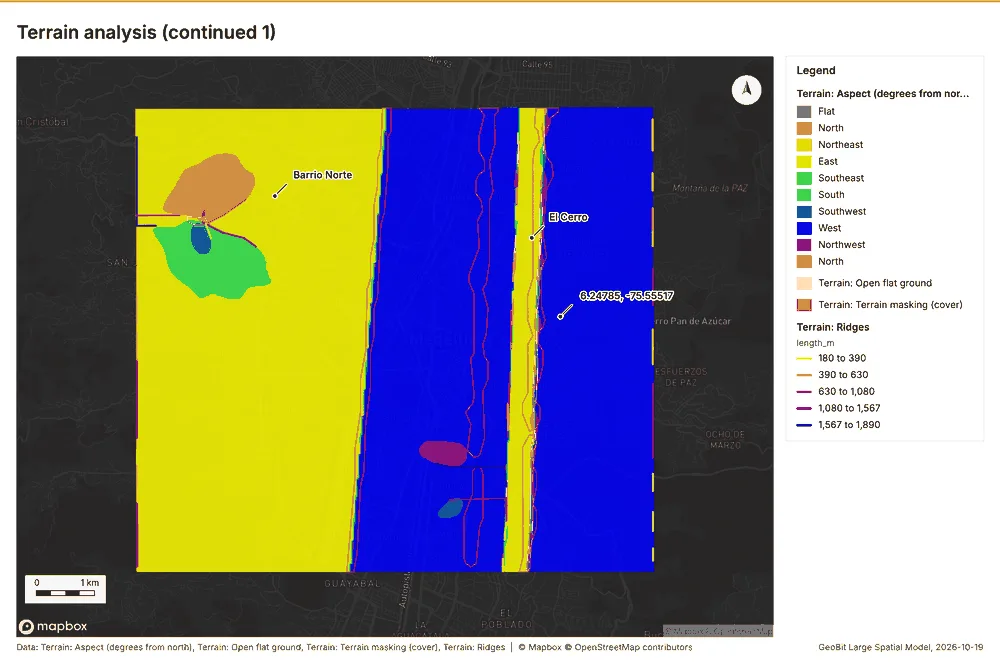
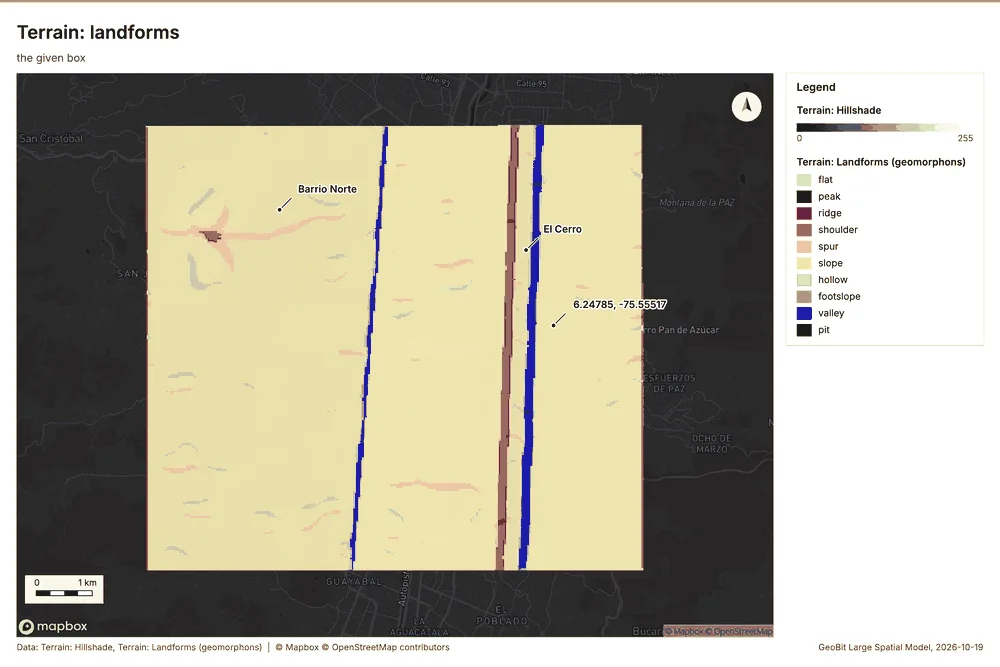
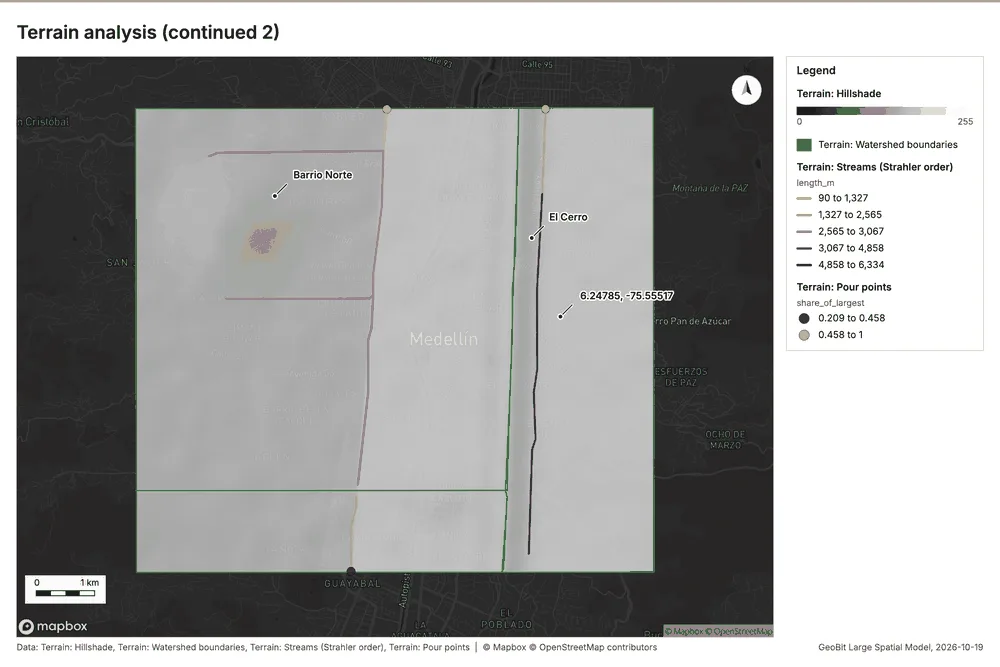
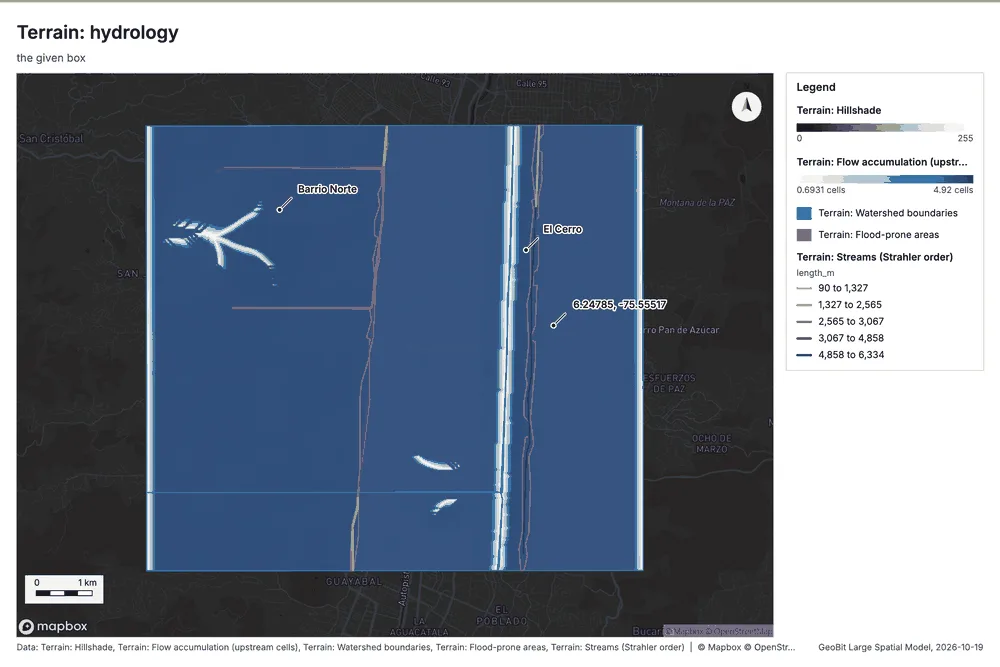
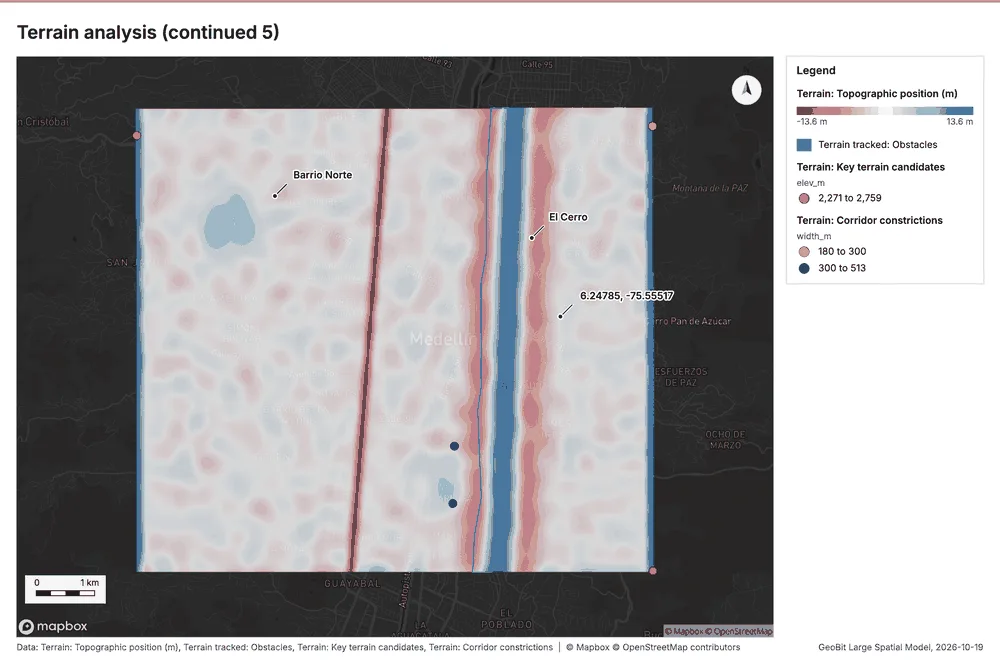
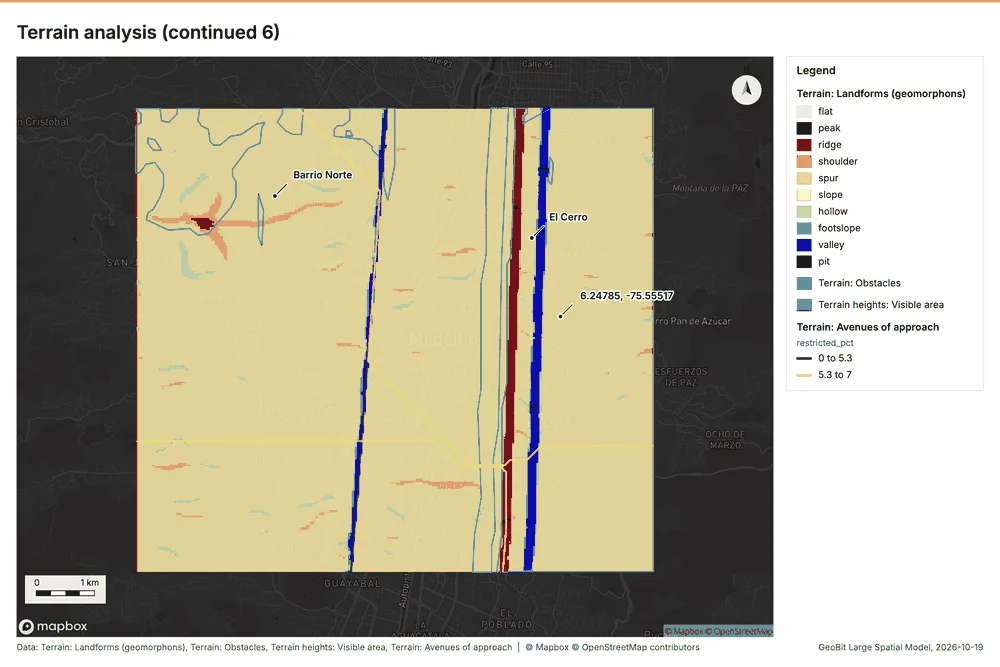
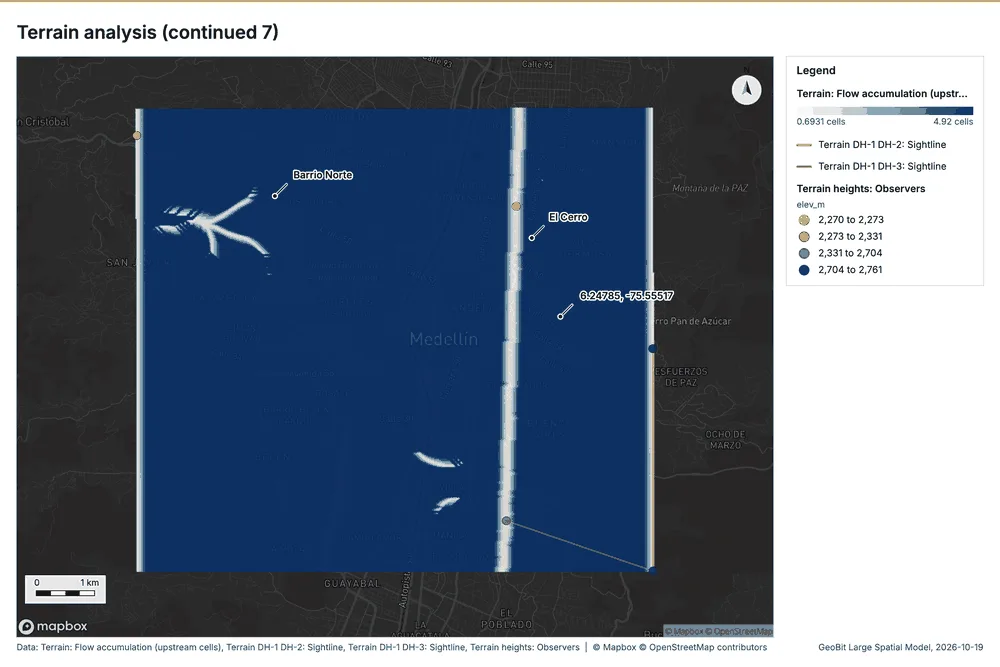
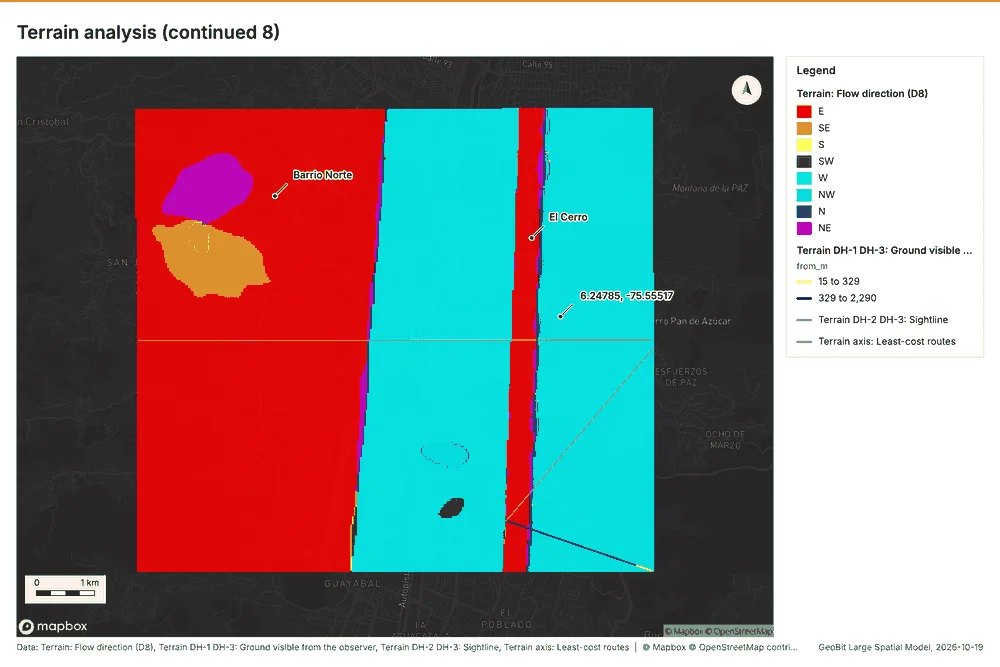
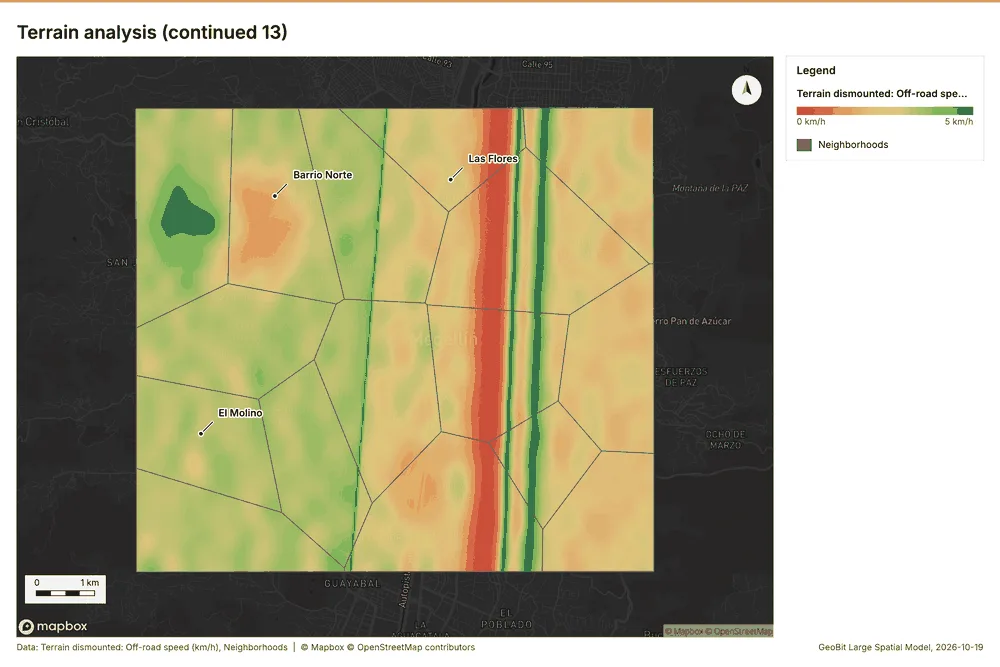
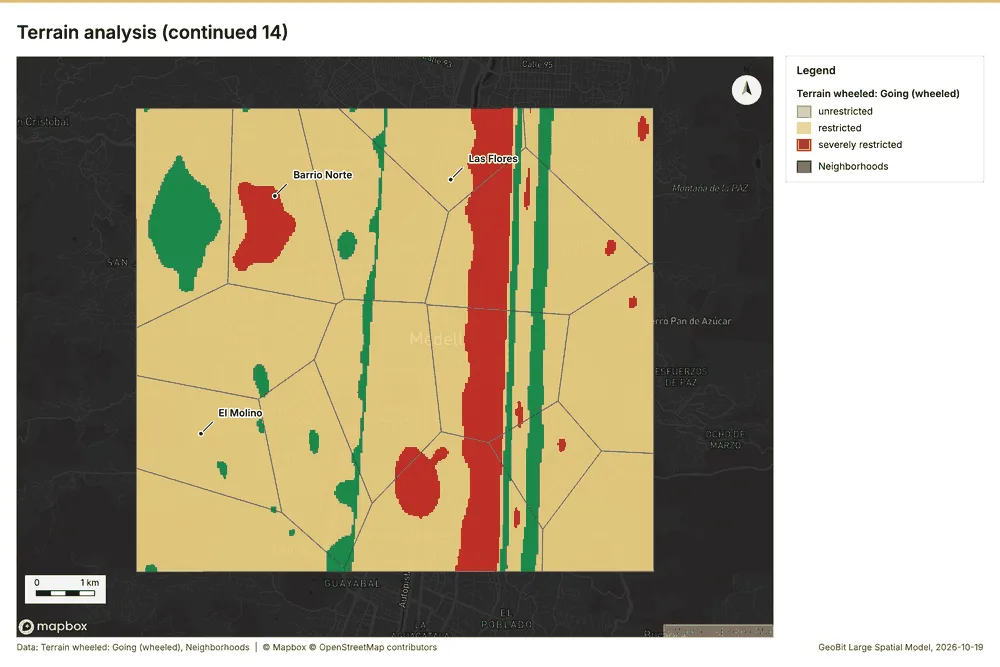
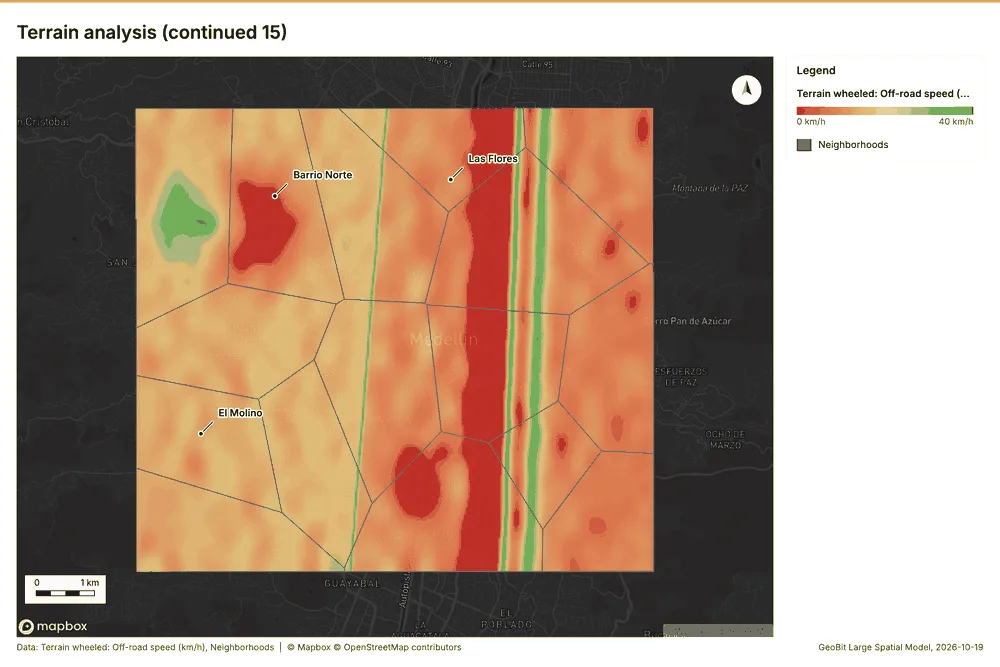
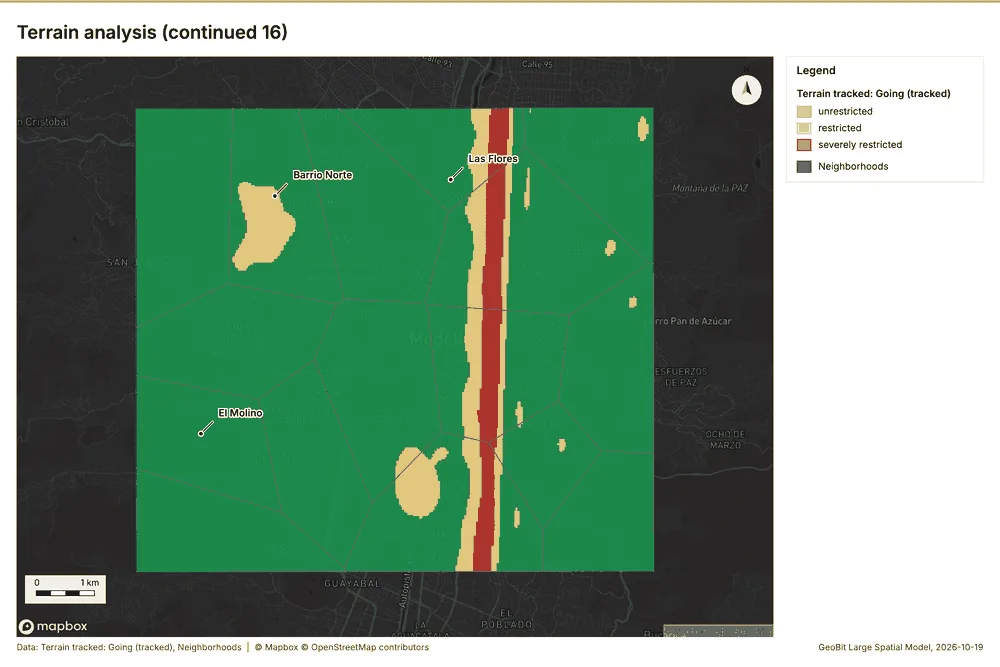
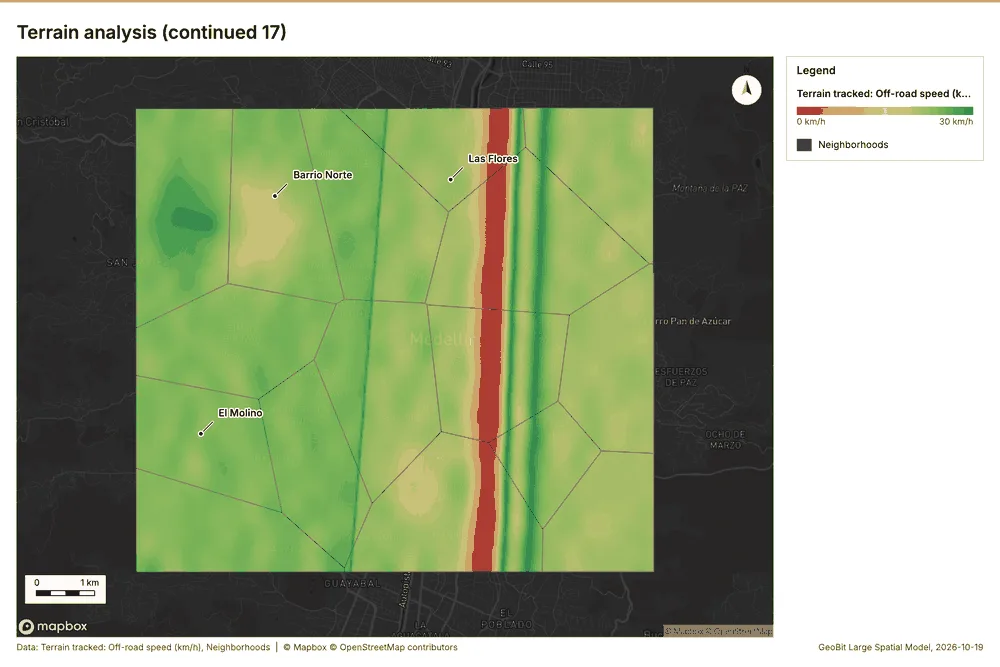
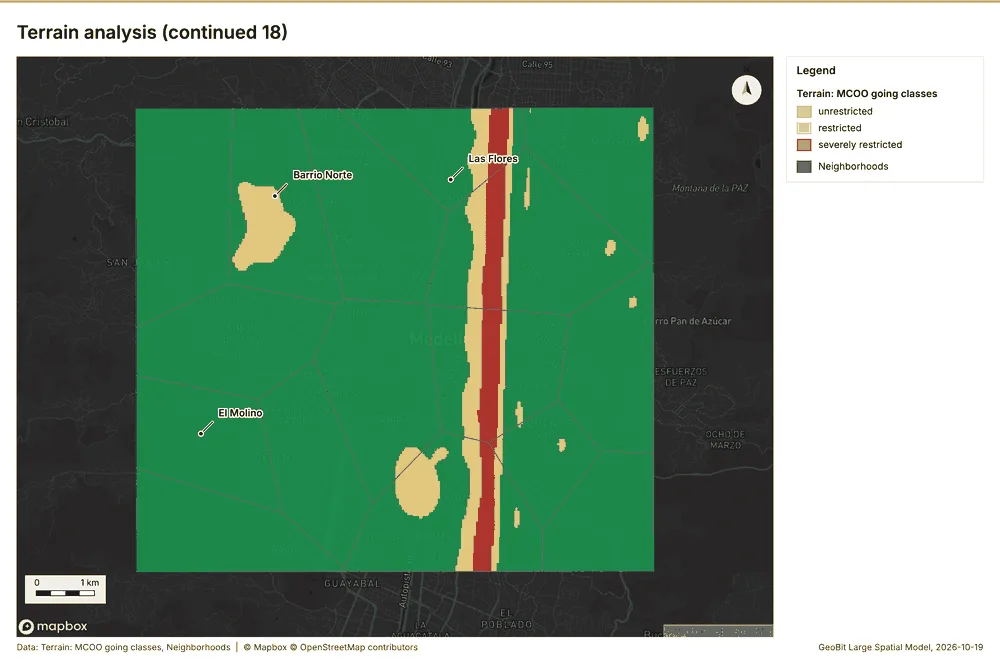
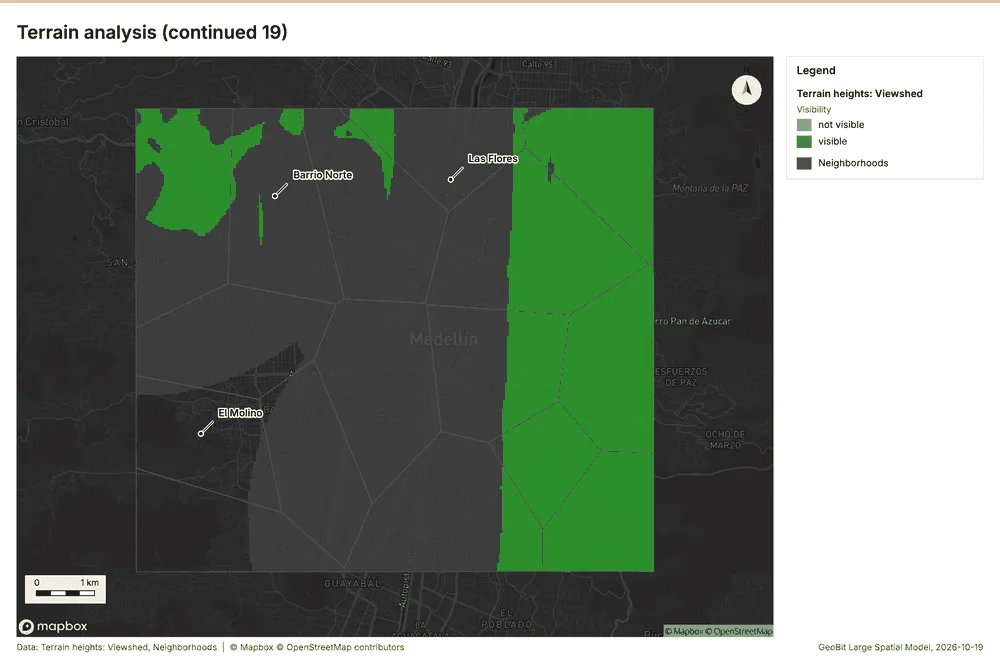
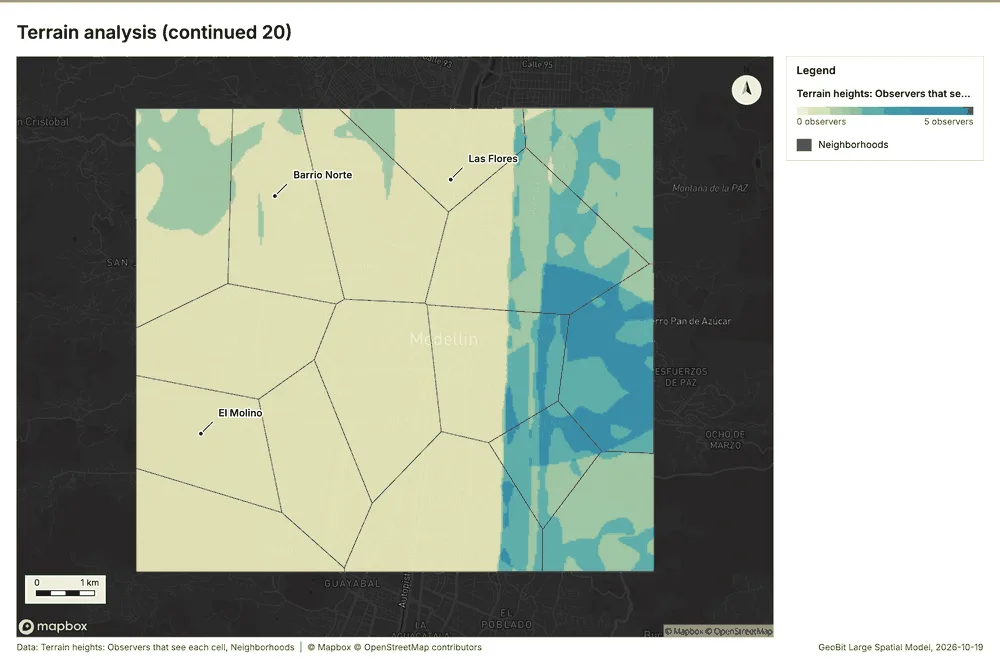
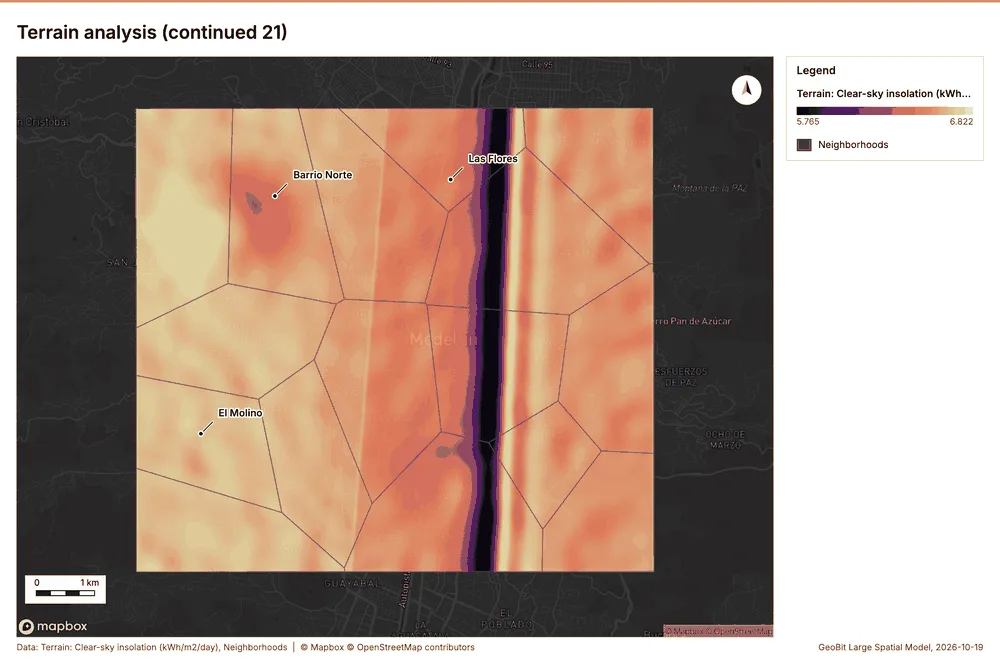
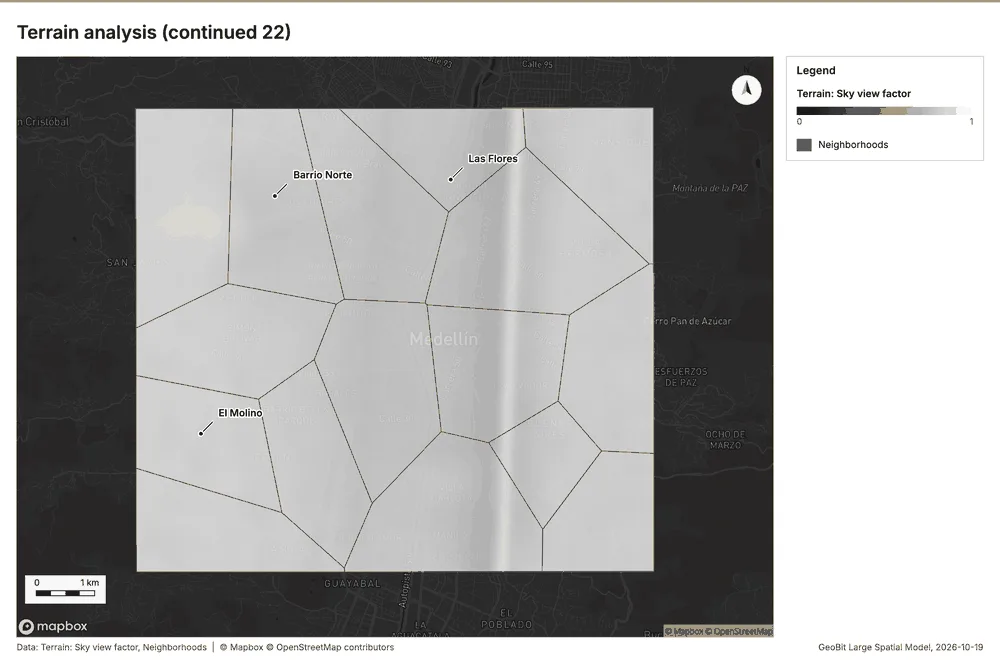
What the map shows. The map shades Terrain: Hillshade on a continuous ramp from 0 to 255 101. The map shades Terrain: Elevation (m) on a continuous ramp from 1,475 m to 2,759 m 101. The map draws Terrain: Contours (100 m) by elev_m in 5 classes: 1,500 to 1,700, 1,700 to 1,900, 1,900 to 2,200, 2,200 to 2,500, 2,500 to 2,700 101. The map draws Terrain: Dominant heights by elev_m in 4 classes: 2,268 to 2,271, 2,271 to 2,330, 2,330 to 2,702, 2,702 to 2,759 101. It draws 29 features 101. It covers longitude -75.643 to -75.519 and latitude 6.197 to 6.289, at about 1:57,116 101.
Findings
- Evidenced: Terrain analysis produced Terrain: Terrain findings (9 features), Terrain: Dominant heights (5 features), Terrain: Elevation (m) (0 features) 20212223.
- Evidenced: It reported tokens, usd 0.737; tokens, tokens 737; tokens, tokens in 1; tokens, tokens out 184; numbers, maps 7; numbers, charts 4 20.
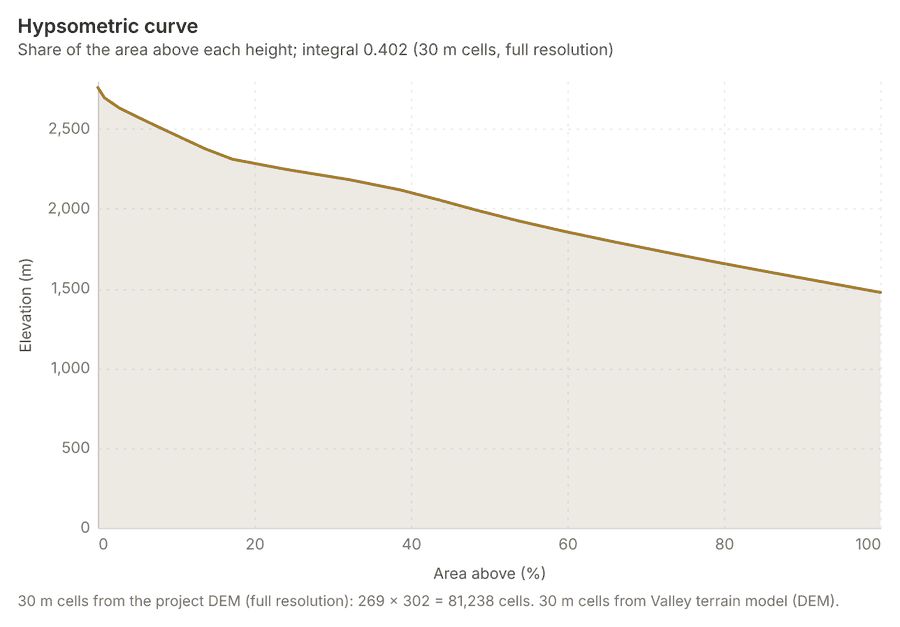
- Evidenced: The chart Hypsometric curve is drawn from 20 rows 131.
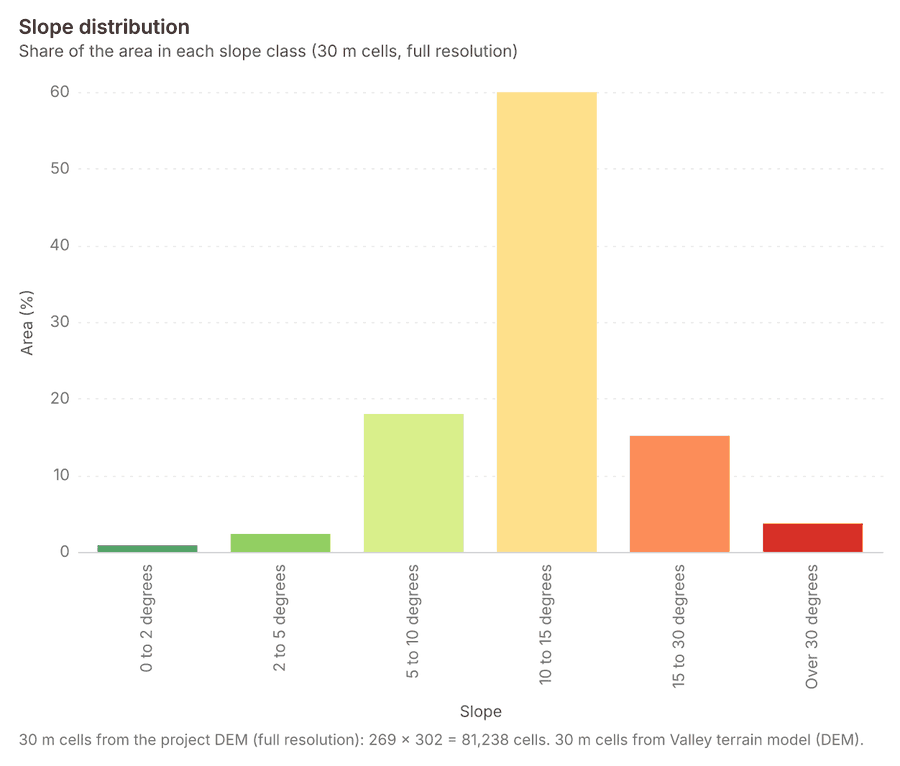
- Evidenced: The chart Slope distribution is drawn from 6 rows 132.
- Evidenced: The chart Aspect rose is drawn from 8 rows 133.
- Evidenced: The chart Elevation along the routes is drawn from 320 rows 134.
- Evidenced: The chart Terrain: Contours (100 m) is drawn from 6 rows 135.
- Evidenced: The chart Terrain: Ravines is drawn from 5 rows 136.
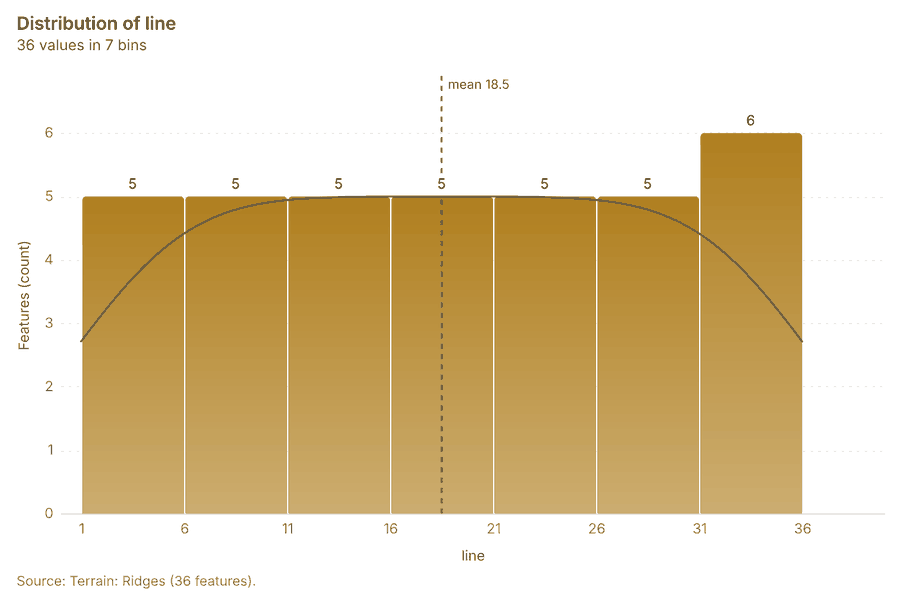
- Evidenced: The chart Terrain: Ridges is drawn from 7 rows 137.
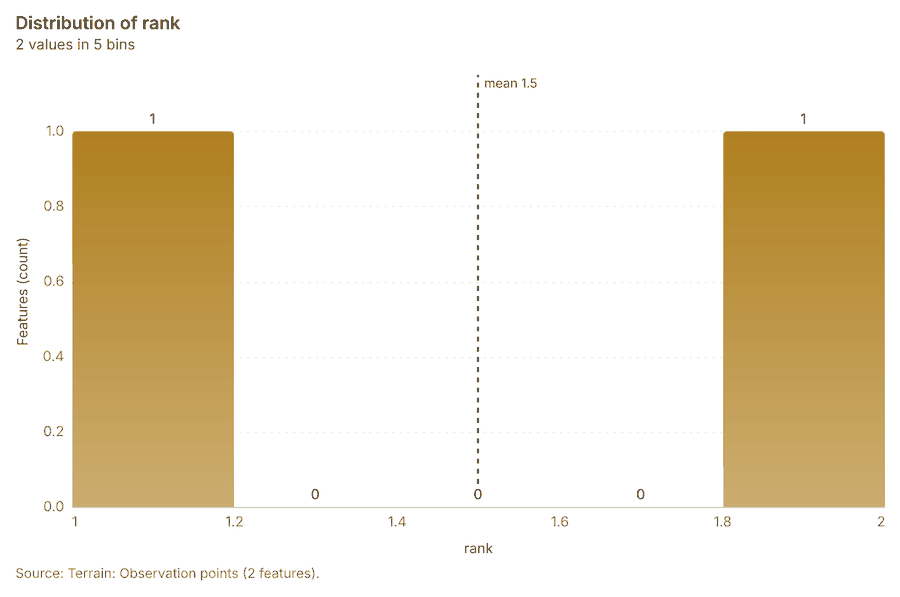
- Evidenced: The chart Terrain: Observation points is drawn from 5 rows 138.
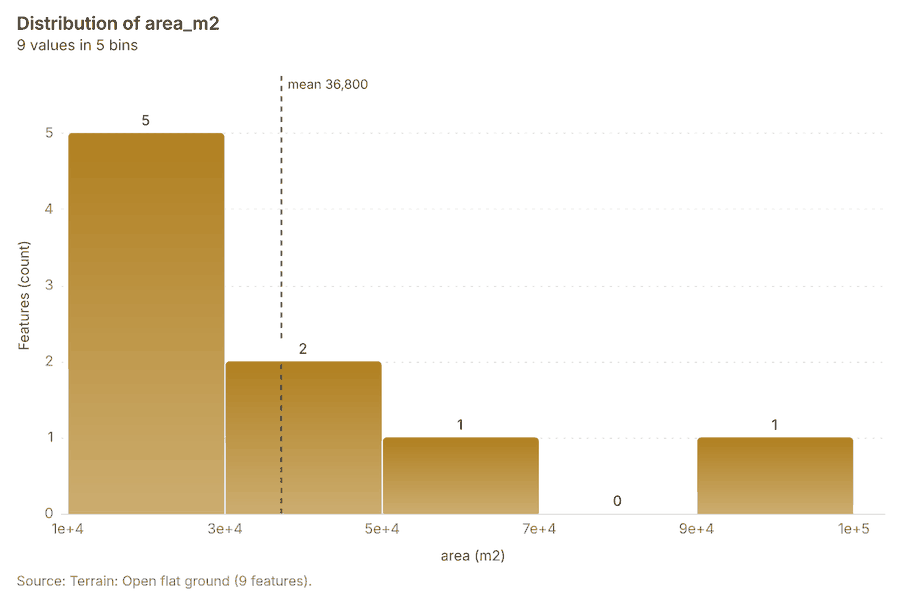
- Evidenced: The chart Terrain: Open flat ground is drawn from 5 rows 139.
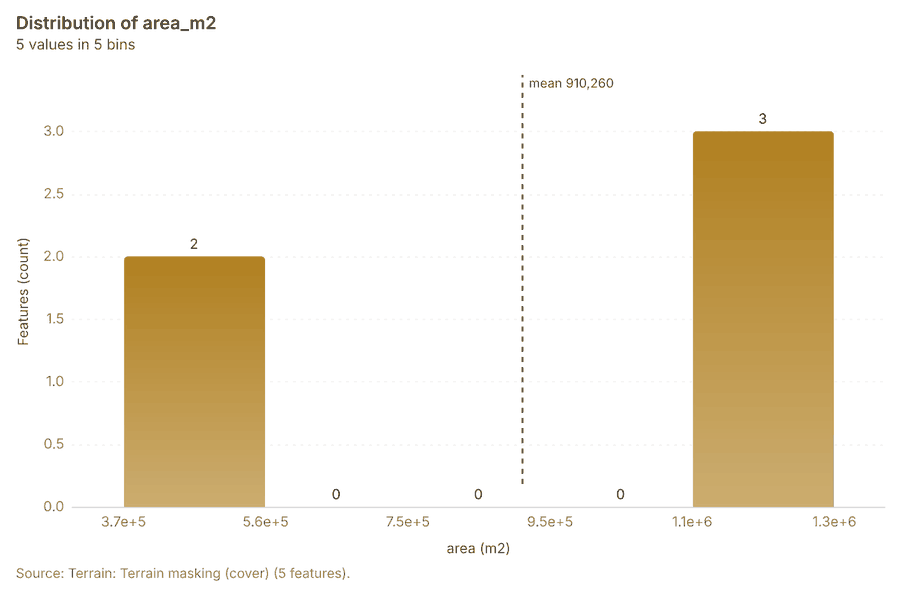
- Evidenced: The chart Terrain: Terrain masking (cover) is drawn from 5 rows 140.
- Evidenced: The chart Terrain: Streams (Strahler order) is drawn from 5 rows 141.
- Evidenced: The chart Terrain: Pour points is drawn from 5 rows 142.
- Evidenced: The chart Terrain: Watershed boundaries is drawn from 5 rows 143.
- Evidenced: The chart Terrain: Pour points (snapped) is drawn from 5 rows 144.
- Evidenced: The chart Terrain: Streams (Strahler order) is drawn from 5 rows 145.
- Evidenced: The chart Terrain: Flood-prone areas is drawn from 5 rows 146.
- Evidenced: The chart Terrain dismounted: Obstacles is drawn from 1 rows 147.
- Evidenced: The chart Terrain wheeled: Obstacles is drawn from 5 rows 148.
- Evidenced: The chart Terrain tracked: Obstacles is drawn from 1 rows 149.
- Evidenced: The chart Terrain: Obstacles is drawn from 1 rows 150.
- Evidenced: The chart Terrain: Mobility corridors is drawn from 5 rows 151.
- Evidenced: The chart Terrain: Key terrain candidates is drawn from 5 rows 152.
- Evidenced: The chart Terrain: Corridor constrictions is drawn from 5 rows 153.
- Evidenced: The chart Terrain: Avenues of approach is drawn from 5 rows 154.
- Evidenced: The chart Terrain heights: Visible area is drawn from 5 rows 155.
- Evidenced: The chart Terrain heights: Observers is drawn from 5 rows 156.
- Evidenced: The chart Terrain DH-1 DH-2: Sightline is drawn from 1 rows 157.
- Evidenced: The chart Terrain DH-1 DH-3: Sightline is drawn from 1 rows 158.
- Evidenced: The chart Terrain DH-1 DH-3: Ground visible from the observer is drawn from 5 rows 159.
- Evidenced: The chart Terrain DH-2 DH-3: Sightline is drawn from 1 rows 160.
- Evidenced: The chart Terrain axis: Least-cost routes is drawn from 1 rows 161.
- Evidenced: The chart Terrain summits: Least-cost routes is drawn from 1 rows 162.
- Evidenced: The chart Terrain axis: Profile line is drawn from 1 rows 163.
- Evidenced: The chart Terrain summits: Profile line is drawn from 1 rows 164.
- Evidenced: The chart Terrain: Best buildability areas is drawn from 8 rows 165.
- Evidenced: The chart Terrain: Best mineability areas is drawn from 5 rows 166.
- Evidenced: The chart Terrain: Landing zone candidates is drawn from 5 rows 167.
- Evidenced: The chart Terrain: Landing points is drawn from 1 rows 168.
- Evidenced: The chart Terrain: Visible area is drawn from 1 rows 169.
- Evidenced: The chart Terrain: Observers is drawn from 5 rows 170.
- Evidenced: The chart Terrain: Dominant heights is drawn from 5 rows 171.
- Evidenced: The 72.1 km2 area spans 1,475 to 2,759 m (1,284 m of relief; median 1,969 m) at 30 m. Slopes average 13.2 degrees; 18.8% of the ground is steeper than 15 degrees and 3.7% steeper than 30 2023178.
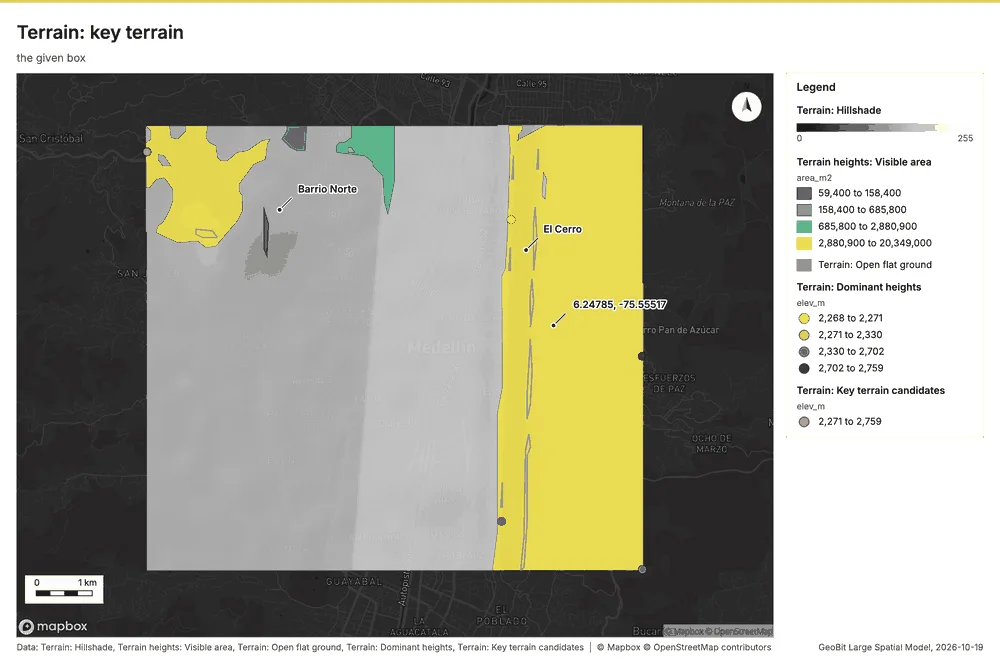
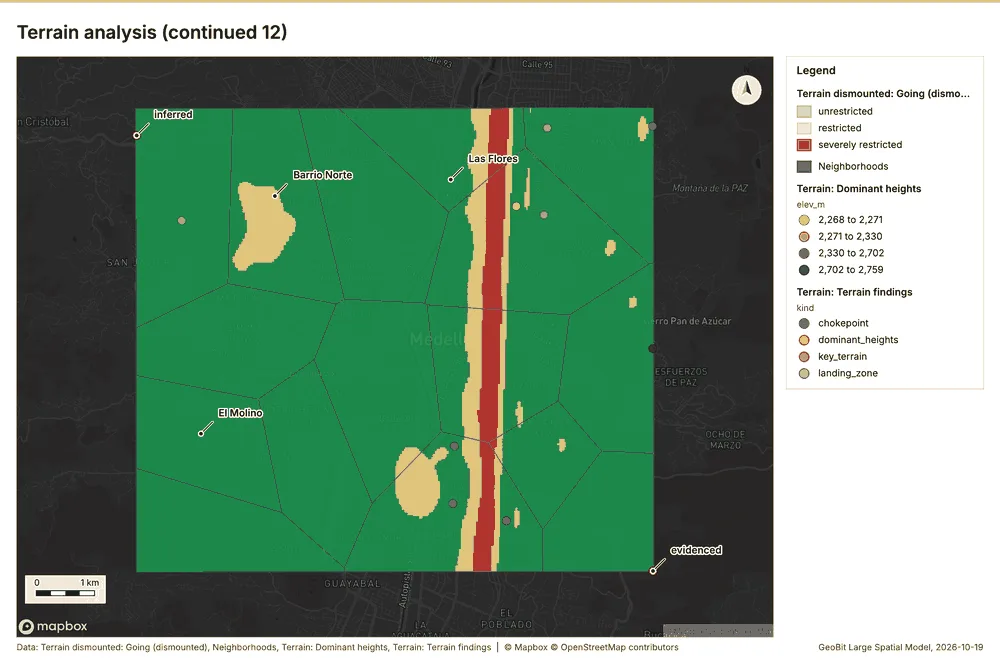
- Evidenced: The highest summit (DH-1) rises to 2,759 m, 192 m above the ground within 750 m; the next summits reach 2,702 m, 2,330 m, 2,271 m 2022178.
- Inferred: KT-1 is a key terrain candidate: highest ground within 1.0 km (2271 m); 189 m above the lowest ground around it; observes 21% of the ground within 4.5 km (3.81 km2); overlooks mobility corridor MC-1 6490178. A candidate, not a decision 6490178.
- Inferred: KT-2 is a key terrain candidate: highest ground within 1.0 km (2759 m); 270 m above the lowest ground around it; observes 13% of the ground within 4.5 km (2.01 km2); overlooks mobility corridor MC-2 6490178. A candidate, not a decision 6490178.
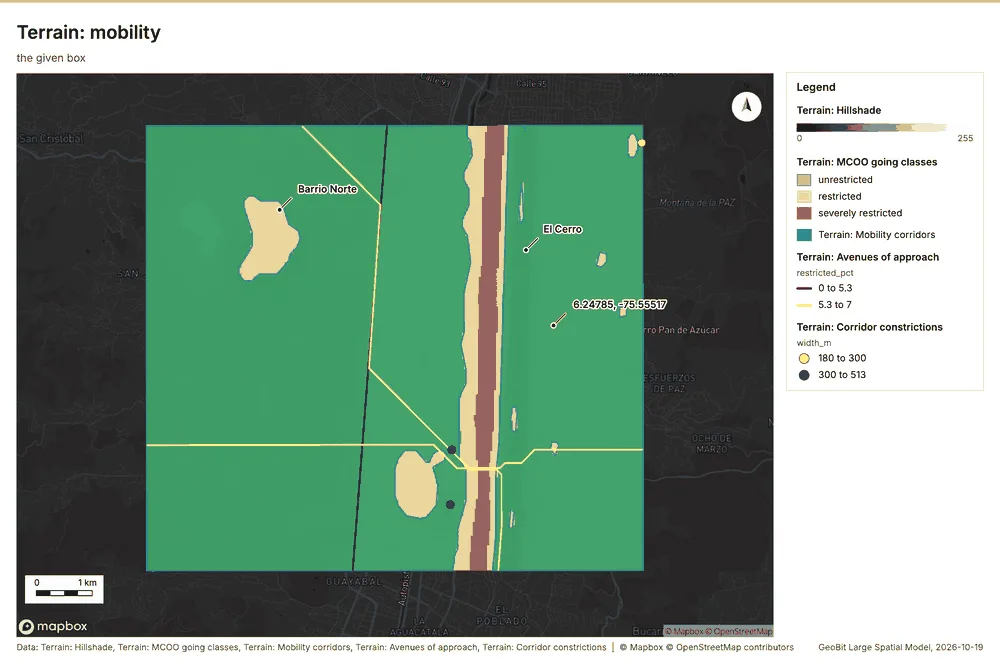
- Inferred: The widest mobility corridor (MC-1) is about 3.2 km wide and 8.4 km long on a 4 degree axis; 2 corridor(s) in all 2065178.
- Inferred: AA-1: cheapest way through the area from the N edge to the S edge: 8.2 km, about 103 min, 0% restricted going (no objective given) 2062178.
- Inferred: AA-2: cheapest way through the area from the SE edge to the NW edge: 10.0 km, about 201 min, 5% restricted going (no objective given) 2062178.
- Inferred: CP-1: MC-2 narrows to 180 m, at most 70% of its median width (300 m) 2063178.
- Inferred: CP-2: MC-1 narrows to 300 m, at most 70% of its median width (3.2 km) 2063178.
- Inferred: CP-3: MC-1 narrows to 513 m, at most 70% of its median width (3.2 km) 2063178.
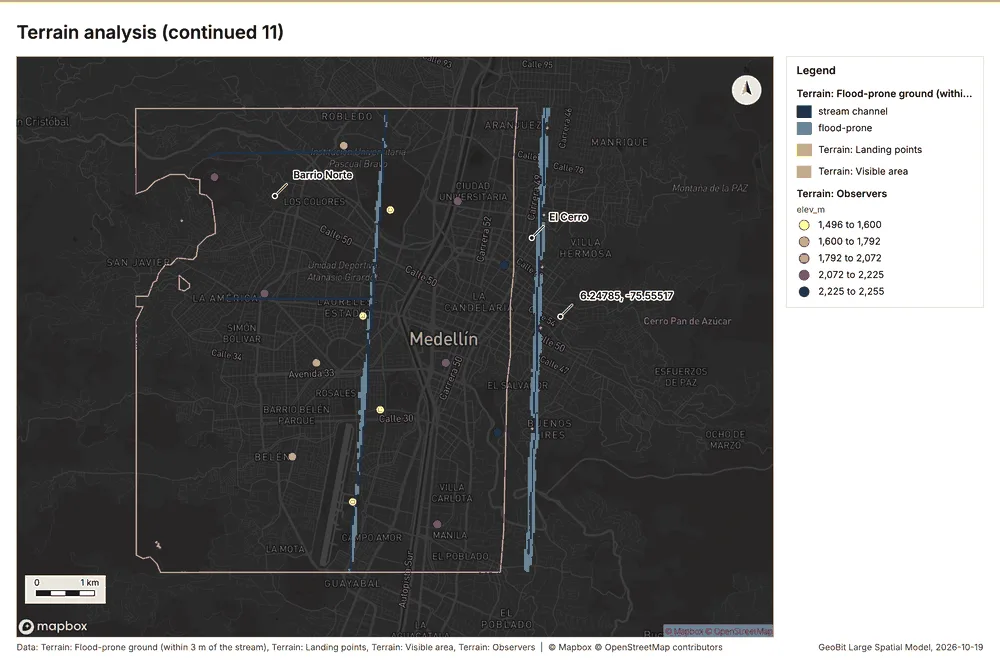
- Inferred: 1.72 km2 (2.4% of the area) lies within 3 m of the height of the nearest stream, the ground that floods first when the streams rise; a terrain screen, not a flood model 2079178.
- Evidenced: Most ground faces west (49.0%); 0.3% is flat (under 1 degree) 2023178.
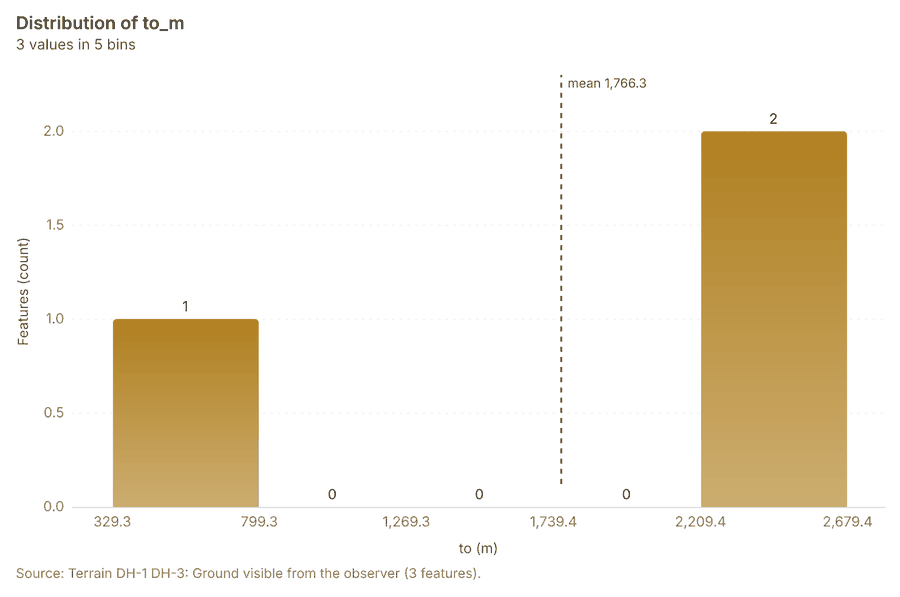
- Evidenced: From the dominant heights (1.7 m eye height) 37.1% of the ground within 4.5 km is visible (24.13 km2) 20276190178.
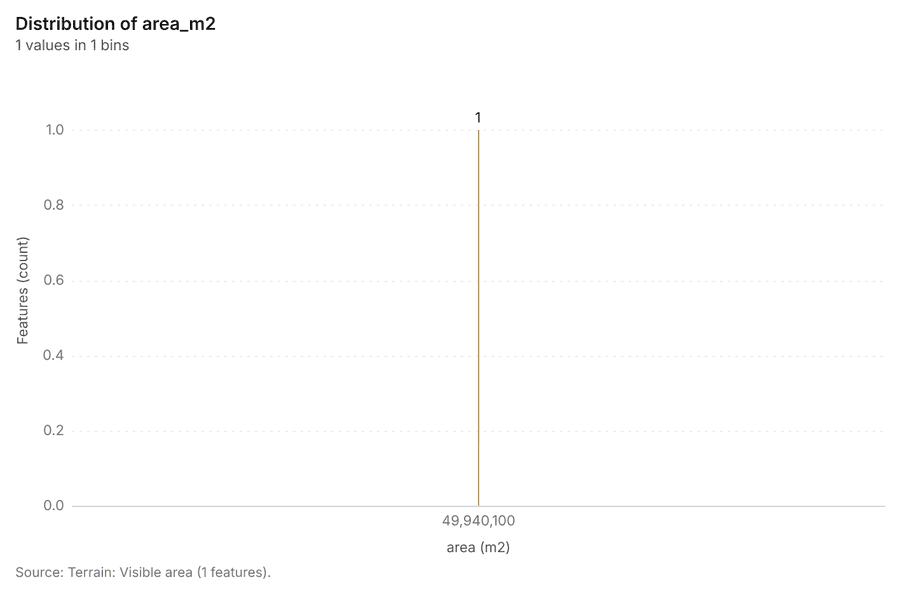
- Evidenced: From OP-1, OP-2, OP-3, OP-4, OP-5, OP-6, OP-7, OP-8, OP-9, OP-10, OP-11, OP-12, OP-13, OP-14 (1.7 m eye height) 69.3% of the ground within 4.5 km is visible (49.94 km2) 20276190178.
- Evidenced: From observation point KT-1 (1.7 m eye height) 21.1% of the ground within 4.5 km is visible (3.81 km2) 20276190178.
- Evidenced: From observation point KT-2 (1.7 m eye height) 12.5% of the ground within 4.5 km is visible (2.01 km2) 20276190178.
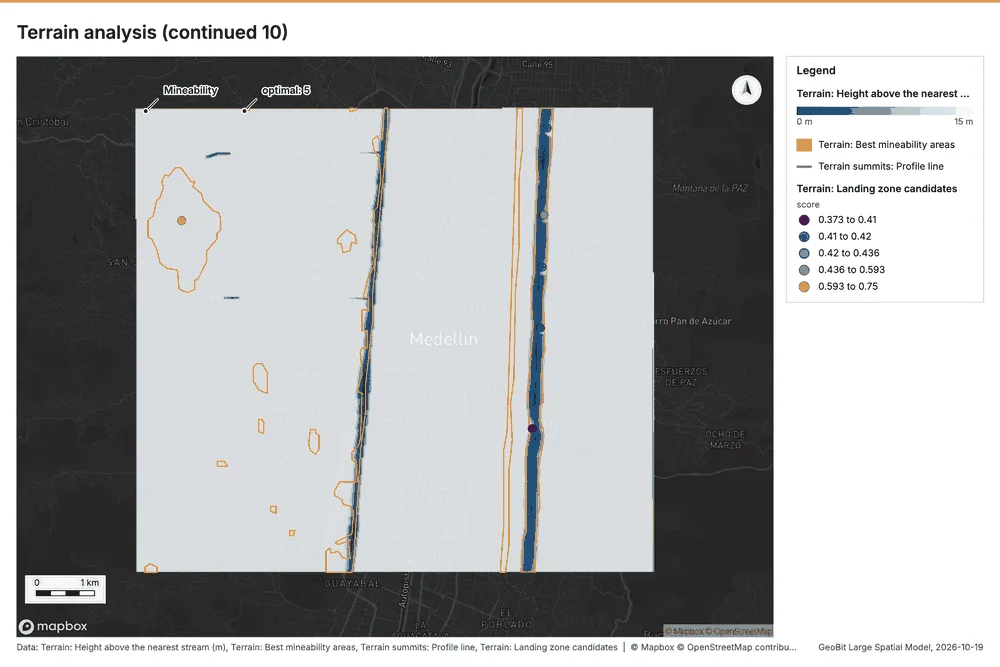
- Inferred: LZ-1 (score 0.75): a 29.9 m medium helicopter landing point fits: clear ground about 300 m across or more at 30 m cells; slope up to 2.3 degrees (limit 7); unobserved, 531 m from observed ground 29178. Map study: confirm on the ground 29178.
- Inferred: LZ-2 (score 0.44): a 29.9 m medium helicopter landing point fits: clear ground about 90 m across at 30 m cells; slope up to 3.4 degrees (limit 7); unobserved, 540 m from observed ground 29178. Map study: confirm on the ground 29178.
- Inferred: LZ-3 (score 0.43): a 29.9 m medium helicopter landing point fits: clear ground about 90 m across at 30 m cells; slope up to 4.3 degrees (limit 7); unobserved, 569 m from observed ground 29178. Map study: confirm on the ground 29178.
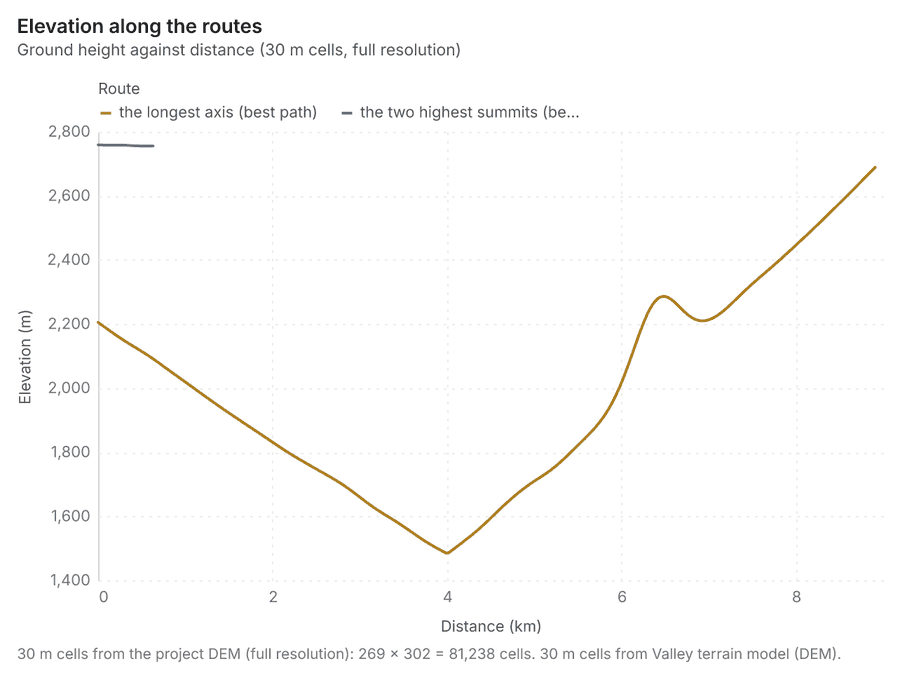
- Evidenced: The best dismounted route the longest axis is 8.91 km long, about 245 min, climbing 1280 m 2050515253178.
- Evidenced: The best dismounted route the two highest summits is 3.84 km long, about 44 min, climbing 11 m 2050515253178.
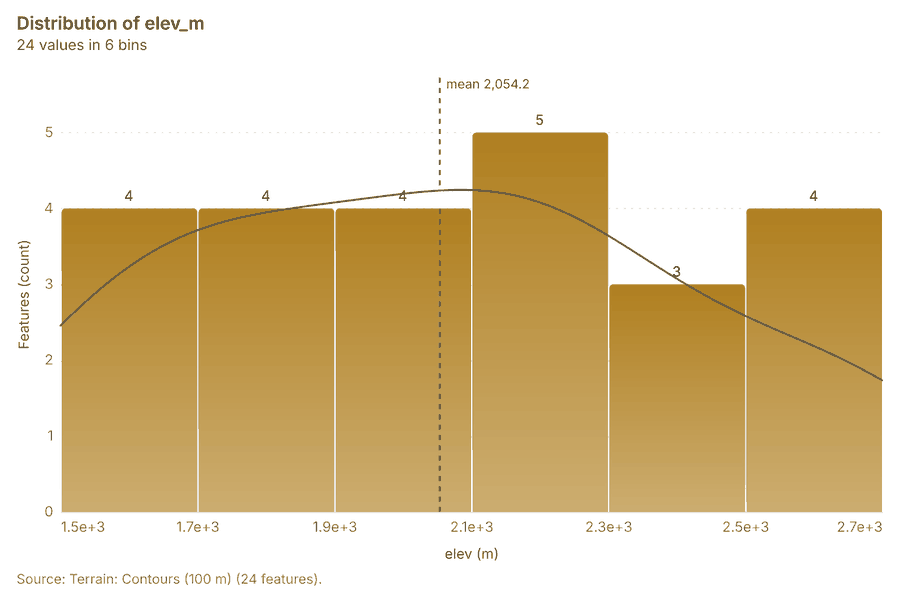
- Evidenced: 24 contour line(s) at 100 m over 13 level(s) 20100178.
- Evidenced: Slope over 72.09 km2: mean 13.16 degrees, max 38.63 degrees; 92% of the ground is steeper than 15% 2099178.
- Evidenced: Aspect: most ground faces W (49%); 0% is flat (slope under 1 degrees) 2098178.
- Evidenced: Hillshade lit from 315 degrees at 45 degrees altitude (multidirectional) 2097178.
- Evidenced: Total curvature (1/100 m): mean -0.005, range -1.2011 to 0.3811 2096178.
- Evidenced: Terrain suite over 72.09 km2 at 30 m: elevation 1475.15 to 2759.29 m; 2 raster(s) and 0 vector layer(s) 209495178.
- Evidenced: Landforms (geomorphons): slope 92%, valley 2%, ridge 2% (search 300 m, flat below 1 degrees) 2093178.
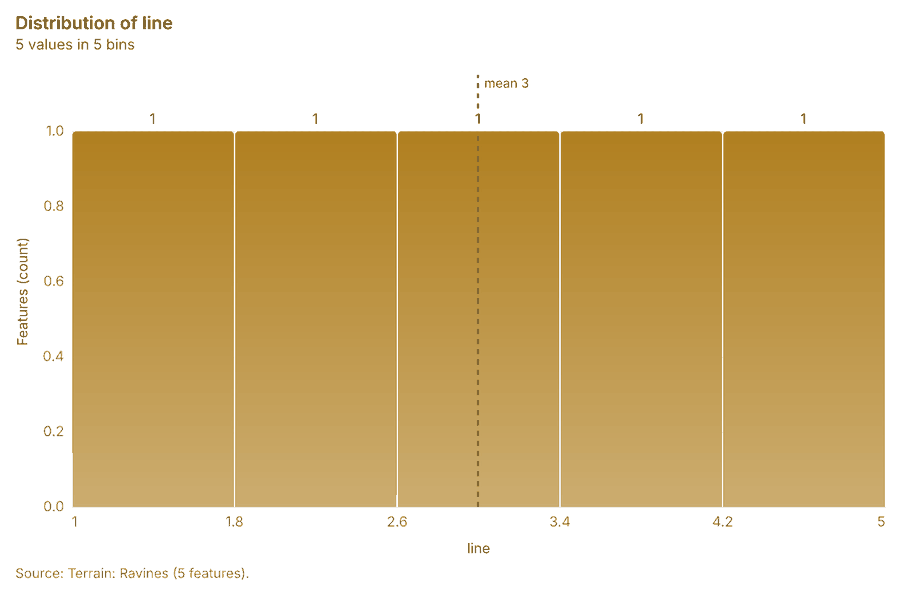
- Evidenced: 5 ravine line(s) and 36 ridge line(s); ravines drain at least 0.721 km2 209192178.
- Evidenced: 2 observation point(s), 9 open flat area(s), 5 masked area(s) 20888990178.
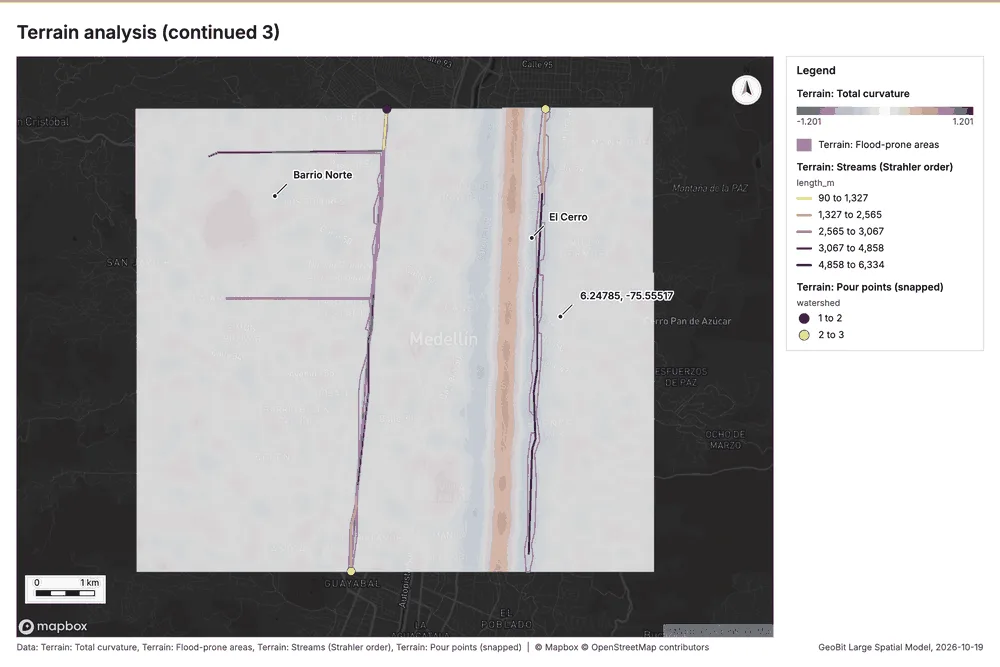
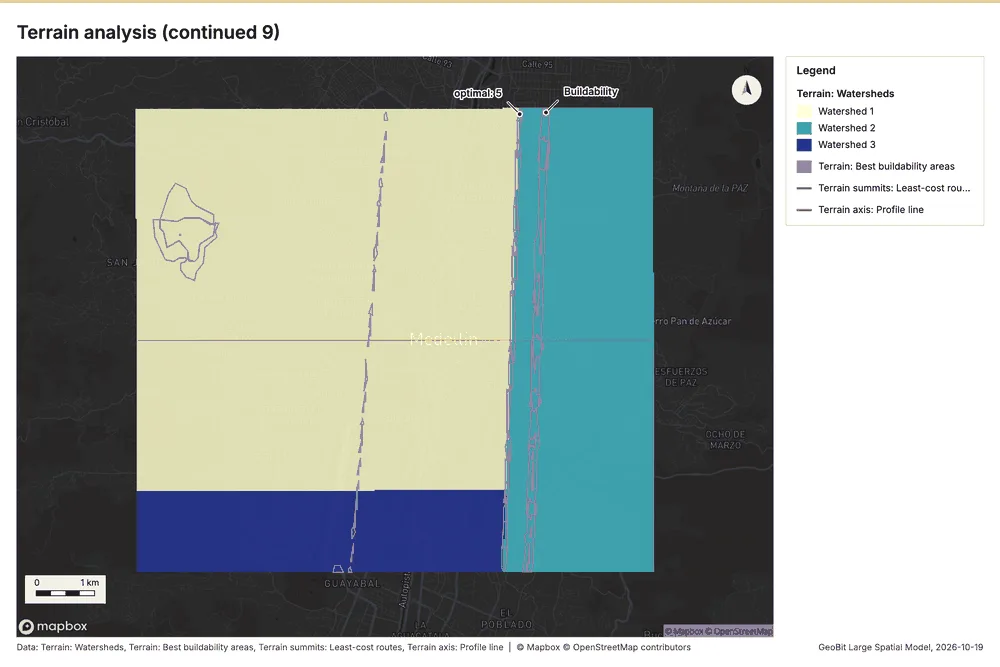
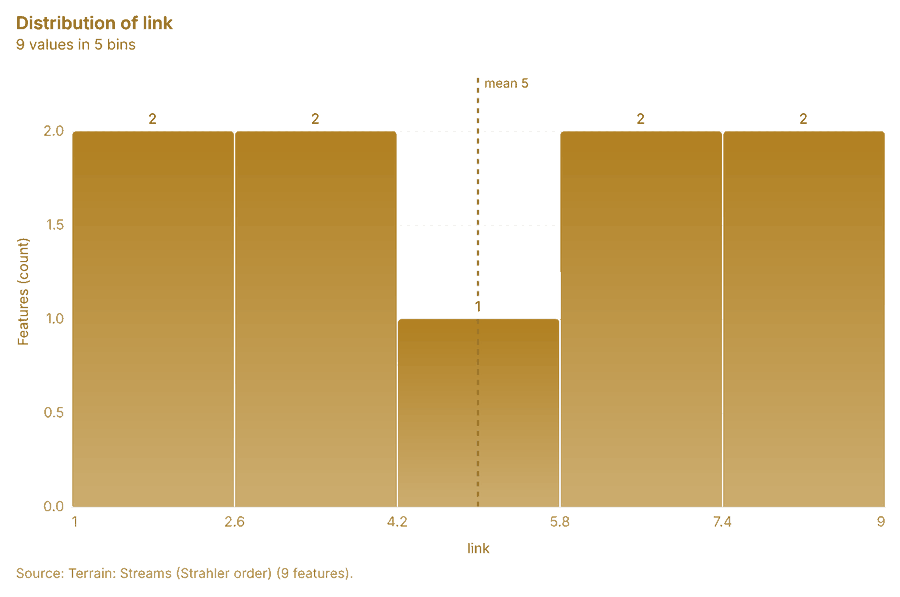
- Evidenced: Flow accumulation (pure): the largest catchment drains 43.241 km2 through one cell; 9 stream link(s), Strahler order up to 2 20858687178.
- Evidenced: Pour points: found 3 candidate outlets draining at least 0.721 km2 2084178.
- Evidenced: Watersheds of the 3 largest outlet basin(s): 72.090 km2 in total; the largest drains 43.241 km2 20818283178.
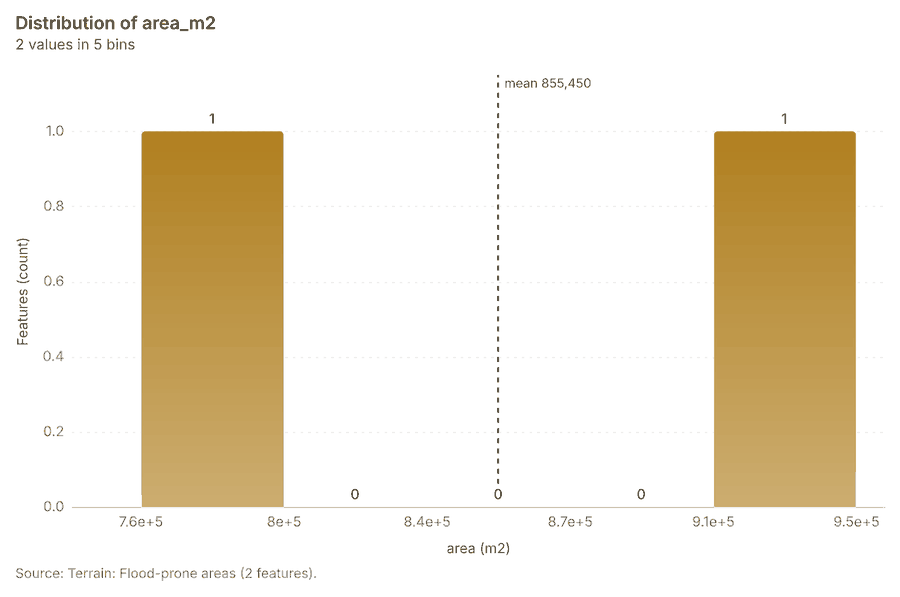
- Evidenced: Flood-prone ground (HAND up to 3 m above streams that drain 0.72 km2 or more): 1.715 km2, 2.4% of the area; 9 stream link(s) 2077787980178.
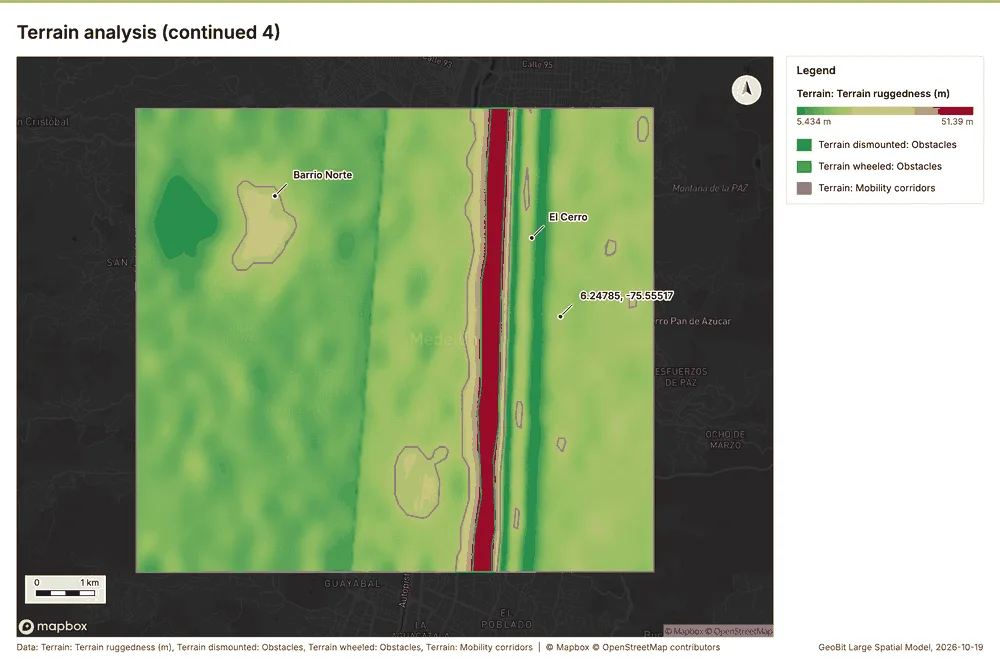
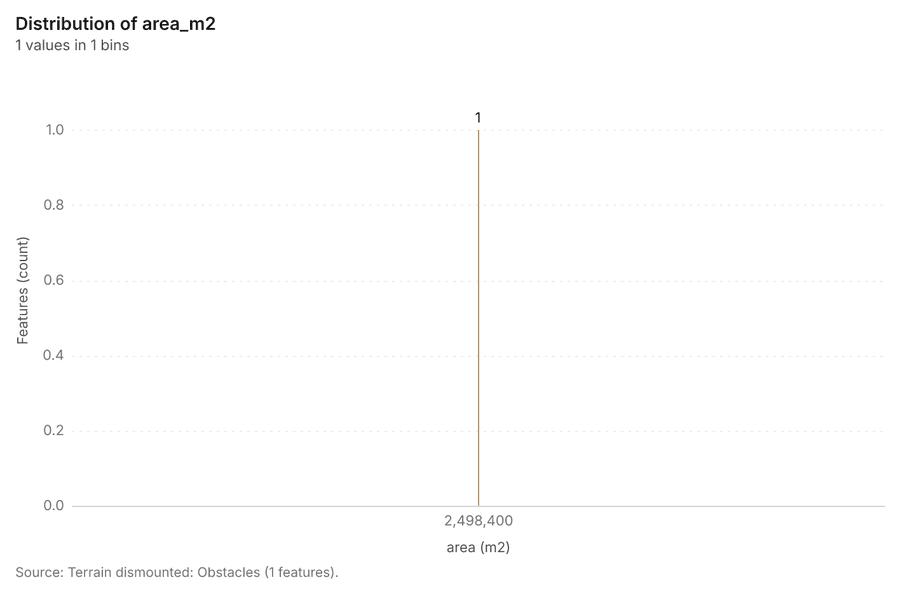
- Inferred: Dismounted going: 90% unrestricted, 7% restricted, 3% severely restricted; 1 obstacle region(s) 20747576178.
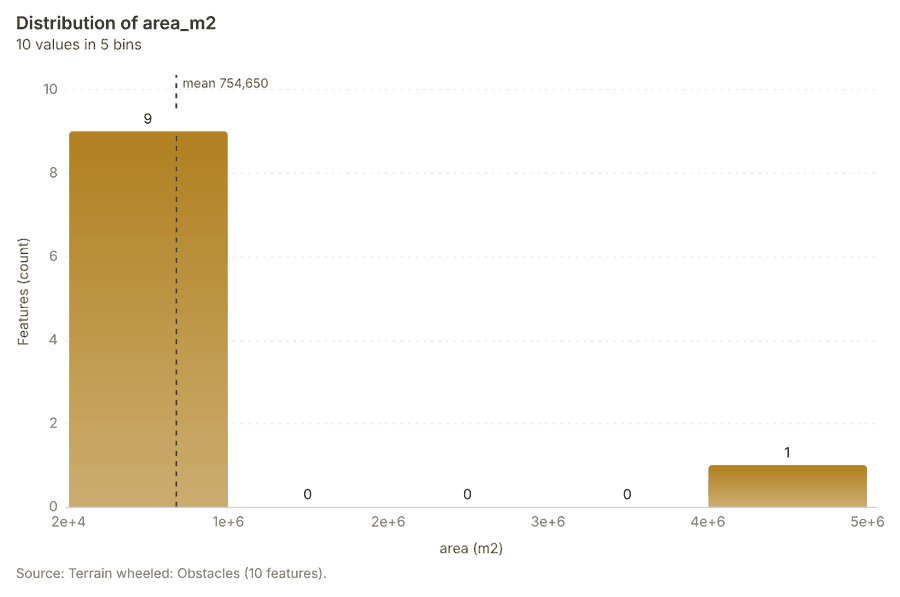
- Inferred: Wheeled going: 8% unrestricted, 81% restricted, 10% severely restricted; 10 obstacle region(s) 20717273178.
- Inferred: Tracked going: 90% unrestricted, 7% restricted, 3% severely restricted; 1 obstacle region(s) 20686970178.
- Inferred: MCOO (dismounted): 1 obstacle(s), 2 corridor(s), 2 key terrain candidate(s), 3 avenue(s) 20626364656667178.
- Evidenced: Visible from 5 observer(s): 37.1% of the ground within 4500 m (24.134 km2); k = 0.13 2058596061178.
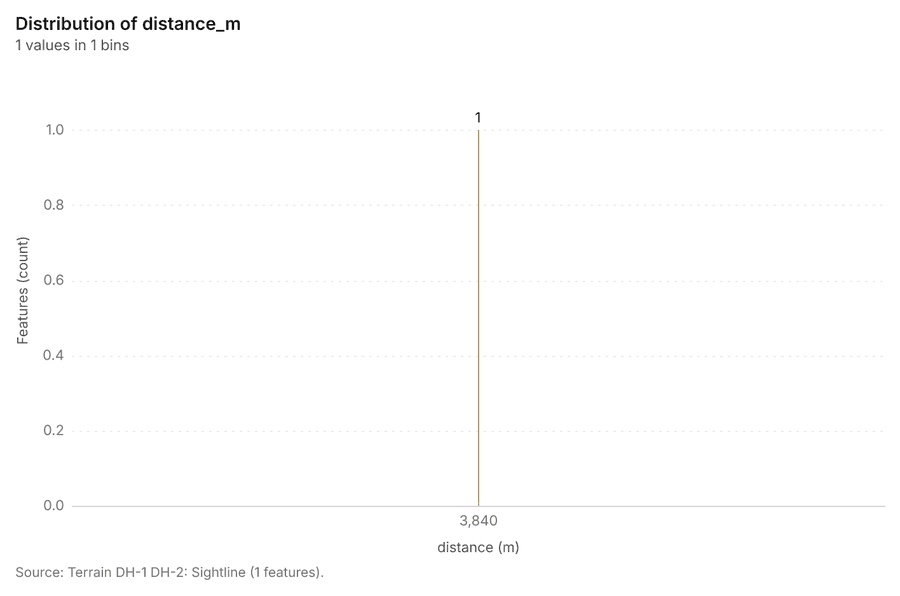
- Evidenced: Target unknown over 3840 m: an endpoint lies on missing ground or outside the area 2057178.
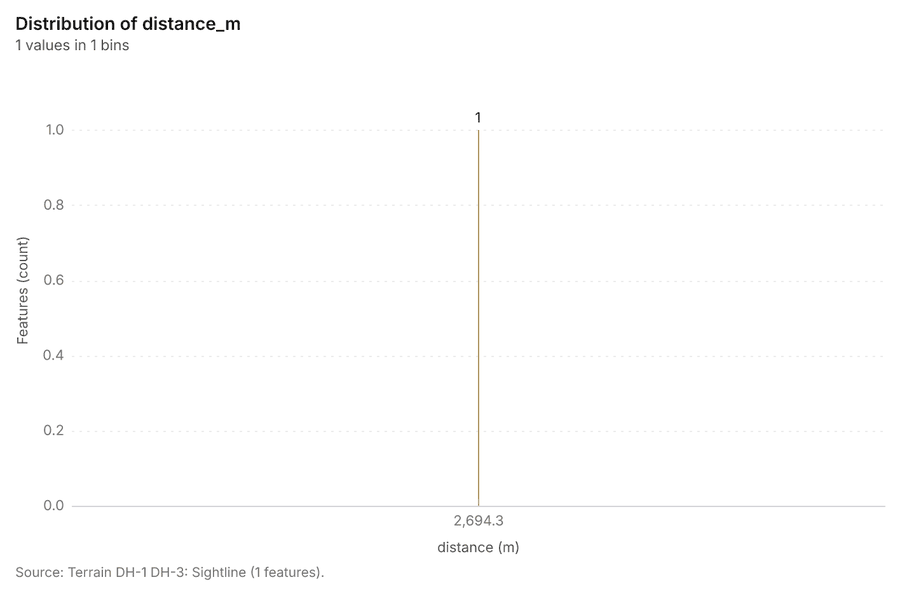
- Evidenced: Target visible over 2694 m: clear: the lowest clearance is 2.9 m at 15 m from A 205556178.
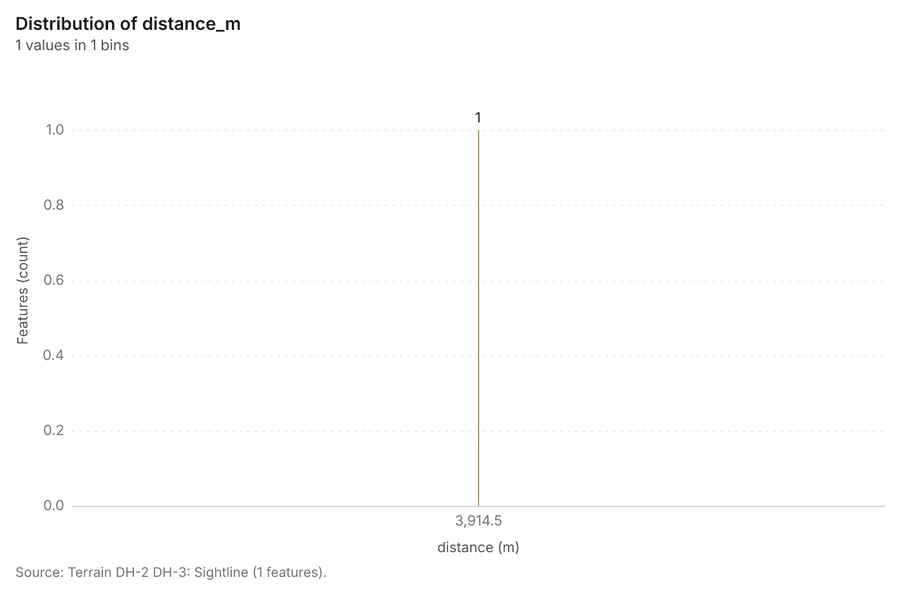
- Evidenced: Target unknown over 3915 m: an endpoint lies on missing ground or outside the area 2054178.
- Inferred: Best dismounted route: 8.91 km in about 245 min (ascent 1280 m, 4% restricted); 0 alternate(s) 2053178.
- Inferred: Best dismounted route: 3.84 km in about 44 min (ascent 11 m, 0% restricted); 0 alternate(s) 2052178.
- Evidenced: Profile of 8910 m: 1485.4 to 2689.19 m, gain 1280 m, loss 796 m, steepest grade 77.5% 2051178.
- Evidenced: Profile of 3840 m: 2755.69 to 2759.29 m, gain 0 m, loss 4 m, steepest grade 1.4% 2050178.
- Inferred: Clear-sky insolation over 365 day(s): mean 6.607 kWh/m2/day (range 5.552 to 6.892); most energy on unsuitable ground 20474849178.
- Inferred: Infinite-slope factor of safety: 2.1% unstable (FS < 1), 3.4% marginal; lowest FS 0.91 204546178.
- Inferred: Landslide susceptibility (terrain index): 1.6% high or very high; weights {'slope': 0.5, 'wetness': 0.25, 'concavity': 0.15, 'relief': 0.1} 204344178.
- Inferred: Erosion (RUSLE form): mean soil loss 39.45 t/ha/yr; 96.8% of the ground is high or very high 20404142178.
- Inferred: Buildability: 1.4% optimal, 2.8% suitable; mean score 5/100; 91.7% excluded by constraints 20373839178.
- Inferred: Site suitability: 0.0% excellent, 0.0% good; mean score 38/100; 3.7% excluded by constraints 203536178.
- Inferred: Mineability: 7.4% optimal, 46.4% suitable; mean score 74/100; 0.0% excluded by constraints 20323334178.
- Inferred: Landing zones for a 29.9 m medium helicopter landing point (slope up to 7 degrees): 6 candidate(s); 3.2% of the ground fits the landing point 2028293031178.
- Evidenced: Visible from 14 observer(s): 69.3% of the ground within 4500 m (49.940 km2); k = 0.13 2024252627178.
Tool tr_terrain_analysis; parameters {"dem": {"dataset": "f309cad9-7065-421d-b65f-542f4ad825d1"}, "area": [-75.6219210590975, 6.207884234863717, -75.5404851734973, 6.280430663194416], "project": "bceeca13-52a5-4344-bf84-77a2f9f8e186", "purpose": "everything", "observers": [[-75.587681, 6.218869], [-75.583629, 6.233346], [-75.586086, 6.247817], [-75.582036, 6.264466], [-75.58937, 6.274589], [-75.597451, 6.226094], [-75.601548, 6.25141
Zonal statistics
What this analysis is. Zonal statistics: count/min/max/mean/std/sum/median/majority per polygon as a table and as GeoJSON 172. In ArcGIS it is Zonal Statistics as Table (polygons) 172.
Why it was run on this data. Statistics of Valley terrain model (DEM) inside each feature of Neighborhoods 173.
What it found. The analysis involves Zonal statistics using the rs_zonal_statistics tool 174. The tool summary reports processing 16 row(s) 174. Additionally, the process analyzed 16 zones 174.
Findings
Tool rs_zonal_statistics; parameters {"stats": ["mean", "min", "max", "std"], "zones": "Neighborhoods (efbe8937)", "raster_id": "Valley terrain model (DEM) (51a68176)"}
Slope
What this analysis is. Slope: Horn slope in degrees or percent, with the share of ground in six grade classes 175. In ArcGIS it is Slope (Spatial Analyst); in QGIS, Slope (GDAL DEM) 175.
Why it was run on this data. Slope of the Valley terrain model (DEM) surface 176.
What it found. Slope on Valley terrain model (DEM) produced Slope (degrees) (0 features) 177178179. It reported dem, cols 300; dem, rows 267; dem, cell m 30; dem, native m 30; dem, relief m 1,284; dem, elev max m 2,759 177.
| Result | Value |
|---|---|
| dem, cols | 300 |
| dem, rows | 267 |
| dem, cell m | 30 |
| dem, native m | 30 |
| dem, relief m | 1,284 |
| dem, elev max m | 2,759 |
| dem, elev min m | 1,475 |
| dem, elev mean m | 1,991 |
| dem, missing frac | 0 |
| grid, cols | 300 |
| grid, rows | 267 |
| grid, cell m | 30 |
| stats, max | 38.63 |
| stats, min | 0.02 |
| stats, mean | 13.16 |
| stats, median | 12.37 |
| stats, steeper than 15pct | 91.71 |
| tokens, usd | 0.017 |
| tokens, tokens | 17 |
| tokens, tokens in | 1 |
Findings
- Evidenced: Slope on Valley terrain model (DEM) produced Slope (degrees) (0 features) 177178179.
- Evidenced: It reported dem, cols 300; dem, rows 267; dem, cell m 30; dem, native m 30; dem, relief m 1,284; dem, elev max m 2,759 177.
Tool tr_slope; parameters {"dem": {"layer": "Valley terrain model (DEM) (51a68176)"}, "project": "bceeca13-52a5-4344-bf84-77a2f9f8e186"}
Hot spots
What this analysis is. Hot spot analysis: Getis-Ord Gi* hot and cold spots with z-scores, p-values and confidence bins 180. In ArcGIS it is Find Hot Spots or Hot Spot Analysis (Getis-Ord Gi*); in QGIS, qgis:hotspot (plugin) 180.
Why it was run on this data. 1800 points: Getis-Ord Gi* tests whether the concentrations in Dropped calls are statistically significant 181. Measured: Dropped calls are clustered (nearest-neighbor ratio 0.87, z = -10.7), median spacing 63 m 181. Cells of 200 m and a band of 500 m from the measured spacing 181.
What it found. Hot spots on Dropped calls: Hot spot analysis: 1 layer saved: Hot spot analysis: Dropped calls (1798 features) 14182. It reported result, bins 1,798; result, count 1,798; result, elapsed ms 64; result, cell size m 200; result, incidents used 1,800; result, distance band m 500 182.
| Result | Value |
|---|---|
| result, bins | 1,798 |
| result, count | 1,798 |
| result, elapsed ms | 64 |
| result, cell size m | 200 |
| result, incidents used | 1,800 |
| result, distance band m | 500 |
| billing, cost | 0.086 |
| billing, list price | 0.086 |
| billing, upstream cost | 0 |
Findings
- Evidenced: Hot spots on Dropped calls: Hot spot analysis: 1 layer saved: Hot spot analysis: Dropped calls (1798 features) 14182.
- Evidenced: It reported result, bins 1,798; result, count 1,798; result, elapsed ms 64; result, cell size m 200; result, incidents used 1,800; result, distance band m 500 182.
Tool gp_hot_spots; parameters {"project": "bceeca13-52a5-4344-bf84-77a2f9f8e186", "features": {"layer": "Dropped calls (e2f5ccec)"}, "aggregation": "hexagon", "cell_size_m": 200.0, "distance_band_m": 500.0}
Hot spots
What this analysis is. Hot spot analysis: Getis-Ord Gi* hot and cold spots with z-scores, p-values and confidence bins 180. In ArcGIS it is Find Hot Spots or Hot Spot Analysis (Getis-Ord Gi*); in QGIS, qgis:hotspot (plugin) 180.
Why it was run on this data. 420 points: Getis-Ord Gi* tests whether the concentrations in Coverage complaints are statistically significant 183. Measured: Coverage complaints are clustered (nearest-neighbor ratio 0.87, z = -5.0), median spacing 123 m 183. Cells of 500 m and a band of 1000 m from the measured spacing 183.
What it found. Hot spots on Coverage complaints: Hot spot analysis: 1 layer saved: Hot spot analysis: Coverage complaints (305 features) 15184. It reported result, bins 305; result, count 305; result, elapsed ms 11; result, cell size m 500; result, incidents used 420; result, distance band m 1,000 184.
| Result | Value |
|---|---|
| result, bins | 305 |
| result, count | 305 |
| result, elapsed ms | 11 |
| result, cell size m | 500 |
| result, incidents used | 420 |
| result, distance band m | 1,000 |
| billing, cost | 0.0584 |
| billing, list price | 0.0584 |
| billing, upstream cost | 0 |
Findings
- Evidenced: Hot spots on Coverage complaints: Hot spot analysis: 1 layer saved: Hot spot analysis: Coverage complaints (305 features) 15184.
- Evidenced: It reported result, bins 305; result, count 305; result, elapsed ms 11; result, cell size m 500; result, incidents used 420; result, distance band m 1,000 184.
Tool gp_hot_spots; parameters {"project": "bceeca13-52a5-4344-bf84-77a2f9f8e186", "features": {"layer": "Coverage complaints (a0e6cf38)"}, "aggregation": "hexagon", "cell_size_m": 500.0, "distance_band_m": 1000.0}
Hot spots
What this analysis is. Hot spot analysis: Getis-Ord Gi* hot and cold spots with z-scores, p-values and confidence bins 180. In ArcGIS it is Find Hot Spots or Hot Spot Analysis (Getis-Ord Gi*); in QGIS, qgis:hotspot (plugin) 180.
Why it was run on this data. 40 points: Getis-Ord Gi* tests whether the concentrations in Small cells are statistically significant 185.
What it found. The hot spot analysis processed 40 incidents using the Small cells layer 186. The analysis identified 21 features, with the result showing a count of 21 186. These results were generated using a cell size of 2,000 m and a distance band of 2,000 m 186. The total cost for the analysis was 0.0508 186.
| Result | Value |
|---|---|
| result, bins | 21 |
| result, count | 21 |
| result, elapsed ms | 2 |
| result, cell size m | 2,000 |
| result, incidents used | 40 |
| result, distance band m | 2,000 |
| billing, cost | 0.0508 |
| billing, list price | 0.0508 |
| billing, upstream cost | 0 |
Findings
- Evidenced: Hot spots on Small cells: Hot spot analysis: 1 layer saved: Hot spot analysis: Small cells (21 features) 17186.
- Evidenced: It reported result, bins 21; result, count 21; result, elapsed ms 2; result, cell size m 2,000; result, incidents used 40; result, distance band m 2,000 186.
Tool gp_hot_spots; parameters {"project": "bceeca13-52a5-4344-bf84-77a2f9f8e186", "features": {"layer": "Small cells (0b706ff2)"}, "aggregation": "hexagon", "cell_size_m": 2000.0, "distance_band_m": 2000.0}
Space time hot spots
What this analysis is. Emerging hot spots: Where hot spots are new, consecutive, intensifying, persistent, diminishing, sporadic, oscillating or historical over time 187. In ArcGIS it is Emerging Hot Spot Analysis or Create Space Time Cube 187.
Why it was run on this data. Coverage complaints carry dates in 'date': emerging hot spot analysis finds new, intensifying and fading hot spots per week 188. Measured: the pattern of Coverage complaints changes over time (earlier half clustered, later half random; the center moved 305 m) 188.
What it found. Space time hot spots on Coverage complaints: Emerging hot spots: 1 layer saved: Emerging hot spots: Coverage complaints (94 features) 15189. It reported result, count 94; result, elapsed ms 14; result, resolution 8; result, features used 420; result, time neighbors 0; billing, cost 0.121 189.
| Result | Value |
|---|---|
| result, count | 94 |
| result, elapsed ms | 14 |
| result, resolution | 8 |
| result, features used | 420 |
| result, time neighbors | 0 |
| billing, cost | 0.121 |
| billing, list price | 0.121 |
| billing, upstream cost | 0 |
Findings
- Evidenced: Space time hot spots on Coverage complaints: Emerging hot spots: 1 layer saved: Emerging hot spots: Coverage complaints (94 features) 15189.
- Evidenced: It reported result, count 94; result, elapsed ms 14; result, resolution 8; result, features used 420; result, time neighbors 0; billing, cost 0.121 189.
Tool gp_space_time_hot_spots; parameters {"project": "bceeca13-52a5-4344-bf84-77a2f9f8e186", "features": {"layer": "Coverage complaints (a0e6cf38)"}, "interval": "week", "bin_shape": "h3", "resolution": 8, "time_field": "date"}
Space time hot spots
What this analysis is. Emerging hot spots: Where hot spots are new, consecutive, intensifying, persistent, diminishing, sporadic, oscillating or historical over time 187. In ArcGIS it is Emerging Hot Spot Analysis or Create Space Time Cube 187.
Why it was run on this data. Dropped calls carry dates in 'occurred_at': emerging hot spot analysis finds new, intensifying and fading hot spots per week 190.
What it found. Space time hot spots on Dropped calls: Emerging hot spots: 1 layer saved: Emerging hot spots: Dropped calls (109 features) 14191. It reported result, count 109; result, elapsed ms 13; result, resolution 8; result, features used 1,800; result, time neighbors 0; billing, cost 0.19 191.
| Result | Value |
|---|---|
| result, count | 109 |
| result, elapsed ms | 13 |
| result, resolution | 8 |
| result, features used | 1,800 |
| result, time neighbors | 0 |
| billing, cost | 0.19 |
| billing, list price | 0.19 |
| billing, upstream cost | 0 |
Findings
- Evidenced: Space time hot spots on Dropped calls: Emerging hot spots: 1 layer saved: Emerging hot spots: Dropped calls (109 features) 14191.
- Evidenced: It reported result, count 109; result, elapsed ms 13; result, resolution 8; result, features used 1,800; result, time neighbors 0; billing, cost 0.19 191.
Tool gp_space_time_hot_spots; parameters {"project": "bceeca13-52a5-4344-bf84-77a2f9f8e186", "features": {"layer": "Dropped calls (e2f5ccec)"}, "interval": "week", "bin_shape": "h3", "resolution": 8, "time_field": "occurred_at"}
Summarize within
What this analysis is. Summarize within: Count and aggregate the features inside each polygon (or bin), proportionally for lines and polygons 192. In ArcGIS it is Summarize Within or Aggregate Points; in QGIS, native:countpointsinpolygon or native:sumlinelengths 192.
Why it was run on this data. Count Towers inside each feature of Neighborhoods by technology; the counts map as a choropleth (natural breaks, sequential colors) 193.
What it found. Summarize within on Towers, Neighborhoods: Summarize within: 1 layer saved: Summarize within: Neighborhoods (16 features) 1213194. It reported result, count 16; result, elapsed ms 1; billing, cost 0.01062; billing, list price 0.01062; billing, upstream cost 0 194.
| Result | Value |
|---|---|
| result, count | 16 |
| result, elapsed ms | 1 |
| billing, cost | 0.01062 |
| billing, list price | 0.01062 |
| billing, upstream cost | 0 |
Findings
- Evidenced: Summarize within on Towers, Neighborhoods: Summarize within: 1 layer saved: Summarize within: Neighborhoods (16 features) 1213194.
- Evidenced: It reported result, count 16; result, elapsed ms 1; billing, cost 0.01062; billing, list price 0.01062; billing, upstream cost 0 194.
Tool gp_summarize_within; parameters {"stats": [{"stat": "sum", "field": "height_m"}], "project": "bceeca13-52a5-4344-bf84-77a2f9f8e186", "features": {"layer": "Towers (f7206b9b)"}, "group_by": "technology", "polygons": {"layer": "Neighborhoods (efbe8937)"}}
Summarize within
What this analysis is. Summarize within: Count and aggregate the features inside each polygon (or bin), proportionally for lines and polygons 192. In ArcGIS it is Summarize Within or Aggregate Points; in QGIS, native:countpointsinpolygon or native:sumlinelengths 192.
Why it was run on this data. Count Towers inside each feature of Neighborhoods by technology; the counts map as a choropleth (natural breaks, sequential colors) 193.
What it found. Summarize within on Small cells, Neighborhoods: Summarize within: 1 layer saved: Summarize within: Neighborhoods (16 features) 1217195. It reported result, count 16; result, elapsed ms 0; billing, cost 0.01112; billing, list price 0.01112; billing, upstream cost 0 195.
| Result | Value |
|---|---|
| result, count | 16 |
| result, elapsed ms | 0 |
| billing, cost | 0.01112 |
| billing, list price | 0.01112 |
| billing, upstream cost | 0 |
Findings
- Evidenced: Summarize within on Small cells, Neighborhoods: Summarize within: 1 layer saved: Summarize within: Neighborhoods (16 features) 1217195.
- Evidenced: It reported result, count 16; result, elapsed ms 0; billing, cost 0.01112; billing, list price 0.01112; billing, upstream cost 0 195.
Tool gp_summarize_within; parameters {"stats": [], "project": "bceeca13-52a5-4344-bf84-77a2f9f8e186", "features": {"layer": "Small cells (0b706ff2)"}, "group_by": "status", "polygons": {"layer": "Neighborhoods (efbe8937)"}}
Summarize within
What this analysis is. Summarize within: Count and aggregate the features inside each polygon (or bin), proportionally for lines and polygons 192. In ArcGIS it is Summarize Within or Aggregate Points; in QGIS, native:countpointsinpolygon or native:sumlinelengths 192.
Why it was run on this data. Count Towers inside each feature of Neighborhoods by technology; the counts map as a choropleth (natural breaks, sequential colors) 193.
What it found. Summarize within on Dropped calls, Neighborhoods: Summarize within: 1 layer saved: Summarize within: Neighborhoods (16 features) 1214196. It reported result, count 16; result, elapsed ms 3; billing, cost 0.04634; billing, list price 0.04634; billing, upstream cost 0 196.
| Result | Value |
|---|---|
| result, count | 16 |
| result, elapsed ms | 3 |
| billing, cost | 0.04634 |
| billing, list price | 0.04634 |
| billing, upstream cost | 0 |
Findings
- Evidenced: Summarize within on Dropped calls, Neighborhoods: Summarize within: 1 layer saved: Summarize within: Neighborhoods (16 features) 1214196.
- Evidenced: It reported result, count 16; result, elapsed ms 3; billing, cost 0.04634; billing, list price 0.04634; billing, upstream cost 0 196.
Tool gp_summarize_within; parameters {"stats": [{"stat": "sum", "field": "signal_dbm"}], "project": "bceeca13-52a5-4344-bf84-77a2f9f8e186", "features": {"layer": "Dropped calls (e2f5ccec)"}, "group_by": "cause", "polygons": {"layer": "Neighborhoods (efbe8937)"}}
Period change
What this analysis is. Period change: Counts or sums per period (week over week, month over month, any two periods, or before and after a date), per area, per H3 cell or in total, with the places of largest rise and fall and a significance note 197. In ArcGIS it is Summarize Percent Change (Crime Analysis) or Change Point Detection 197.
Why it was run on this data. Dropped calls carry dates in 'occurred_at' over 8 weeks: the count per week, week over week, with the places of largest rise and fall per feature of Neighborhoods and whether the change is beyond chance 198.
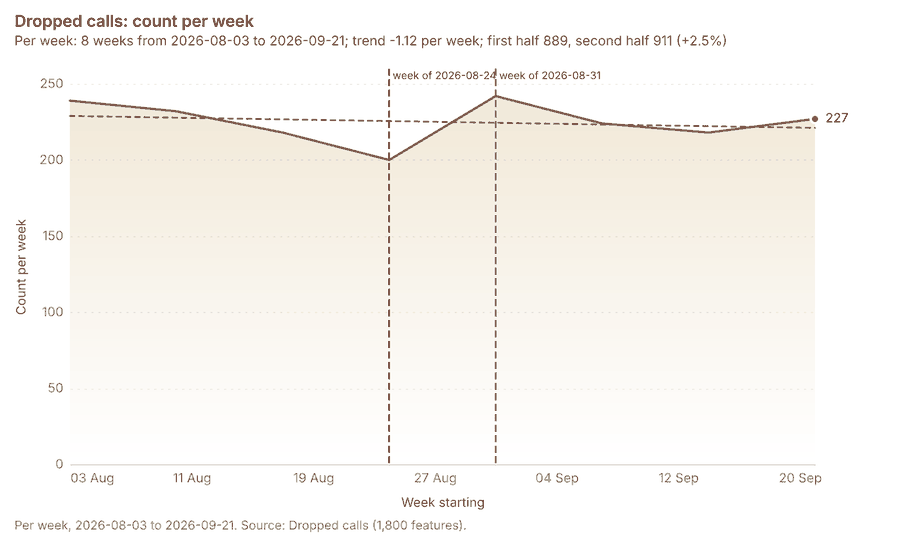
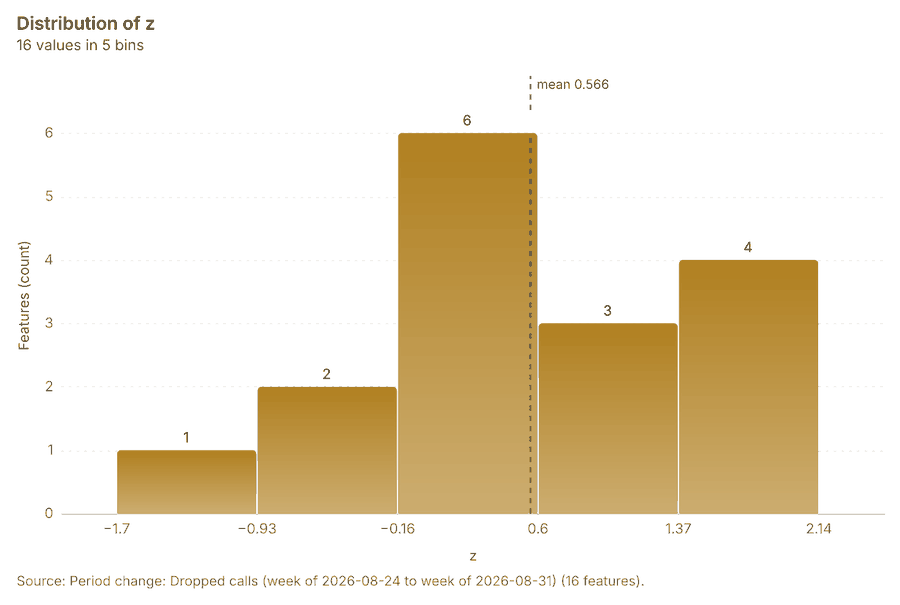
What it found. Period change on Neighborhoods, Dropped calls produced Period change: Dropped calls (week of 2026-08-24 to week of 2026-08-31) (16 features) 781214. Dropped calls: count per week shows a trend of -1.12 per week; the second half of its weeks has 911 against 889 in the first (+2.5%) 199. The chart Dropped calls: week of 2026-08-24 to week of 2026-08-31 by place is drawn from 30 rows 200. The chart Period change: Dropped calls (week of 2026-08-24 to week of 2026-08-31) is drawn from 5 rows 201.
Findings
- Evidenced: Period change on Neighborhoods, Dropped calls produced Period change: Dropped calls (week of 2026-08-24 to week of 2026-08-31) (16 features) 781214.
- Evidenced: Dropped calls: count per week shows a trend of -1.12 per week; the second half of its weeks has 911 against 889 in the first (+2.5%) 199.
- Evidenced: The chart Dropped calls: week of 2026-08-24 to week of 2026-08-31 by place is drawn from 30 rows 200.
- Evidenced: The chart Period change: Dropped calls (week of 2026-08-24 to week of 2026-08-31) is drawn from 5 rows 201.
Tool gp_period_change; parameters {"by": "area", "areas": {"layer": "Neighborhoods (efbe8937)"}, "period": "week", "project": "bceeca13-52a5-4344-bf84-77a2f9f8e186", "features": {"layer": "Dropped calls (e2f5ccec)"}, "area_field": "name", "time_field": "occurred_at"}
Period change
What this analysis is. Period change: Counts or sums per period (week over week, month over month, any two periods, or before and after a date), per area, per H3 cell or in total, with the places of largest rise and fall and a significance note 197. In ArcGIS it is Summarize Percent Change (Crime Analysis) or Change Point Detection 197.
Why it was run on this data. Dropped calls carry dates in 'occurred_at' over 8 weeks: the count per week, week over week, with the places of largest rise and fall per feature of Neighborhoods and whether the change is beyond chance 198.
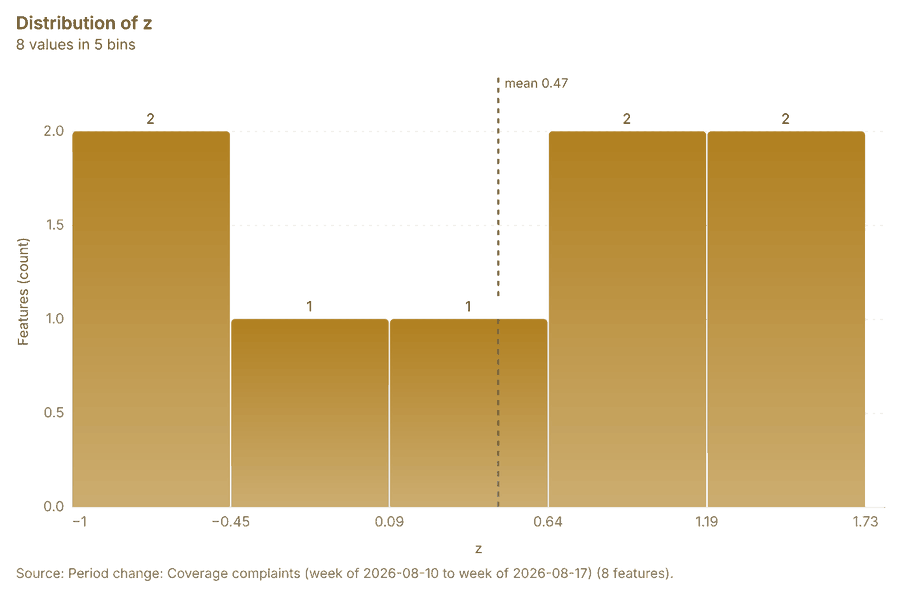
What it found. Period change on Neighborhoods, Coverage complaints produced Period change: Coverage complaints (week of 2026-08-10 to week of 2026-08-17) (8 features) 9101215. Coverage complaints: count per week shows a trend of +0.066 per week; the second half of its weeks has 222 against 198 in the first (+12.1%) 202. The chart Coverage complaints: week of 2026-08-10 to week of 2026-08-17 by place is drawn from 16 rows 203. The chart Period change: Coverage complaints (week of 2026-08-10 to week of 2026-08-17) is drawn from 5 rows 204.
Findings
- Evidenced: Period change on Neighborhoods, Coverage complaints produced Period change: Coverage complaints (week of 2026-08-10 to week of 2026-08-17) (8 features) 9101215.
- Evidenced: Coverage complaints: count per week shows a trend of +0.066 per week; the second half of its weeks has 222 against 198 in the first (+12.1%) 202.
- Evidenced: The chart Coverage complaints: week of 2026-08-10 to week of 2026-08-17 by place is drawn from 16 rows 203.
- Evidenced: The chart Period change: Coverage complaints (week of 2026-08-10 to week of 2026-08-17) is drawn from 5 rows 204.
Tool gp_period_change; parameters {"by": "area", "areas": {"layer": "Neighborhoods (efbe8937)"}, "period": "week", "project": "bceeca13-52a5-4344-bf84-77a2f9f8e186", "features": {"layer": "Coverage complaints (a0e6cf38)"}, "area_field": "name", "time_field": "date"}
Seasonality
What this analysis is. Seasonality: Counts by hour of day, day of week and month, with peaks and troughs per cycle and per area 205. In ArcGIS it is Time Series Clustering or Create Space Time Cube 205.
Why it was run on this data. Dropped calls by hour of day, day of week: the busiest and the quietest per feature of Neighborhoods, and whether the cycle is uneven beyond chance 206.
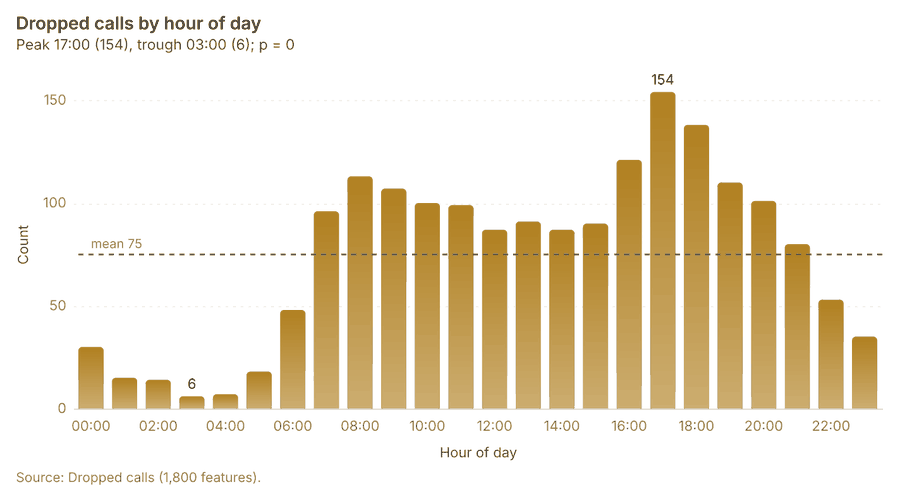
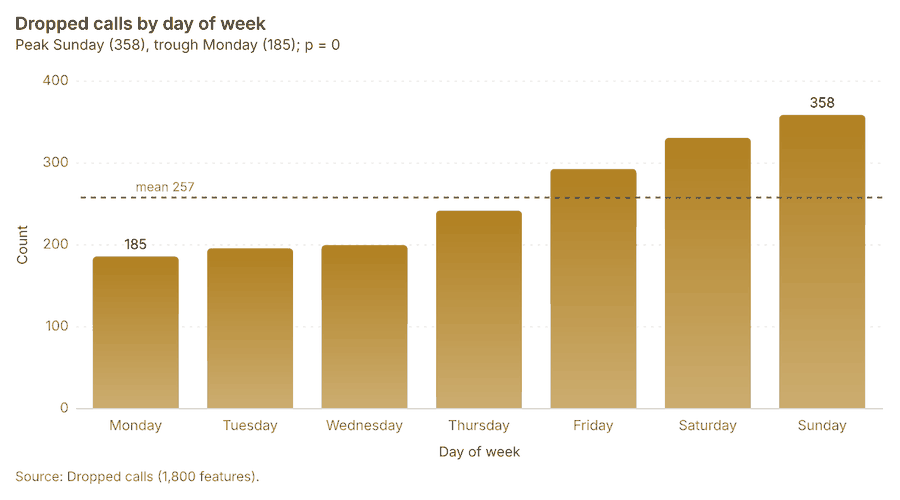
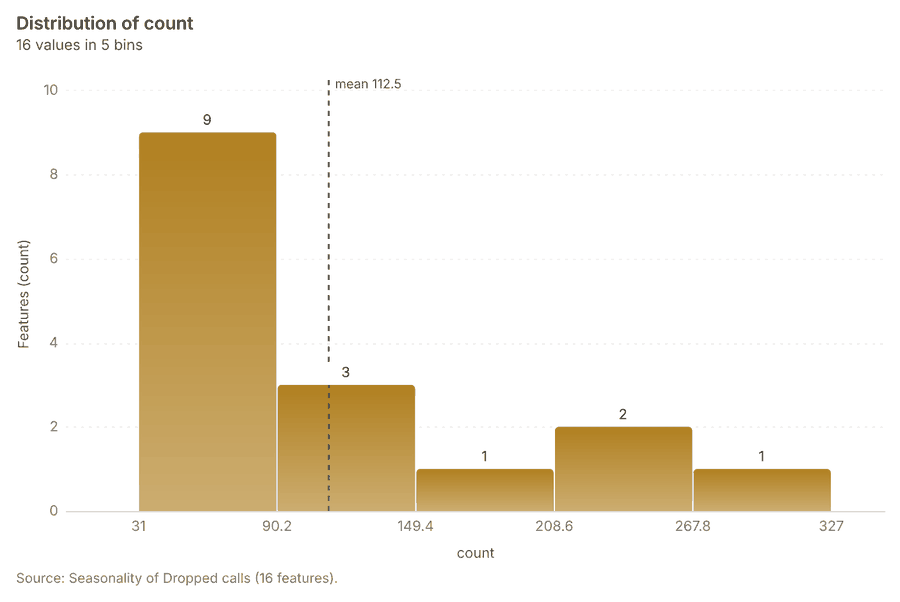
What it found. Seasonality on Neighborhoods, Dropped calls produced Seasonality of Dropped calls (16 features) 1214207208. The chart Dropped calls by hour of day is drawn from 24 rows 209. The chart Dropped calls by day of week is drawn from 7 rows 210. The chart Seasonality of Dropped calls is drawn from 5 rows 211.
Findings
- Evidenced: Seasonality on Neighborhoods, Dropped calls produced Seasonality of Dropped calls (16 features) 1214207208.
- Evidenced: The chart Dropped calls by hour of day is drawn from 24 rows 209.
- Evidenced: The chart Dropped calls by day of week is drawn from 7 rows 210.
- Evidenced: The chart Seasonality of Dropped calls is drawn from 5 rows 211.
Tool gp_seasonality; parameters {"by": "area", "areas": {"layer": "Neighborhoods (efbe8937)"}, "cycles": ["hour", "weekday"], "project": "bceeca13-52a5-4344-bf84-77a2f9f8e186", "features": {"layer": "Dropped calls (e2f5ccec)"}, "time_field": "occurred_at"}
Calculate density
What this analysis is. Calculate density: Kernel density per square kilometer on a grid 212. In ArcGIS it is Calculate Density or Kernel Density; in QGIS, native:heatmapkerneldensityestimation 212.
Why it was run on this data. 1800 points in Dropped calls: a density surface shows where they concentrate 213. Measured: Dropped calls are clustered (nearest-neighbor ratio 0.87, z = -10.7), median spacing 63 m 213.
What it found. Calculate density on Dropped calls: Calculate density: 1 layer saved: Calculate density: Dropped calls (2034 features) 14214. It reported result, count 2,034; result, elapsed ms 40; result, bandwidth m 500; result, cell size m 200; result, excluded null 0; result, max density per km2 368.1 214.
| Result | Value |
|---|---|
| result, count | 2,034 |
| result, elapsed ms | 40 |
| result, bandwidth m | 500 |
| result, cell size m | 200 |
| result, excluded null | 0 |
| result, max density per km2 | 368.1 |
| billing, cost | 0.086 |
| billing, list price | 0.086 |
| billing, upstream cost | 0 |
Findings
- Evidenced: Calculate density on Dropped calls: Calculate density: 1 layer saved: Calculate density: Dropped calls (2034 features) 14214.
- Evidenced: It reported result, count 2,034; result, elapsed ms 40; result, bandwidth m 500; result, cell size m 200; result, excluded null 0; result, max density per km2 368.1 214.
Tool gp_calculate_density; parameters {"kernel": "quartic", "project": "bceeca13-52a5-4344-bf84-77a2f9f8e186", "features": {"layer": "Dropped calls (e2f5ccec)"}, "bandwidth_m": 500.0, "cell_size_m": 200.0}
Calculate density
What this analysis is. Calculate density: Kernel density per square kilometer on a grid 212. In ArcGIS it is Calculate Density or Kernel Density; in QGIS, native:heatmapkerneldensityestimation 212.
Why it was run on this data. 420 points in Coverage complaints: a density surface shows where they concentrate 215. Measured: Coverage complaints are clustered (nearest-neighbor ratio 0.87, z = -5.0), median spacing 123 m 215.
What it found. The density analysis utilized the Coverage complaints data 15 and the gp_calculate_density tool 216. The coverage complaints dataset contained 383 features 216, and the calculated maximum density per km2 was 68.51 216.
| Result | Value |
|---|---|
| result, count | 383 |
| result, elapsed ms | 8 |
| result, bandwidth m | 1,000 |
| result, cell size m | 500 |
| result, excluded null | 0 |
| result, max density per km2 | 68.51 |
| billing, cost | 0.0584 |
| billing, list price | 0.0584 |
| billing, upstream cost | 0 |
Findings
- Evidenced: Calculate density on Coverage complaints: Calculate density: 1 layer saved: Calculate density: Coverage complaints (383 features) 15216.
- Evidenced: It reported result, count 383; result, elapsed ms 8; result, bandwidth m 1,000; result, cell size m 500; result, excluded null 0; result, max density per km2 68.51 216.
Tool gp_calculate_density; parameters {"kernel": "quartic", "project": "bceeca13-52a5-4344-bf84-77a2f9f8e186", "features": {"layer": "Coverage complaints (a0e6cf38)"}, "bandwidth_m": 1000.0, "cell_size_m": 500.0}
Calculate density
What this analysis is. Calculate density: Kernel density per square kilometer on a grid 212. In ArcGIS it is Calculate Density or Kernel Density; in QGIS, native:heatmapkerneldensityestimation 212.
Why it was run on this data. 40 points in Small cells: a density surface shows where they concentrate 217.
What it found. Calculate density on Small cells: Calculate density: 1 layer saved: Calculate density: Small cells (117 features) 17218. It reported result, count 117; result, elapsed ms 2; result, bandwidth m 2,000; result, cell size m 1,000; result, excluded null 0; result, max density per km2 2.571 218.
| Result | Value |
|---|---|
| result, count | 117 |
| result, elapsed ms | 2 |
| result, bandwidth m | 2,000 |
| result, cell size m | 1,000 |
| result, excluded null | 0 |
| result, max density per km2 | 2.571 |
| billing, cost | 0.0508 |
| billing, list price | 0.0508 |
| billing, upstream cost | 0 |
Findings
- Evidenced: Calculate density on Small cells: Calculate density: 1 layer saved: Calculate density: Small cells (117 features) 17218.
- Evidenced: It reported result, count 117; result, elapsed ms 2; result, bandwidth m 2,000; result, cell size m 1,000; result, excluded null 0; result, max density per km2 2.571 218.
Tool gp_calculate_density; parameters {"kernel": "quartic", "project": "bceeca13-52a5-4344-bf84-77a2f9f8e186", "features": {"layer": "Small cells (0b706ff2)"}, "bandwidth_m": 2000.0, "cell_size_m": 1000.0}
Find point clusters
What this analysis is. Find point clusters: Density-based clusters (DBSCAN, HDBSCAN or OPTICS, optionally space-time) with hulls and noise 219. In ArcGIS it is Find Point Clusters or Density-based Clustering; in QGIS, native:dbscanclustering or native:stdbscanclustering 219.
Why it was run on this data. DBSCAN finds dense groups of Dropped calls and separates noise 220. Measured: Dropped calls are clustered (nearest-neighbor ratio 0.87, z = -10.7), median spacing 63 m 220. DBSCAN at 100 m (twice the measured spacing) 220.
What it found. Find point clusters on Dropped calls: Find point clusters: 2 layers saved: Find point clusters: Dropped calls (1800 features); Find point clusters: cluster hulls (2 features) 14221. It reported result, count 1,800; result, noise 1,744; result, distance m 100; result, elapsed ms 133; result, min points 20; billing, cost 0.086 221.
| Result | Value |
|---|---|
| result, count | 1,800 |
| result, noise | 1,744 |
| result, distance m | 100 |
| result, elapsed ms | 133 |
| result, min points | 20 |
| billing, cost | 0.086 |
| billing, list price | 0.086 |
| billing, upstream cost | 0 |
Findings
- Evidenced: Find point clusters on Dropped calls: Find point clusters: 2 layers saved: Find point clusters: Dropped calls (1800 features); Find point clusters: cluster hulls (2 features) 14221.
- Evidenced: It reported result, count 1,800; result, noise 1,744; result, distance m 100; result, elapsed ms 133; result, min points 20; billing, cost 0.086 221.
Tool gp_find_point_clusters; parameters {"method": "dbscan", "project": "bceeca13-52a5-4344-bf84-77a2f9f8e186", "features": {"layer": "Dropped calls (e2f5ccec)"}, "distance_m": 100.0, "min_points": 20}
Find point clusters
What this analysis is. Find point clusters: Density-based clusters (DBSCAN, HDBSCAN or OPTICS, optionally space-time) with hulls and noise 219. In ArcGIS it is Find Point Clusters or Density-based Clustering; in QGIS, native:dbscanclustering or native:stdbscanclustering 219.
Why it was run on this data. DBSCAN finds dense groups of Coverage complaints and separates noise 222. Measured: Coverage complaints are clustered (nearest-neighbor ratio 0.87, z = -5.0), median spacing 123 m 222. DBSCAN at 200 m (twice the measured spacing) 222.
What it found. Find point clusters on Coverage complaints: Find point clusters: 2 layers saved: Find point clusters: Coverage complaints (420 features); Find point clusters: cluster hulls (1 feature) 15223. It reported result, count 420; result, noise 320; result, distance m 200; result, elapsed ms 5; result, min points 10; billing, cost 0.0584 223.
| Result | Value |
|---|---|
| result, count | 420 |
| result, noise | 320 |
| result, distance m | 200 |
| result, elapsed ms | 5 |
| result, min points | 10 |
| billing, cost | 0.0584 |
| billing, list price | 0.0584 |
| billing, upstream cost | 0 |
Findings
- Evidenced: Find point clusters on Coverage complaints: Find point clusters: 2 layers saved: Find point clusters: Coverage complaints (420 features); Find point clusters: cluster hulls (1 feature) 15223.
- Evidenced: It reported result, count 420; result, noise 320; result, distance m 200; result, elapsed ms 5; result, min points 10; billing, cost 0.0584 223.
Tool gp_find_point_clusters; parameters {"method": "dbscan", "project": "bceeca13-52a5-4344-bf84-77a2f9f8e186", "features": {"layer": "Coverage complaints (a0e6cf38)"}, "distance_m": 200.0, "min_points": 10}
Nearest neighbor index
What this analysis is. Average nearest neighbor: Clark-Evans ratio: clustered, dispersed or random 224. In ArcGIS it is Average Nearest Neighbor; in QGIS, native:nearestneighbouranalysis 224.
Why it was run on this data. The average nearest neighbor ratio says whether Towers are clustered, random or dispersed 225. Measured: Towers are dispersed (nearest-neighbor ratio 1.82, z = +5.8), median spacing 1.36e+03 m 225. The profile measured it already; the tool draws it 225.
What it found. Nearest neighbor index on Towers: Average nearest neighbor: done; no map output 13226. It reported result, n 14; result, p value 0; result, z score 8.397; result, elapsed ms 0; result, study area m2 23,117,306; result, nearest neighbor ratio 2.173 226.
| Result | Value |
|---|---|
| result, n | 14 |
| result, p value | 0 |
| result, z score | 8.397 |
| result, elapsed ms | 0 |
| result, study area m2 | 23,117,306 |
| result, nearest neighbor ratio | 2.173 |
| result, expected mean distance m | 642.5 |
| result, observed mean distance m | 1,396 |
| billing, cost | 0.02 |
| billing, list price | 0.02 |
| billing, upstream cost | 0 |
Findings
- Evidenced: Nearest neighbor index on Towers: Average nearest neighbor: done; no map output 13226.
- Evidenced: It reported result, n 14; result, p value 0; result, z score 8.397; result, elapsed ms 0; result, study area m2 23,117,306; result, nearest neighbor ratio 2.173 226.
A model draft was discarded because a sentence did not cite a source of this section.
Tool gp_nearest_neighbor_index; parameters {"project": "bceeca13-52a5-4344-bf84-77a2f9f8e186", "features": {"layer": "Towers (f7206b9b)"}}
Outliers
What this analysis is. Find outliers: Anselin local Moran’s I: HH, LL clusters and HL, LH outliers 227. In ArcGIS it is Find Outliers or Cluster and Outlier Analysis (Anselin Local Moran’s I) 227.
Why it was run on this data. Local Moran's I maps clusters and outliers of 'population' 228. Measured: Neighborhoods have 34 neighboring pairs (4.25 neighbors per area, 0 isolated), so neighbors can be compared 228.
What it found. Outliers on Neighborhoods: Find outliers: 1 layer saved: Find outliers: Neighborhoods (16 features) 12229. It reported result, count 16; result, elapsed ms 2; result, permutations 199; result, excluded null 0; result, distance band m 1,998; billing, cost 0.05048 229.
| Result | Value |
|---|---|
| result, count | 16 |
| result, elapsed ms | 2 |
| result, permutations | 199 |
| result, excluded null | 0 |
| result, distance band m | 1,998 |
| billing, cost | 0.05048 |
| billing, list price | 0.05048 |
| billing, upstream cost | 0 |
Findings
- Evidenced: Outliers on Neighborhoods: Find outliers: 1 layer saved: Find outliers: Neighborhoods (16 features) 12229.
- Evidenced: It reported result, count 16; result, elapsed ms 2; result, permutations 199; result, excluded null 0; result, distance band m 1,998; billing, cost 0.05048 229.
Tool gp_outliers; parameters {"field": "population", "project": "bceeca13-52a5-4344-bf84-77a2f9f8e186", "features": {"layer": "Neighborhoods (efbe8937)"}, "aggregation": "hexagon"}
Spatial autocorrelation
What this analysis is. Spatial autocorrelation: Global Moran’s I: is the pattern clustered, dispersed or random 230. In ArcGIS it is Spatial Autocorrelation (Global Moran’s I) 230.
Why it was run on this data. Global Moran's I says whether similar values of 'population' sit next to each other 231. Measured: Neighborhoods have 34 neighboring pairs (4.25 neighbors per area, 0 isolated), so neighbors can be compared 231.
What it found. Using the gp_spatial_autocorrelation tool 232, an analysis was performed on the Neighborhood
| Result | Value |
|---|---|
| result, n | 16 |
| result, p value | 0.1783 |
| result, z score | 1.346 |
| result, morans i | 0.2856 |
| result, variance | 0.06851 |
| result, elapsed ms | 1 |
| result, expected i | -0.06667 |
| result, excluded null | 0 |
| result, distance band m | 1,998 |
| result, p value normality | 0.1654 |
| result, z score normality | 1.387 |
| result, variance normality | 0.0645 |
| billing, cost | 0.02 |
| billing, list price | 0.02 |
| billing, upstream cost | 0 |
Findings
- Evidenced: Spatial autocorrelation on Neighborhoods: Spatial autocorrelation: done; no map output 12232.
- Evidenced: It reported result, n 16; result, p value 0.1783; result, z score 1.346; result, morans i 0.2856; result, variance 0.06851; result, elapsed ms 1 232.
Tool gp_spatial_autocorrelation; parameters {"field": "population", "project": "bceeca13-52a5-4344-bf84-77a2f9f8e186", "features": {"layer": "Neighborhoods (efbe8937)"}}
What follows from the results
Change beside the counts per neighborhood, from Period change: Dropped calls (week of 2026-08-24 to week of 2026-08-31) and Summarize within: Neighborhoods: the busiest area, El Cerro (327 in all), changed by -4 2357196. Change of dropped calls where density is high, from Period change: Dropped calls (week of 2026-08-24 to week of 2026-08-31) and Calculate density: Coverage complaints: the largest rise (+13, Los Olivos) is where density averages 13.48 per square kilometer 2387216. Hot cells of dropped calls per neighborhood, from Hot spot analysis: Dropped calls: 6 of 16 areas hold hot spot cells; El Cerro holds the most (49) 241182. Nearest tower to each cluster of dropped calls, from Find point clusters: cluster hulls: the 2 clusters lie 1,164 to 1,536 m from the nearest facility (Tower 13 Los Pinos and others) 246221. Dense areas of coverage complaints, from Calculate density: Coverage complaints: the densest of five classes joins 77 cells into one area 251216. Change of coverage complaints per neighborhood, from Period change: Coverage complaints (week of 2026-08-10 to week of 2026-08-17): Los Olivos rose the most (+3) and La Ribera fell the most (-1) 2539. Clusters of all inputs together: dropped calls and coverage complaints, from Find point clusters: Dropped calls and Find point clusters: Coverage complaints: 2220 features from 2 sources 256221223. Towers within 250 m of each cluster of dropped calls, from Find point clusters: cluster hulls: 0 of 2 clusters have one within 250 m 260221.
Findings
- Evidenced: Change beside the counts per neighborhood, from Period change: Dropped calls (week of 2026-08-24 to week of 2026-08-31) and Summarize within: Neighborhoods: the busiest area, El Cerro (327 in all), changed by -4 2357196.
- Evidenced: Change of dropped calls where density is high, from Period change: Dropped calls (week of 2026-08-24 to week of 2026-08-31) and Calculate density: Coverage complaints: the largest rise (+13, Los Olivos) is where density averages 13.48 per square kilometer 2387216.
- Evidenced: Hot cells of dropped calls per neighborhood, from Hot spot analysis: Dropped calls: 6 of 16 areas hold hot spot cells; El Cerro holds the most (49) 241182.
- Evidenced: Nearest tower to each cluster of dropped calls, from Find point clusters: cluster hulls: the 2 clusters lie 1,164 to 1,536 m from the nearest facility (Tower 13 Los Pinos and others) 246221.
- Evidenced: Dense areas of coverage complaints, from Calculate density: Coverage complaints: the densest of five classes joins 77 cells into one area 251216.
- Evidenced: Change of coverage complaints per neighborhood, from Period change: Coverage complaints (week of 2026-08-10 to week of 2026-08-17): Los Olivos rose the most (+3) and La Ribera fell the most (-1) 2539.
- Evidenced: Clusters of all inputs together: dropped calls and coverage complaints, from Find point clusters: Dropped calls and Find point clusters: Coverage complaints: 2220 features from 2 sources 256221223.
- Evidenced: Towers within 250 m of each cluster of dropped calls, from Find point clusters: cluster hulls: 0 of 2 clusters have one within 250 m 260221.
Change beside the counts per neighborhood
What this analysis is. Spatial join: Attach attributes (or aggregates) of matching features from another layer, by location, distance, time and attributes 233. In ArcGIS it is Join Features or Spatial Join; in QGIS, native:joinattributesbylocation or native:joinbylocationsummary 233.
Why it was run on this data. Attach the Neighborhoods attributes to each of Towers 234.
What it found. The spatial join tool was executed using Summarize within: Neighborhoods 236 as an input, in conjunction with Period change: Dropped calls (week of 2026-
| Result | Value |
|---|---|
| result, count | 16 |
| result, elapsed ms | 1 |
| billing, cost | 0.01066 |
| billing, list price | 0.01066 |
| billing, upstream cost | 0 |
Findings
- Evidenced: Spatial join on Summarize within: Neighborhoods, Period change: Dropped calls (week of 2026-08-24 to week of 2026-08-31) produced Change beside the counts per neighborhood (16 features) 8235236237.
- Evidenced: It reported result, count 16; result, elapsed ms 1; billing, cost 0.01066; billing, list price 0.01066; billing, upstream cost 0 235.
Tool gp_spatial_join; parameters {"join": {"layer": "Summarize within: Neighborhoods (07b9a4cd)"}, "fields": ["count"], "target": {"layer": "Period change: Dropped calls (week of 2026-08-24 to week of 2026-08-31) (9e66bb0d)"}, "project": "bceeca13-52a5-4344-bf84-77a2f9f8e186", "predicate": "largest_overlap", "output_name": "Change beside the counts per neighborhood"}
Change of dropped calls where density is high
What this analysis is. Spatial join: Attach attributes (or aggregates) of matching features from another layer, by location, distance, time and attributes 233. In ArcGIS it is Join Features or Spatial Join; in QGIS, native:joinattributesbylocation or native:joinbylocationsummary 233.
Why it was run on this data. Attach the Neighborhoods attributes to each of Towers 234.
What it found. Spatial join on Calculate density: Coverage complaints, Period change: Dropped calls (week of 2026-08-24 to week of 2026-08-31) produced Change of dropped calls where density is high (16 features) 8238239240. It reported result, count 16; result, elapsed ms 1; billing, cost 0.018; billing, list price 0.018; billing, upstream cost 0 238.
| Result | Value |
|---|---|
| result, count | 16 |
| result, elapsed ms | 1 |
| billing, cost | 0.018 |
| billing, list price | 0.018 |
| billing, upstream cost | 0 |
Findings
- Evidenced: Spatial join on Calculate density: Coverage complaints, Period change: Dropped calls (week of 2026-08-24 to week of 2026-08-31) produced Change of dropped calls where density is high (16 features) 8238239240.
- Evidenced: It reported result, count 16; result, elapsed ms 1; billing, cost 0.018; billing, list price 0.018; billing, upstream cost 0 238.
Tool gp_spatial_join; parameters {"join": {"layer": "Calculate density: Coverage complaints (1d475898)"}, "stats": [{"agg": "mean", "field": "density_per_km2"}], "target": {"layer": "Period change: Dropped calls (week of 2026-08-24 to week of 2026-08-31) (9e66bb0d)"}, "project": "bceeca13-52a5-4344-bf84-77a2f9f8e186", "predicate": "intersects", "output_name": "Change of dropped calls where density is high"}
Hot cells of dropped calls per neighborhood
What this analysis is. Summarize within: Count and aggregate the features inside each polygon (or bin), proportionally for lines and polygons 192. In ArcGIS it is Summarize Within or Aggregate Points; in QGIS, native:countpointsinpolygon or native:sumlinelengths 192.
Why it was run on this data. Count Towers inside each feature of Neighborhoods by technology; the counts map as a choropleth (natural breaks, sequential colors) 193.
What it found. The analysis began with Neighborhoods 12 and incorporated Hot spot analysis: Dropped calls 242.
| Result | Value |
|---|---|
| result, count | 16 |
| result, elapsed ms | 32 |
| billing, cost | 0.04628 |
| billing, list price | 0.04628 |
| billing, upstream cost | 0 |
Findings
- Evidenced: Summarize within on Hot spot analysis: Dropped calls, Neighborhoods produced Hot cells of dropped calls per neighborhood (16 features) 12241242243.
- Evidenced: It reported result, count 16; result, elapsed ms 32; billing, cost 0.04628; billing, list price 0.04628; billing, upstream cost 0 241.
Tool gp_summarize_within; parameters {"project": "bceeca13-52a5-4344-bf84-77a2f9f8e186", "features": {"layer": "Hot spot analysis: Dropped calls (1dbf3768)"}, "group_by": "gi_bin", "polygons": {"layer": "Neighborhoods (efbe8937)"}, "output_name": "Hot cells of dropped calls per neighborhood"}
Nearest tower to each cluster of dropped calls
What this analysis is. Find nearest: The k nearest features for each input, with geodesic distance and bearing 244. In ArcGIS it is Find Nearest or Near; in QGIS, native:joinbynearest or native:nearestneighbouranalysis 244.
Why it was run on this data. It was run toward the goal "Describe the project Sample: Telecom, Medellin: run the analyses that tell the most about its data, draw every result, and write a cited report" 245.
What it found. Find nearest on Towers, Find point clusters: cluster hulls produced Nearest tower to each cluster of dropped calls (2 features) 13246247248. It reported result, count 2; result, elapsed ms 1; billing, cost 0.01032; billing, list price 0.01032; billing, upstream cost 0 246.
| Result | Value |
|---|---|
| result, count | 2 |
| result, elapsed ms | 1 |
| billing, cost | 0.01032 |
| billing, list price | 0.01032 |
| billing, upstream cost | 0 |
Findings
- Evidenced: Find nearest on Towers, Find point clusters: cluster hulls produced Nearest tower to each cluster of dropped calls (2 features) 13246247248.
- Evidenced: It reported result, count 2; result, elapsed ms 1; billing, cost 0.01032; billing, list price 0.01032; billing, upstream cost 0 246.
Tool gp_find_nearest; parameters {"k": 1, "to": {"layer": "Towers (f7206b9b)"}, "from": {"layer": "Find point clusters: cluster hulls (5313780d)"}, "project": "bceeca13-52a5-4344-bf84-77a2f9f8e186", "output_name": "Nearest tower to each cluster of dropped calls"}
Dense areas of coverage complaints
What this analysis is. Pipeline: Run up to 20 GIS operations in one engine call; a step's params may use "$id" (an earlier step's result) or "$id.key", and layer references 249. Every step's map outputs are saved as styled layers 249.
Why it was run on this data. Neighborhoods holds population in 'population': Towers per 10,000 people in each feature compares features of different size; mapped as a choropleth (natural breaks, sequential colors) 250.
What it found. Pipeline on Calculate density: Coverage complaints produced Dense areas of coverage complaints (5 features) 239251252. It reported result, count 5; result, elapsed ms 6; billing, cost 0.02767; billing, list price 0.02767; billing, upstream cost 0; list price 0.02767 251.
| Result | Value |
|---|---|
| result, count | 5 |
| result, elapsed ms | 6 |
| billing, cost | 0.02767 |
| billing, list price | 0.02767 |
| billing, upstream cost | 0 |
| list price | 0.02767 |
Findings
- Evidenced: Pipeline on Calculate density: Coverage complaints produced Dense areas of coverage complaints (5 features) 239251252.
- Evidenced: It reported result, count 5; result, elapsed ms 6; billing, cost 0.02767; billing, list price 0.02767; billing, upstream cost 0; list price 0.02767 251.
A model draft was discarded because a sentence did not cite a source of this section.
Tool gp_pipeline; parameters {"save": "final", "steps": [{"id": "classes", "params": {"field": "density_per_km2", "method": "quantile", "classes": 5, "features": {"layer": "Calculate density: Coverage complaints (1d475898)"}}, "operation": "classify_field"}, {"id": "areas", "params": {"by": ["class"], "features": "$classes"}, "operation": "dissolve"}], "project": "bceeca13-52a5-4344-bf84-77a2f9f8e186", "output_name": "Dense a
Change of coverage complaints per neighborhood
What this analysis is. Summarize within: Count and aggregate the features inside each polygon (or bin), proportionally for lines and polygons 192. In ArcGIS it is Summarize Within or Aggregate Points; in QGIS, native:countpointsinpolygon or native:sumlinelengths 192.
Why it was run on this data. Count Towers inside each feature of Neighborhoods by technology; the counts map as a choropleth (natural breaks, sequential colors) 193.
What it found. Summarize within on Period change: Coverage complaints (week of 2026-08-10 to week of 2026-08-17), Neighborhoods produced Change of coverage complaints per neighborhood (16 features) 1012253254. It reported result, count 16; result, elapsed ms 1; billing, cost 0.0105; billing, list price 0.0105; billing, upstream cost 0 253.
| Result | Value |
|---|---|
| result, count | 16 |
| result, elapsed ms | 1 |
| billing, cost | 0.0105 |
| billing, list price | 0.0105 |
| billing, upstream cost | 0 |
Findings
- Evidenced: Summarize within on Period change: Coverage complaints (week of 2026-08-10 to week of 2026-08-17), Neighborhoods produced Change of coverage complaints per neighborhood (16 features) 1012253254.
- Evidenced: It reported result, count 16; result, elapsed ms 1; billing, cost 0.0105; billing, list price 0.0105; billing, upstream cost 0 253.
Tool gp_summarize_within; parameters {"stats": [{"agg": "sum", "field": "change"}], "project": "bceeca13-52a5-4344-bf84-77a2f9f8e186", "features": {"layer": "Period change: Coverage complaints (week of 2026-08-10 to week of 2026-08-17) (b22b41b5)"}, "polygons": {"layer": "Neighborhoods (efbe8937)"}, "output_name": "Change of coverage complaints per neighborhood"}
Clusters of all inputs together: dropped calls and coverage complaints
What this analysis is. Pipeline: Run up to 20 GIS operations in one engine call; a step's params may use "$id" (an earlier step's result) or "$id.key", and layer references 249. Every step's map outputs are saved as styled layers 249.
Why it was run on this data. Neighborhoods holds population in 'population': Dropped calls per 10,000 people in each feature compares features of different size; mapped as a choropleth (natural breaks, sequential colors) 255.
What it found. Pipeline on Dropped calls, Coverage complaints produced Find point clusters: cluster hulls (3 features), Clusters of all inputs together: dropped calls and coverage complaints (2,220 features) 1415256257258. It reported result, count 2,220; result, noise 2,093; result, distance m 100; result, elapsed ms 24; result, min points 20; billing, cost 0.1044 256. Clusters of all inputs together: dropped calls and coverage complaints over time shows a trend of -1.12 per week; the second half of its weeks has 911 against 889 in the first (+2.5%) 259.
| Result | Value |
|---|---|
| result, count | 2,220 |
| result, noise | 2,093 |
| result, distance m | 100 |
| result, elapsed ms | 24 |
| result, min points | 20 |
| billing, cost | 0.1044 |
| billing, list price | 0.1044 |
| billing, upstream cost | 0 |
| list price | 0.1044 |
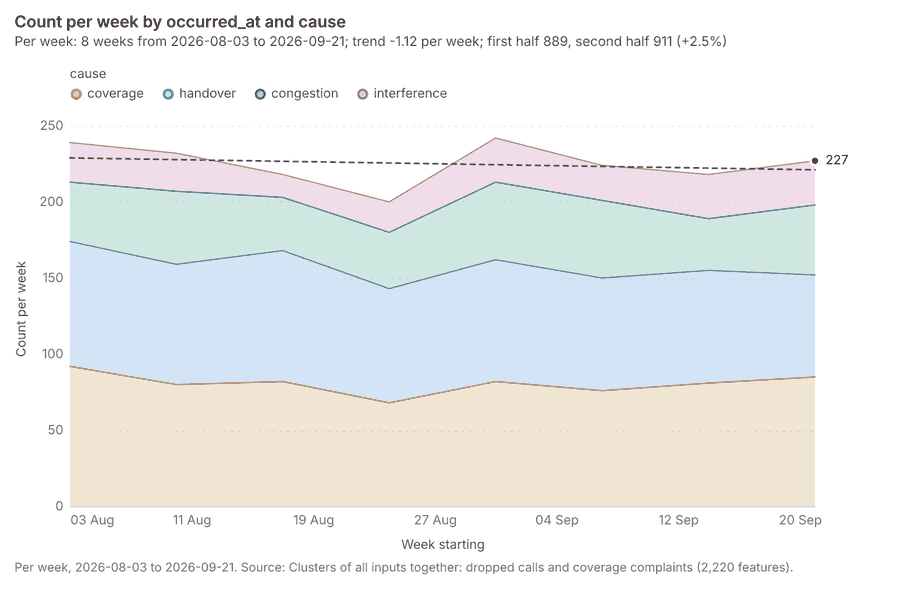
Findings
- Evidenced: Pipeline on Dropped calls, Coverage complaints produced Find point clusters: cluster hulls (3 features), Clusters of all inputs together: dropped calls and coverage complaints (2,220 features) 1415256257258.
- Evidenced: It reported result, count 2,220; result, noise 2,093; result, distance m 100; result, elapsed ms 24; result, min points 20; billing, cost 0.1044 256.
- Evidenced: Clusters of all inputs together: dropped calls and coverage complaints over time shows a trend of -1.12 per week; the second half of its weeks has 911 against 889 in the first (+2.5%) 259.
Tool gp_pipeline; parameters {"save": "final", "steps": [{"id": "merged", "params": {"layers": [{"layer": "Dropped calls (e2f5ccec)"}, {"layer": "Coverage complaints (a0e6cf38)"}], "source_field": "source"}, "operation": "merge_layers"}, {"id": "joint", "params": {"method": "dbscan", "features": "$merged", "distance_m": 100.0, "min_points": 20}, "operation": "find_point_clusters"}], "project": "bceeca13-52a5-4344-bf84-77a2f9f
Towers within 250 m of each cluster of dropped calls
What this analysis is. Pipeline: Run up to 20 GIS operations in one engine call; a step's params may use "$id" (an earlier step's result) or "$id.key", and layer references 249. Every step's map outputs are saved as styled layers 249.
Why it was run on this data. Neighborhoods holds population in 'population': Towers per 10,000 people in each feature compares features of different size; mapped as a choropleth (natural breaks, sequential colors) 250.
What it found. The analysis utilized Towers as input 13 through the gp_pipeline tool 260, which found point clusters: cluster hulls 247 as part of its process. This pipeline generated an output layer detailing Towers within 250 m of each cluster of dropped calls, consisting of 2 features 261.
| Result | Value |
|---|---|
| result, count | 2 |
| result, elapsed ms | 0 |
| billing, cost | 0.02034 |
| billing, list price | 0.02034 |
| billing, upstream cost | 0 |
| list price | 0.02034 |
Findings
- Evidenced: Pipeline on Find point clusters: cluster hulls, Towers produced Towers within 250 m of each cluster of dropped calls (2 features) 13247260261.
- Evidenced: It reported result, count 2; result, elapsed ms 0; billing, cost 0.02034; billing, list price 0.02034; billing, upstream cost 0; list price 0.02034 260.
Tool gp_pipeline; parameters {"save": "final", "steps": [{"id": "buffer", "params": {"features": {"layer": "Find point clusters: cluster hulls (5313780d)"}, "distance_m": 250}, "operation": "buffer"}, {"id": "count", "params": {"features": {"layer": "Towers (f7206b9b)"}, "polygons": "$buffer"}, "operation": "summarize_within"}], "project": "bceeca13-52a5-4344-bf84-77a2f9f8e186", "output_name": "Towers within 250 m of each clu
Maps and charts
The run also made 22 chart(s) 262263264265266267268269270271272273274275276277278279280281282283.
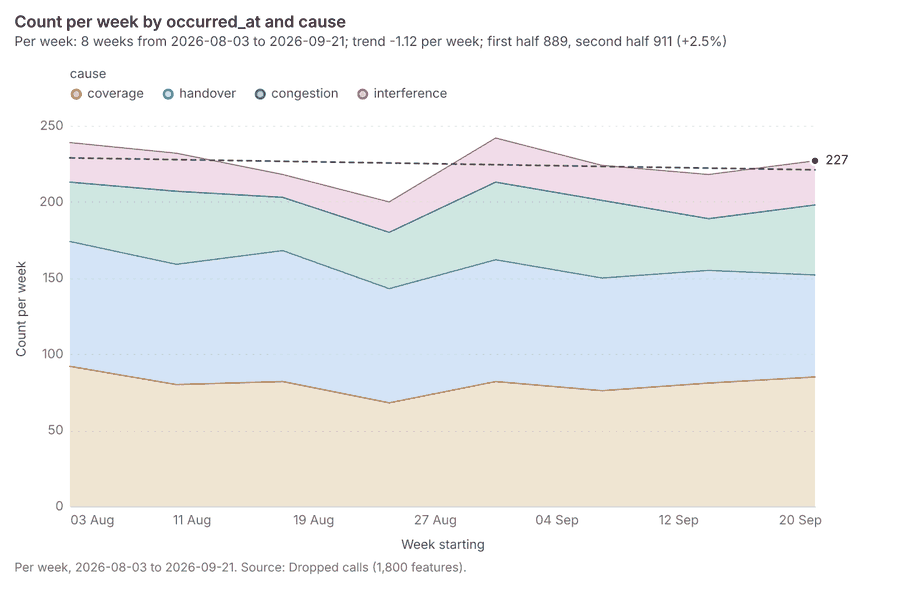
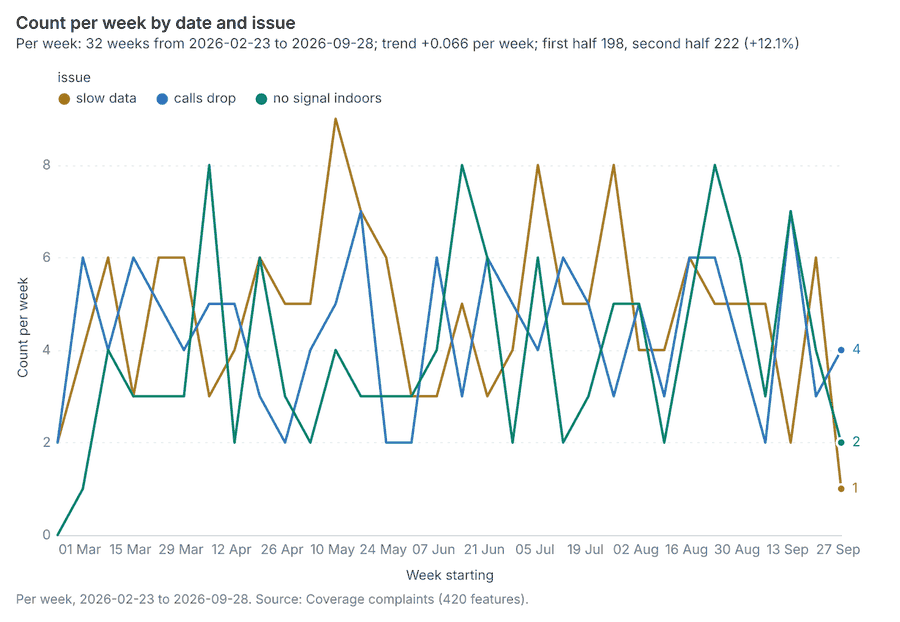
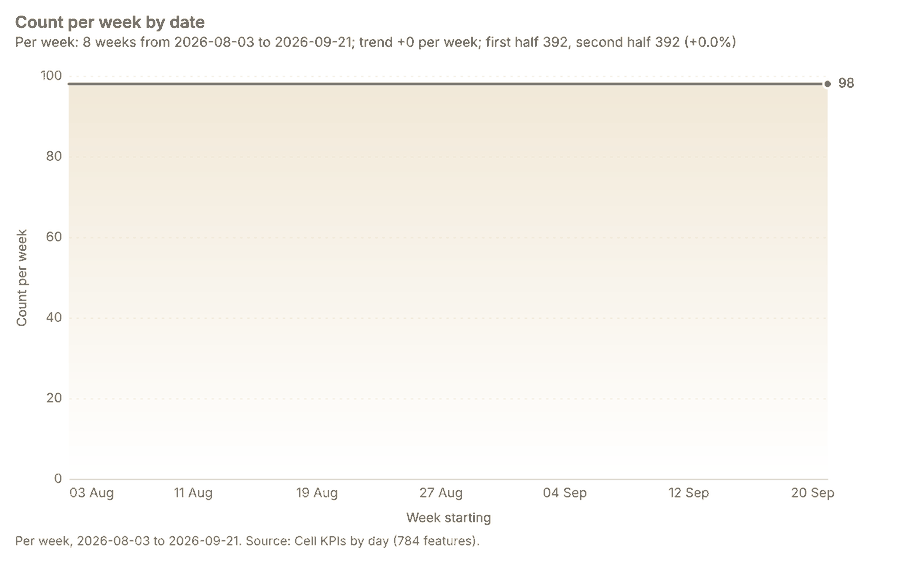
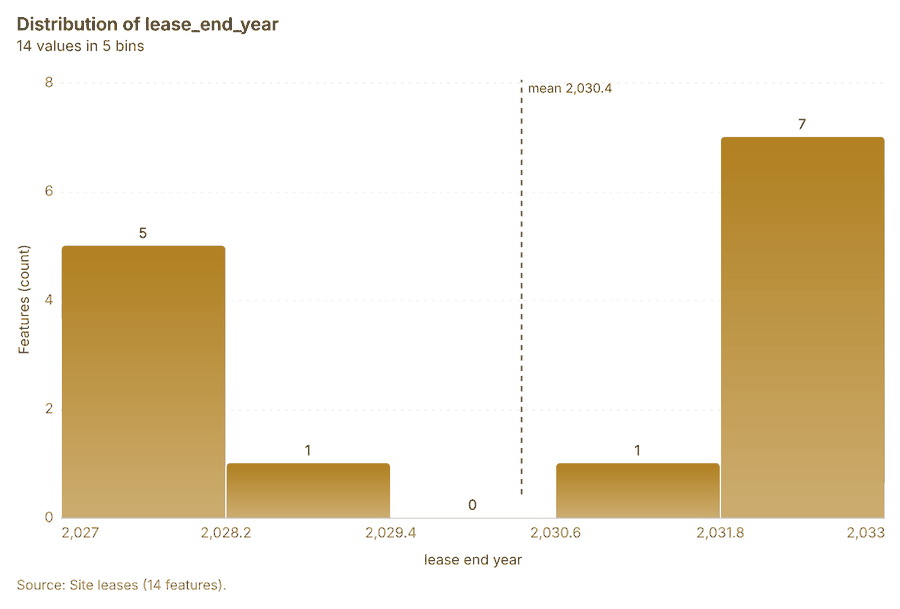
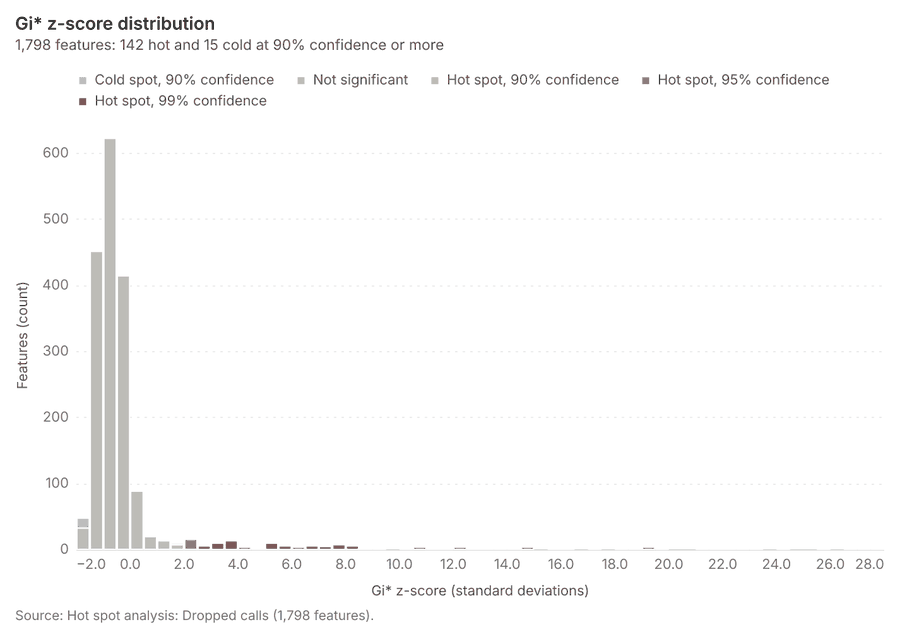
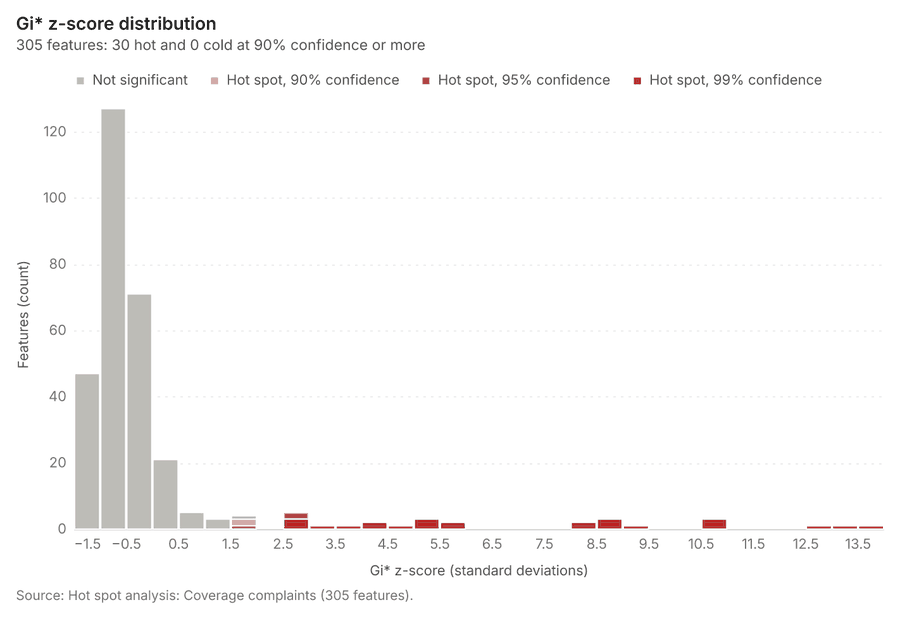
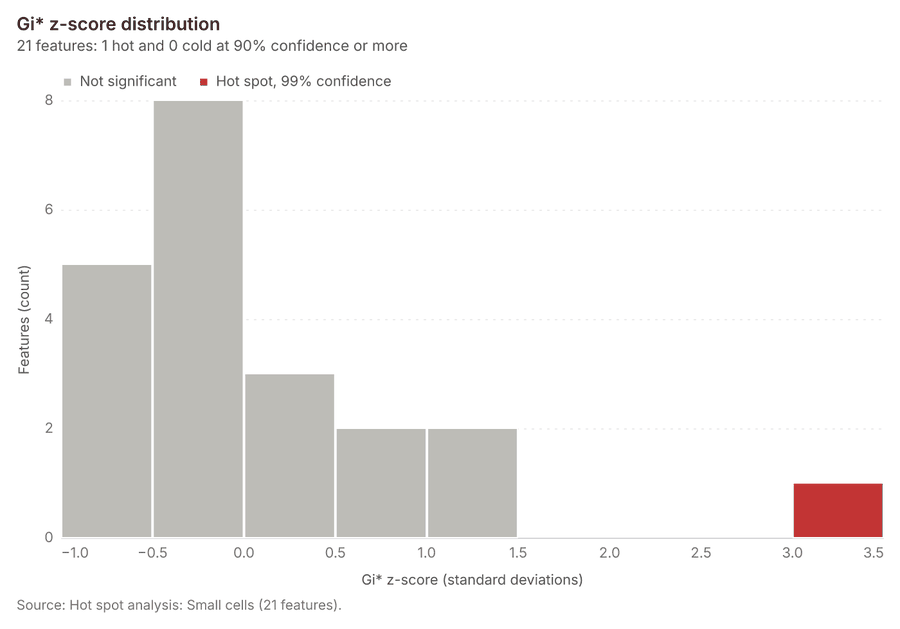
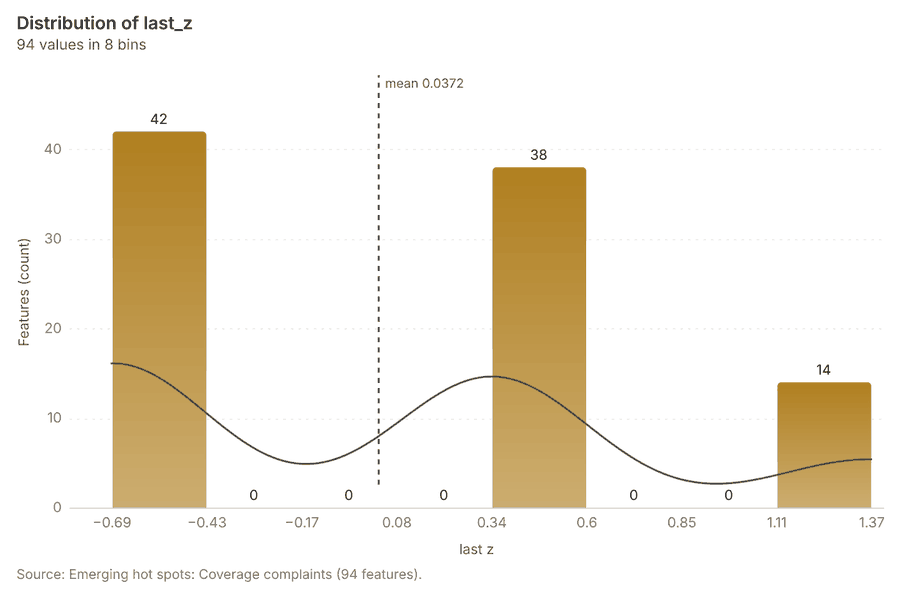
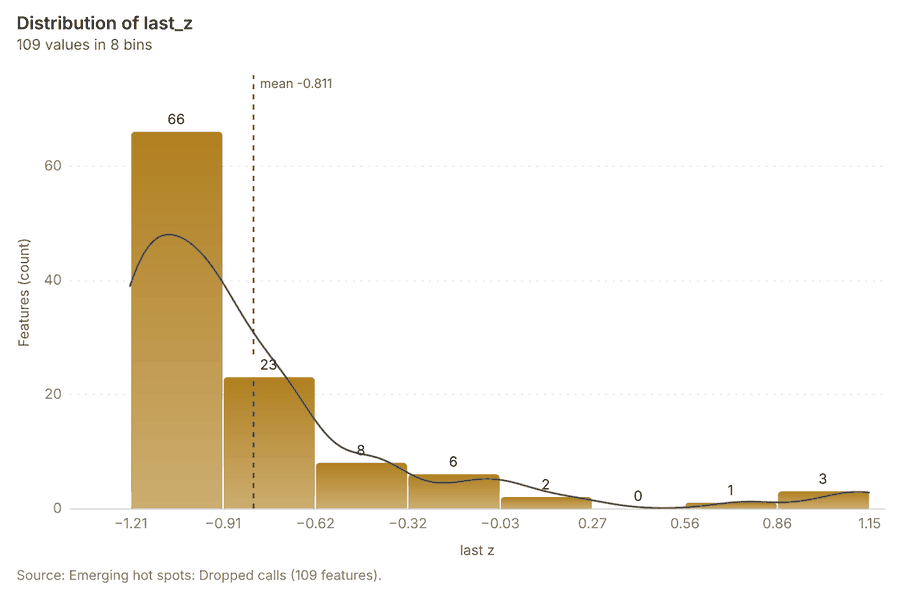
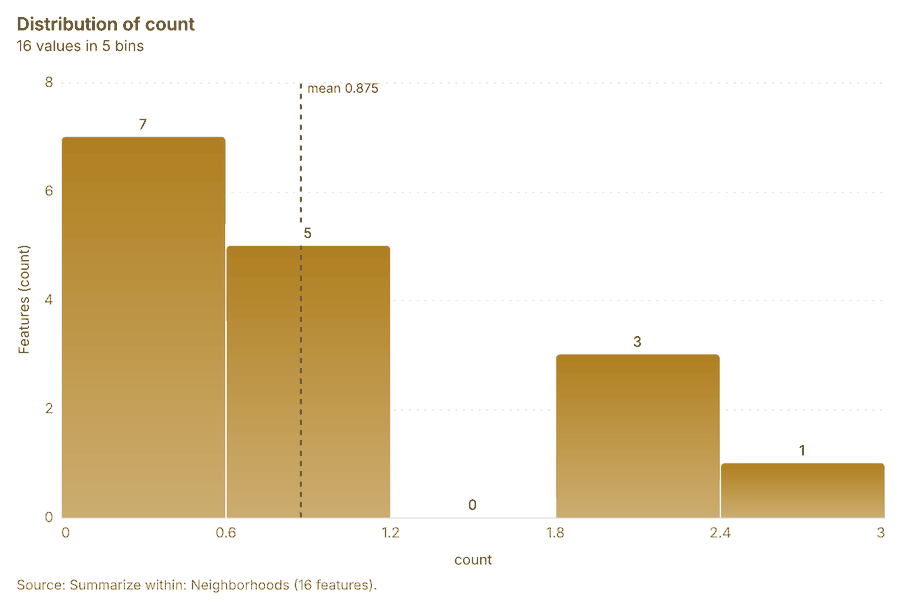
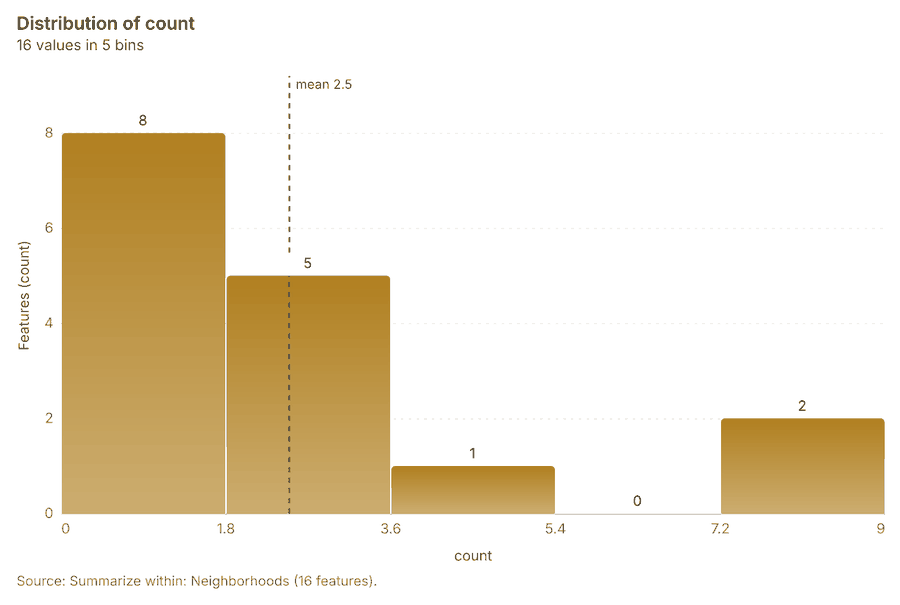
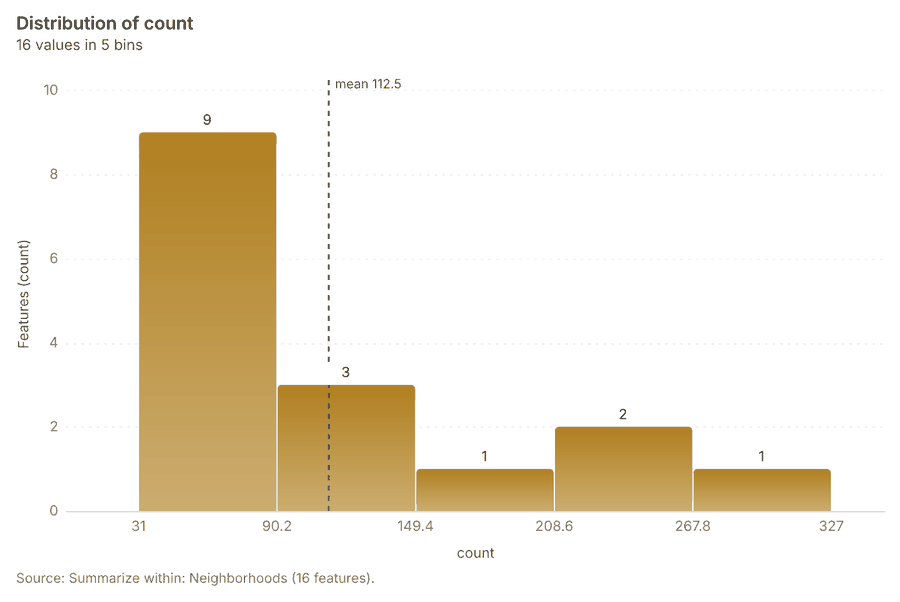
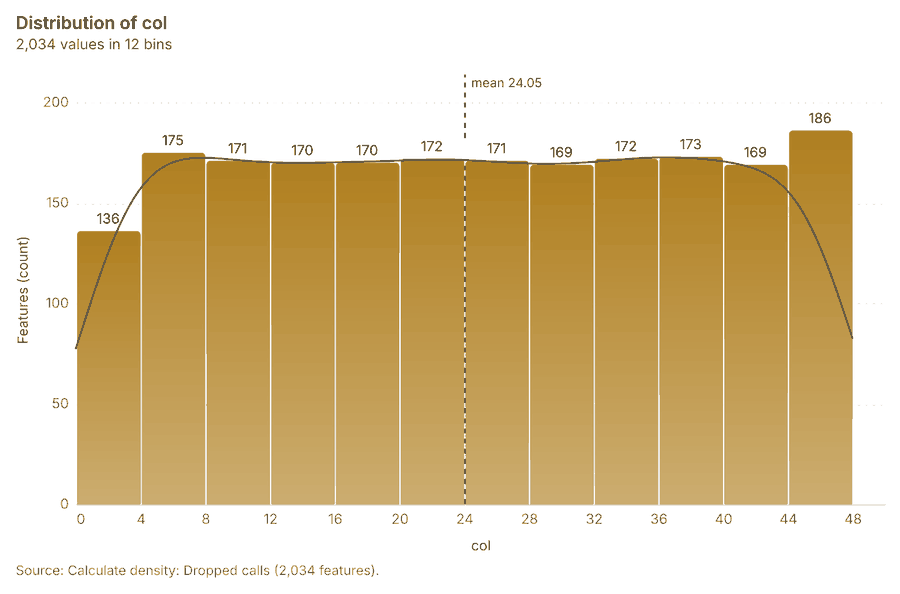
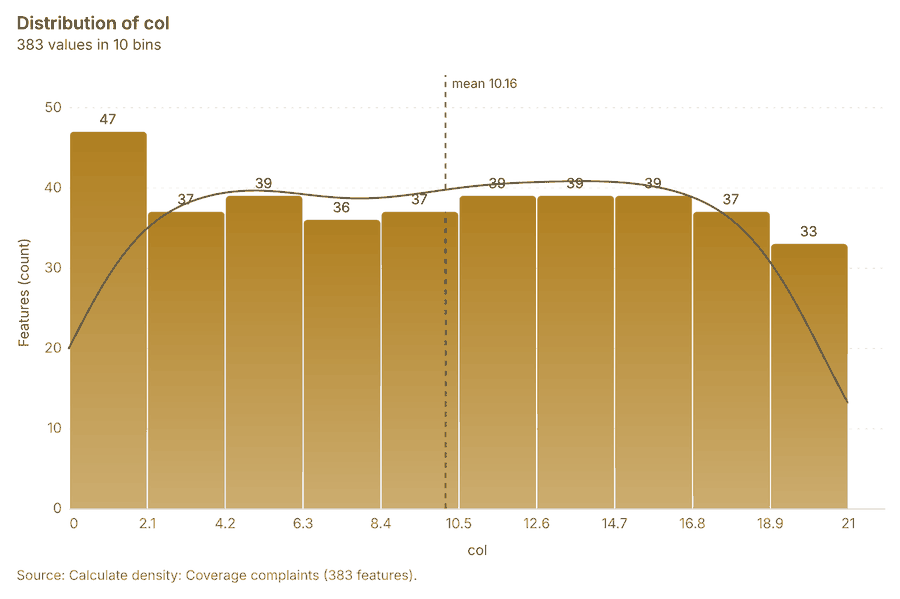
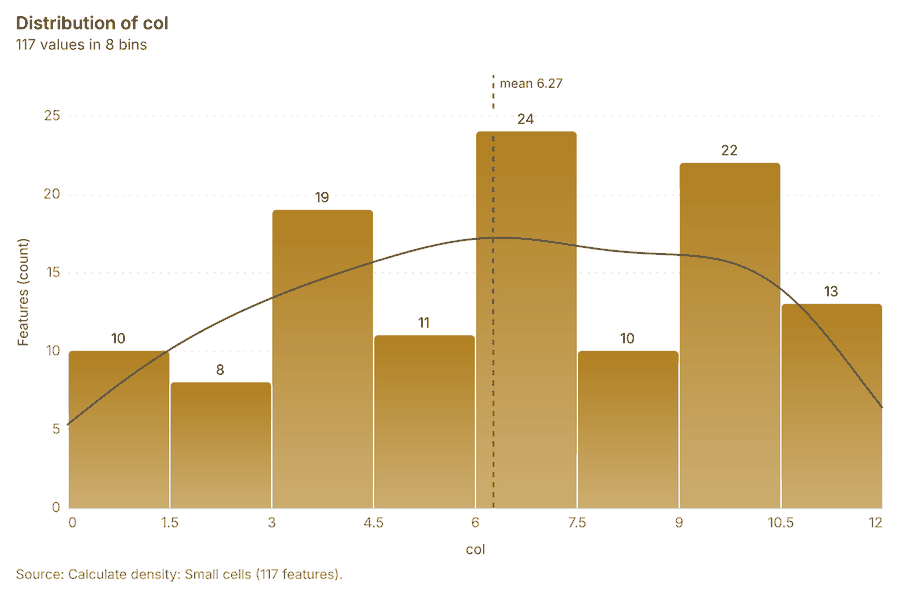
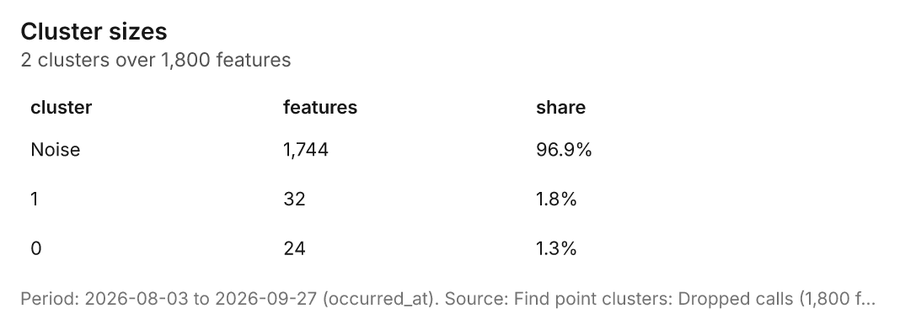
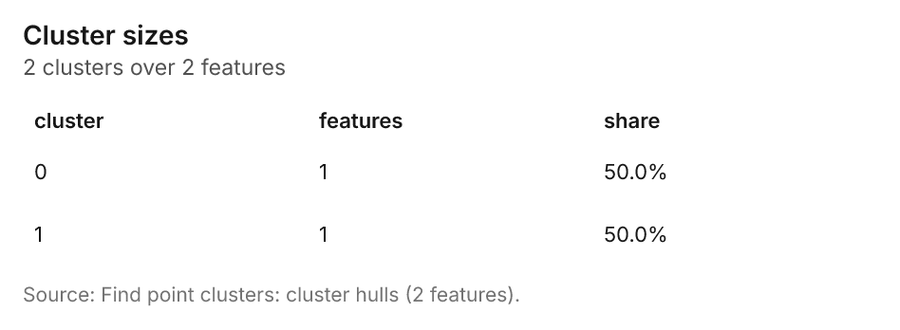
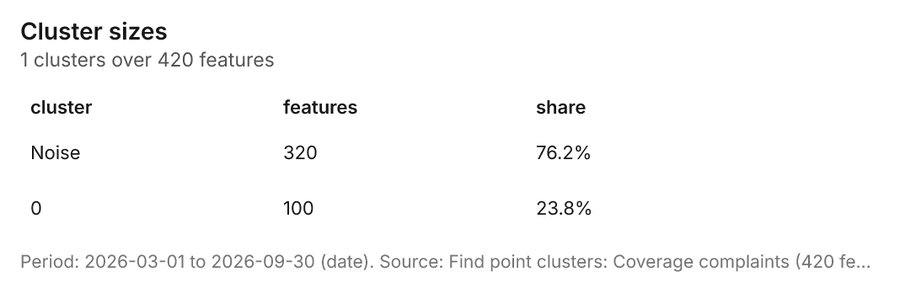
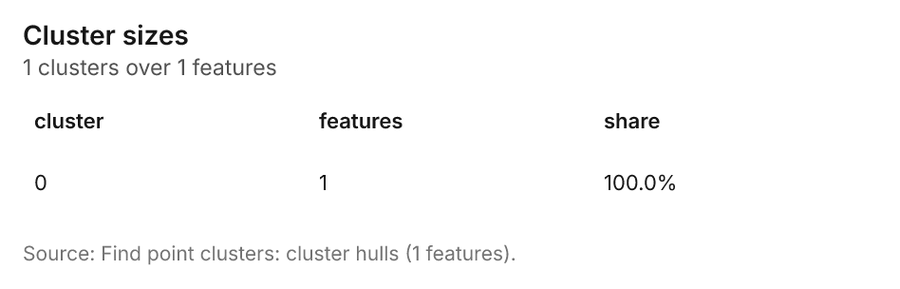
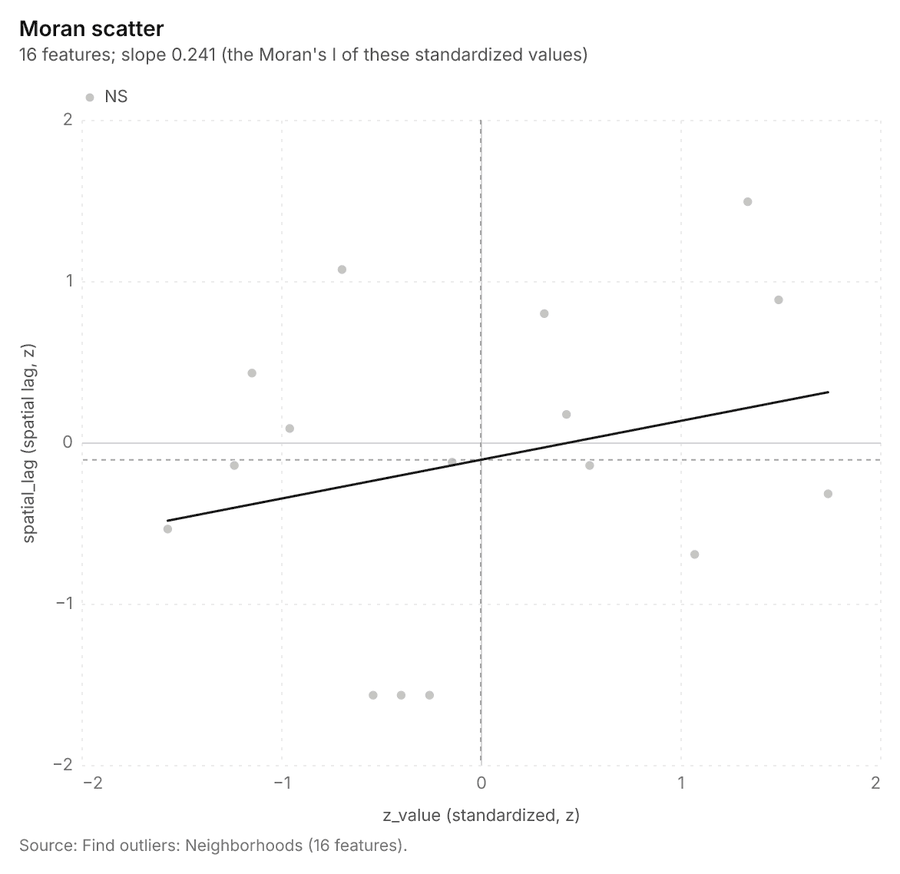
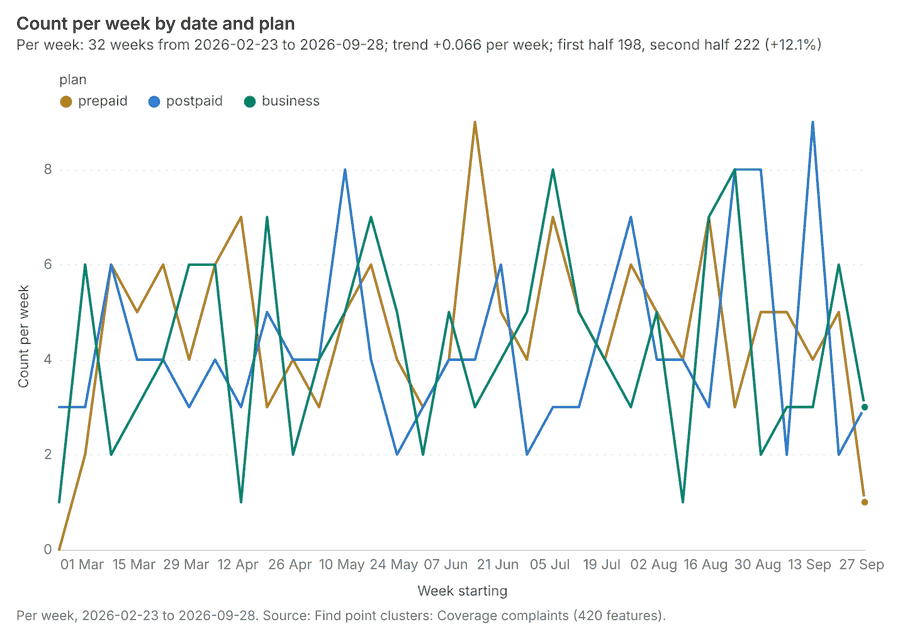
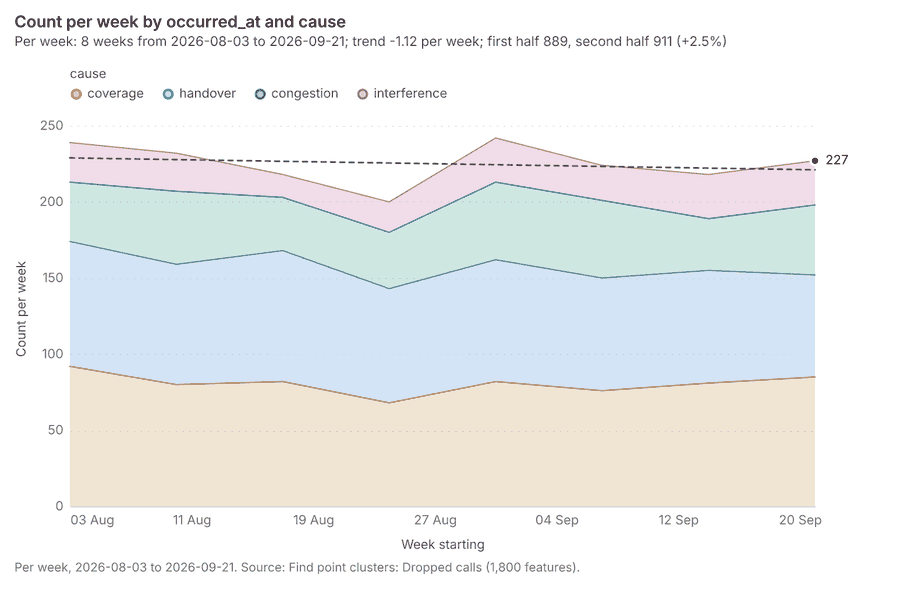
More maps
43 more map(s), beyond the 24 the report body holds, in the composer's order: Terrain analysis (continued 23) 284; Terrain analysis (continued 24) 285; Terrain analysis (continued 25) 286; Terrain analysis (continued 26) 287; Terrain analysis (continued 27) 288; Terrain analysis (continued 28) 289; Terrain analysis (continued 29) 290; Terrain analysis (continued 30) 291; Terrain analysis (continued 31) 292; Terrain analysis (continued 32) 293; Terrain analysis (continued 33) 294; Terrain analysis (continued 34) 295; Terrain analysis (continued 35) 296; Terrain analysis (continued 36) 297; Terrain analysis (continued 37) 298; Terrain analysis (continued 38) 299; Terrain analysis (continued 39) 300; Terrain analysis (continued 40) 301; Terrain analysis (continued 41) 302; Slope: valley terrain model (DEM) 303; Hot spots: dropped calls 304; Hot spots: coverage complaints 305; Hot spots: small cells 306; Emerging hot spots: coverage complaints and dropped calls 307; Counts: towers, by neighborhood 308; Counts: small cells, by neighborhood 309; Counts: dropped calls, by neighborhood 310; Period change: dropped calls, by neighborhood 311; Period change: coverage complaints, by neighborhood 312; Seasonality: dropped calls, by neighborhood 313; Density: dropped calls 314; Density: coverage complaints 315; Density: small cells 316; Clusters: dropped calls 317; Clusters: coverage complaints 318; Outliers: neighborhoods 319; Change beside the counts per neighborhood 320; Change of dropped calls where density is high 321; Hot cells of dropped calls per neighborhood 322; Nearest tower to each cluster of dropped calls 323; Change of coverage complaints per neighborhood 324; Clusters of all inputs together: dropped calls and coverage complaints 325; Towers within 250 m of each cluster of dropped calls 326.
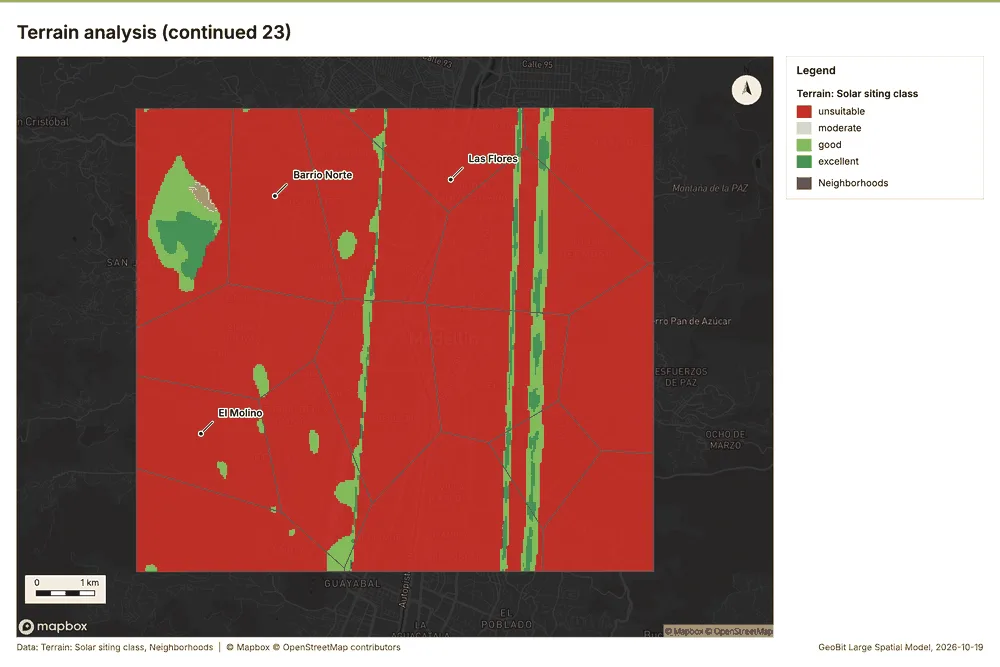
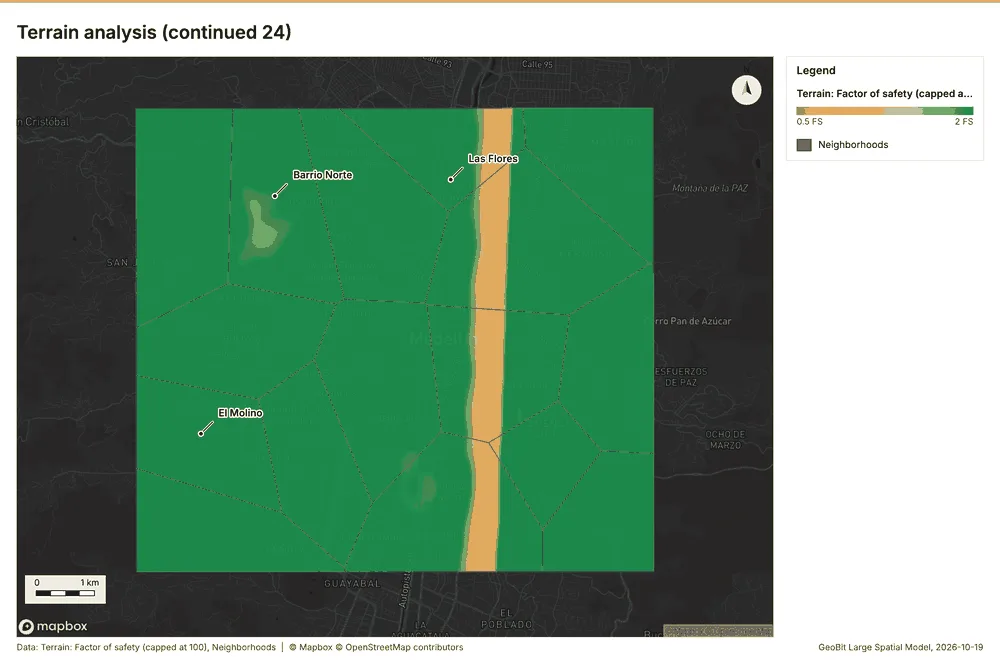
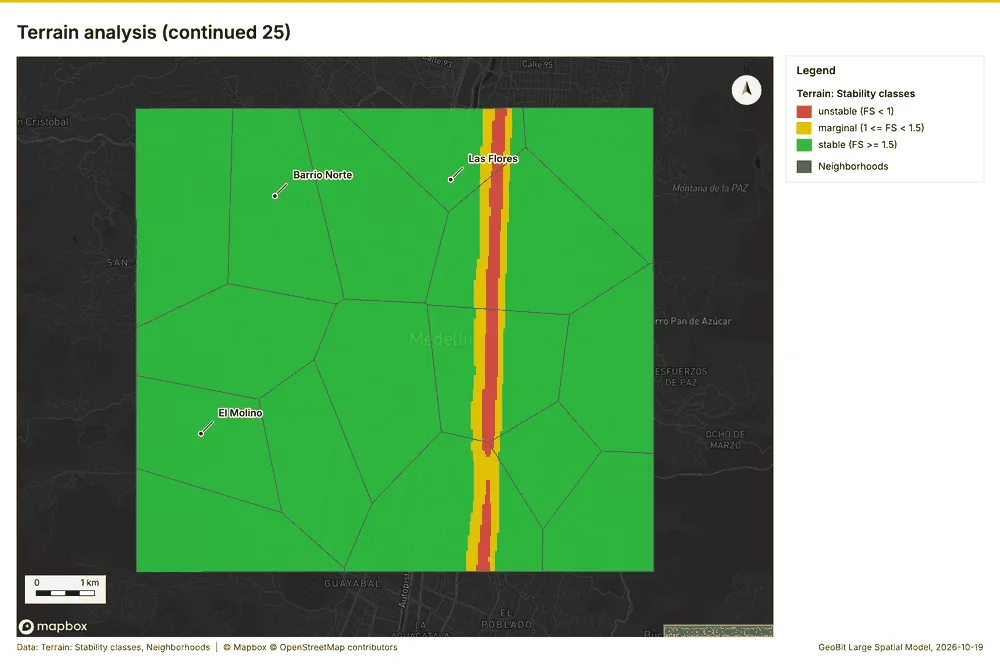
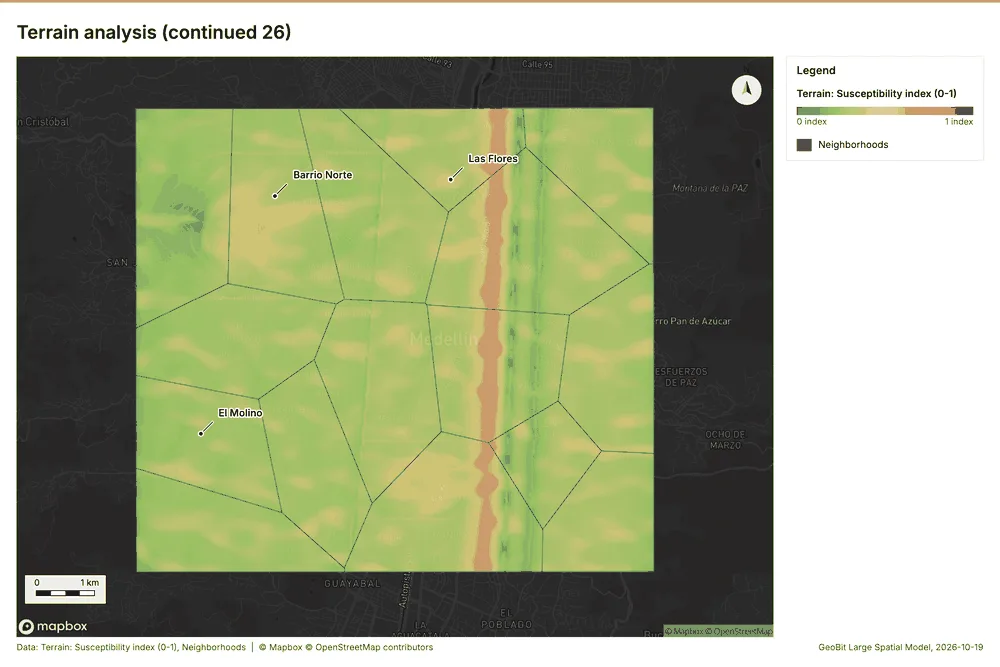
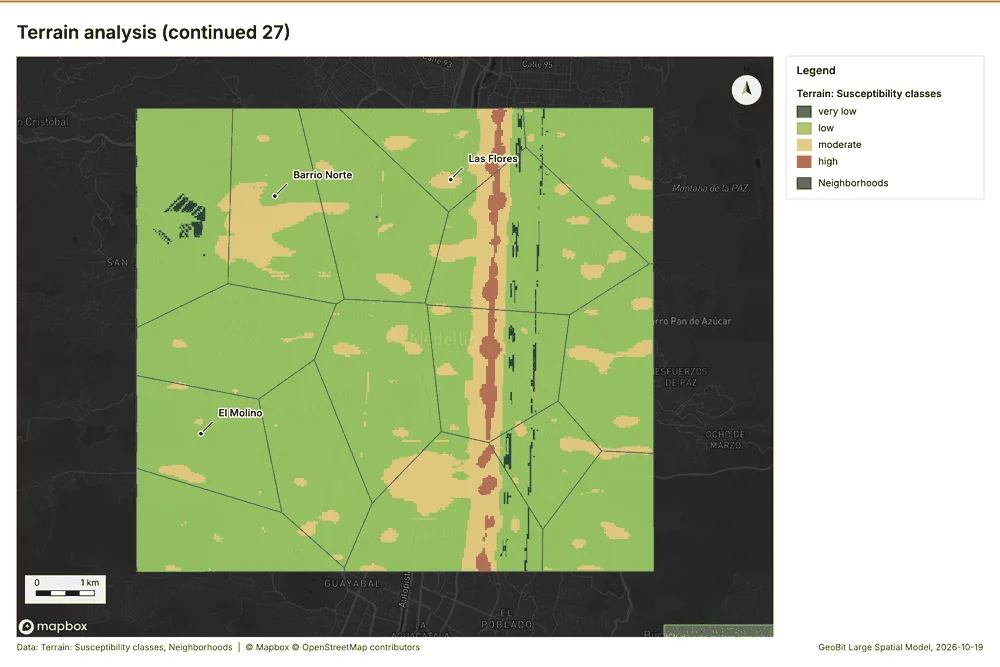
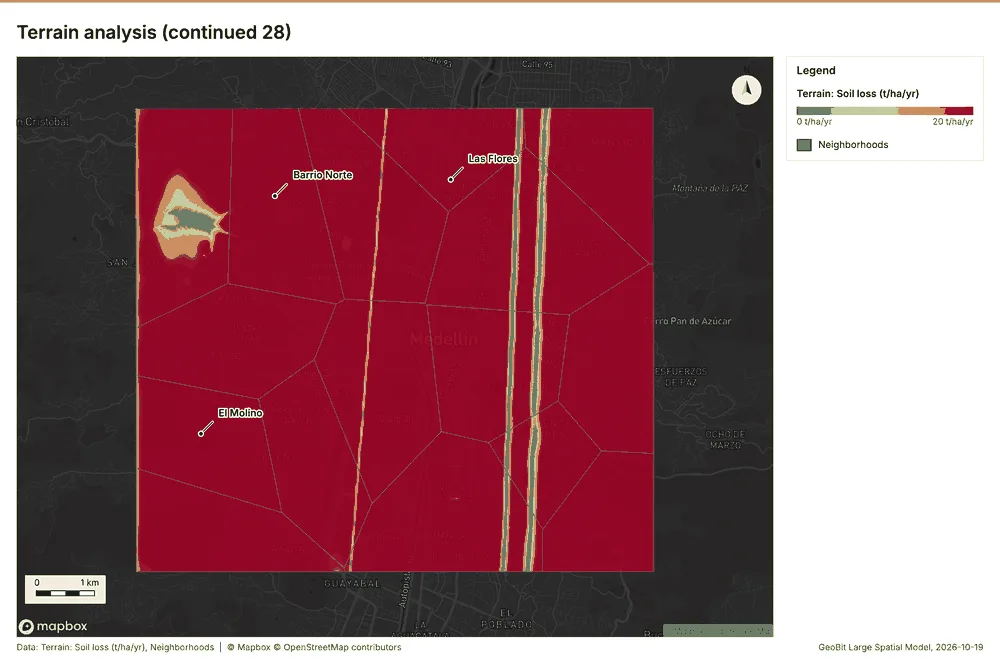
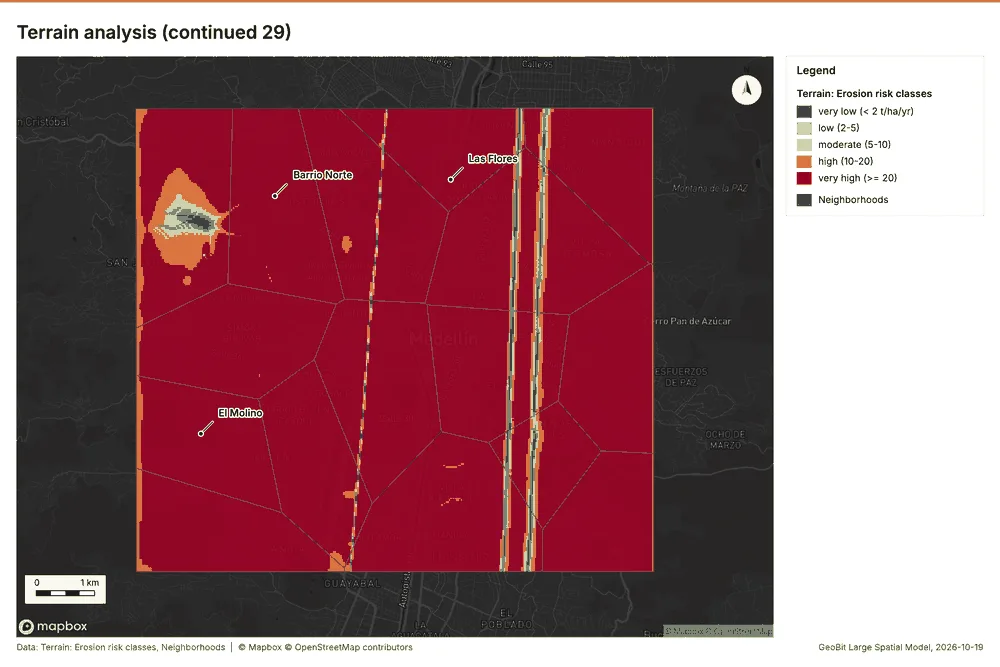
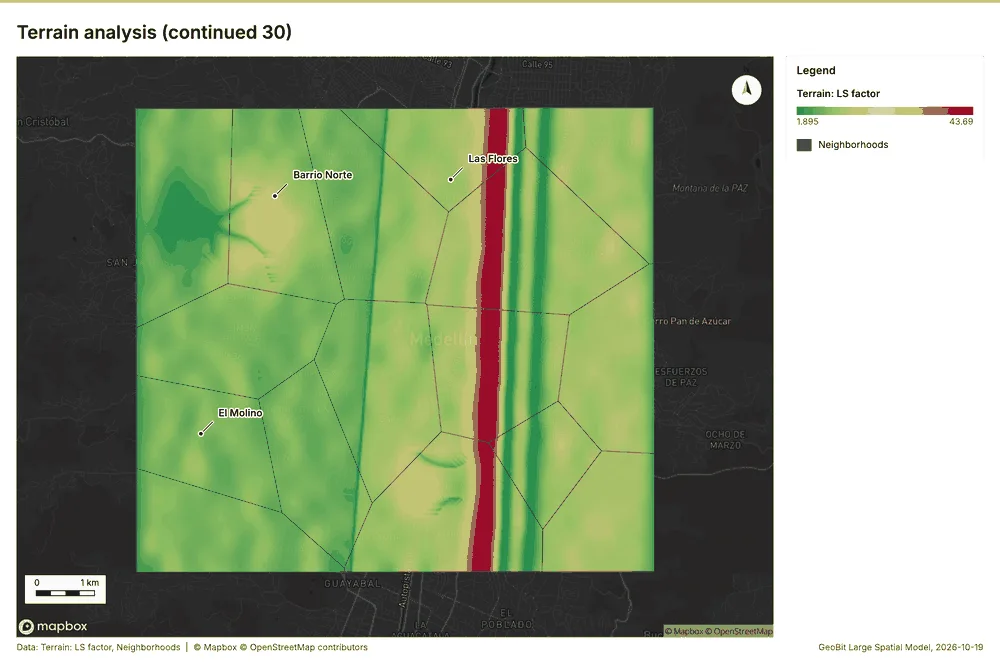
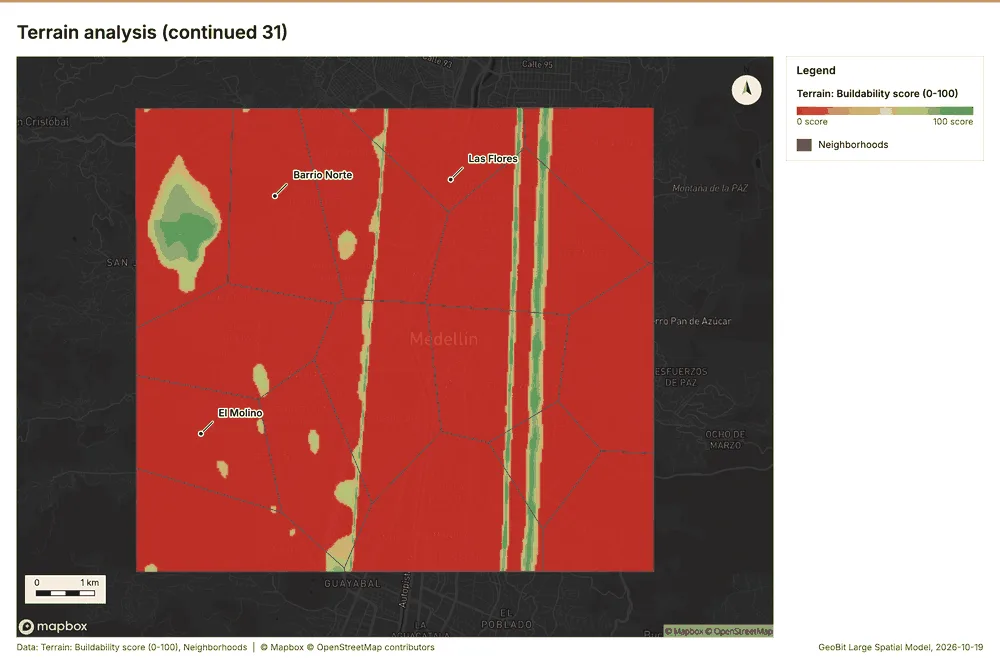
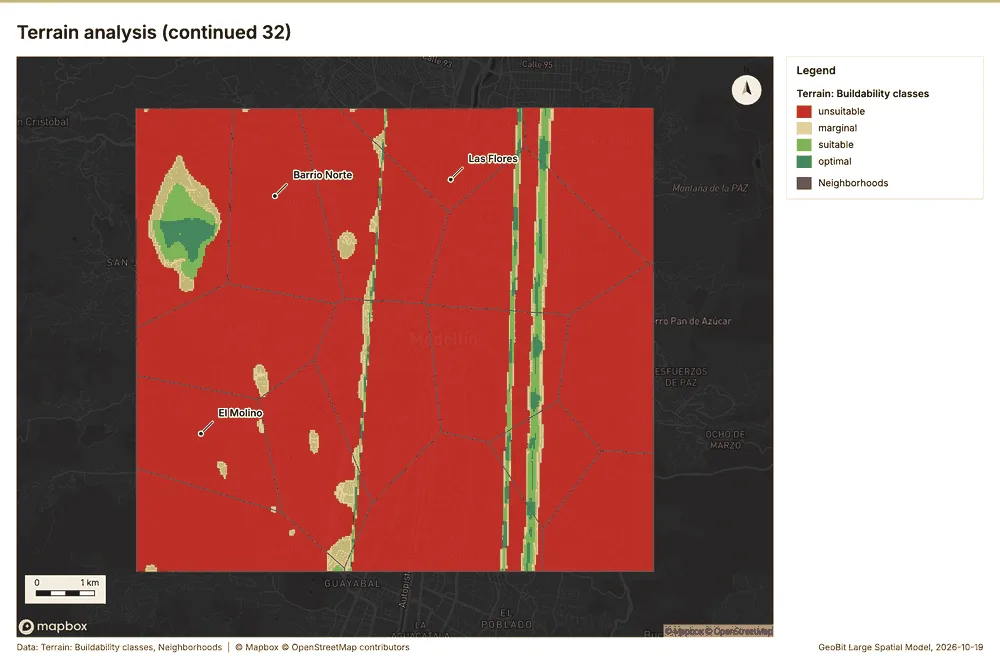
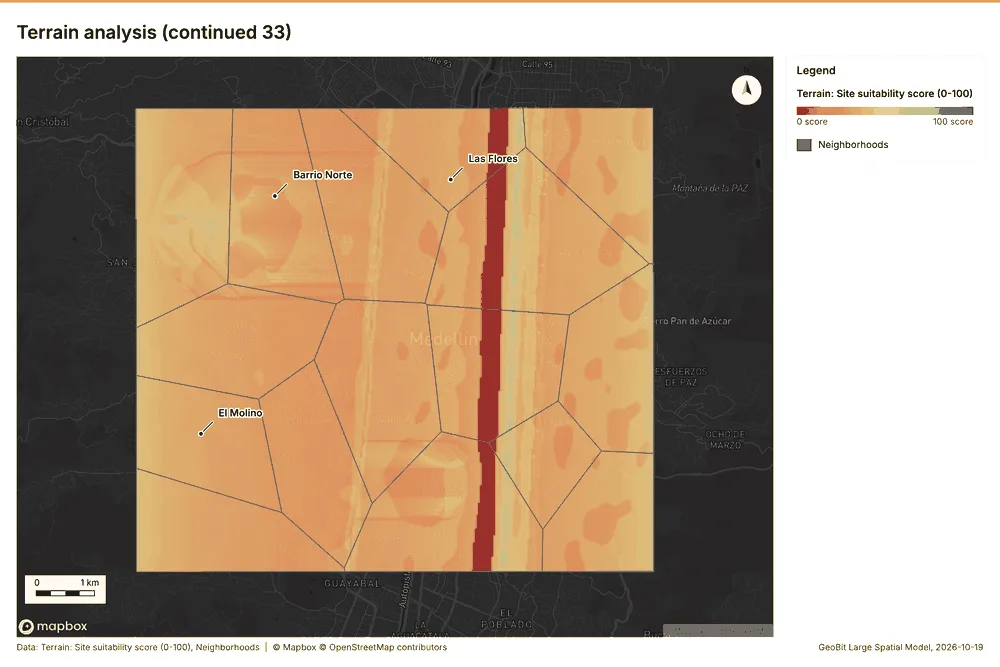
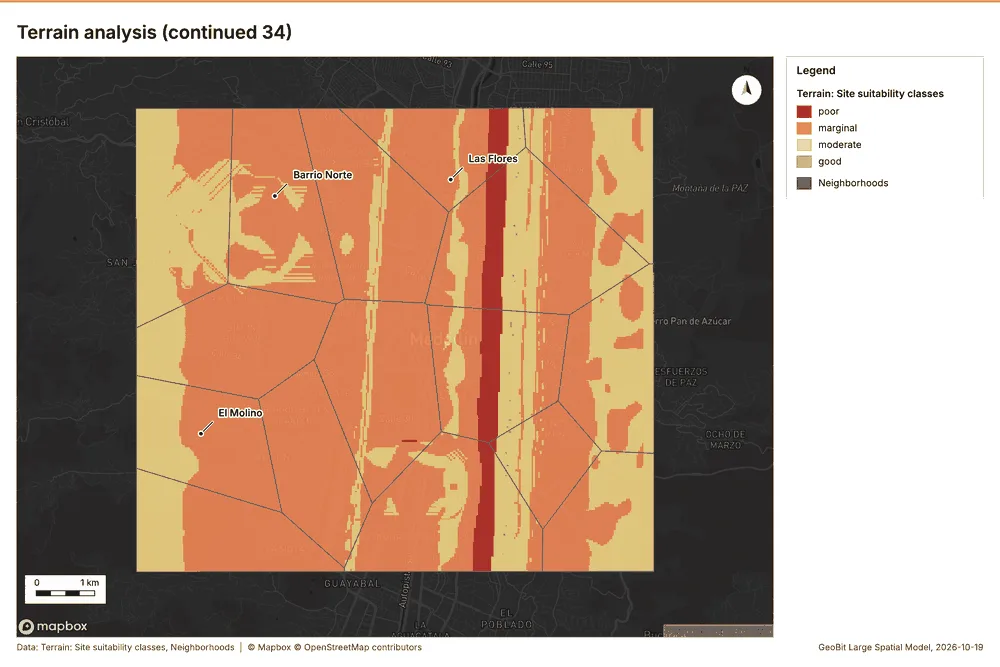
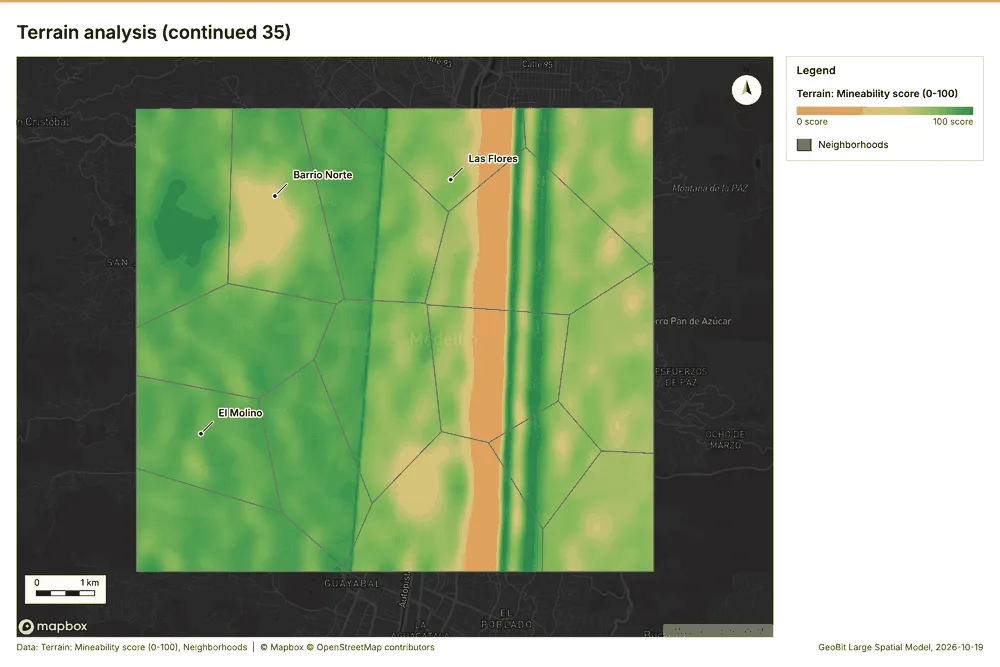
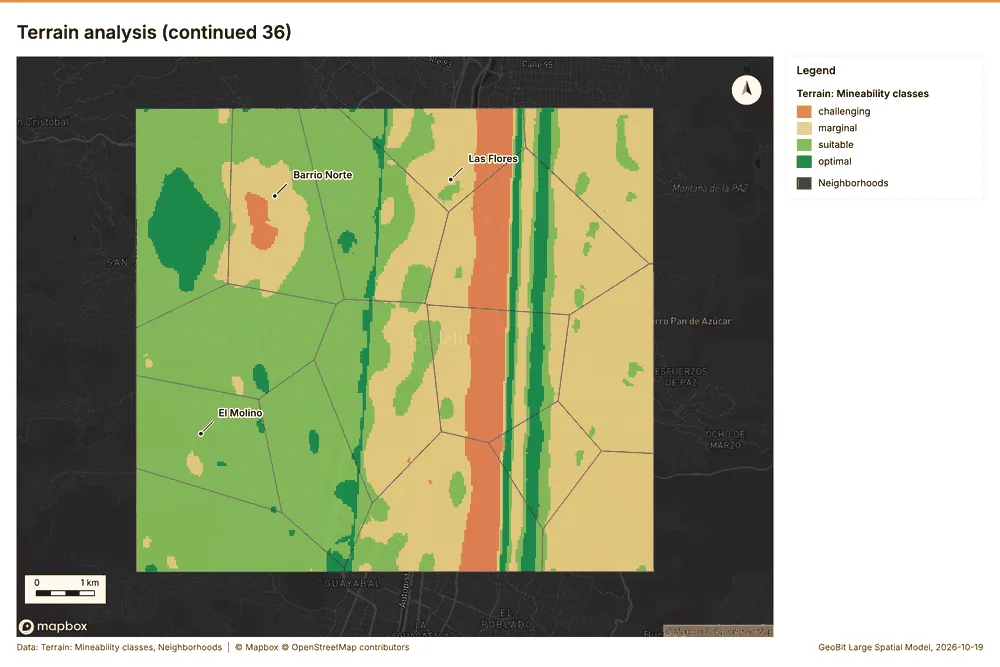
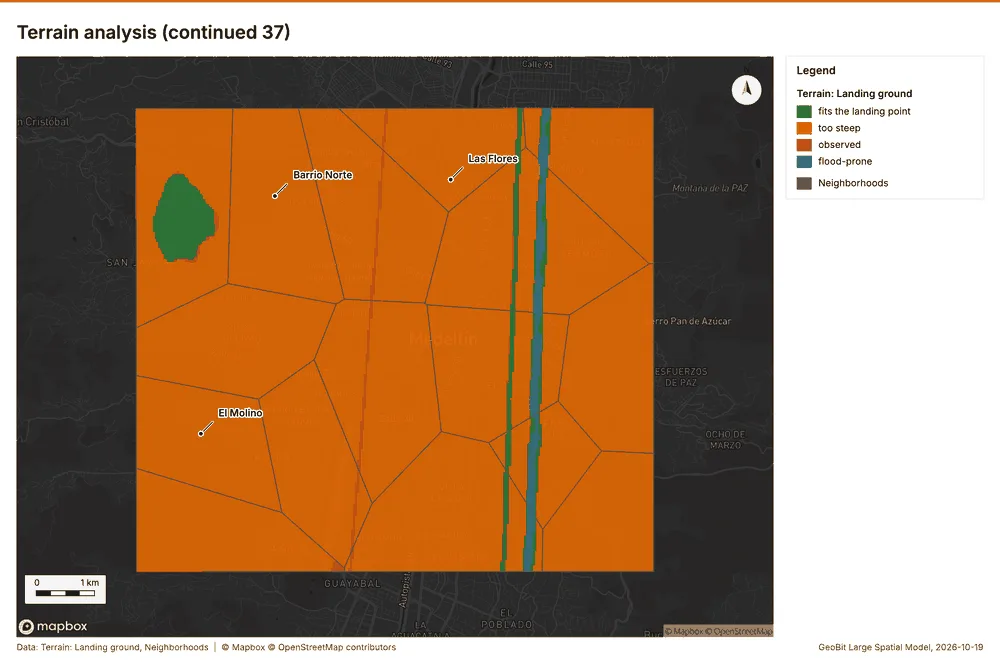
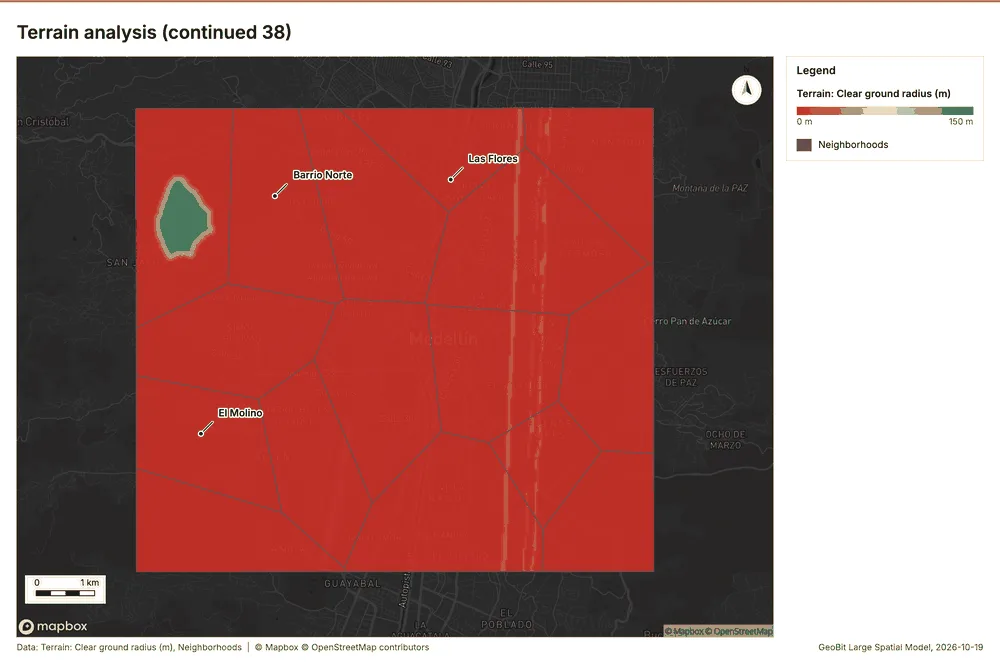
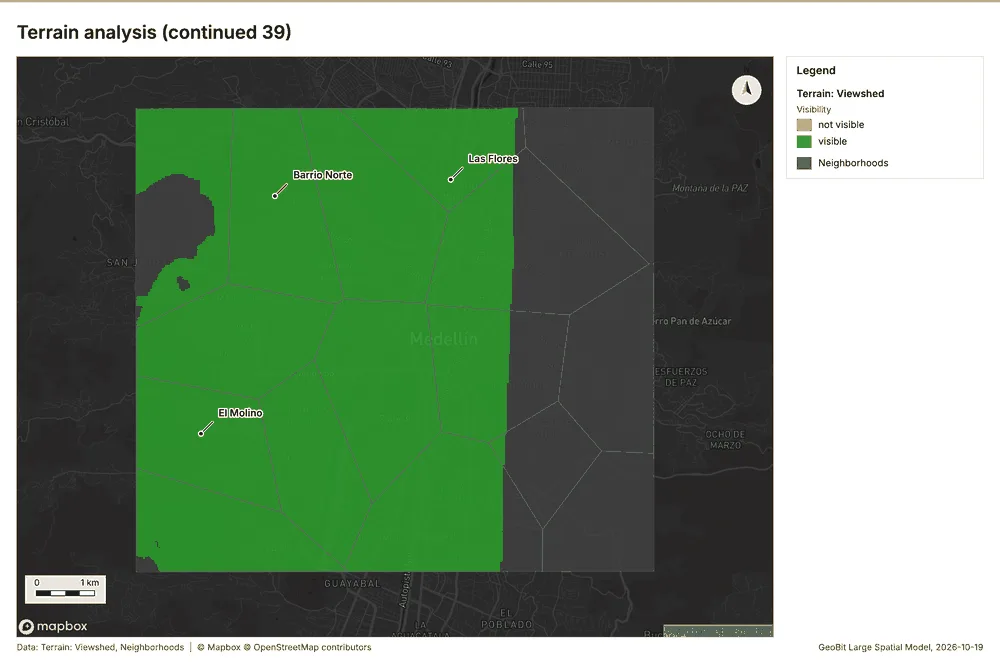
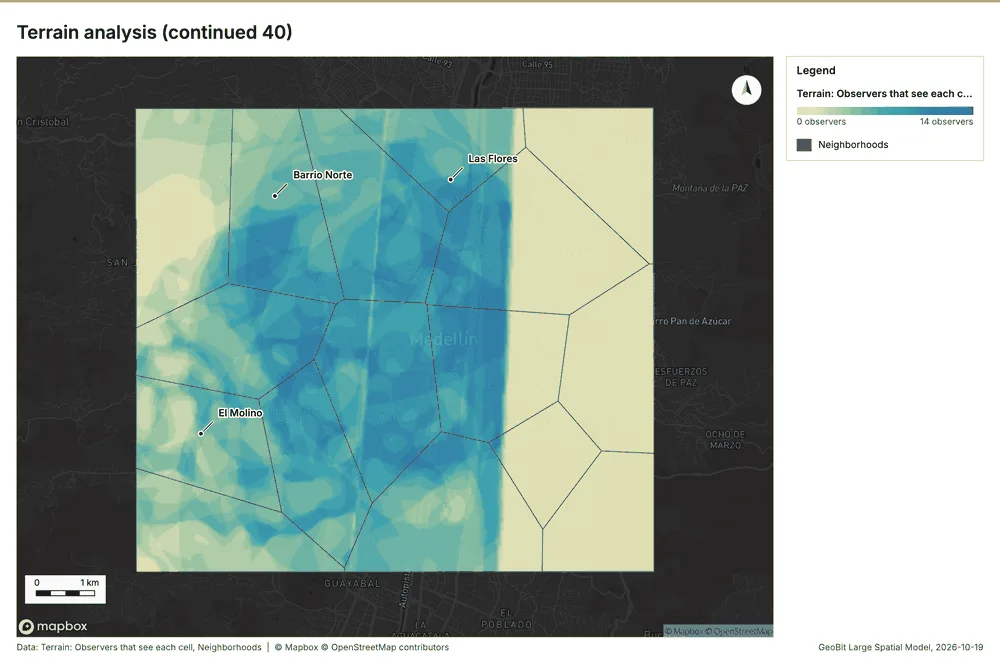
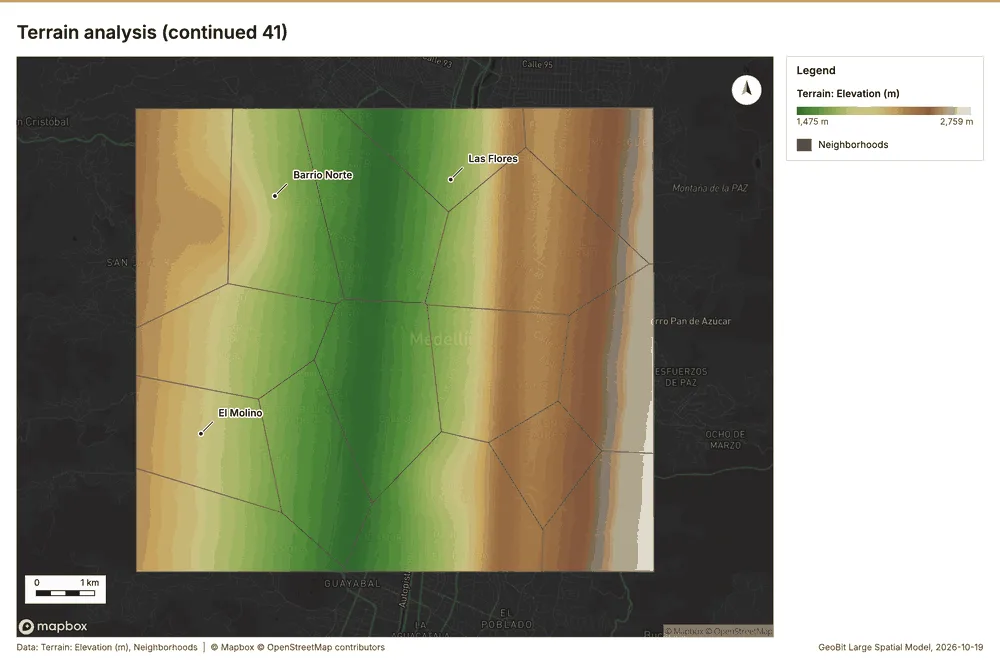
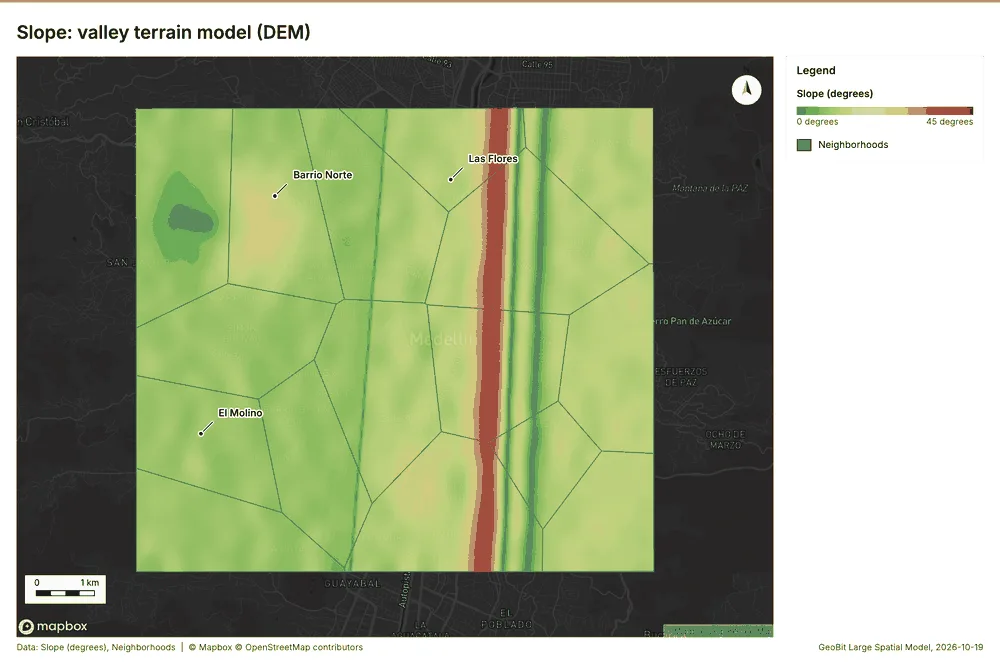
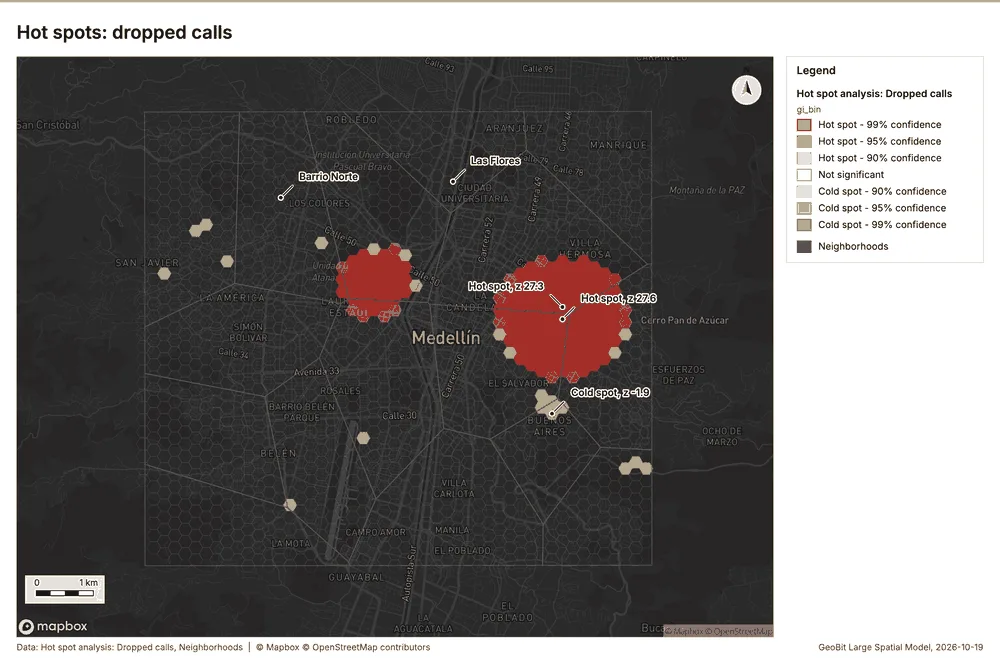
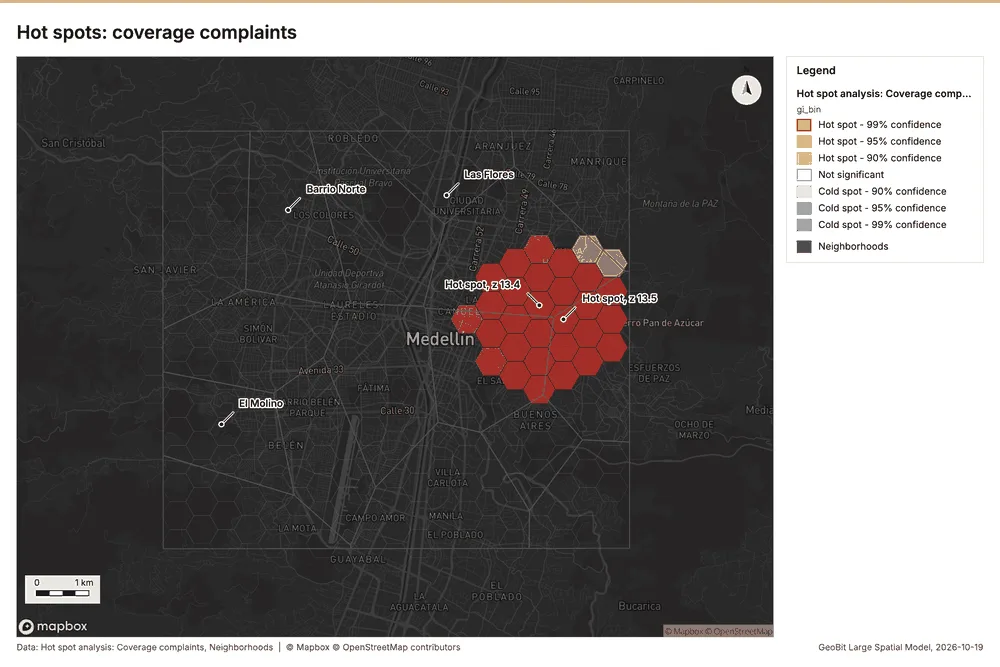
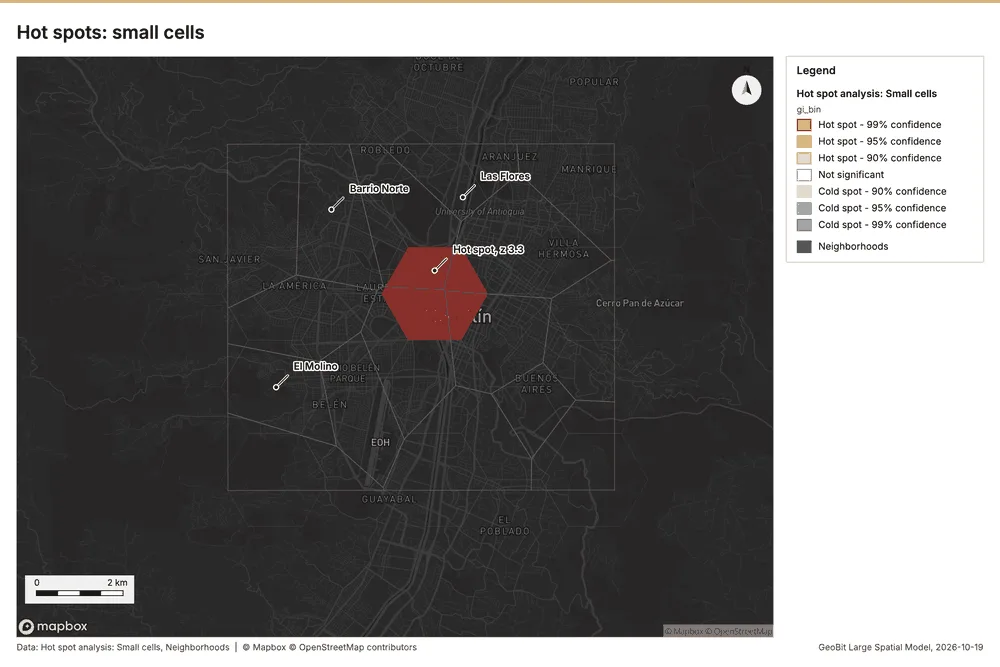
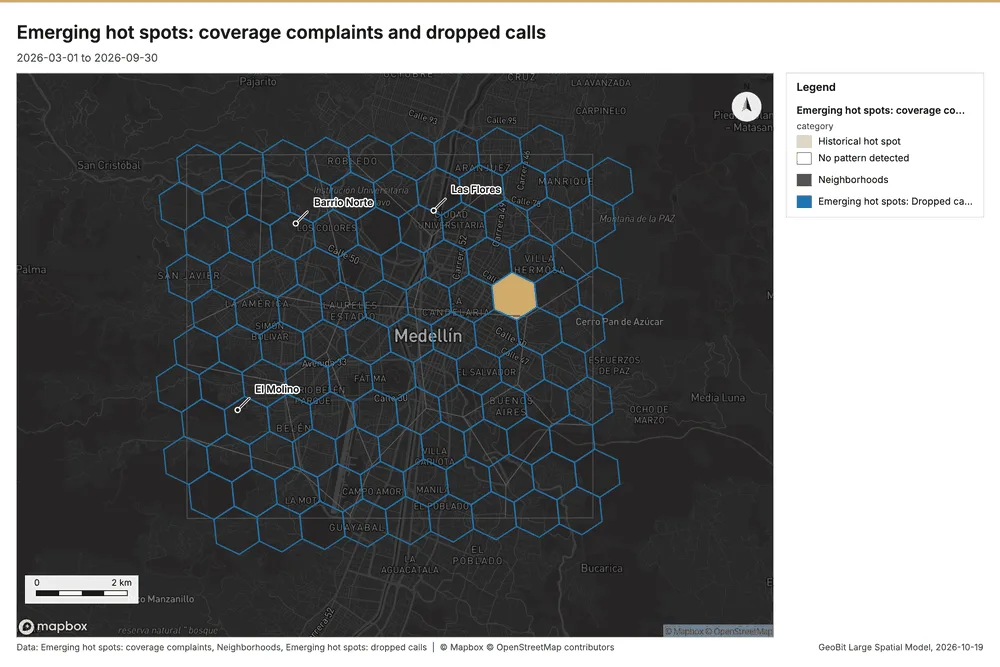
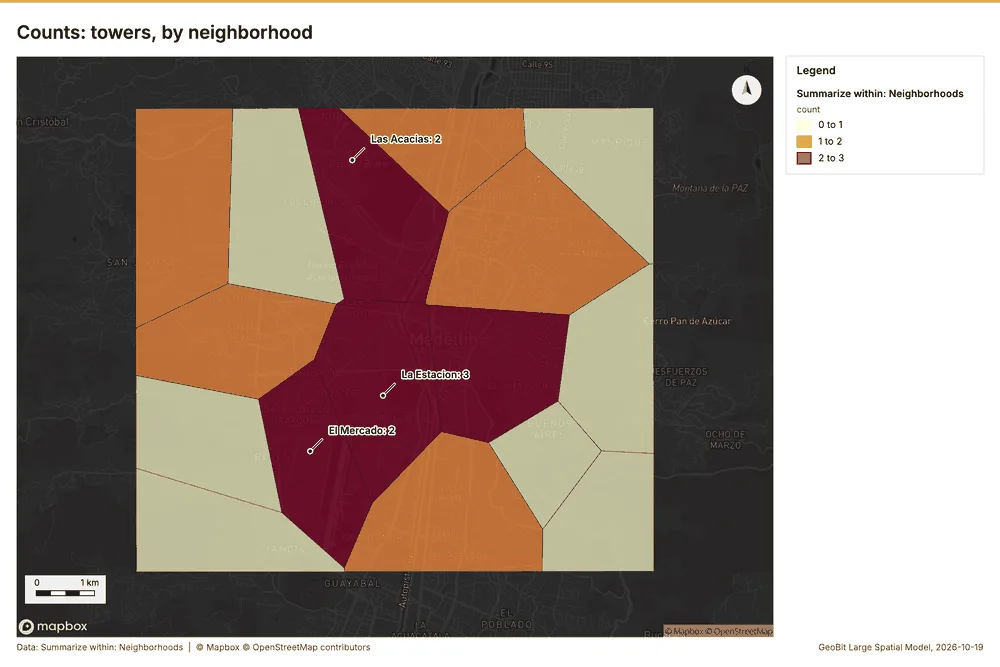
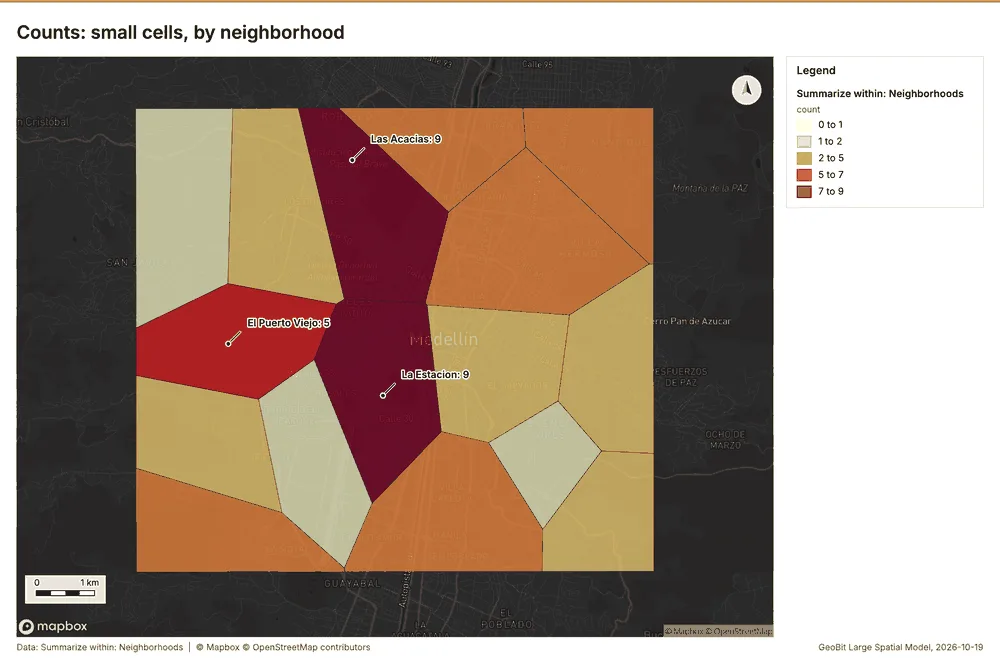
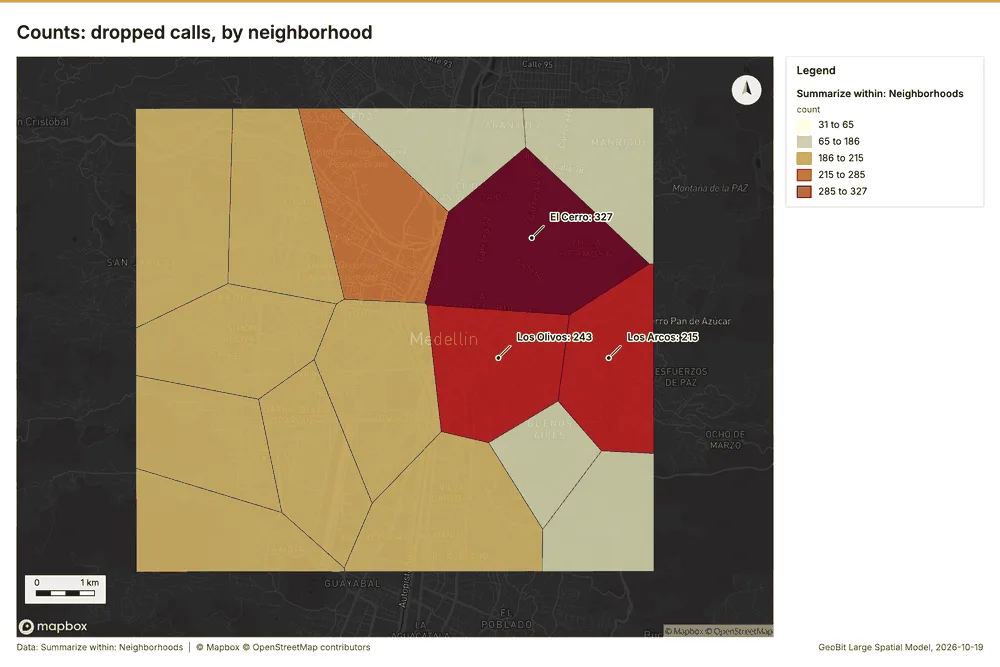
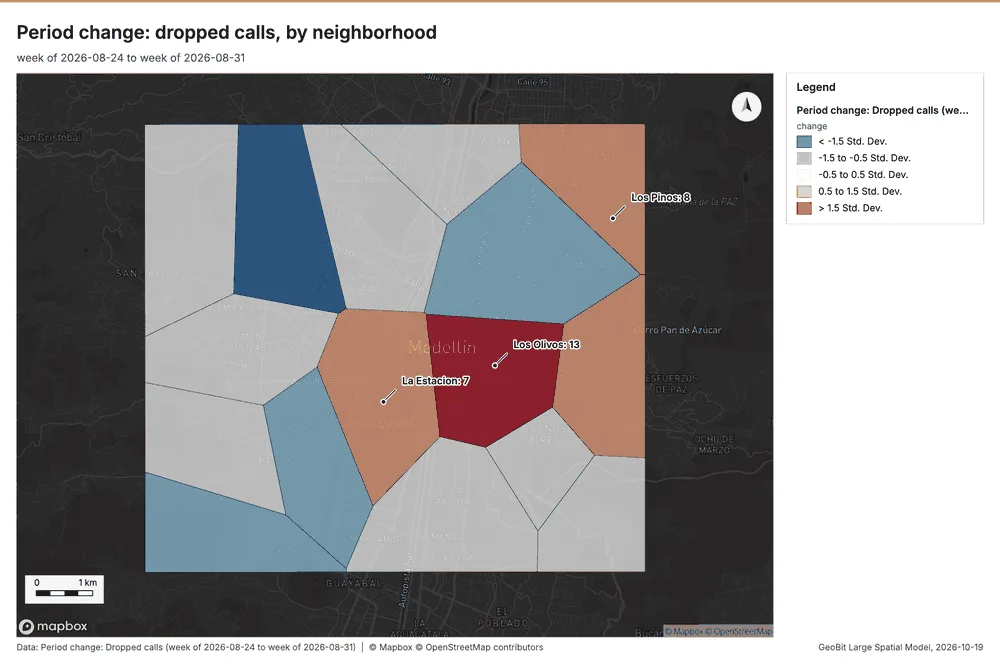
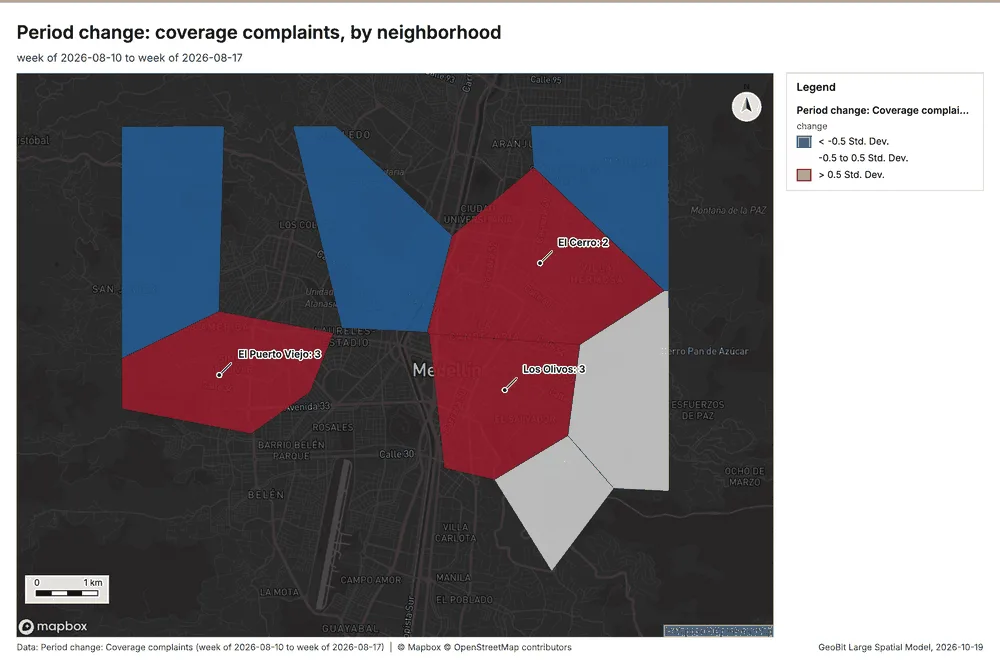
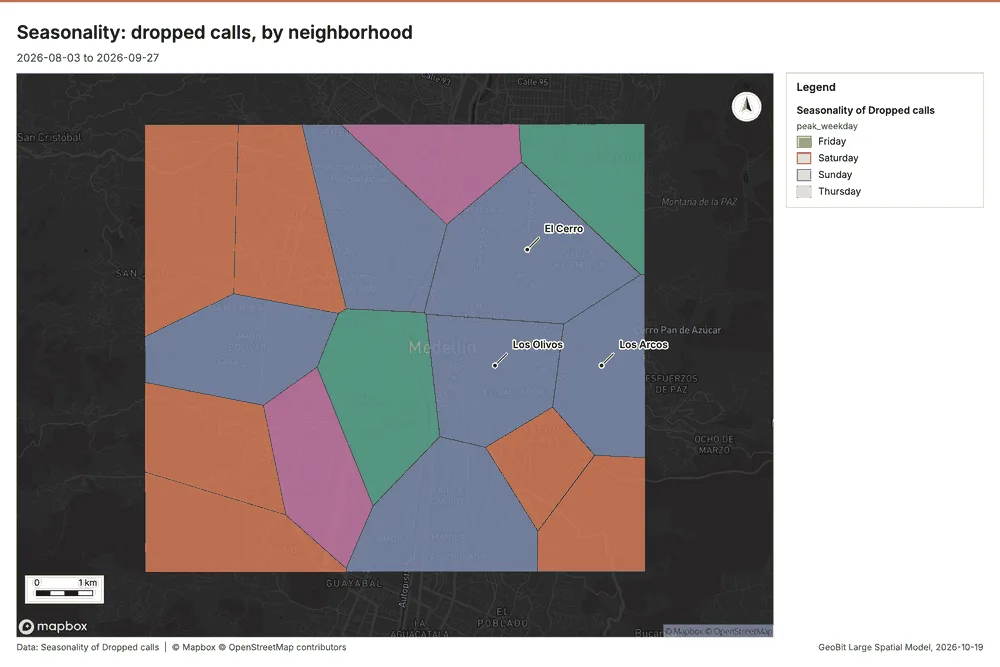
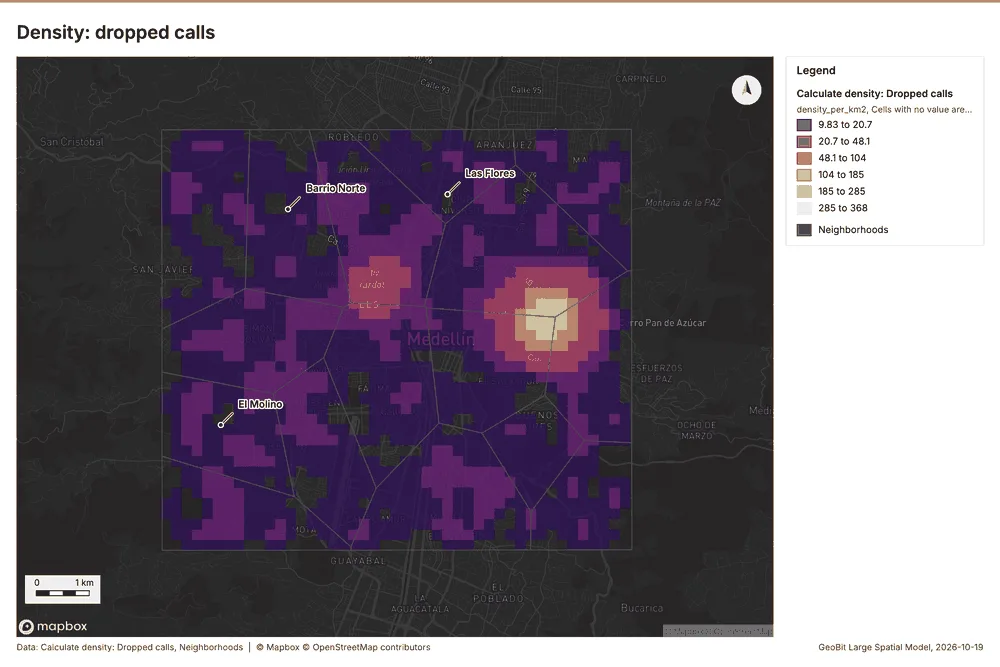
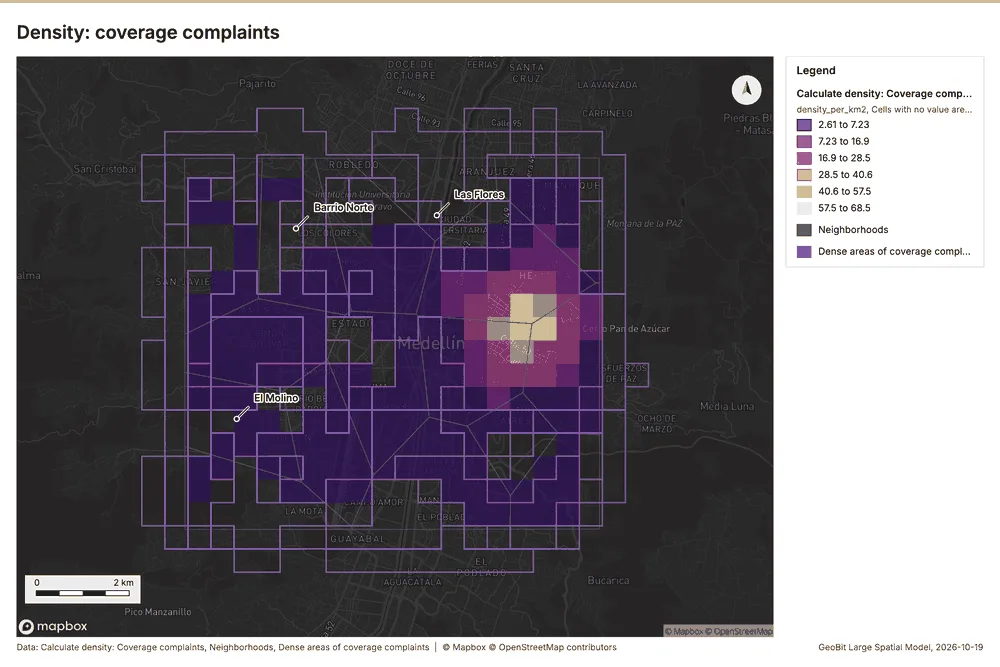
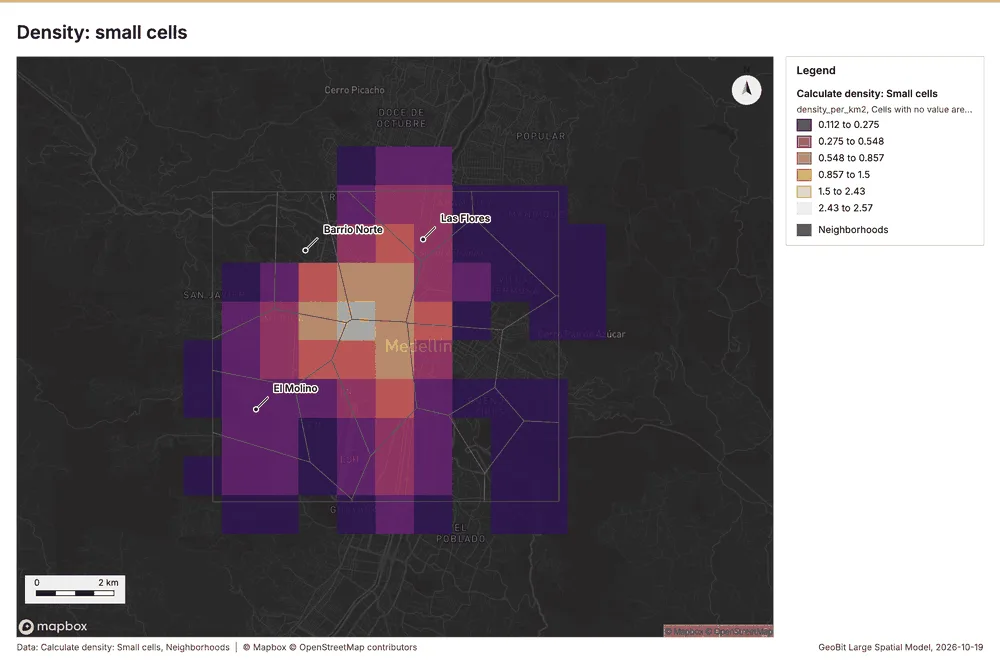
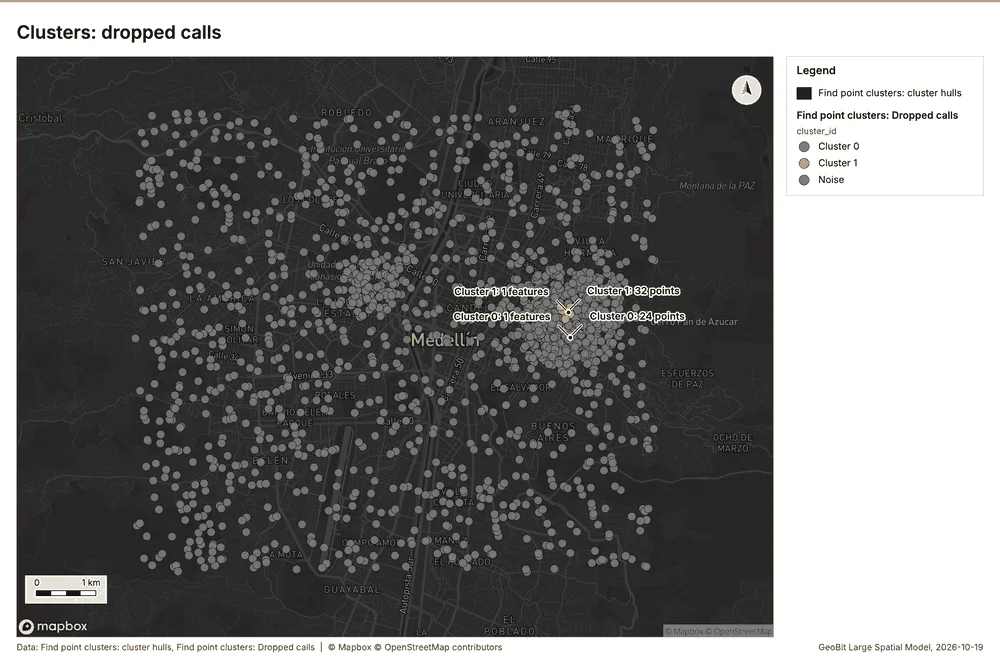
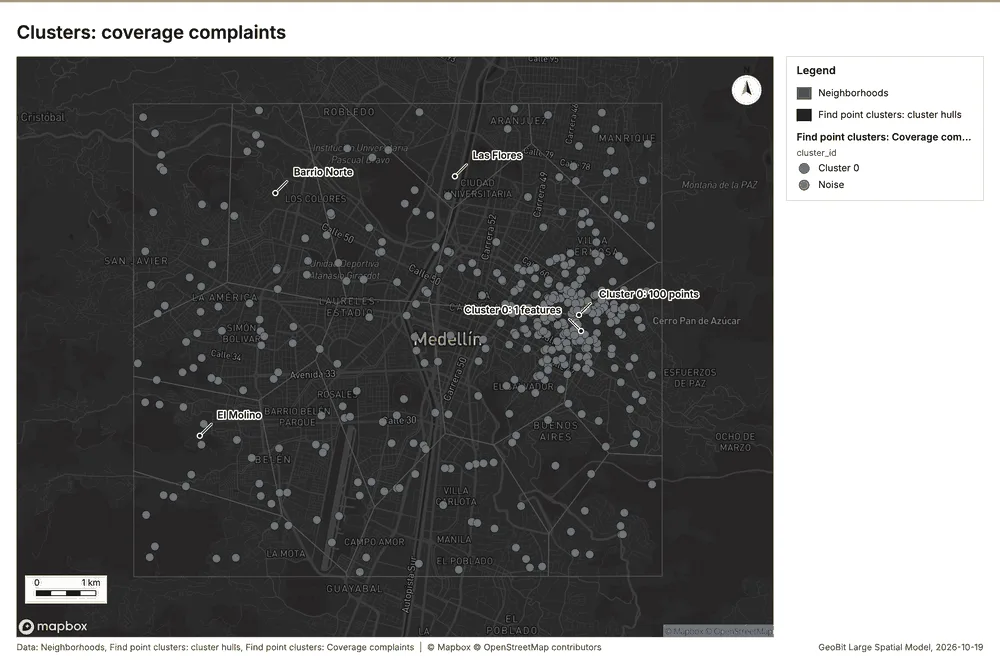
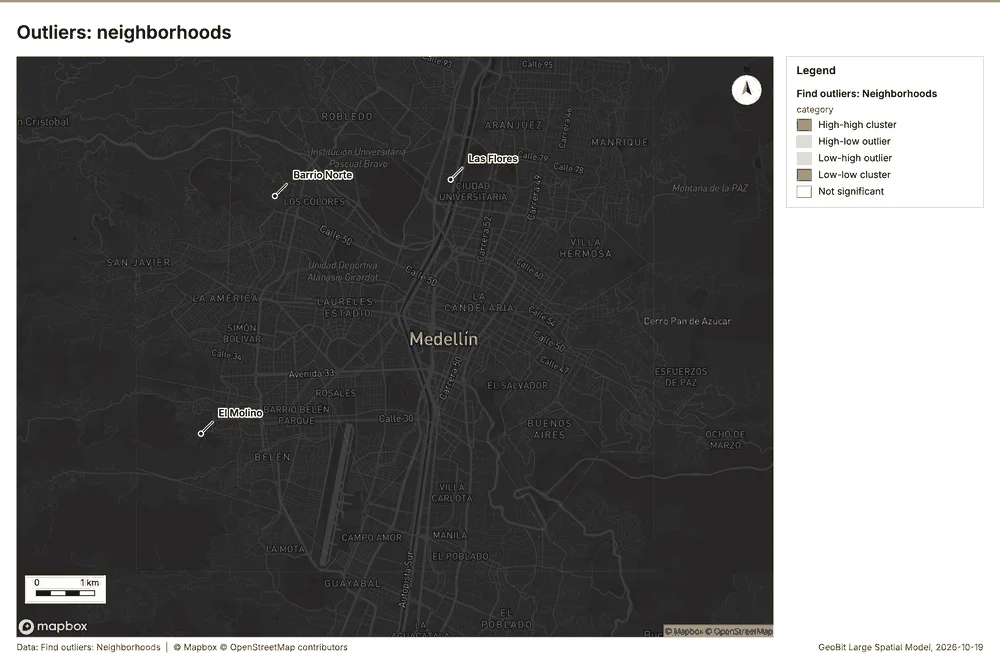
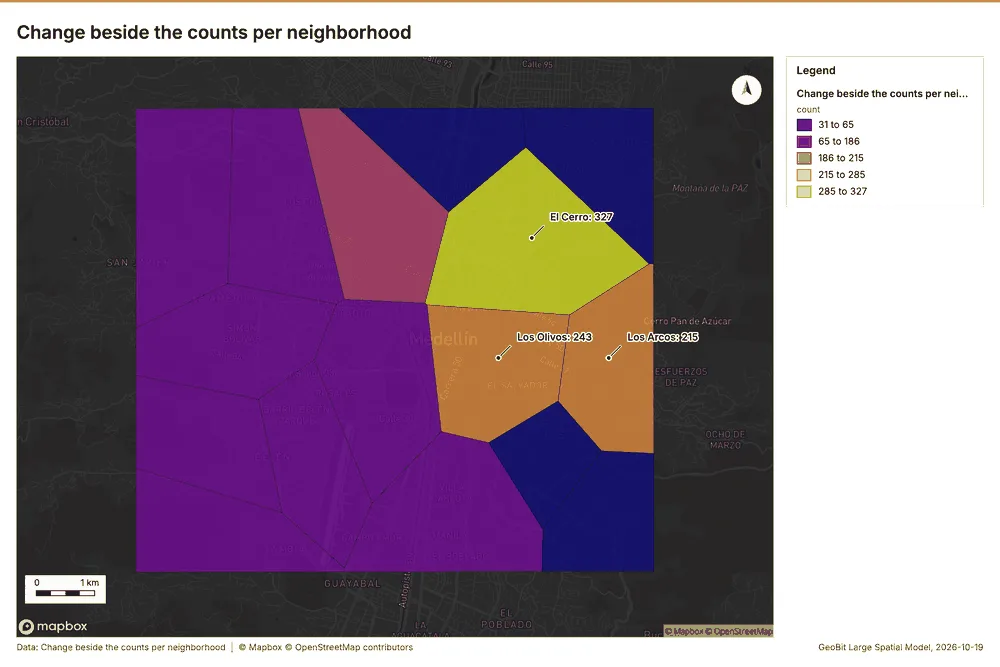
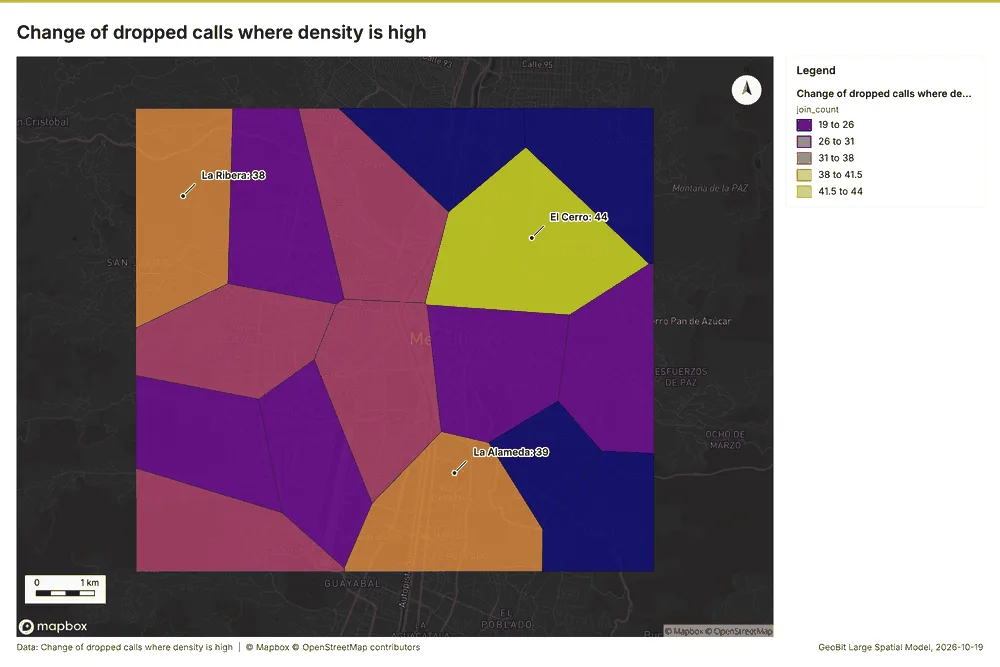
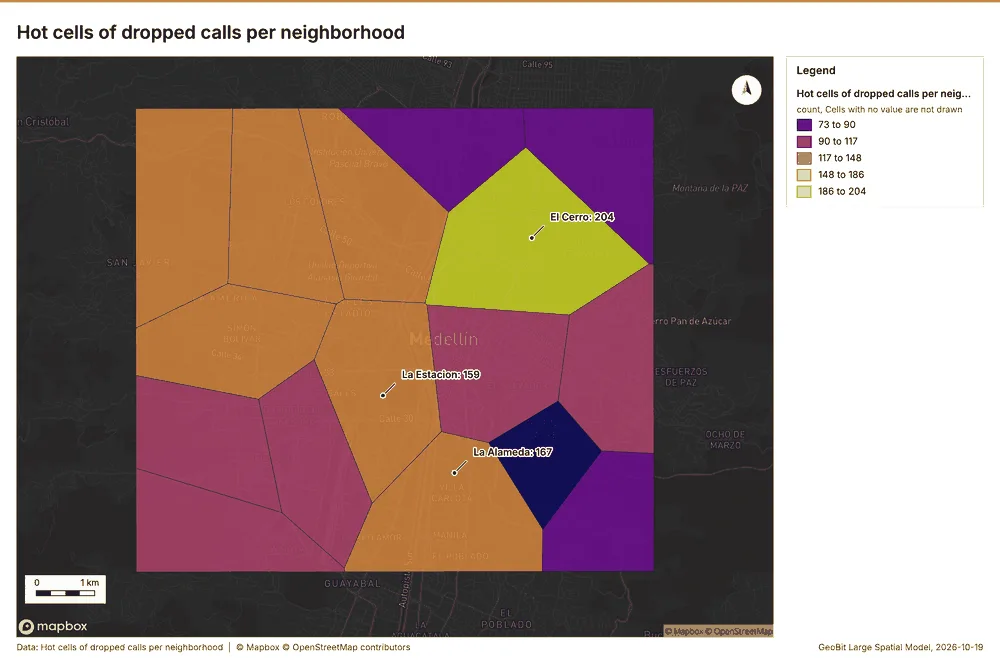
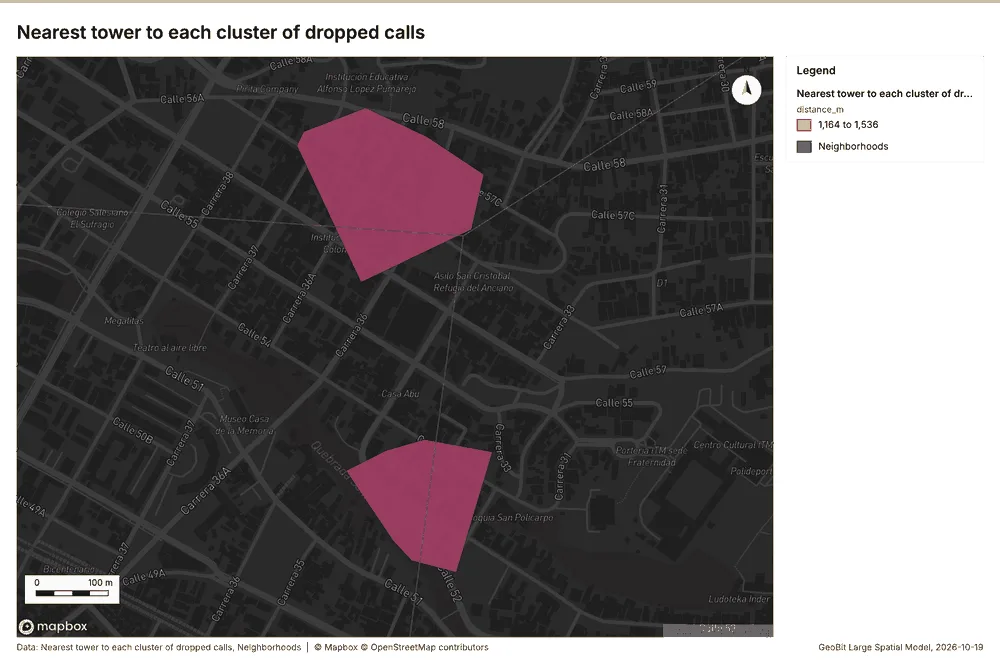
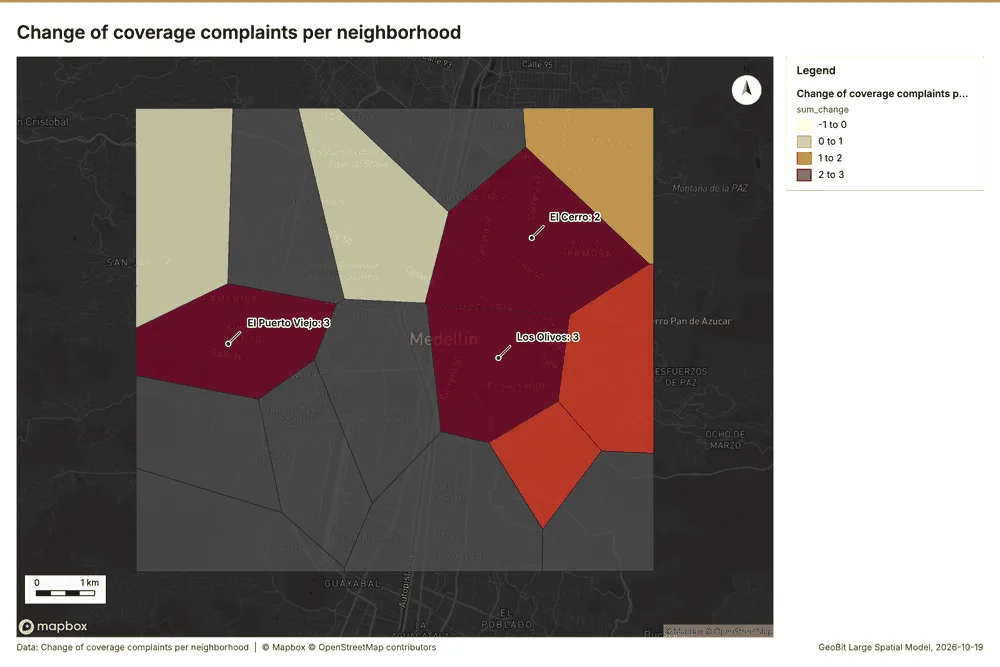
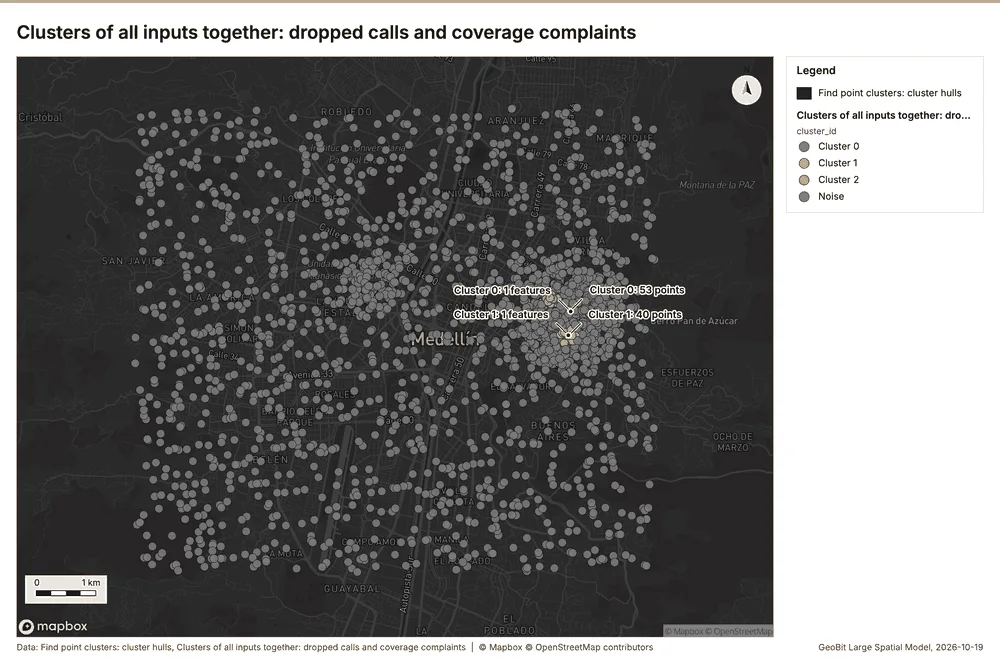
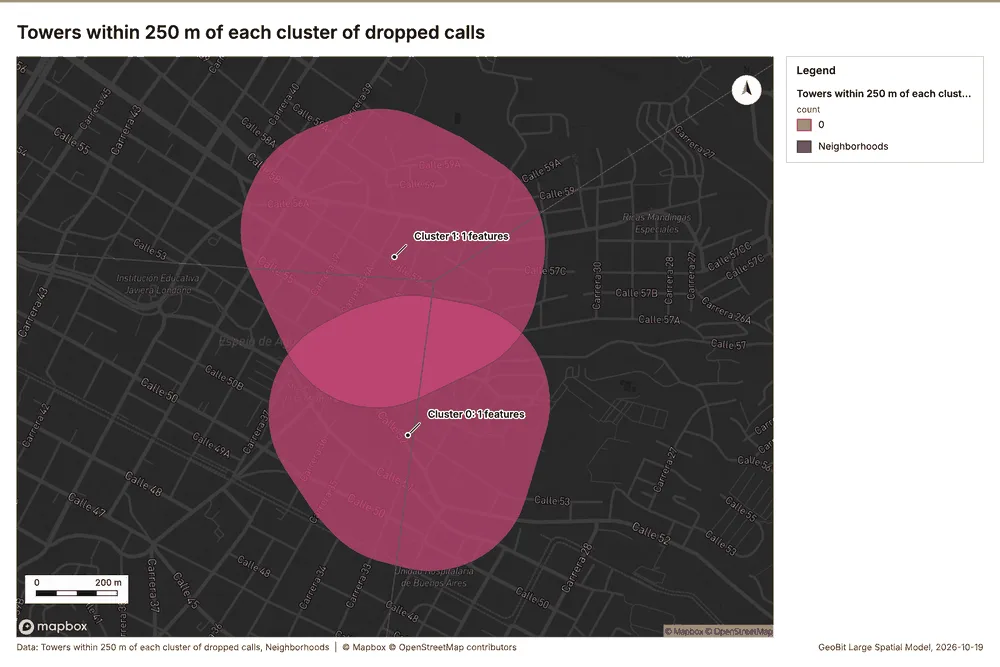
Documents
What the documents name. Network performance review, August and September 2026 (1 page, 1 page(s) from the text layer) names 4 event terms and 7 places 327. Event terms in Network performance review, August and September 2026: coverage (page 1, line 5), congestion (page 1, line 7), planned (page 1, line 10), live (page 1, line 10) 328. Places named in Network performance review, August and September 2026: Los Olivos (page 1, line 5), 624785, -7555517 (page 1, line 5), Tower 03 La Fuente (page 1, line 7), Tower 13 Los Pinos (page 1, line 9) 328.
| Result | Value |
|---|---|
| Documents | 1 |
| Entities | 11 |
| Event terms | 4 |
| Places | 7 |
Findings
- Evidenced: Network performance review, August and September 2026 (1 page, 1 page(s) from the text layer) names 4 event terms and 7 places.
- Evidenced: Event terms in Network performance review, August and September 2026: coverage (page 1, line 5), congestion (page 1, line 7), planned (page 1, line 10), live (page 1, line 10).
- Evidenced: Places named in Network performance review, August and September 2026: Los Olivos (page 1, line 5), 624785, -7555517 (page 1, line 5), Tower 03 La Fuente (page 1, line 7), Tower 13 Los Pinos (page 1, line 9).
Changes since the last run
78 number(s) changed since the report of 2026-10-19T04:12:21Z.
| Analysis | Measure | Before | After | Change |
|---|---|---|---|---|
| Hot spots | result, bins | 21 | 1,798 | 1,777 |
| Hot spots | result, count | 21 | 1,798 | 1,777 |
| Hot spots | result, elapsed ms | 2 | 64 | 62 |
| Hot spots | result, cell size m | 2,000 | 200 | -1,800 |
| Hot spots | result, incidents used | 40 | 1,800 | 1,760 |
| Hot spots | result, distance band m | 2,000 | 500 | -1,500 |
| Hot spots | billing, cost | 0.0508 | 0.086 | 0.0352 |
| Hot spots | billing, list price | 0.0508 | 0.086 | 0.0352 |
| Hot spots | result, bins | 21 | 305 | 284 |
| Hot spots | result, count | 21 | 305 | 284 |
| Hot spots | result, elapsed ms | 2 | 11 | 9 |
| Hot spots | result, cell size m | 2,000 | 500 | -1,500 |
| Hot spots | result, incidents used | 40 | 420 | 380 |
| Hot spots | result, distance band m | 2,000 | 1,000 | -1,000 |
| Hot spots | billing, cost | 0.0508 | 0.0584 | 0.0076 |
| Hot spots | billing, list price | 0.0508 | 0.0584 | 0.0076 |
| Space time hot spots | result, count | 109 | 94 | -15 |
| Space time hot spots | result, elapsed ms | 12 | 14 | 2 |
| Space time hot spots | result, features used | 1,800 | 420 | -1,380 |
| Space time hot spots | billing, cost | 0.19 | 0.121 | -0.069 |
| Space time hot spots | billing, list price | 0.19 | 0.121 | -0.069 |
| Space time hot spots | result, elapsed ms | 12 | 13 | 1 |
| Summarize within | billing, cost | 0.0105 | 0.01062 | 0.00012 |
| Summarize within | billing, list price | 0.0105 | 0.01062 | 0.00012 |
| Summarize within | result, elapsed ms | 1 | 0 | -1 |
| Summarize within | billing, cost | 0.0105 | 0.01112 | 0.00062 |
| Summarize within | billing, list price | 0.0105 | 0.01112 | 0.00062 |
| Summarize within | result, elapsed ms | 1 | 3 | 2 |
| Summarize within | billing, cost | 0.0105 | 0.04634 | 0.03584 |
| Summarize within | billing, list price | 0.0105 | 0.04634 | 0.03584 |
| Calculate density | result, count | 117 | 2,034 | 1,917 |
| Calculate density | result, elapsed ms | 3 | 40 | 37 |
| Calculate density | result, bandwidth m | 2,000 | 500 | -1,500 |
| Calculate density | result, cell size m | 1,000 | 200 | -800 |
| Calculate density | result, max density per km2 | 2.571 | 368.1 | 365.6 |
| Calculate density | billing, cost | 0.0508 | 0.086 | 0.0352 |
| Calculate density | billing, list price | 0.0508 | 0.086 | 0.0352 |
| Calculate density | result, count | 117 | 383 | 266 |
| Calculate density | result, elapsed ms | 3 | 8 | 5 |
| Calculate density | result, bandwidth m | 2,000 | 1,000 | -1,000 |
| Calculate density | result, cell size m | 1,000 | 500 | -500 |
| Calculate density | result, max density per km2 | 2.571 | 68.51 | 65.94 |
| Calculate density | billing, cost | 0.0508 | 0.0584 | 0.0076 |
| Calculate density | billing, list price | 0.0508 | 0.0584 | 0.0076 |
| Calculate density | result, elapsed ms | 3 | 2 | -1 |
| Find point clusters | result, elapsed ms | 18 | 133 | 115 |
| Find point clusters | result, count | 1,800 | 420 | -1,380 |
| Find point clusters | result, noise | 1,744 | 320 | -1,424 |
| Find point clusters | result, distance m | 100 | 200 | 100 |
| Find point clusters | result, elapsed ms | 18 | 5 | -13 |
| Find point clusters | result, min points | 20 | 10 | -10 |
| Find point clusters | billing, cost | 0.086 | 0.0584 | -0.0276 |
| Find point clusters | billing, list price | 0.086 | 0.0584 | -0.0276 |
| Outliers | result, elapsed ms | 1 | 2 | 1 |
| Change beside the counts per neighborhood | result, count | 8 | 16 | 8 |
| Change beside the counts per neighborhood | result, elapsed ms | 2 | 1 | -1 |
| Change beside the counts per neighborhood | billing, cost | 0.05086 | 0.01066 | -0.0402 |
| Change beside the counts per neighborhood | billing, list price | 0.05086 | 0.01066 | -0.0402 |
| Change of dropped calls where density is high | result, count | 8 | 16 | 8 |
| Change of dropped calls where density is high | result, elapsed ms | 2 | 1 | -1 |
| Change of dropped calls where density is high | billing, cost | 0.05086 | 0.018 | -0.03286 |
| Change of dropped calls where density is high | billing, list price | 0.05086 | 0.018 | -0.03286 |
| Hot cells of dropped calls per neighborhood | result, elapsed ms | 1 | 32 | 31 |
| Hot cells of dropped calls per neighborhood | billing, cost | 0.0105 | 0.04628 | 0.03578 |
| Hot cells of dropped calls per neighborhood | billing, list price | 0.0105 | 0.04628 | 0.03578 |
| Dense areas of coverage complaints | result, count | 2 | 5 | 3 |
| Dense areas of coverage complaints | result, elapsed ms | 0 | 6 | 6 |
| Dense areas of coverage complaints | billing, cost | 0.02034 | 0.02767 | 0.00733 |
| Dense areas of coverage complaints | billing, list price | 0.02034 | 0.02767 | 0.00733 |
| Dense areas of coverage complaints | list price | 0.02034 | 0.02767 | 0.00733 |
| Clusters of all inputs together: dropped calls and coverage complaints | result, count | 2 | 2,220 | 2,218 |
| Clusters of all inputs together: dropped calls and coverage complaints | result, elapsed ms | 0 | 24 | 24 |
| Clusters of all inputs together: dropped calls and coverage complaints | billing, cost | 0.02034 | 0.1044 | 0.08406 |
| Clusters of all inputs together: dropped calls and coverage complaints | billing, list price | 0.02034 | 0.1044 | 0.08406 |
| Clusters of all inputs together: dropped calls and coverage complaints | list price | 0.02034 | 0.1044 | 0.08406 |
| Documents | Documents | 7 | 1 | -6 |
| Documents | Entities | 7 | 11 | 4 |
| Documents | Event terms | 7 | 4 | -3 |
New findings:
- Change beside the counts per neighborhood, from Period change: Dropped calls (week of 2026-08-24 to week of 2026-08-31) and Summarize within: Neighborhoods: the busiest area, El Cerro (327 in all), changed by -4 2357196.
- Change of coverage complaints per neighborhood, from Period change: Coverage complaints (week of 2026-08-10 to week of 2026-08-17): Los Olivos rose the most (+3) and La Ribera fell the most (-1) 2539.
- Change of dropped calls where density is high, from Period change: Dropped calls (week of 2026-08-24 to week of 2026-08-31) and Calculate density: Coverage complaints: the largest rise (+13, Los Olivos) is where density averages 13.48 per square kilometer 2387216.
- Clusters of all inputs together: dropped calls and coverage complaints over time shows a trend of -1.12 per week; the second half of its weeks has 911 against 889 in the first (+2.5%).
- Clusters of all inputs together: dropped calls and coverage complaints, from Find point clusters: Dropped calls and Find point clusters: Coverage complaints: 2220 features from 2 sources 256221223.
- Dense areas of coverage complaints, from Calculate density: Coverage complaints: the densest of five classes joins 77 cells into one area 251216.
- Hot cells of dropped calls per neighborhood, from Hot spot analysis: Dropped calls: 6 of 16 areas hold hot spot cells; El Cerro holds the most (49) 241182.
- It reported result, bins 1,798; result, count 1,798; result, elapsed ms 64; result, cell size m 200; result, incidents used 1,800; result, distance band m 500.
- It reported result, bins 305; result, count 305; result, elapsed ms 11; result, cell size m 500; result, incidents used 420; result, distance band m 1,000.
- It reported result, count 1,800; result, noise 1,744; result, distance m 100; result, elapsed ms 133; result, min points 20; billing, cost 0.086.
- It reported result, count 109; result, elapsed ms 13; result, resolution 8; result, features used 1,800; result, time neighbors 0; billing, cost 0.19.
- It reported result, count 117; result, elapsed ms 2; result, bandwidth m 2,000; result, cell size m 1,000; result, excluded null 0; result, max density per km2 2.571.
- It reported result, count 16; result, elapsed ms 1; billing, cost 0.01062; billing, list price 0.01062; billing, upstream cost 0.
- It reported result, count 16; result, elapsed ms 1; billing, cost 0.018; billing, list price 0.018; billing, upstream cost 0.
- It reported result, count 16; result, elapsed ms 2; result, permutations 199; result, excluded null 0; result, distance band m 1,998; billing, cost 0.05048.
- It reported result, count 16; result, elapsed ms 32; billing, cost 0.04628; billing, list price 0.04628; billing, upstream cost 0.
- It reported result, count 16; result, elapsed ms 3; billing, cost 0.04634; billing, list price 0.04634; billing, upstream cost 0.
- It reported result, count 2,034; result, elapsed ms 40; result, bandwidth m 500; result, cell size m 200; result, excluded null 0; result, max density per km2 368.1.
- It reported result, count 2,220; result, noise 2,093; result, distance m 100; result, elapsed ms 24; result, min points 20; billing, cost 0.1044.
- It reported result, count 5; result, elapsed ms 6; billing, cost 0.02767; billing, list price 0.02767; billing, upstream cost 0; list price 0.02767.
- It reported result, count 94; result, elapsed ms 14; result, resolution 8; result, features used 420; result, time neighbors 0; billing, cost 0.121.
- Nearest tower to each cluster of dropped calls, from Find point clusters: cluster hulls: the 2 clusters lie 1,164 to 1,536 m from the nearest facility (Tower 13 Los Pinos and others) 246221.
- Pipeline on Calculate density: Coverage complaints produced Dense areas of coverage complaints (5 features).
- Pipeline on Dropped calls, Coverage complaints produced Find point clusters: cluster hulls (3 features), Clusters of all inputs together: dropped calls and coverage complaints (2,220 features).
- Seasonality on Neighborhoods, Dropped calls produced Seasonality of Dropped calls (16 features).
- Spatial join on Calculate density: Coverage complaints, Period change: Dropped calls (week of 2026-08-24 to week of 2026-08-31) produced Change of dropped calls where density is high (16 features).
- Summarize within on Dropped calls, Neighborhoods: Summarize within: 1 layer saved: Summarize within: Neighborhoods (16 features).
- Summarize within on Hot spot analysis: Dropped calls, Neighborhoods produced Hot cells of dropped calls per neighborhood (16 features).
- The chart Dropped calls by day of week is drawn from 7 rows.
- The chart Dropped calls by hour of day is drawn from 24 rows.
- The chart Seasonality of Dropped calls is drawn from 5 rows.
- Towers within 250 m of each cluster of dropped calls, from Find point clusters: cluster hulls: 0 of 2 clusters have one within 250 m 260221.
Sources
- 1Rendering: Chart: Timeline: events per week by dataset. 96 rows id e8d57d05-8a24-4bd6-a2ab-205e81cc7b5b
- 2Dataset: Dropped calls. vector, 1800 rows id b7e0385f-4de1-4c62-91a2-29066dff0560
- 3Dataset: Coverage complaints. vector, 420 rows id d91448d8-ad7a-47b1-ae76-781a60b3553d
- 4Dataset: Cell KPIs by day. table, 784 rows id 96119c66-7aa4-458c-ab74-e33724e82359
- 5Rendering: Chart: Timeline lanes: events per week by dataset. 96 rows id 2410bb58-e2e4-44f6-98d7-5ae5fa53e3d5
- 6Rendering: Chart: Timeline: change from one week to the next. 31 rows id 47ac1dde-c2aa-4746-a6fa-1a3471dbb729
- 7Tool result: gp_period_change, step 0. The count rose from 200 in week of 2026-08-24 to 242 in week of 2026-08-31 (+21.0%); a change this small is within what chance would give (p = 0.051). id bca67820-6f58-4df0-a127-c19db4029c06:0
- 8Layer: Period change: Dropped calls (week of 2026-08-24 to week of 2026-08-31) id 9e66bb0d-6463-4d72-b91f-8f6581158257
- 9Tool result: gp_period_change, step 1. The count rose from 9 in week of 2026-08-10 to 17 in week of 2026-08-17 (+88.9%); a change this small is within what chance would give (p = 0.169). id bca67820-6f58-4df0-a127-c19db4029c06:1
- 10Layer: Period change: Coverage complaints (week of 2026-08-10 to week of 2026-08-17) id b22b41b5-3083-4e18-9aaa-cbbc598bb3b8
- 11Rendering: Map: Overview: the top 3 results. view longitude -75.6498 to -75.51316, latitude 6.19239 to 6.29351 id 1ba7aad0-e3f3-487c-bc24-6b6c851a83ed
- 12Layer: Neighborhoods. spatial profile id efbe8937-3ee5-48ad-a6d7-bc4988d33ee9
- 13Layer: Towers. spatial profile id f7206b9b-efe4-4636-af64-2c979a653d20
- 14Layer: Dropped calls. spatial profile id e2f5ccec-a668-448b-9e94-445c523f5d04
- 15Layer: Coverage complaints. spatial profile id a0e6cf38-0976-4bb9-a3d7-afb7e24830f1
- 16Layer: Fiber routes. spatial profile id ecce82d0-ca7c-4a61-a4d1-039ed28c5769
- 17Layer: Small cells. spatial profile id 0b706ff2-6fc5-4b0f-ae21-de62a3257715
- 18Catalog: Terrain analysis (analysis catalog, tr_terrain_analysis). The automatic terrain analysis of an area, with no model call: by default every terrain tool (everything), or a subset (general, mobility, observation, hydrology, site), then the elevation layer, the hypsometric curve, slope distribution, aspect rose and route profiles, the dominant heights, the cit ArcGIS: No single tool (terrain analysis workflow: Surface Parameters, Viewshed, Hydrology, Distance Accumulation). QGIS: No single tool (Processing model of GDAL DEM, r.viewshed, r.watershed and r.c id tr_terrain_analysis
- 19Plan: Terrain analysis (everything) (the Start plan's candidate c_cf00353ae2bf). Automatic terrain analysis (everything) on the project's DEM Valley terrain model (DEM); observers from the 14 point(s) of Towers: every terrain tool: relief, slope, aspect, hillshade, curvature, roughness, landforms, ravines and ridges, strategic points, hydrology (flow, streams, pour points, watersheds, flood-prone ground), mobility for every mover, the MCOO, viewsheds and lines of sight from th id a00dee40-3e85-4150-a19d-0a3dc31dc346:c_cf00353ae2bf
- 20Tool result: tr_terrain_analysis, step 0. Terrain analysis (everything) of 72.1 km2 at 30 m cells (full resolution), 28 terrain tool(s) in 36 call(s): elevation 1,475 to 2,759 m (1,284 m of relief), mean slope 13.2 degrees, 18.8% steeper than 15 degrees; 55 finding(s): Dominant heights; Key terrain candidate KT-1; Key terrain candidate KT-2 id 419ad273-47a0-406b-98dd-70082059be86:0
- 21Layer: Terrain: Terrain findings. 9 features id 64f7587d-33cb-47a9-a823-1b872e510768
- 22Layer: Terrain: Dominant heights. 5 features id d93b6fff-e88a-40a6-bbca-b9d78b84c494
- 23Layer: Terrain: Elevation (m). 0 features id 3f517292-420a-44d8-a10f-8a8154a28560
- 24Layer: Terrain: Observers. 14 features id f989287c-4dc6-4fab-9c66-43970381745a
- 25Layer: Terrain: Visible area. 1 features id 18ddc658-de2c-4ce4-9cd1-75dc8609eb68
- 26Layer: Terrain: Observers that see each cell. 0 features id 5b8c4ad6-a388-4fe3-8022-d4b7e99a432d
- 27Layer: Terrain: Viewshed. 0 features id 62de0077-4ad4-4e11-a283-465424bf00e9
- 28Layer: Terrain: Landing points. 6 features id a3dbcde4-6110-4029-8d1c-20f52328dc41
- 29Layer: Terrain: Landing zone candidates. 6 features id f781e9c0-c2e3-4346-9fe2-9287a6473991
- 30Layer: Terrain: Clear ground radius (m). 0 features id a502eb89-b29f-4656-a3b2-4d6515c5a474
- 31Layer: Terrain: Landing ground. 0 features id 151a88df-55c5-415c-b3d4-3831e52b49a1
- 32Layer: Terrain: Best mineability areas. 15 features id 42620538-31db-466b-981e-567e2df4b0fd
- 33Layer: Terrain: Mineability classes. 0 features id 8f6dfcc8-cc16-488f-a7e7-c3b12d579f63
- 34Layer: Terrain: Mineability score (0-100). 0 features id aae93c06-ce25-4155-8fd0-49fcb0ffb6c4
- 35Layer: Terrain: Site suitability classes. 0 features id fada7569-f370-43ff-b45d-d3131aa78ae7
- 36Layer: Terrain: Site suitability score (0-100). 0 features id 4410c716-1cbb-4ac7-998f-da034fc0efdc
- 37Layer: Terrain: Best buildability areas. 88 features id 7b2f06a0-3d6e-4a69-b054-6e5d63780760
- 38Layer: Terrain: Buildability classes. 0 features id 167a3ce8-6088-40f4-ba9b-f8df7813f6b8
- 39Layer: Terrain: Buildability score (0-100). 0 features id 92c176c5-149d-4d11-950e-1243fd358dcb
- 40Layer: Terrain: LS factor. 0 features id 0aa5d33c-dd82-4782-aa97-79613b1e2542
- 41Layer: Terrain: Erosion risk classes. 0 features id f93e34df-402a-4a3a-bd15-bd0955227d99
- 42Layer: Terrain: Soil loss (t/ha/yr). 0 features id fbb0b159-a47b-4d2e-8576-838bb2215592
- 43Layer: Terrain: Susceptibility classes. 0 features id 9247930a-5e0c-4cf1-8b3f-da8ffe87e457
- 44Layer: Terrain: Susceptibility index (0-1). 0 features id f77053eb-b7a3-4c4e-b8ed-eac8c303c8c3
- 45Layer: Terrain: Stability classes. 0 features id 5ee7366e-c67d-471c-9964-55f8e97f6018
- 46Layer: Terrain: Factor of safety (capped at 100). 0 features id 0defc732-305b-4016-adc0-373a1fb6c748
- 47Layer: Terrain: Solar siting class. 0 features id 75e8529d-6f3c-4986-8c9a-e60d4674c38d
- 48Layer: Terrain: Sky view factor. 0 features id 1dc6a918-a9a1-484a-be8d-39c89b7f11dc
- 49Layer: Terrain: Clear-sky insolation (kWh/m2/day). 0 features id 0cbd6baf-f7bc-49be-8379-4ef999dd1f0e
- 50Layer: Terrain summits: Profile line. 1 features id 9d1edd45-0c26-44db-985d-955857e358f9
- 51Layer: Terrain axis: Profile line. 1 features id 1d44aafa-d0ac-4bb6-85ce-3d893c286eb4
- 52Layer: Terrain summits: Least-cost routes. 1 features id 1bb99841-25a7-4802-b0a0-4cabed0d22f7
- 53Layer: Terrain axis: Least-cost routes. 1 features id 085d0ea6-d9a7-4ac9-a3e8-67165f921ce7
- 54Layer: Terrain DH-2 DH-3: Sightline. 1 features id 35ba4cc6-548b-475c-a59d-290599c14b11
- 55Layer: Terrain DH-1 DH-3: Ground visible from the observer. 3 features id 8ceb14a6-3895-4a1e-8eff-e5770cb9b00a
- 56Layer: Terrain DH-1 DH-3: Sightline. 1 features id 62150487-0000-47f0-8959-87abb535b4d4
- 57Layer: Terrain DH-1 DH-2: Sightline. 1 features id 7a13753a-a774-4257-8844-dd85c323eace
- 58Layer: Terrain heights: Observers. 5 features id 32c922b1-9175-47dd-9a6e-58ffc46de8db
- 59Layer: Terrain heights: Visible area. 5 features id 5efef585-b670-412f-a7a6-92214959afe7
- 60Layer: Terrain heights: Observers that see each cell. 0 features id 64fdf293-9192-49cc-b33a-efe921c493af
- 61Layer: Terrain heights: Viewshed. 0 features id 86c25245-0060-45a6-836f-3ef6dff9547b
- 62Layer: Terrain: Avenues of approach. 3 features id 38722c7d-2945-46be-897c-f79dccb0f815
- 63Layer: Terrain: Corridor constrictions. 3 features id 80796dff-bc1e-46d5-9ccc-60b23a70d555
- 64Layer: Terrain: Key terrain candidates. 2 features id 6957f7f1-3f48-4465-a66b-60326c71a3dc
- 65Layer: Terrain: Mobility corridors. 2 features id d3352291-a9d8-4702-9ad7-012a3226cbec
- 66Layer: Terrain: Obstacles. 1 features id 896700b6-0875-4060-9f97-29c8394bf9cb
- 67Layer: Terrain: MCOO going classes. 0 features id 21004bff-2e9a-49dc-b95b-063324f5bef3
- 68Layer: Terrain tracked: Obstacles. 1 features id 9a715b87-0631-435d-9a03-26a2c6f7b8ee
- 69Layer: Terrain tracked: Off-road speed (km/h). 0 features id f1e6d12d-083d-45d3-8d37-dd3faf25126b
- 70Layer: Terrain tracked: Going (tracked). 0 features id 7a6f7c8a-3133-4197-8784-549396e1f3ae
- 71Layer: Terrain wheeled: Obstacles. 10 features id 5ac4471d-dc6b-41dd-bd11-8acbc710e545
- 72Layer: Terrain wheeled: Off-road speed (km/h). 0 features id 9066583b-f244-4a65-bbdf-834718a7a6e6
- 73Layer: Terrain wheeled: Going (wheeled). 0 features id be24b68c-e229-4940-8dbf-7561b5e88cdd
- 74Layer: Terrain dismounted: Obstacles. 1 features id 4ffd4153-0241-4b2e-ad6f-7d2b21fcb3fd
- 75Layer: Terrain dismounted: Off-road speed (km/h). 0 features id 3452ea58-133e-4dbf-bd4a-61af08722e64
- 76Layer: Terrain dismounted: Going (dismounted). 0 features id df7be58c-68e7-48bc-aa54-c5b589252ea4
- 77Layer: Terrain: Flood-prone areas. 2 features id bbec8b91-0c84-4b01-bcfe-882f1a12c3d3
- 78Layer: Terrain: Streams (Strahler order). 9 features id ae2ad116-df6d-46ec-b7c2-2309fd59e051
- 79Layer: Terrain: Flood-prone ground (within 3 m of the stream). 0 features id fddf365d-48f5-4763-94d4-a69e88ed7035
- 80Layer: Terrain: Height above the nearest stream (m). 0 features id defa1a6b-f74b-4017-ae93-d3ca8fbed01f
- 81Layer: Terrain: Pour points (snapped). 3 features id 61ab154d-764b-4fb2-a6ee-6efa2a06baa1
- 82Layer: Terrain: Watershed boundaries. 3 features id a3b6c484-70b1-4b79-be22-a4689654f971
- 83Layer: Terrain: Watersheds. 0 features id 4e35e49c-bbfa-41b6-b679-73f720c483c5
- 84Layer: Terrain: Pour points. 3 features id 505eb291-4960-47ac-bb6d-0f447f86be86
- 85Layer: Terrain: Streams (Strahler order). 9 features id 4f51959e-b9f0-4789-9a40-24f1944eb354
- 86Layer: Terrain: Flow direction (D8). 0 features id 8daeb001-8892-4845-946c-75f45772debc
- 87Layer: Terrain: Flow accumulation (upstream cells). 0 features id e1a59966-084b-462b-80ad-dd4874c8356d
- 88Layer: Terrain: Terrain masking (cover). 5 features id f39caaee-bbc0-4230-8965-65be5471749e
- 89Layer: Terrain: Open flat ground. 9 features id 68022fea-12f0-4a9e-95b1-13c025b99a30
- 90Layer: Terrain: Observation points. 2 features id 3194d737-204b-4e37-a010-0e821e7b4828
- 91Layer: Terrain: Ridges. 36 features id f133289a-cd9d-4992-a635-256a798ea09c
- 92Layer: Terrain: Ravines. 5 features id aec08b2e-c20d-4f44-9b23-9c5492eb97d2
- 93Layer: Terrain: Landforms (geomorphons). 0 features id 303cf40d-d75f-429b-b349-339e6d883e3f
- 94Layer: Terrain: Topographic position (m). 0 features id a094fca5-4fb3-45d4-b3ba-10735382cc9a
- 95Layer: Terrain: Terrain ruggedness (m). 0 features id 05567d4d-f893-4f4a-bd5a-664f0b1b52ff
- 96Layer: Terrain: Total curvature. 0 features id 184c848f-d5b6-4ce0-82dd-6a20b3fa5e7c
- 97Layer: Terrain: Hillshade. 0 features id 6414263d-2c27-4b12-8d22-61218b247920
- 98Layer: Terrain: Aspect (degrees from north). 0 features id cbf8a9da-b18a-4be0-9918-2b1328a7b24e
- 99Layer: Terrain: Slope (degrees). 0 features id 28f58e4d-77f7-4cf4-b77a-6f8e30b37c08
- 100Layer: Terrain: Contours (100 m). 24 features id 784acbdd-110f-4071-8962-cb1bb55db4ab
- 101Rendering: Map: Terrain: elevation with hillshade. view longitude -75.64315 to -75.51915, latitude 6.19713 to 6.2889 id 1a55a586-08b9-48ef-8394-60ebe5810caa
- 102Rendering: Map: Terrain: slope. view longitude -75.64315 to -75.51915, latitude 6.19713 to 6.2889 id e367626d-33f0-474e-a3c5-7f7df78baf23
- 103Rendering: Map: Terrain analysis. view longitude -75.64065 to -75.5217, latitude 6.19781 to 6.28844 id 17b1e367-da99-4c29-8d63-55019bab1519
- 104Rendering: Map: Terrain: aspect. view longitude -75.64315 to -75.51915, latitude 6.19713 to 6.2889 id f3d0f6f5-faa7-415b-a844-0f991cdfacee
- 105Rendering: Map: Terrain analysis (continued 1). view longitude -75.64065 to -75.5217, latitude 6.19781 to 6.28844 id c371665a-b095-4e3a-9dbd-b90616d502af
- 106Rendering: Map: Terrain: landforms. view longitude -75.64315 to -75.51915, latitude 6.19713 to 6.2889 id a1cf8031-52a6-4b15-b4ee-cf3e745eed10
- 107Rendering: Map: Terrain analysis (continued 2). view longitude -75.64065 to -75.5217, latitude 6.19781 to 6.28844 id 9225fa02-4d53-4a57-a87e-d2d52cdff29f
- 108Rendering: Map: Terrain: hydrology. view longitude -75.64315 to -75.51915, latitude 6.19713 to 6.2889 id 2f2a9897-e572-46d7-8666-eda1b3283a51
- 109Rendering: Map: Terrain analysis (continued 3). view longitude -75.64065 to -75.5217, latitude 6.19781 to 6.28844 id 2384cdfc-e122-405a-b7b9-eb755e0b41dd
- 110Rendering: Map: Terrain: mobility. view longitude -75.64315 to -75.51915, latitude 6.19713 to 6.2889 id 3a0e5b65-f602-4b5b-a480-c341031d67aa
- 111Rendering: Map: Terrain analysis (continued 4). view longitude -75.64065 to -75.5217, latitude 6.19781 to 6.28844 id b02cbe2a-0579-4df1-9e34-3aca3d025707
- 112Rendering: Map: Terrain: key terrain. view longitude -75.64315 to -75.51915, latitude 6.19713 to 6.2889 id 78652fff-41b3-4808-b141-c8afd1f0f5ae
- 113Rendering: Map: Terrain analysis (continued 5). view longitude -75.64065 to -75.5217, latitude 6.19781 to 6.28844 id bf0e1f38-c356-46a1-9899-55b1d6b2bec3
- 114Rendering: Map: Terrain analysis (continued 6). view longitude -75.64065 to -75.5217, latitude 6.19781 to 6.28844 id 0ebee3ff-88a7-431e-aec0-877d9eae8f13
- 115Rendering: Map: Terrain analysis (continued 7). view longitude -75.64065 to -75.5217, latitude 6.19781 to 6.28844 id 230dc29c-dfd0-4a9c-8e10-f9cc3b0f087f
- 116Rendering: Map: Terrain analysis (continued 8). view longitude -75.64065 to -75.5217, latitude 6.19781 to 6.28844 id c55d5fbe-283d-41b2-9e3f-e8a5725b9b6d
- 117Rendering: Map: Terrain analysis (continued 9). view longitude -75.64065 to -75.5217, latitude 6.19781 to 6.28844 id f44f3325-57c0-4565-85c9-ee10b006b0d0
- 118Rendering: Map: Terrain analysis (continued 10). view longitude -75.64065 to -75.5217, latitude 6.19781 to 6.28844 id 24fa41e2-50de-4ff2-81b1-84619bfb79d0
- 119Rendering: Map: Terrain analysis (continued 11). view longitude -75.64065 to -75.5217, latitude 6.19781 to 6.28844 id 802a2bb2-78be-4a34-a6b2-b3a59449bcc0
- 120Rendering: Map: Terrain analysis (continued 12). view longitude -75.64065 to -75.5217, latitude 6.19781 to 6.28844 id 1fb407ca-f534-4586-8978-fd4047e77b80
- 121Rendering: Map: Terrain analysis (continued 13). view longitude -75.64065 to -75.5217, latitude 6.19781 to 6.28844 id e6981d1b-7da7-41fe-8b99-997aa0b201ea
- 122Rendering: Map: Terrain analysis (continued 14). view longitude -75.64065 to -75.5217, latitude 6.19781 to 6.28844 id f83927da-5fed-4d09-8ce6-cb534dccc254
- 123Rendering: Map: Terrain analysis (continued 15). view longitude -75.64065 to -75.5217, latitude 6.19781 to 6.28844 id b5b3491b-6988-43e9-830d-951ba5bea359
- 124Rendering: Map: Terrain analysis (continued 16). view longitude -75.64065 to -75.5217, latitude 6.19781 to 6.28844 id d7455844-c707-433c-b9d5-b58a26da33aa
- 125Rendering: Map: Terrain analysis (continued 17). view longitude -75.64065 to -75.5217, latitude 6.19781 to 6.28844 id e50baa1f-836f-4b88-93a5-29a931fc6c53
- 126Rendering: Map: Terrain analysis (continued 18). view longitude -75.64065 to -75.5217, latitude 6.19781 to 6.28844 id 9cbcb4d0-93fb-4b3d-b9f3-f1673ff2bdce
- 127Rendering: Map: Terrain analysis (continued 19). view longitude -75.64065 to -75.5217, latitude 6.19781 to 6.28844 id 8668638e-0be1-4b36-8bc0-ebe3ed12a8ca
- 128Rendering: Map: Terrain analysis (continued 20). view longitude -75.64065 to -75.5217, latitude 6.19781 to 6.28844 id 069405a3-9110-4fde-97b5-36ae343bf384
- 129Rendering: Map: Terrain analysis (continued 21). view longitude -75.64065 to -75.5217, latitude 6.19781 to 6.28844 id 62bdae43-4db7-42c5-ab4a-7c5d32a4e2be
- 130Rendering: Map: Terrain analysis (continued 22). view longitude -75.64065 to -75.5217, latitude 6.19781 to 6.28844 id 1a560ccb-5eea-4758-aeee-d323f59f07cf
- 131Rendering: Chart: Hypsometric curve. 20 rows id e5e031e5-fc02-4cb9-87c4-5d657093c91a
- 132Rendering: Chart: Slope distribution. 6 rows id 9e56295d-88cd-44cd-8630-08e4936f60f3
- 133Rendering: Chart: Aspect rose. 8 rows id ea79b51a-29a9-4135-954e-7c28dbd95d8a
- 134Rendering: Chart: Elevation along the routes. 320 rows id 3be8815f-cfea-46fc-a28f-62e660c15cba
- 135Rendering: Chart: Terrain: Contours (100 m). 6 rows id 01c2cc92-53f2-4435-8711-dda67b22e869
- 136Rendering: Chart: Terrain: Ravines. 5 rows id 4e03ace2-b9e2-46ed-b1a7-71820529b500
- 137Rendering: Chart: Terrain: Ridges. 7 rows id c282ba67-7757-491c-8311-61156f46a608
- 138Rendering: Chart: Terrain: Observation points. 5 rows id f3f92aaf-c3bf-497b-8961-18292fdb6869
- 139Rendering: Chart: Terrain: Open flat ground. 5 rows id df6bd9ba-3233-44c6-a4c7-4ba1d0c46a07
- 140Rendering: Chart: Terrain: Terrain masking (cover). 5 rows id 44151c22-2981-4dce-b555-94fc23861a86
- 141Rendering: Chart: Terrain: Streams (Strahler order). 5 rows id 2a91dabb-7741-4c6d-a953-dd41be0eb7f4
- 142Rendering: Chart: Terrain: Pour points. 5 rows id 83cccd9d-ff05-4043-835b-2b956cf291d6
- 143Rendering: Chart: Terrain: Watershed boundaries. 5 rows id c04b02b6-a9d5-4d02-b1a8-a7d581efe53a
- 144Rendering: Chart: Terrain: Pour points (snapped). 5 rows id 4ad65baf-6ca5-48ef-a60d-f752da6b06a6
- 145Rendering: Chart: Terrain: Streams (Strahler order). 5 rows id c4acc103-388c-4428-8130-42fad2e589d2
- 146Rendering: Chart: Terrain: Flood-prone areas. 5 rows id d5427c83-38af-44db-808b-4ac1fb19a766
- 147Rendering: Chart: Terrain dismounted: Obstacles. 1 rows id 7561de58-e199-4e8c-9875-611f6a05acfb
- 148Rendering: Chart: Terrain wheeled: Obstacles. 5 rows id 4b3a6bcf-1f20-4e7e-b923-5ffc7f78cdb1
- 149Rendering: Chart: Terrain tracked: Obstacles. 1 rows id 121102d0-e17f-44d3-bb0d-1f2f8cf2e480
- 150Rendering: Chart: Terrain: Obstacles. 1 rows id d236e46a-f034-4ee6-ba72-f7483db75579
- 151Rendering: Chart: Terrain: Mobility corridors. 5 rows id a0ac7a6a-1d24-40e8-b519-fe80a4d54871
- 152Rendering: Chart: Terrain: Key terrain candidates. 5 rows id 94071a58-9bb4-47dd-8b89-190cc477165a
- 153Rendering: Chart: Terrain: Corridor constrictions. 5 rows id 255dd26d-18c1-44bd-8c77-488f910e1809
- 154Rendering: Chart: Terrain: Avenues of approach. 5 rows id 51114a23-313d-4f25-8cba-c310a877a2a6
- 155Rendering: Chart: Terrain heights: Visible area. 5 rows id 7b30b248-a730-42d1-8015-680b8291f70f
- 156Rendering: Chart: Terrain heights: Observers. 5 rows id fb99e9c1-de50-4fb4-9dc3-051eb48e997c
- 157Rendering: Chart: Terrain DH-1 DH-2: Sightline. 1 rows id 5c53666c-3441-46e3-9e48-e4feeecb39e5
- 158Rendering: Chart: Terrain DH-1 DH-3: Sightline. 1 rows id 20e635e4-e358-4922-a084-88d129ff5689
- 159Rendering: Chart: Terrain DH-1 DH-3: Ground visible from the observer. 5 rows id 2159c102-cbc9-4ad5-a08e-2a88bd6d86f1
- 160Rendering: Chart: Terrain DH-2 DH-3: Sightline. 1 rows id ac505eb5-36f8-4ef2-9e91-3b401e3166af
- 161Rendering: Chart: Terrain axis: Least-cost routes. 1 rows id 1f375261-a96e-498a-a51d-3384f3820951
- 162Rendering: Chart: Terrain summits: Least-cost routes. 1 rows id 1944914b-522c-472d-a4e1-dcd491d602fb
- 163Rendering: Chart: Terrain axis: Profile line. 1 rows id 376d8c3d-7f91-47fc-b87a-895adeef2e97
- 164Rendering: Chart: Terrain summits: Profile line. 1 rows id 79107e73-e3c6-4174-8be5-189b8ab90821
- 165Rendering: Chart: Terrain: Best buildability areas. 8 rows id efee82a2-3a52-48cb-9b63-03421804a245
- 166Rendering: Chart: Terrain: Best mineability areas. 5 rows id a476b743-7d5a-4e7c-8c67-31dbcac5f050
- 167Rendering: Chart: Terrain: Landing zone candidates. 5 rows id 16ec1cfc-0ab4-46ea-a960-c25fb40c1acc
- 168Rendering: Chart: Terrain: Landing points. 1 rows id b37e1a53-ceb1-4f50-8480-589f80216381
- 169Rendering: Chart: Terrain: Visible area. 1 rows id e633ba07-0df1-4653-b4cb-76c8c22ce74c
- 170Rendering: Chart: Terrain: Observers. 5 rows id bbfd6010-ac3a-4f26-a278-f13d47371c97
- 171Rendering: Chart: Terrain: Dominant heights. 5 rows id e9d2c4dd-f36f-4fc1-b56a-17438ee9ccc0
- 172Catalog: Zonal statistics (analysis catalog, rs_zonal_statistics). count/min/max/mean/std/sum/median/majority per polygon as a table and as GeoJSON. ArcGIS: Zonal Statistics as Table (polygons). id rs_zonal_statistics
- 173Plan: Zonal statistics of Valley terrain model (DEM) and Neighborhoods (the Start plan's candidate c_68a579bec9c4). Statistics of Valley terrain model (DEM) inside each feature of Neighborhoods. id a00dee40-3e85-4150-a19d-0a3dc31dc346:c_68a579bec9c4
- 174Tool result: rs_zonal_statistics, step 1. Zonal statistics: 16 row(s). zones 16. id 419ad273-47a0-406b-98dd-70082059be86:1
- 175Catalog: Slope (analysis catalog, tr_slope). Horn slope in degrees or percent, with the share of ground in six grade classes. ArcGIS: Slope (Spatial Analyst). QGIS: Slope (GDAL DEM). id tr_slope
- 176Plan: Slope of Valley terrain model (DEM) (the Start plan's candidate c_11fca56bf708). Slope of the Valley terrain model (DEM) surface. id a00dee40-3e85-4150-a19d-0a3dc31dc346:c_11fca56bf708
- 177Tool result: tr_slope, step 2. Slope over 72.09 km2: mean 13.16 degrees, max 38.63 degrees; 92% of the ground is steeper than 15%. DEM: Valley terrain model (DEM) at 30 m. Verified: 2 checks passed. id 419ad273-47a0-406b-98dd-70082059be86:2
- 178Layer: Valley terrain model (DEM). 0 features id 51a68176-b4d4-46a1-82d9-a68cf283d882
- 179Layer: Slope (degrees). 0 features id 6b9f18fe-81ec-4e91-9709-e645711ba6b7
- 180Catalog: Hot spot analysis (operation catalog, gp_hot_spots). Getis-Ord Gi* hot and cold spots with z-scores, p-values and confidence bins. ArcGIS: Find Hot Spots, Hot Spot Analysis (Getis-Ord Gi*). QGIS: qgis:hotspot (plugin). id gp_hot_spots
- 181Plan: Hot spots of Dropped calls (the Start plan's candidate c_8b55db0ad281). 1800 points: Getis-Ord Gi* tests whether the concentrations in Dropped calls are statistically significant. Measured: Dropped calls are clustered (nearest-neighbor ratio 0.87, z = -10.7), median spacing 63 m. Cells of 200 m and a band of 500 m from the measured spacing. id a00dee40-3e85-4150-a19d-0a3dc31dc346:c_8b55db0ad281
- 182Tool result: gp_hot_spots, step 0. Hot spot analysis: 1 layer saved: Hot spot analysis: Dropped calls (1798 features). id b57e679d-accb-460f-8334-ed94c27d5123:0
- 183Plan: Hot spots of Coverage complaints (the Start plan's candidate c_f3733c434ec1). 420 points: Getis-Ord Gi* tests whether the concentrations in Coverage complaints are statistically significant. Measured: Coverage complaints are clustered (nearest-neighbor ratio 0.87, z = -5.0), median spacing 123 m. Cells of 500 m and a band of 1000 m from the measured spacing. id a00dee40-3e85-4150-a19d-0a3dc31dc346:c_f3733c434ec1
- 184Tool result: gp_hot_spots, step 1. Hot spot analysis: 1 layer saved: Hot spot analysis: Coverage complaints (305 features). id b57e679d-accb-460f-8334-ed94c27d5123:1
- 185Plan: Hot spots of Small cells (the Start plan's candidate c_ed8efb07fcdd). 40 points: Getis-Ord Gi* tests whether the concentrations in Small cells are statistically significant. id a00dee40-3e85-4150-a19d-0a3dc31dc346:c_ed8efb07fcdd
- 186Tool result: gp_hot_spots, step 2. Hot spot analysis: 1 layer saved: Hot spot analysis: Small cells (21 features). id b57e679d-accb-460f-8334-ed94c27d5123:2
- 187Catalog: Emerging hot spots (operation catalog, gp_space_time_hot_spots). Where hot spots are new, consecutive, intensifying, persistent, diminishing, sporadic, oscillating or historical over time. ArcGIS: Emerging Hot Spot Analysis, Create Space Time Cube. id gp_space_time_hot_spots
- 188Plan: Space time hot spots of Coverage complaints (the Start plan's candidate c_a43556cfd61a). Coverage complaints carry dates in 'date': emerging hot spot analysis finds new, intensifying and fading hot spots per week. Measured: the pattern of Coverage complaints changes over time (earlier half clustered, later half random; the center moved 305 m). id a00dee40-3e85-4150-a19d-0a3dc31dc346:c_a43556cfd61a
- 189Tool result: gp_space_time_hot_spots, step 0. Emerging hot spots: 1 layer saved: Emerging hot spots: Coverage complaints (94 features). id 0aca80f2-eb32-4b5f-a142-1245b3cd0716:0
- 190Plan: Space time hot spots of Dropped calls (the Start plan's candidate c_9336d0c58786). Dropped calls carry dates in 'occurred_at': emerging hot spot analysis finds new, intensifying and fading hot spots per week. id a00dee40-3e85-4150-a19d-0a3dc31dc346:c_9336d0c58786
- 191Tool result: gp_space_time_hot_spots, step 1. Emerging hot spots: 1 layer saved: Emerging hot spots: Dropped calls (109 features). id 0aca80f2-eb32-4b5f-a142-1245b3cd0716:1
- 192Catalog: Summarize within (operation catalog, gp_summarize_within). Count and aggregate the features inside each polygon (or bin), proportionally for lines and polygons. ArcGIS: Summarize Within, Aggregate Points. QGIS: native:countpointsinpolygon, native:sumlinelengths. id gp_summarize_within
- 193Plan: Towers per feature of Neighborhoods (the Start plan's candidate c_bdfa07d4db94). Count Towers inside each feature of Neighborhoods by technology; the counts map as a choropleth (natural breaks, sequential colors). id a00dee40-3e85-4150-a19d-0a3dc31dc346:c_bdfa07d4db94
- 194Tool result: gp_summarize_within, step 0. Summarize within: 1 layer saved: Summarize within: Neighborhoods (16 features). id 55895977-d5af-4ed0-93a7-4667ecec4453:0
- 195Tool result: gp_summarize_within, step 1. Summarize within: 1 layer saved: Summarize within: Neighborhoods (16 features). id 55895977-d5af-4ed0-93a7-4667ecec4453:1
- 196Tool result: gp_summarize_within, step 2. Summarize within: 1 layer saved: Summarize within: Neighborhoods (16 features). id 55895977-d5af-4ed0-93a7-4667ecec4453:2
- 197Catalog: Period change (analysis catalog, gp_period_change). Counts or sums per period (week over week, month over month, any two periods, or before and after a date), per area, per H3 cell or in total, with the places of largest rise and fall and a significance note. ArcGIS: Summarize Percent Change (Crime Analysis), Change Point Detection. id gp_period_change
- 198Plan: Dropped calls: change per week per feature of Neighborhoods (the Start plan's candidate c_397aae5c8874). Dropped calls carry dates in 'occurred_at' over 8 weeks: the count per week, week over week, with the places of largest rise and fall per feature of Neighborhoods and whether the change is beyond chance. id a00dee40-3e85-4150-a19d-0a3dc31dc346:c_397aae5c8874
- 199Rendering: Chart: Dropped calls: count per week. 8 rows id 8b6df35a-a8cc-4f02-a603-c5478afe381b
- 200Rendering: Chart: Dropped calls: week of 2026-08-24 to week of 2026-08-31 by place. 30 rows id ce004650-d7c2-4abe-9510-c14524c8a42a
- 201Rendering: Chart: Period change: Dropped calls (week of 2026-08-24 to week of 2026-08-31). 5 rows id ecb4716b-2b8d-4625-8ebb-d1315a2f54af
- 202Rendering: Chart: Coverage complaints: count per week. 32 rows id fc7b3206-2928-4581-aba1-cbe77aa1d9ef
- 203Rendering: Chart: Coverage complaints: week of 2026-08-10 to week of 2026-08-17 by place. 16 rows id b7f92e26-1eda-453e-af72-cc4f6fa0ca51
- 204Rendering: Chart: Period change: Coverage complaints (week of 2026-08-10 to week of 2026-08-17). 5 rows id a5a13c15-5975-47a7-a5ab-5091df90e0fd
- 205Catalog: Seasonality (analysis catalog, gp_seasonality). Counts by hour of day, day of week and month, with peaks and troughs per cycle and per area. ArcGIS: Time Series Clustering, Create Space Time Cube. id gp_seasonality
- 206Plan: Dropped calls: by hour of day and day of week (the Start plan's candidate c_9a33d664ad70). Dropped calls by hour of day, day of week: the busiest and the quietest per feature of Neighborhoods, and whether the cycle is uneven beyond chance. id a00dee40-3e85-4150-a19d-0a3dc31dc346:c_9a33d664ad70
- 207Tool result: gp_seasonality, step 2. By the busiest hour is 17:00 (154), the quietest 03:00 (6); the cycle is uneven beyond chance (p = 0); by the busiest day is Sunday (358), the quietest Monday (185); the cycle is uneven beyond chance (p = 0). 1 layer(s) saved, 2 chart(s) drawn. id bca67820-6f58-4df0-a127-c19db4029c06:2
- 208Layer: Seasonality of Dropped calls. 16 features id f3d43000-60b5-49ef-be8f-4f0803c4e504
- 209Rendering: Chart: Dropped calls by hour of day. 24 rows id 516522b9-e050-4b6b-bc2e-5e07320c0d35
- 210Rendering: Chart: Dropped calls by day of week. 7 rows id 6b9793cf-9228-4a65-b126-95698380635b
- 211Rendering: Chart: Seasonality of Dropped calls. 5 rows id 4e472220-de1a-41d3-9eed-7a1f4be76381
- 212Catalog: Calculate density (operation catalog, gp_calculate_density). Kernel density per square kilometer on a grid. ArcGIS: Calculate Density, Kernel Density. QGIS: native:heatmapkerneldensityestimation. id gp_calculate_density
- 213Plan: Kernel density of Dropped calls (the Start plan's candidate c_2f3ee2dea9de). 1800 points in Dropped calls: a density surface shows where they concentrate. Measured: Dropped calls are clustered (nearest-neighbor ratio 0.87, z = -10.7), median spacing 63 m. id a00dee40-3e85-4150-a19d-0a3dc31dc346:c_2f3ee2dea9de
- 214Tool result: gp_calculate_density, step 0. Calculate density: 1 layer saved: Calculate density: Dropped calls (2034 features). id 70a9c435-9218-4c5e-ab09-b6dde608494c:0
- 215Plan: Kernel density of Coverage complaints (the Start plan's candidate c_0fe7379d27f3). 420 points in Coverage complaints: a density surface shows where they concentrate. Measured: Coverage complaints are clustered (nearest-neighbor ratio 0.87, z = -5.0), median spacing 123 m. id a00dee40-3e85-4150-a19d-0a3dc31dc346:c_0fe7379d27f3
- 216Tool result: gp_calculate_density, step 1. Calculate density: 1 layer saved: Calculate density: Coverage complaints (383 features). id 70a9c435-9218-4c5e-ab09-b6dde608494c:1
- 217Plan: Kernel density of Small cells (the Start plan's candidate c_966f94aedf49). 40 points in Small cells: a density surface shows where they concentrate. id a00dee40-3e85-4150-a19d-0a3dc31dc346:c_966f94aedf49
- 218Tool result: gp_calculate_density, step 2. Calculate density: 1 layer saved: Calculate density: Small cells (117 features). id 70a9c435-9218-4c5e-ab09-b6dde608494c:2
- 219Catalog: Find point clusters (operation catalog, gp_find_point_clusters). Density-based clusters (DBSCAN, HDBSCAN or OPTICS, optionally space-time) with hulls and noise. ArcGIS: Find Point Clusters, Density-based Clustering. QGIS: native:dbscanclustering, native:stdbscanclustering. id gp_find_point_clusters
- 220Plan: Cluster points of Dropped calls (the Start plan's candidate c_e2399258f4de). DBSCAN finds dense groups of Dropped calls and separates noise. Measured: Dropped calls are clustered (nearest-neighbor ratio 0.87, z = -10.7), median spacing 63 m. DBSCAN at 100 m (twice the measured spacing). id a00dee40-3e85-4150-a19d-0a3dc31dc346:c_e2399258f4de
- 221Tool result: gp_find_point_clusters, step 0. Find point clusters: 2 layers saved: Find point clusters: Dropped calls (1800 features); Find point clusters: cluster hulls (2 features). id 8fe213de-fca0-4038-b67f-2e5e8258f8a9:0
- 222Plan: Cluster points of Coverage complaints (the Start plan's candidate c_35e276867fc7). DBSCAN finds dense groups of Coverage complaints and separates noise. Measured: Coverage complaints are clustered (nearest-neighbor ratio 0.87, z = -5.0), median spacing 123 m. DBSCAN at 200 m (twice the measured spacing). id a00dee40-3e85-4150-a19d-0a3dc31dc346:c_35e276867fc7
- 223Tool result: gp_find_point_clusters, step 1. Find point clusters: 2 layers saved: Find point clusters: Coverage complaints (420 features); Find point clusters: cluster hulls (1 feature). id 8fe213de-fca0-4038-b67f-2e5e8258f8a9:1
- 224Catalog: Average nearest neighbor (operation catalog, gp_nearest_neighbor_index). Clark-Evans ratio: clustered, dispersed or random. ArcGIS: Average Nearest Neighbor. QGIS: native:nearestneighbouranalysis. id gp_nearest_neighbor_index
- 225Plan: Nearest neighbor index of Towers (the Start plan's candidate c_a6477e52d190). The average nearest neighbor ratio says whether Towers are clustered, random or dispersed. Measured: Towers are dispersed (nearest-neighbor ratio 1.82, z = +5.8), median spacing 1.36e+03 m. The profile measured it already; the tool draws it. id a00dee40-3e85-4150-a19d-0a3dc31dc346:c_a6477e52d190
- 226Tool result: gp_nearest_neighbor_index, step 2. Average nearest neighbor: done; no map output. id 8fe213de-fca0-4038-b67f-2e5e8258f8a9:2
- 227Catalog: Find outliers (operation catalog, gp_outliers). Anselin local Moran’s I: HH, LL clusters and HL, LH outliers. ArcGIS: Find Outliers, Cluster and Outlier Analysis (Anselin Local Moran’s I). id gp_outliers
- 228Plan: Local morans i of Neighborhoods (the Start plan's candidate c_9e138ef27459). Local Moran's I maps clusters and outliers of 'population'. Measured: Neighborhoods have 34 neighboring pairs (4.25 neighbors per area, 0 isolated), so neighbors can be compared. id a00dee40-3e85-4150-a19d-0a3dc31dc346:c_9e138ef27459
- 229Tool result: gp_outliers, step 0. Find outliers: 1 layer saved: Find outliers: Neighborhoods (16 features). id f1786a0f-6480-4be8-a820-014c2118ef8e:0
- 230Catalog: Spatial autocorrelation (operation catalog, gp_spatial_autocorrelation). Global Moran’s I: is the pattern clustered, dispersed or random. ArcGIS: Spatial Autocorrelation (Global Moran’s I). id gp_spatial_autocorrelation
- 231Plan: Global morans i of Neighborhoods (the Start plan's candidate c_efa49aa4d4ca). Global Moran's I says whether similar values of 'population' sit next to each other. Measured: Neighborhoods have 34 neighboring pairs (4.25 neighbors per area, 0 isolated), so neighbors can be compared. id a00dee40-3e85-4150-a19d-0a3dc31dc346:c_efa49aa4d4ca
- 232Tool result: gp_spatial_autocorrelation, step 1. Spatial autocorrelation: done; no map output. id f1786a0f-6480-4be8-a820-014c2118ef8e:1
- 233Catalog: Spatial join (operation catalog, gp_spatial_join). Attach attributes (or aggregates) of matching features from another layer, by location, distance, time and attributes. ArcGIS: Join Features, Spatial Join. QGIS: native:joinattributesbylocation, native:joinbylocationsummary, native:joinbynearest. id gp_spatial_join
- 234Plan: Spatial join of Towers and Neighborhoods (the Start plan's candidate c_da9c22d31964). Attach the Neighborhoods attributes to each of Towers. id a00dee40-3e85-4150-a19d-0a3dc31dc346:c_da9c22d31964
- 235Tool result: gp_spatial_join, step 0. Spatial join: 1 layer saved: Change beside the counts per neighborhood (16 features). id 282f5484-ba5c-44d2-b03d-756e06922d8b:0
- 236Layer: Summarize within: Neighborhoods. 16 features id 07b9a4cd-43c0-4d70-b79e-276cfc0fede7
- 237Layer: Change beside the counts per neighborhood. 16 features id 22382215-5891-4bf1-a9d6-71d8c9df1834
- 238Tool result: gp_spatial_join, step 0. Spatial join: 1 layer saved: Change of dropped calls where density is high (16 features). id 991e949e-b518-4d29-9283-1546ada3ef69:0
- 239Layer: Calculate density: Coverage complaints. 383 features id 1d475898-88cc-4539-a8b3-7f7337b37f21
- 240Layer: Change of dropped calls where density is high. 16 features id 8222d798-96eb-4799-9dd4-cfd731c8102b
- 241Tool result: gp_summarize_within, step 0. Summarize within: 1 layer saved: Hot cells of dropped calls per neighborhood (16 features). id 16f23617-8dd4-409d-b81f-820c4d214646:0
- 242Layer: Hot spot analysis: Dropped calls. 1,798 features id 1dbf3768-8a6c-4dd2-9f6d-b0809ff9a4d0
- 243Layer: Hot cells of dropped calls per neighborhood. 16 features id 463595c2-81b5-4c44-94f0-feebb8658604
- 244Catalog: Find nearest (operation catalog, gp_find_nearest). The k nearest features for each input, with geodesic distance and bearing. ArcGIS: Find Nearest, Near, Generate Near Table. QGIS: native:joinbynearest, native:nearestneighbouranalysis. id gp_find_nearest
- 245Plan: The run's goal. Describe the project Sample: Telecom, Medellin: run the analyses that tell the most about its data, draw every result, and write a cited report. id de496ddc-3bd2-4d81-bcc0-e58d35927cfd:goal
- 246Tool result: gp_find_nearest, step 0. Find nearest: 1 layer saved: Nearest tower to each cluster of dropped calls (2 features). id dbccc627-646e-4dd0-939c-12424eb9cfff:0
- 247Layer: Find point clusters: cluster hulls. 2 features id 5313780d-360e-4198-bb21-0c53f1f586db
- 248Layer: Nearest tower to each cluster of dropped calls. 2 features id fc4a51c7-b192-41b2-ba76-b96d587eb562
- 249Catalog: Pipeline (tool description, gp_pipeline). Run up to 20 GIS operations in one engine call; a step's params may use "$id" (an earlier step's result) or "$id.key", and layer references. Every step's map outputs are saved as styled layers. Never calls Mapbox. id gp_pipeline
- 250Plan: Towers per 10,000 people per feature of Neighborhoods (the Start plan's candidate c_fffb26c34f8a). Neighborhoods holds population in 'population': Towers per 10,000 people in each feature compares features of different size; mapped as a choropleth (natural breaks, sequential colors). id a00dee40-3e85-4150-a19d-0a3dc31dc346:c_fffb26c34f8a
- 251Tool result: gp_pipeline, step 0. Pipeline of 2 steps (classify_field > dissolve): 1 layer saved. id 10dc1e9a-829a-440a-9928-c9bafc5cfcfc:0
- 252Layer: Dense areas of coverage complaints. 5 features id f989a643-ec4f-442c-97be-8a0fddd52a26
- 253Tool result: gp_summarize_within, step 0. Summarize within: 1 layer saved: Change of coverage complaints per neighborhood (16 features). id 10890110-b724-4750-94f1-10fd8c977156:0
- 254Layer: Change of coverage complaints per neighborhood. 16 features id d32232a5-46f8-49d5-aa5b-9c9e6b54114b
- 255Plan: Dropped calls per 10,000 people per feature of Neighborhoods (the Start plan's candidate c_86bee1bc8eec). Neighborhoods holds population in 'population': Dropped calls per 10,000 people in each feature compares features of different size; mapped as a choropleth (natural breaks, sequential colors). id a00dee40-3e85-4150-a19d-0a3dc31dc346:c_86bee1bc8eec
- 256Tool result: gp_pipeline, step 0. Pipeline of 2 steps (merge_layers > find_point_clusters): 2 layers saved. id 1fed814d-2dfa-4cf1-9e16-0e0d10059eb1:0
- 257Layer: Find point clusters: cluster hulls. 3 features id ea31f3f4-b400-4d67-9bc9-8c4cf2d61283
- 258Layer: Clusters of all inputs together: dropped calls and coverage complaints. 2,220 features id ee796301-5d0a-41a0-bc40-b37c75f8316e
- 259Rendering: Chart: Clusters of all inputs together: dropped calls and coverage complaints over time. 32 rows id 0a6729a9-a79e-4eb0-8e24-006b330cef61
- 260Tool result: gp_pipeline, step 0. Pipeline of 2 steps (buffer > summarize_within): 1 layer saved. id f9f27f84-f111-4a4c-bbb8-c78cea2257df:0
- 261Layer: Towers within 250 m of each cluster of dropped calls. 2 features id aa01efd8-91d6-4e2e-bfe4-e13b7860bd90
- 262Rendering: Chart: Dropped calls over time (occurred_at). 32 rows id 0681173b-b38f-4b01-a4d7-2ab74ab91700
- 263Rendering: Chart: Coverage complaints over time (date). 96 rows id 6f41bbcd-2031-4ed1-99c1-1ad010efb552
- 264Rendering: Chart: Cell KPIs by day over time (date). 8 rows id d725991f-1d8a-4f5c-864a-5486cdb95bbb
- 265Rendering: Chart: Site leases over time (lease_end_year). 5 rows id 58f93069-51bd-440b-a9e4-b70009ecd554
- 266Rendering: Chart: Hot spot analysis: Dropped calls. 52 rows id 03c9261a-d273-4086-abb3-efd4f10fdf1b
- 267Rendering: Chart: Hot spot analysis: Coverage complaints. 24 rows id a9cc4c22-20b0-4f47-858f-699f70dae447
- 268Rendering: Chart: Hot spot analysis: Small cells. 6 rows id c67b881d-0bfc-4658-b18c-594033e9650c
- 269Rendering: Chart: Emerging hot spots: Coverage complaints. 8 rows id 5ea8ca11-6b11-4e39-bf0a-8997736de7a3
- 270Rendering: Chart: Emerging hot spots: Dropped calls. 8 rows id 6303d20b-1860-4709-a0c8-0c0298c5c5a2
- 271Rendering: Chart: Summarize within: Neighborhoods. 5 rows id 80783649-c91f-4c92-9276-3d11f50436cb
- 272Rendering: Chart: Summarize within: Neighborhoods. 5 rows id 6fc5004d-264e-49e5-ad6c-d4d543dc52fd
- 273Rendering: Chart: Summarize within: Neighborhoods. 5 rows id 8facccf9-0a3f-4519-8e85-fd26bf2db6dd
- 274Rendering: Chart: Calculate density: Dropped calls. 12 rows id 1c010436-0bb1-4b53-89b8-9698a11dd46c
- 275Rendering: Chart: Calculate density: Coverage complaints. 10 rows id f20038e2-e629-4efb-a84a-c466fc2dd82e
- 276Rendering: Chart: Calculate density: Small cells. 8 rows id f55923d1-2540-4ccd-8136-64b2079373d5
- 277Rendering: Chart: Find point clusters: Dropped calls. 3 rows id 37e96529-f2a3-44ba-862a-6d13759196cc
- 278Rendering: Chart: Find point clusters: cluster hulls. 2 rows id bbc68612-5048-4a74-99bd-d51836232dfc
- 279Rendering: Chart: Find point clusters: Coverage complaints. 2 rows id ffe9bca7-c681-47f9-9f55-c9cb4efc025a
- 280Rendering: Chart: Find point clusters: cluster hulls. 1 rows id 6a62a92f-bead-4280-bda5-84067ec03d9b
- 281Rendering: Chart: Find outliers: Neighborhoods. 16 rows id 68e28373-d8c2-4e4a-926a-4ae3bc9e8b75
- 282Rendering: Chart: Find point clusters: Coverage complaints over time. 96 rows id 34abe3a8-df38-4071-8fd0-3bd1fd8b5620
- 283Rendering: Chart: Find point clusters: Dropped calls over time. 32 rows id fe5f81a0-7b11-4ccf-9ac2-ff9d18c9874b
- 284Rendering: Map: Terrain analysis (continued 23). view longitude -75.64065 to -75.5217, latitude 6.19781 to 6.28844 id 7ba2e232-611a-4a54-a5b2-59ca9e6394ea
- 285Rendering: Map: Terrain analysis (continued 24). view longitude -75.64065 to -75.5217, latitude 6.19781 to 6.28844 id 91a5bfd8-7f1c-49ee-aa82-92bb8b7006af
- 286Rendering: Map: Terrain analysis (continued 25). view longitude -75.64065 to -75.5217, latitude 6.19781 to 6.28844 id bfd30168-038c-4ea7-95c3-e4de3a96656d
- 287Rendering: Map: Terrain analysis (continued 26). view longitude -75.64065 to -75.5217, latitude 6.19781 to 6.28844 id 2fdd9996-023b-4d2b-8dd6-518f43e65e90
- 288Rendering: Map: Terrain analysis (continued 27). view longitude -75.64065 to -75.5217, latitude 6.19781 to 6.28844 id 9f967a9d-7f16-4b64-87c5-b25cf48385a5
- 289Rendering: Map: Terrain analysis (continued 28). view longitude -75.64065 to -75.5217, latitude 6.19781 to 6.28844 id a5090724-5011-4f0c-8d3a-1015010cbddf
- 290Rendering: Map: Terrain analysis (continued 29). view longitude -75.64065 to -75.5217, latitude 6.19781 to 6.28844 id 941a89ab-4148-444d-8ac2-d58aa7b4c7fc
- 291Rendering: Map: Terrain analysis (continued 30). view longitude -75.64065 to -75.5217, latitude 6.19781 to 6.28844 id 7010e697-e94e-475d-b5b8-cbb9ea19ae0e
- 292Rendering: Map: Terrain analysis (continued 31). view longitude -75.64065 to -75.5217, latitude 6.19781 to 6.28844 id 6052254a-99c3-44e1-aead-2e2d7eb8c113
- 293Rendering: Map: Terrain analysis (continued 32). view longitude -75.64065 to -75.5217, latitude 6.19781 to 6.28844 id f331279f-2646-46b8-b180-f6a801b825f8
- 294Rendering: Map: Terrain analysis (continued 33). view longitude -75.64065 to -75.5217, latitude 6.19781 to 6.28844 id afb22b11-87dd-424e-b451-05d1b841f806
- 295Rendering: Map: Terrain analysis (continued 34). view longitude -75.64065 to -75.5217, latitude 6.19781 to 6.28844 id 9ffe9b08-f2f8-430b-989a-39cd2b625e33
- 296Rendering: Map: Terrain analysis (continued 35). view longitude -75.64065 to -75.5217, latitude 6.19781 to 6.28844 id ffc6e4c3-c85c-462c-8979-46fd13c3a992
- 297Rendering: Map: Terrain analysis (continued 36). view longitude -75.64065 to -75.5217, latitude 6.19781 to 6.28844 id 5185d8c1-a699-46cd-959e-19be9ecb8208
- 298Rendering: Map: Terrain analysis (continued 37). view longitude -75.64065 to -75.5217, latitude 6.19781 to 6.28844 id b1b46527-eb1a-440b-aa0f-d980eb201b38
- 299Rendering: Map: Terrain analysis (continued 38). view longitude -75.64065 to -75.5217, latitude 6.19781 to 6.28844 id b55b0ffe-007f-4985-b99d-725489b399c0
- 300Rendering: Map: Terrain analysis (continued 39). view longitude -75.64065 to -75.5217, latitude 6.19781 to 6.28844 id 894cb6f5-aac8-4566-9903-e1f7d6c859b3
- 301Rendering: Map: Terrain analysis (continued 40). view longitude -75.64065 to -75.5217, latitude 6.19781 to 6.28844 id 16f16b10-7162-4331-a6f7-673a54b64d43
- 302Rendering: Map: Terrain analysis (continued 41). view longitude -75.64065 to -75.5217, latitude 6.19781 to 6.28844 id 6193886d-7ee4-450b-bbef-c6bc65b6f4b7
- 303Rendering: Map: Slope: valley terrain model (DEM). view longitude -75.64065 to -75.5217, latitude 6.19781 to 6.28844 id 9d1771b1-dda8-4425-b2f4-624be210443c
- 304Rendering: Map: Hot spots: dropped calls. view longitude -75.64245 to -75.521, latitude 6.19662 to 6.28916 id ba1b1bc8-89c3-4d28-ba5e-4818ae1fac72
- 305Rendering: Map: Hot spots: coverage complaints. view longitude -75.6474 to -75.51542, latitude 6.19269 to 6.29326 id 5e496c34-3a8e-4b72-839d-6216c7e20584
- 306Rendering: Map: Hot spots: small cells. view longitude -75.66626 to -75.50711, latitude 6.17736 to 6.29862 id a44b5e5c-f7c0-4792-bd5c-081b9430d44c
- 307Rendering: Map: Emerging hot spots: coverage complaints and dropped calls. view longitude -75.65596 to -75.50436, latitude 6.18436 to 6.29656 id 380f8a67-2099-4242-a0e6-676ad2a3d706
- 308Rendering: Map: Counts: towers, by neighborhood. view longitude -75.64065 to -75.5217, latitude 6.19781 to 6.28844 id a03d1c9b-c252-4d57-9d06-80c0a21d1faa
- 309Rendering: Map: Counts: small cells, by neighborhood. view longitude -75.64065 to -75.5217, latitude 6.19781 to 6.28844 id 6304a730-e2b7-42d0-9619-8c47de65575a
- 310Rendering: Map: Counts: dropped calls, by neighborhood. view longitude -75.64065 to -75.5217, latitude 6.19781 to 6.28844 id f1d9bd1c-d035-40ff-beb6-d78a53faeb5c
- 311Rendering: Map: Period change: dropped calls, by neighborhood. view longitude -75.64277 to -75.51963, latitude 6.19749 to 6.28863 id eb007c4e-5f1b-4ef3-9e68-783b13fe65c7
- 312Rendering: Map: Period change: coverage complaints, by neighborhood. view longitude -75.63751 to -75.52498, latitude 6.2049 to 6.28818 id 3a2a010d-def6-40d4-84aa-7e5fac94898c
- 313Rendering: Map: Seasonality: dropped calls, by neighborhood. view longitude -75.64277 to -75.51963, latitude 6.19749 to 6.28863 id d59703ba-960c-4164-ac85-b8e9bb5f0559
- 314Rendering: Map: Density: dropped calls. view longitude -75.64705 to -75.51598, latitude 6.19306 to 6.29293 id 80eac121-f07a-42c1-8bc2-c1ffe0d6f498
- 315Rendering: Map: Density: coverage complaints. view longitude -75.65486 to -75.50637, latitude 6.18703 to 6.30018 id 98b0b8c4-c591-4d09-84d6-457a4f91f94b
- 316Rendering: Map: Density: small cells. view longitude -75.66793 to -75.49012, latitude 6.17641 to 6.3119 id f02d869a-03a0-4bf9-a8c3-ccae27642b47
- 317Rendering: Map: Clusters: dropped calls. view longitude -75.6395 to -75.523, latitude 6.1989 to 6.28767 id 7b5220df-dadc-42a5-9f23-3e8009c2eddb
- 318Rendering: Map: Clusters: coverage complaints. view longitude -75.63988 to -75.52338, latitude 6.19877 to 6.28754 id 7648442d-ff4b-4d97-a890-fc939e3d2d29
- 319Rendering: Map: Outliers: neighborhoods. view longitude -75.64065 to -75.5217, latitude 6.19781 to 6.28844 id aa89b4f2-ae09-4e89-80cb-75ab51db9ae1
- 320Rendering: Map: Change beside the counts per neighborhood. view longitude -75.64065 to -75.5217, latitude 6.19781 to 6.28844 id 114e78e7-68ad-4862-91ef-02eff7d20604
- 321Rendering: Map: Change of dropped calls where density is high. view longitude -75.64065 to -75.5217, latitude 6.19781 to 6.28844 id ec3911c3-7eae-4b38-9527-253d456903d7
- 322Rendering: Map: Hot cells of dropped calls per neighborhood. view longitude -75.64065 to -75.5217, latitude 6.19781 to 6.28844 id 79259c3e-1feb-42e5-9349-debbff5e6940
- 323Rendering: Map: Nearest tower to each cluster of dropped calls. view longitude -75.55941 to -75.5498, latitude 6.24305 to 6.25037 id 7f662cc4-1d6c-483c-b75a-559a63a39fda
- 324Rendering: Map: Change of coverage complaints per neighborhood. view longitude -75.64065 to -75.5217, latitude 6.19781 to 6.28844 id 89d884a1-9030-4a7b-97a0-db01ee450ab4
- 325Rendering: Map: Clusters of all inputs together: dropped calls and coverage complaints. view longitude -75.6395 to -75.523, latitude 6.19877 to 6.28754 id 8ef52cb6-2830-4fd8-9733-b7fc8ab4e04f
- 326Rendering: Map: Towers within 250 m of each cluster of dropped calls. view longitude -75.56316 to -75.54608, latitude 6.24013 to 6.25314 id 432f6a00-2da5-49a3-9d7a-8e2e691de44e
- 327Document: Network performance review, August and September 2026. 1 page(s), 1 page(s) from the text layer id 2ab288be-688c-4831-8e20-a7f05cb66642
- 328Document page: Network performance review, August and September 2026, page 1. Sample document: synthetic data.* Most coverage drops sit on the eastern slopes in Los Olivos, behind the ridge, around 6.24785, -75.55517; no valley tower sees that slope. id 2ab288be-688c-4831-8e20-a7f05cb66642:1
- 329Dataset: Neighborhoods. vector, 16 rows id b54822d8-c1c1-46ca-9ffb-512aad30de12
- 330Dataset: Towers. vector, 14 rows id 444f52fe-8be9-413e-8a92-2dea9c3c3a3a
- 331Dataset: Fiber routes. vector, 19 rows id 9b993085-682e-439d-9202-d4e2c5530087
- 332Dataset: Small cells. vector, 40 rows id a9c84a25-e7ab-4869-b005-982f041f3080
- 333Dataset: Valley terrain model (DEM). raster, ? rows id f309cad9-7065-421d-b65f-542f4ad825d1
- 334Dataset: Site leases. table, 14 rows id 6809dc14-fdde-4af8-9d7f-19c5b2ec1403
- 335Dataset: Network performance review. document, ? rows id 8d46bafb-b62e-4cfe-826f-6e98f9ba3477
- 336Record: Sample: Telecom, Medellin id bceeca13-52a5-4344-bf84-77a2f9f8e186
- 337Layer: Hot spot analysis: Coverage complaints. 305 features id 538a875c-9598-4717-a3ca-5b58d23a31fc
- 338Layer: Hot spot analysis: Small cells. 21 features id 5f9e6840-03d3-4652-b348-bae22eed19fd
- 339Layer: Emerging hot spots: Coverage complaints. 94 features id 4989d796-f544-4fad-90b1-baf86f137f51
- 340Layer: Emerging hot spots: Dropped calls. 109 features id afa274cb-c4df-48de-aa11-71ef9b6da39d
- 341Layer: Summarize within: Neighborhoods. 16 features id 7156bcb4-52eb-4982-bb91-f6bb82c6cd3a
- 342Layer: Summarize within: Neighborhoods. 16 features id 9c7cbc96-f424-400e-a849-c04ea07500ff
- 343Layer: Calculate density: Dropped calls. 2,034 features id b06077fa-d8fe-4c22-a048-2be63772bc6a
- 344Layer: Calculate density: Small cells. 117 features id f41e0de7-a388-4cc6-b181-c1181ef5abb5
- 345Layer: Find point clusters: Dropped calls. 1,800 features id 0ca0a340-90e6-4a5c-9e43-388a97d02b94
- 346Layer: Find point clusters: cluster hulls. 1 features id bd39a5f0-c5ae-4773-adc2-68414f3ad727
- 347Layer: Find point clusters: Coverage complaints. 420 features id f7460ebf-7b40-4ee2-8594-1d26f54dc5f3
- 348Layer: Find outliers: Neighborhoods. 16 features id bea1ed6b-133f-4ba2-aa1d-595e35262e30
Appendix: the data behind the chartsShow
Figure 1. Timeline: events per week by dataset 1
| period | series | value |
|---|---|---|
| 2026-02-23 | Dropped calls | 0 |
| 2026-02-23 | Cell KPIs by day | 0 |
| 2026-02-23 | Coverage complaints | 4 |
| 2026-03-02 | Dropped calls | 0 |
| 2026-03-02 | Cell KPIs by day | 0 |
| 2026-03-02 | Coverage complaints | 11 |
| 2026-03-09 | Dropped calls | 0 |
| 2026-03-09 | Cell KPIs by day | 0 |
| 2026-03-09 | Coverage complaints | 14 |
| 2026-03-16 | Dropped calls | 0 |
| 2026-03-16 | Cell KPIs by day | 0 |
| 2026-03-16 | Coverage complaints | 12 |
| 2026-03-23 | Dropped calls | 0 |
| 2026-03-23 | Cell KPIs by day | 0 |
| 2026-03-23 | Coverage complaints | 14 |
| 2026-03-30 | Dropped calls | 0 |
| 2026-03-30 | Cell KPIs by day | 0 |
| 2026-03-30 | Coverage complaints | 13 |
| 2026-04-06 | Dropped calls | 0 |
| 2026-04-06 | Cell KPIs by day | 0 |
| 2026-04-06 | Coverage complaints | 16 |
| 2026-04-13 | Dropped calls | 0 |
| 2026-04-13 | Cell KPIs by day | 0 |
| 2026-04-13 | Coverage complaints | 11 |
| 2026-04-20 | Dropped calls | 0 |
| 2026-04-20 | Cell KPIs by day | 0 |
| 2026-04-20 | Coverage complaints | 15 |
| 2026-04-27 | Dropped calls | 0 |
| 2026-04-27 | Cell KPIs by day | 0 |
| 2026-04-27 | Coverage complaints | 10 |
| 2026-05-04 | Dropped calls | 0 |
| 2026-05-04 | Cell KPIs by day | 0 |
| 2026-05-04 | Coverage complaints | 11 |
| 2026-05-11 | Dropped calls | 0 |
| 2026-05-11 | Cell KPIs by day | 0 |
| 2026-05-11 | Coverage complaints | 18 |
| 2026-05-18 | Dropped calls | 0 |
| 2026-05-18 | Cell KPIs by day | 0 |
| 2026-05-18 | Coverage complaints | 17 |
| 2026-05-25 | Dropped calls | 0 |
| 2026-05-25 | Cell KPIs by day | 0 |
| 2026-05-25 | Coverage complaints | 11 |
| 2026-06-01 | Dropped calls | 0 |
| 2026-06-01 | Cell KPIs by day | 0 |
| 2026-06-01 | Coverage complaints | 8 |
| 2026-06-08 | Dropped calls | 0 |
| 2026-06-08 | Cell KPIs by day | 0 |
| 2026-06-08 | Coverage complaints | 13 |
| 2026-06-15 | Dropped calls | 0 |
| 2026-06-15 | Cell KPIs by day | 0 |
| 2026-06-15 | Coverage complaints | 16 |
| 2026-06-22 | Dropped calls | 0 |
| 2026-06-22 | Cell KPIs by day | 0 |
| 2026-06-22 | Coverage complaints | 15 |
| 2026-06-29 | Dropped calls | 0 |
| 2026-06-29 | Cell KPIs by day | 0 |
| 2026-06-29 | Coverage complaints | 11 |
| 2026-07-06 | Dropped calls | 0 |
| 2026-07-06 | Cell KPIs by day | 0 |
| 2026-07-06 | Coverage complaints | 18 |
| 2026-07-13 | Dropped calls | 0 |
| 2026-07-13 | Cell KPIs by day | 0 |
| 2026-07-13 | Coverage complaints | 13 |
| 2026-07-20 | Dropped calls | 0 |
| 2026-07-20 | Cell KPIs by day | 0 |
| 2026-07-20 | Coverage complaints | 13 |
| 2026-07-27 | Dropped calls | 0 |
| 2026-07-27 | Cell KPIs by day | 0 |
| 2026-07-27 | Coverage complaints | 16 |
| 2026-08-03 | Dropped calls | 239 |
| 2026-08-03 | Cell KPIs by day | 98 |
| 2026-08-03 | Coverage complaints | 14 |
| 2026-08-10 | Dropped calls | 232 |
| 2026-08-10 | Cell KPIs by day | 98 |
| 2026-08-10 | Coverage complaints | 9 |
| 2026-08-17 | Dropped calls | 218 |
| 2026-08-17 | Cell KPIs by day | 98 |
| 2026-08-17 | Coverage complaints | 17 |
| 2026-08-24 | Dropped calls | 200 |
| 2026-08-24 | Cell KPIs by day | 98 |
| 2026-08-24 | Coverage complaints | 19 |
| 2026-08-31 | Dropped calls | 242 |
| 2026-08-31 | Cell KPIs by day | 98 |
| 2026-08-31 | Coverage complaints | 15 |
| 2026-09-07 | Dropped calls | 224 |
| 2026-09-07 | Cell KPIs by day | 98 |
| 2026-09-07 | Coverage complaints | 10 |
| 2026-09-14 | Dropped calls | 218 |
| 2026-09-14 | Cell KPIs by day | 98 |
| 2026-09-14 | Coverage complaints | 16 |
| 2026-09-21 | Dropped calls | 227 |
| 2026-09-21 | Cell KPIs by day | 98 |
| 2026-09-21 | Coverage complaints | 13 |
| 2026-09-28 | Dropped calls | 0 |
| 2026-09-28 | Cell KPIs by day | 0 |
| 2026-09-28 | Coverage complaints | 7 |
Figure 2. Timeline lanes: events per week by dataset 5
| lane | period | period_end | value |
|---|---|---|---|
| Dropped calls | 2026-02-23 | 2026-03-02 | 0 |
| Dropped calls | 2026-03-02 | 2026-03-09 | 0 |
| Dropped calls | 2026-03-09 | 2026-03-16 | 0 |
| Dropped calls | 2026-03-16 | 2026-03-23 | 0 |
| Dropped calls | 2026-03-23 | 2026-03-30 | 0 |
| Dropped calls | 2026-03-30 | 2026-04-06 | 0 |
| Dropped calls | 2026-04-06 | 2026-04-13 | 0 |
| Dropped calls | 2026-04-13 | 2026-04-20 | 0 |
| Dropped calls | 2026-04-20 | 2026-04-27 | 0 |
| Dropped calls | 2026-04-27 | 2026-05-04 | 0 |
| Dropped calls | 2026-05-04 | 2026-05-11 | 0 |
| Dropped calls | 2026-05-11 | 2026-05-18 | 0 |
| Dropped calls | 2026-05-18 | 2026-05-25 | 0 |
| Dropped calls | 2026-05-25 | 2026-06-01 | 0 |
| Dropped calls | 2026-06-01 | 2026-06-08 | 0 |
| Dropped calls | 2026-06-08 | 2026-06-15 | 0 |
| Dropped calls | 2026-06-15 | 2026-06-22 | 0 |
| Dropped calls | 2026-06-22 | 2026-06-29 | 0 |
| Dropped calls | 2026-06-29 | 2026-07-06 | 0 |
| Dropped calls | 2026-07-06 | 2026-07-13 | 0 |
| Dropped calls | 2026-07-13 | 2026-07-20 | 0 |
| Dropped calls | 2026-07-20 | 2026-07-27 | 0 |
| Dropped calls | 2026-07-27 | 2026-08-03 | 0 |
| Dropped calls | 2026-08-03 | 2026-08-10 | 239 |
| Dropped calls | 2026-08-10 | 2026-08-17 | 232 |
| Dropped calls | 2026-08-17 | 2026-08-24 | 218 |
| Dropped calls | 2026-08-24 | 2026-08-31 | 200 |
| Dropped calls | 2026-08-31 | 2026-09-07 | 242 |
| Dropped calls | 2026-09-07 | 2026-09-14 | 224 |
| Dropped calls | 2026-09-14 | 2026-09-21 | 218 |
| Dropped calls | 2026-09-21 | 2026-09-28 | 227 |
| Dropped calls | 2026-09-28 | 2026-10-05 | 0 |
| Cell KPIs by day | 2026-02-23 | 2026-03-02 | 0 |
| Cell KPIs by day | 2026-03-02 | 2026-03-09 | 0 |
| Cell KPIs by day | 2026-03-09 | 2026-03-16 | 0 |
| Cell KPIs by day | 2026-03-16 | 2026-03-23 | 0 |
| Cell KPIs by day | 2026-03-23 | 2026-03-30 | 0 |
| Cell KPIs by day | 2026-03-30 | 2026-04-06 | 0 |
| Cell KPIs by day | 2026-04-06 | 2026-04-13 | 0 |
| Cell KPIs by day | 2026-04-13 | 2026-04-20 | 0 |
| Cell KPIs by day | 2026-04-20 | 2026-04-27 | 0 |
| Cell KPIs by day | 2026-04-27 | 2026-05-04 | 0 |
| Cell KPIs by day | 2026-05-04 | 2026-05-11 | 0 |
| Cell KPIs by day | 2026-05-11 | 2026-05-18 | 0 |
| Cell KPIs by day | 2026-05-18 | 2026-05-25 | 0 |
| Cell KPIs by day | 2026-05-25 | 2026-06-01 | 0 |
| Cell KPIs by day | 2026-06-01 | 2026-06-08 | 0 |
| Cell KPIs by day | 2026-06-08 | 2026-06-15 | 0 |
| Cell KPIs by day | 2026-06-15 | 2026-06-22 | 0 |
| Cell KPIs by day | 2026-06-22 | 2026-06-29 | 0 |
| Cell KPIs by day | 2026-06-29 | 2026-07-06 | 0 |
| Cell KPIs by day | 2026-07-06 | 2026-07-13 | 0 |
| Cell KPIs by day | 2026-07-13 | 2026-07-20 | 0 |
| Cell KPIs by day | 2026-07-20 | 2026-07-27 | 0 |
| Cell KPIs by day | 2026-07-27 | 2026-08-03 | 0 |
| Cell KPIs by day | 2026-08-03 | 2026-08-10 | 98 |
| Cell KPIs by day | 2026-08-10 | 2026-08-17 | 98 |
| Cell KPIs by day | 2026-08-17 | 2026-08-24 | 98 |
| Cell KPIs by day | 2026-08-24 | 2026-08-31 | 98 |
| Cell KPIs by day | 2026-08-31 | 2026-09-07 | 98 |
| Cell KPIs by day | 2026-09-07 | 2026-09-14 | 98 |
| Cell KPIs by day | 2026-09-14 | 2026-09-21 | 98 |
| Cell KPIs by day | 2026-09-21 | 2026-09-28 | 98 |
| Cell KPIs by day | 2026-09-28 | 2026-10-05 | 0 |
| Coverage complaints | 2026-02-23 | 2026-03-02 | 4 |
| Coverage complaints | 2026-03-02 | 2026-03-09 | 11 |
| Coverage complaints | 2026-03-09 | 2026-03-16 | 14 |
| Coverage complaints | 2026-03-16 | 2026-03-23 | 12 |
| Coverage complaints | 2026-03-23 | 2026-03-30 | 14 |
| Coverage complaints | 2026-03-30 | 2026-04-06 | 13 |
| Coverage complaints | 2026-04-06 | 2026-04-13 | 16 |
| Coverage complaints | 2026-04-13 | 2026-04-20 | 11 |
| Coverage complaints | 2026-04-20 | 2026-04-27 | 15 |
| Coverage complaints | 2026-04-27 | 2026-05-04 | 10 |
| Coverage complaints | 2026-05-04 | 2026-05-11 | 11 |
| Coverage complaints | 2026-05-11 | 2026-05-18 | 18 |
| Coverage complaints | 2026-05-18 | 2026-05-25 | 17 |
| Coverage complaints | 2026-05-25 | 2026-06-01 | 11 |
| Coverage complaints | 2026-06-01 | 2026-06-08 | 8 |
| Coverage complaints | 2026-06-08 | 2026-06-15 | 13 |
| Coverage complaints | 2026-06-15 | 2026-06-22 | 16 |
| Coverage complaints | 2026-06-22 | 2026-06-29 | 15 |
| Coverage complaints | 2026-06-29 | 2026-07-06 | 11 |
| Coverage complaints | 2026-07-06 | 2026-07-13 | 18 |
| Coverage complaints | 2026-07-13 | 2026-07-20 | 13 |
| Coverage complaints | 2026-07-20 | 2026-07-27 | 13 |
| Coverage complaints | 2026-07-27 | 2026-08-03 | 16 |
| Coverage complaints | 2026-08-03 | 2026-08-10 | 14 |
| Coverage complaints | 2026-08-10 | 2026-08-17 | 9 |
| Coverage complaints | 2026-08-17 | 2026-08-24 | 17 |
| Coverage complaints | 2026-08-24 | 2026-08-31 | 19 |
| Coverage complaints | 2026-08-31 | 2026-09-07 | 15 |
| Coverage complaints | 2026-09-07 | 2026-09-14 | 10 |
| Coverage complaints | 2026-09-14 | 2026-09-21 | 16 |
| Coverage complaints | 2026-09-21 | 2026-09-28 | 13 |
| Coverage complaints | 2026-09-28 | 2026-10-05 | 7 |
Figure 3. Timeline: change from one week to the next 6
| period | period_end | value | previous | change |
|---|---|---|---|---|
| 2026-03-02 | 2026-03-09 | 11 | 4 | 7 |
| 2026-03-09 | 2026-03-16 | 14 | 11 | 3 |
| 2026-03-16 | 2026-03-23 | 12 | 14 | -2 |
| 2026-03-23 | 2026-03-30 | 14 | 12 | 2 |
| 2026-03-30 | 2026-04-06 | 13 | 14 | -1 |
| 2026-04-06 | 2026-04-13 | 16 | 13 | 3 |
| 2026-04-13 | 2026-04-20 | 11 | 16 | -5 |
| 2026-04-20 | 2026-04-27 | 15 | 11 | 4 |
| 2026-04-27 | 2026-05-04 | 10 | 15 | -5 |
| 2026-05-04 | 2026-05-11 | 11 | 10 | 1 |
| 2026-05-11 | 2026-05-18 | 18 | 11 | 7 |
| 2026-05-18 | 2026-05-25 | 17 | 18 | -1 |
| 2026-05-25 | 2026-06-01 | 11 | 17 | -6 |
| 2026-06-01 | 2026-06-08 | 8 | 11 | -3 |
| 2026-06-08 | 2026-06-15 | 13 | 8 | 5 |
| 2026-06-15 | 2026-06-22 | 16 | 13 | 3 |
| 2026-06-22 | 2026-06-29 | 15 | 16 | -1 |
| 2026-06-29 | 2026-07-06 | 11 | 15 | -4 |
| 2026-07-06 | 2026-07-13 | 18 | 11 | 7 |
| 2026-07-13 | 2026-07-20 | 13 | 18 | -5 |
| 2026-07-20 | 2026-07-27 | 13 | 13 | 0 |
| 2026-07-27 | 2026-08-03 | 16 | 13 | 3 |
| 2026-08-03 | 2026-08-10 | 351 | 16 | 335 |
| 2026-08-10 | 2026-08-17 | 339 | 351 | -12 |
| 2026-08-17 | 2026-08-24 | 333 | 339 | -6 |
| 2026-08-24 | 2026-08-31 | 317 | 333 | -16 |
| 2026-08-31 | 2026-09-07 | 355 | 317 | 38 |
| 2026-09-07 | 2026-09-14 | 332 | 355 | -23 |
| 2026-09-14 | 2026-09-21 | 332 | 332 | 0 |
| 2026-09-21 | 2026-09-28 | 338 | 332 | 6 |
| 2026-09-28 | 2026-10-05 | 7 | 338 | -331 |
Figure 35. Hypsometric curve 131
| from_m | to_m | elev_m | area_km2 | pct | above_pct |
|---|---|---|---|---|---|
| 1,475 | 1,539 | 1,507 | 5.148 | 7.141 | 100 |
| 1,539 | 1,604 | 1,572 | 5.17 | 7.171 | 92.86 |
| 1,604 | 1,668 | 1,636 | 5.033 | 6.981 | 85.69 |
| 1,668 | 1,732 | 1,700 | 4.794 | 6.65 | 78.71 |
| 1,732 | 1,796 | 1,764 | 4.684 | 6.497 | 72.06 |
| 1,796 | 1,860 | 1,828 | 4.461 | 6.189 | 65.56 |
| 1,860 | 1,925 | 1,892 | 4.115 | 5.708 | 59.37 |
| 1,925 | 1,989 | 1,957 | 3.711 | 5.147 | 53.66 |
| 1,989 | 2,053 | 2,021 | 3.446 | 4.78 | 48.52 |
| 2,053 | 2,117 | 2,085 | 3.645 | 5.056 | 43.73 |
| 2,117 | 2,181 | 2,149 | 4.684 | 6.498 | 38.68 |
| 2,181 | 2,246 | 2,214 | 5.809 | 8.057 | 32.18 |
| 2,246 | 2,310 | 2,278 | 4.987 | 6.918 | 24.12 |
| 2,310 | 2,374 | 2,342 | 2.472 | 3.429 | 17.21 |
| 2,374 | 2,438 | 2,406 | 2.039 | 2.829 | 13.78 |
| 2,438 | 2,502 | 2,470 | 2.014 | 2.794 | 10.95 |
| 2,502 | 2,567 | 2,535 | 1.985 | 2.754 | 8.154 |
| 2,567 | 2,631 | 2,599 | 1.913 | 2.654 | 5.4 |
| 2,631 | 2,695 | 2,663 | 1.373 | 1.904 | 2.745 |
| 2,695 | 2,759 | 2,727 | 0.6066 | 0.841 | 0.841 |
Figure 36. Slope distribution 132
| class | order | from_deg | to_deg | pct | area_km2 | color |
|---|---|---|---|---|---|---|
| 0 to 2 degrees | 1 | 0 | 2 | 0.846 | 0.6102 | #1a9850 |
| 2 to 5 degrees | 2 | 2 | 5 | 2.352 | 1.696 | #91cf60 |
| 5 to 10 degrees | 3 | 5 | 10 | 17.98 | 12.96 | #d9ef8b |
| 10 to 15 degrees | 4 | 10 | 15 | 59.98 | 43.24 | #fee08b |
| 15 to 30 degrees | 5 | 15 | 30 | 15.13 | 10.91 | #fc8d59 |
| Over 30 degrees | 6 | 30 | 90 | 3.705 | 2.671 | #d73027 |
Figure 37. Aspect rose 133
| sector | order | center_deg | pct | area_km2 | color |
|---|---|---|---|---|---|
| North | 1 | 0 | 0.111 | 0.0801 | #ff0000 |
| Northeast | 2 | 45 | 1.984 | 1.43 | #ffa500 |
| East | 3 | 90 | 45.05 | 32.47 | #ffff00 |
| Southeast | 4 | 135 | 2.357 | 1.699 | #00ff00 |
| South | 5 | 180 | 0.255 | 0.1836 | #00ffff |
| Southwest | 6 | 225 | 0.195 | 0.1404 | #00a5ff |
| West | 7 | 270 | 49.01 | 35.33 | #0000ff |
| Northwest | 8 | 315 | 0.768 | 0.5535 | #ff00ff |
Figure 38. Elevation along the routes 134
| route | d_km | elev_m |
|---|---|---|
| the longest axis (best path) | 0 | 2,205 |
| the longest axis (best path) | 0.03 | 2,199 |
| the longest axis (best path) | 0.06 | 2,194 |
| the longest axis (best path) | 0.09 | 2,188 |
| the longest axis (best path) | 0.12 | 2,182 |
| the longest axis (best path) | 0.15 | 2,176 |
| the longest axis (best path) | 0.18 | 2,170 |
| the longest axis (best path) | 0.21 | 2,165 |
| the longest axis (best path) | 0.24 | 2,159 |
| the longest axis (best path) | 0.27 | 2,154 |
| the longest axis (best path) | 0.3 | 2,148 |
| the longest axis (best path) | 0.33 | 2,143 |
| the longest axis (best path) | 0.36 | 2,138 |
| the longest axis (best path) | 0.39 | 2,133 |
| the longest axis (best path) | 0.42 | 2,128 |
| the longest axis (best path) | 0.45 | 2,123 |
| the longest axis (best path) | 0.48 | 2,118 |
| the longest axis (best path) | 0.51 | 2,113 |
| the longest axis (best path) | 0.54 | 2,108 |
| the longest axis (best path) | 0.57 | 2,103 |
| the longest axis (best path) | 0.6 | 2,097 |
| the longest axis (best path) | 0.63 | 2,092 |
| the longest axis (best path) | 0.66 | 2,086 |
| the longest axis (best path) | 0.69 | 2,080 |
| the longest axis (best path) | 0.72 | 2,074 |
| the longest axis (best path) | 0.75 | 2,068 |
| the longest axis (best path) | 0.78 | 2,062 |
| the longest axis (best path) | 0.81 | 2,056 |
| the longest axis (best path) | 0.84 | 2,050 |
| the longest axis (best path) | 0.87 | 2,044 |
| the longest axis (best path) | 0.9 | 2,039 |
| the longest axis (best path) | 0.93 | 2,033 |
| the longest axis (best path) | 0.96 | 2,027 |
| the longest axis (best path) | 0.99 | 2,021 |
| the longest axis (best path) | 1.02 | 2,015 |
| the longest axis (best path) | 1.05 | 2,009 |
| the longest axis (best path) | 1.08 | 2,003 |
| the longest axis (best path) | 1.11 | 1,998 |
| the longest axis (best path) | 1.14 | 1,992 |
| the longest axis (best path) | 1.17 | 1,986 |
| the longest axis (best path) | 1.2 | 1,980 |
| the longest axis (best path) | 1.23 | 1,974 |
| the longest axis (best path) | 1.26 | 1,968 |
| the longest axis (best path) | 1.29 | 1,962 |
| the longest axis (best path) | 1.32 | 1,957 |
| the longest axis (best path) | 1.35 | 1,951 |
| the longest axis (best path) | 1.38 | 1,945 |
| the longest axis (best path) | 1.41 | 1,939 |
| the longest axis (best path) | 1.44 | 1,934 |
| the longest axis (best path) | 1.47 | 1,928 |
| the longest axis (best path) | 1.5 | 1,923 |
| the longest axis (best path) | 1.53 | 1,917 |
| the longest axis (best path) | 1.56 | 1,912 |
| the longest axis (best path) | 1.59 | 1,906 |
| the longest axis (best path) | 1.62 | 1,901 |
| the longest axis (best path) | 1.65 | 1,895 |
| the longest axis (best path) | 1.68 | 1,890 |
| the longest axis (best path) | 1.71 | 1,884 |
| the longest axis (best path) | 1.74 | 1,879 |
| the longest axis (best path) | 1.77 | 1,873 |
| the longest axis (best path) | 1.8 | 1,868 |
| the longest axis (best path) | 1.83 | 1,863 |
| the longest axis (best path) | 1.86 | 1,857 |
| the longest axis (best path) | 1.89 | 1,852 |
| the longest axis (best path) | 1.92 | 1,846 |
| the longest axis (best path) | 1.95 | 1,841 |
| the longest axis (best path) | 1.98 | 1,835 |
| the longest axis (best path) | 2.01 | 1,830 |
| the longest axis (best path) | 2.04 | 1,824 |
| the longest axis (best path) | 2.07 | 1,819 |
| the longest axis (best path) | 2.1 | 1,813 |
| the longest axis (best path) | 2.13 | 1,808 |
| the longest axis (best path) | 2.16 | 1,803 |
| the longest axis (best path) | 2.19 | 1,797 |
| the longest axis (best path) | 2.22 | 1,792 |
| the longest axis (best path) | 2.25 | 1,787 |
| the longest axis (best path) | 2.28 | 1,782 |
| the longest axis (best path) | 2.31 | 1,778 |
| the longest axis (best path) | 2.34 | 1,773 |
| the longest axis (best path) | 2.37 | 1,768 |
| the longest axis (best path) | 2.4 | 1,763 |
| the longest axis (best path) | 2.43 | 1,759 |
| the longest axis (best path) | 2.46 | 1,754 |
| the longest axis (best path) | 2.49 | 1,749 |
| the longest axis (best path) | 2.52 | 1,745 |
| the longest axis (best path) | 2.55 | 1,740 |
| the longest axis (best path) | 2.58 | 1,735 |
| the longest axis (best path) | 2.61 | 1,731 |
| the longest axis (best path) | 2.64 | 1,726 |
| the longest axis (best path) | 2.67 | 1,721 |
| the longest axis (best path) | 2.7 | 1,717 |
| the longest axis (best path) | 2.73 | 1,712 |
| the longest axis (best path) | 2.76 | 1,707 |
| the longest axis (best path) | 2.79 | 1,701 |
| the longest axis (best path) | 2.82 | 1,696 |
| the longest axis (best path) | 2.85 | 1,690 |
| the longest axis (best path) | 2.88 | 1,684 |
| the longest axis (best path) | 2.91 | 1,678 |
| the longest axis (best path) | 2.94 | 1,672 |
| the longest axis (best path) | 2.97 | 1,666 |
| the longest axis (best path) | 3 | 1,660 |
| the longest axis (best path) | 3.03 | 1,654 |
| the longest axis (best path) | 3.06 | 1,647 |
| the longest axis (best path) | 3.09 | 1,641 |
| the longest axis (best path) | 3.12 | 1,635 |
| the longest axis (best path) | 3.15 | 1,630 |
| the longest axis (best path) | 3.18 | 1,624 |
| the longest axis (best path) | 3.21 | 1,619 |
| the longest axis (best path) | 3.24 | 1,613 |
| the longest axis (best path) | 3.27 | 1,608 |
| the longest axis (best path) | 3.3 | 1,603 |
| the longest axis (best path) | 3.33 | 1,598 |
| the longest axis (best path) | 3.36 | 1,593 |
| the longest axis (best path) | 3.39 | 1,588 |
| the longest axis (best path) | 3.42 | 1,583 |
| the longest axis (best path) | 3.45 | 1,578 |
| the longest axis (best path) | 3.48 | 1,572 |
| the longest axis (best path) | 3.51 | 1,567 |
| the longest axis (best path) | 3.54 | 1,561 |
| the longest axis (best path) | 3.57 | 1,556 |
| the longest axis (best path) | 3.6 | 1,550 |
| the longest axis (best path) | 3.63 | 1,544 |
| the longest axis (best path) | 3.66 | 1,539 |
| the longest axis (best path) | 3.69 | 1,533 |
| the longest axis (best path) | 3.72 | 1,528 |
| the longest axis (best path) | 3.75 | 1,522 |
| the longest axis (best path) | 3.78 | 1,517 |
| the longest axis (best path) | 3.81 | 1,512 |
| the longest axis (best path) | 3.84 | 1,508 |
| the longest axis (best path) | 3.87 | 1,503 |
| the longest axis (best path) | 3.9 | 1,498 |
| the longest axis (best path) | 3.93 | 1,494 |
| the longest axis (best path) | 3.96 | 1,490 |
| the longest axis (best path) | 3.99 | 1,485 |
| the longest axis (best path) | 4.02 | 1,486 |
| the longest axis (best path) | 4.05 | 1,493 |
| the longest axis (best path) | 4.08 | 1,499 |
| the longest axis (best path) | 4.11 | 1,505 |
| the longest axis (best path) | 4.14 | 1,511 |
| the longest axis (best path) | 4.17 | 1,518 |
| the longest axis (best path) | 4.2 | 1,524 |
| the longest axis (best path) | 4.23 | 1,530 |
| the longest axis (best path) | 4.26 | 1,537 |
| the longest axis (best path) | 4.29 | 1,543 |
| the longest axis (best path) | 4.32 | 1,550 |
| the longest axis (best path) | 4.35 | 1,557 |
| the longest axis (best path) | 4.38 | 1,564 |
| the longest axis (best path) | 4.41 | 1,571 |
| the longest axis (best path) | 4.44 | 1,579 |
| the longest axis (best path) | 4.47 | 1,587 |
| the longest axis (best path) | 4.5 | 1,595 |
| the longest axis (best path) | 4.53 | 1,602 |
| the longest axis (best path) | 4.56 | 1,610 |
| the longest axis (best path) | 4.59 | 1,618 |
| the longest axis (best path) | 4.62 | 1,626 |
| the longest axis (best path) | 4.65 | 1,634 |
| the longest axis (best path) | 4.68 | 1,641 |
| the longest axis (best path) | 4.71 | 1,649 |
| the longest axis (best path) | 4.74 | 1,656 |
| the longest axis (best path) | 4.77 | 1,663 |
| the longest axis (best path) | 4.8 | 1,670 |
| the longest axis (best path) | 4.83 | 1,676 |
| the longest axis (best path) | 4.86 | 1,683 |
| the longest axis (best path) | 4.89 | 1,689 |
| the longest axis (best path) | 4.92 | 1,695 |
| the longest axis (best path) | 4.95 | 1,701 |
| the longest axis (best path) | 4.98 | 1,706 |
| the longest axis (best path) | 5.01 | 1,712 |
| the longest axis (best path) | 5.04 | 1,717 |
| the longest axis (best path) | 5.07 | 1,722 |
| the longest axis (best path) | 5.1 | 1,727 |
| the longest axis (best path) | 5.13 | 1,733 |
| the longest axis (best path) | 5.16 | 1,739 |
| the longest axis (best path) | 5.19 | 1,745 |
| the longest axis (best path) | 5.22 | 1,751 |
| the longest axis (best path) | 5.25 | 1,758 |
| the longest axis (best path) | 5.28 | 1,765 |
| the longest axis (best path) | 5.31 | 1,772 |
| the longest axis (best path) | 5.34 | 1,779 |
| the longest axis (best path) | 5.37 | 1,787 |
| the longest axis (best path) | 5.4 | 1,795 |
| the longest axis (best path) | 5.43 | 1,803 |
| the longest axis (best path) | 5.46 | 1,811 |
| the longest axis (best path) | 5.49 | 1,819 |
| the longest axis (best path) | 5.52 | 1,827 |
| the longest axis (best path) | 5.55 | 1,835 |
| the longest axis (best path) | 5.58 | 1,843 |
| the longest axis (best path) | 5.61 | 1,851 |
| the longest axis (best path) | 5.64 | 1,860 |
| the longest axis (best path) | 5.67 | 1,868 |
| the longest axis (best path) | 5.7 | 1,878 |
| the longest axis (best path) | 5.73 | 1,887 |
| the longest axis (best path) | 5.76 | 1,898 |
| the longest axis (best path) | 5.79 | 1,909 |
| the longest axis (best path) | 5.82 | 1,921 |
| the longest axis (best path) | 5.85 | 1,934 |
| the longest axis (best path) | 5.88 | 1,948 |
| the longest axis (best path) | 5.91 | 1,964 |
| the longest axis (best path) | 5.94 | 1,980 |
| the longest axis (best path) | 5.97 | 1,998 |
| the longest axis (best path) | 6 | 2,017 |
| the longest axis (best path) | 6.03 | 2,038 |
| the longest axis (best path) | 6.06 | 2,059 |
| the longest axis (best path) | 6.09 | 2,082 |
| the longest axis (best path) | 6.12 | 2,104 |
| the longest axis (best path) | 6.15 | 2,128 |
| the longest axis (best path) | 6.18 | 2,151 |
| the longest axis (best path) | 6.21 | 2,173 |
| the longest axis (best path) | 6.24 | 2,195 |
| the longest axis (best path) | 6.27 | 2,215 |
| the longest axis (best path) | 6.3 | 2,233 |
| the longest axis (best path) | 6.33 | 2,249 |
| the longest axis (best path) | 6.36 | 2,262 |
| the longest axis (best path) | 6.39 | 2,273 |
| the longest axis (best path) | 6.42 | 2,280 |
| the longest axis (best path) | 6.45 | 2,285 |
| the longest axis (best path) | 6.48 | 2,286 |
| the longest axis (best path) | 6.51 | 2,285 |
| the longest axis (best path) | 6.54 | 2,282 |
| the longest axis (best path) | 6.57 | 2,277 |
| the longest axis (best path) | 6.6 | 2,271 |
| the longest axis (best path) | 6.63 | 2,263 |
| the longest axis (best path) | 6.66 | 2,255 |
| the longest axis (best path) | 6.69 | 2,247 |
| the longest axis (best path) | 6.72 | 2,239 |
| the longest axis (best path) | 6.75 | 2,232 |
| the longest axis (best path) | 6.78 | 2,225 |
| the longest axis (best path) | 6.81 | 2,220 |
| the longest axis (best path) | 6.84 | 2,215 |
| the longest axis (best path) | 6.87 | 2,212 |
| the longest axis (best path) | 6.9 | 2,211 |
| the longest axis (best path) | 6.93 | 2,210 |
| the longest axis (best path) | 6.96 | 2,211 |
| the longest axis (best path) | 6.99 | 2,213 |
| the longest axis (best path) | 7.02 | 2,215 |
| the longest axis (best path) | 7.05 | 2,219 |
| the longest axis (best path) | 7.08 | 2,224 |
| the longest axis (best path) | 7.11 | 2,229 |
| the longest axis (best path) | 7.14 | 2,235 |
| the longest axis (best path) | 7.17 | 2,241 |
| the longest axis (best path) | 7.2 | 2,248 |
| the longest axis (best path) | 7.23 | 2,256 |
| the longest axis (best path) | 7.26 | 2,263 |
| the longest axis (best path) | 7.29 | 2,271 |
| the longest axis (best path) | 7.32 | 2,279 |
| the longest axis (best path) | 7.35 | 2,287 |
| the longest axis (best path) | 7.38 | 2,295 |
| the longest axis (best path) | 7.41 | 2,303 |
| the longest axis (best path) | 7.44 | 2,311 |
| the longest axis (best path) | 7.47 | 2,318 |
| the longest axis (best path) | 7.5 | 2,326 |
| the longest axis (best path) | 7.53 | 2,333 |
| the longest axis (best path) | 7.56 | 2,340 |
| the longest axis (best path) | 7.59 | 2,347 |
| the longest axis (best path) | 7.62 | 2,354 |
| the longest axis (best path) | 7.65 | 2,361 |
| the longest axis (best path) | 7.68 | 2,368 |
| the longest axis (best path) | 7.71 | 2,375 |
| the longest axis (best path) | 7.74 | 2,382 |
| the longest axis (best path) | 7.77 | 2,389 |
| the longest axis (best path) | 7.8 | 2,397 |
| the longest axis (best path) | 7.83 | 2,404 |
| the longest axis (best path) | 7.86 | 2,411 |
| the longest axis (best path) | 7.89 | 2,419 |
| the longest axis (best path) | 7.92 | 2,426 |
| the longest axis (best path) | 7.95 | 2,434 |
| the longest axis (best path) | 7.98 | 2,441 |
| the longest axis (best path) | 8.01 | 2,449 |
| the longest axis (best path) | 8.04 | 2,456 |
| the longest axis (best path) | 8.07 | 2,464 |
| the longest axis (best path) | 8.1 | 2,472 |
| the longest axis (best path) | 8.13 | 2,479 |
| the longest axis (best path) | 8.16 | 2,487 |
| the longest axis (best path) | 8.19 | 2,495 |
| the longest axis (best path) | 8.22 | 2,503 |
| the longest axis (best path) | 8.25 | 2,511 |
| the longest axis (best path) | 8.28 | 2,518 |
| the longest axis (best path) | 8.31 | 2,526 |
| the longest axis (best path) | 8.34 | 2,534 |
| the longest axis (best path) | 8.37 | 2,542 |
| the longest axis (best path) | 8.4 | 2,550 |
| the longest axis (best path) | 8.43 | 2,558 |
| the longest axis (best path) | 8.46 | 2,566 |
| the longest axis (best path) | 8.49 | 2,574 |
| the longest axis (best path) | 8.52 | 2,582 |
| the longest axis (best path) | 8.55 | 2,591 |
| the longest axis (best path) | 8.58 | 2,599 |
| the longest axis (best path) | 8.61 | 2,607 |
| the longest axis (best path) | 8.64 | 2,615 |
| the longest axis (best path) | 8.67 | 2,623 |
| the longest axis (best path) | 8.7 | 2,631 |
| the longest axis (best path) | 8.73 | 2,640 |
| the longest axis (best path) | 8.76 | 2,648 |
| the longest axis (best path) | 8.79 | 2,656 |
| the longest axis (best path) | 8.82 | 2,665 |
| the longest axis (best path) | 8.85 | 2,673 |
| the longest axis (best path) | 8.88 | 2,681 |
| the longest axis (best path) | 8.91 | 2,689 |
| the two highest summits (best path) | 0 | 2,759 |
| the two highest summits (best path) | 0.03 | 2,759 |
| the two highest summits (best path) | 0.06 | 2,759 |
| the two highest summits (best path) | 0.09 | 2,759 |
| the two highest summits (best path) | 0.12 | 2,759 |
| the two highest summits (best path) | 0.15 | 2,759 |
| the two highest summits (best path) | 0.18 | 2,759 |
| the two highest summits (best path) | 0.21 | 2,759 |
| the two highest summits (best path) | 0.24 | 2,759 |
| the two highest summits (best path) | 0.27 | 2,758 |
| the two highest summits (best path) | 0.3 | 2,758 |
| the two highest summits (best path) | 0.33 | 2,758 |
| the two highest summits (best path) | 0.36 | 2,757 |
| the two highest summits (best path) | 0.39 | 2,757 |
| the two highest summits (best path) | 0.42 | 2,756 |
| the two highest summits (best path) | 0.45 | 2,756 |
| the two highest summits (best path) | 0.48 | 2,756 |
| the two highest summits (best path) | 0.51 | 2,756 |
| the two highest summits (best path) | 0.54 | 2,756 |
| the two highest summits (best path) | 0.57 | 2,756 |
| the two highest summits (best path) | 0.6 | 2,756 |
| the two highest summits (best path) | 0.63 | 2,756 |
Figure 39. Terrain: Contours (100 m) 135
| bin_start | bin_end | count |
|---|---|---|
| 1,500 | 1,700 | 4 |
| 1,700 | 1,900 | 4 |
| 1,900 | 2,100 | 4 |
| 2,100 | 2,300 | 5 |
| 2,300 | 2,500 | 3 |
| 2,500 | 2,700 | 4 |
Figure 40. Terrain: Ravines 136
| bin_start | bin_end | count |
|---|---|---|
| 1 | 1.8 | 1 |
| 1.8 | 2.6 | 1 |
| 2.6 | 3.4 | 1 |
| 3.4 | 4.2 | 1 |
| 4.2 | 5 | 1 |
Figure 41. Terrain: Ridges 137
| bin_start | bin_end | count |
|---|---|---|
| 1 | 6 | 5 |
| 6 | 11 | 5 |
| 11 | 16 | 5 |
| 16 | 21 | 5 |
| 21 | 26 | 5 |
| 26 | 31 | 5 |
| 31 | 36 | 6 |
Figure 42. Terrain: Observation points 138
| bin_start | bin_end | count |
|---|---|---|
| 1 | 1.2 | 1 |
| 1.2 | 1.4 | 0 |
| 1.4 | 1.6 | 0 |
| 1.6 | 1.8 | 0 |
| 1.8 | 2 | 1 |
Figure 43. Terrain: Open flat ground 139
| bin_start | bin_end | count |
|---|---|---|
| 1.08e+04 | 2.988e+04 | 5 |
| 2.988e+04 | 4.896e+04 | 2 |
| 4.896e+04 | 6.804e+04 | 1 |
| 6.804e+04 | 8.712e+04 | 0 |
| 8.712e+04 | 1.062e+05 | 1 |
Figure 44. Terrain: Terrain masking (cover) 140
| bin_start | bin_end | count |
|---|---|---|
| 3.699e+05 | 5.621e+05 | 2 |
| 5.621e+05 | 7.544e+05 | 0 |
| 7.544e+05 | 9.466e+05 | 0 |
| 9.466e+05 | 1,138,860 | 0 |
| 1,138,860 | 1,331,100 | 3 |
Figure 45. Terrain: Streams (Strahler order) 141
| bin_start | bin_end | count |
|---|---|---|
| 1 | 2.6 | 2 |
| 2.6 | 4.2 | 2 |
| 4.2 | 5.8 | 1 |
| 5.8 | 7.4 | 2 |
| 7.4 | 9 | 2 |
Figure 46. Terrain: Pour points 142
| bin_start | bin_end | count |
|---|---|---|
| 1 | 1.4 | 1 |
| 1.4 | 1.8 | 0 |
| 1.8 | 2.2 | 1 |
| 2.2 | 2.6 | 0 |
| 2.6 | 3 | 1 |
Figure 47. Terrain: Watershed boundaries 143
| bin_start | bin_end | count |
|---|---|---|
| 1.004e+04 | 1.764e+04 | 1 |
| 1.764e+04 | 2.524e+04 | 1 |
| 2.524e+04 | 3.284e+04 | 0 |
| 3.284e+04 | 4.044e+04 | 0 |
| 4.044e+04 | 4.805e+04 | 1 |
Figure 48. Terrain: Pour points (snapped) 144
| bin_start | bin_end | count |
|---|---|---|
| 9,034,200 | 15,875,640 | 1 |
| 15,875,640 | 22,717,080 | 1 |
| 22,717,080 | 29,558,520 | 0 |
| 29,558,520 | 36,399,960 | 0 |
| 36,399,960 | 43,241,400 | 1 |
Figure 49. Terrain: Streams (Strahler order) 145
| bin_start | bin_end | count |
|---|---|---|
| 1 | 2.6 | 2 |
| 2.6 | 4.2 | 2 |
| 4.2 | 5.8 | 1 |
| 5.8 | 7.4 | 2 |
| 7.4 | 9 | 2 |
Figure 50. Terrain: Flood-prone areas 146
| bin_start | bin_end | count |
|---|---|---|
| 7.587e+05 | 7.974e+05 | 1 |
| 7.974e+05 | 8.361e+05 | 0 |
| 8.361e+05 | 8.748e+05 | 0 |
| 8.748e+05 | 9.135e+05 | 0 |
| 9.135e+05 | 9.522e+05 | 1 |
Figure 51. Terrain dismounted: Obstacles 147
| bin_start | bin_end | count |
|---|---|---|
| 2,498,400 | 2,498,400 | 1 |
Figure 52. Terrain wheeled: Obstacles 148
| bin_start | bin_end | count |
|---|---|---|
| 2.16e+04 | 1,103,580 | 9 |
| 1,103,580 | 2,185,560 | 0 |
| 2,185,560 | 3,267,540 | 0 |
| 3,267,540 | 4,349,520 | 0 |
| 4,349,520 | 5,431,500 | 1 |
Figure 53. Terrain tracked: Obstacles 149
| bin_start | bin_end | count |
|---|---|---|
| 2,498,400 | 2,498,400 | 1 |
Figure 54. Terrain: Obstacles 150
| bin_start | bin_end | count |
|---|---|---|
| 2,498,400 | 2,498,400 | 1 |
Figure 55. Terrain: Mobility corridors 151
| bin_start | bin_end | count |
|---|---|---|
| 20,304,900 | 25,091,100 | 1 |
| 25,091,100 | 29,877,300 | 0 |
| 29,877,300 | 34,663,500 | 0 |
| 34,663,500 | 39,449,700 | 0 |
| 39,449,700 | 44,235,900 | 1 |
Figure 56. Terrain: Key terrain candidates 152
| bin_start | bin_end | count |
|---|---|---|
| 1 | 1.2 | 1 |
| 1.2 | 1.4 | 0 |
| 1.4 | 1.6 | 0 |
| 1.6 | 1.8 | 0 |
| 1.8 | 2 | 1 |
Figure 57. Terrain: Corridor constrictions 153
| bin_start | bin_end | count |
|---|---|---|
| 180 | 246.5 | 1 |
| 246.5 | 313 | 1 |
| 313 | 379.6 | 0 |
| 379.6 | 446.1 | 0 |
| 446.1 | 512.6 | 1 |
Figure 58. Terrain: Avenues of approach 154
| bin_start | bin_end | count |
|---|---|---|
| 8,241 | 8,583 | 1 |
| 8,583 | 8,925 | 0 |
| 8,925 | 9,267 | 0 |
| 9,267 | 9,609 | 1 |
| 9,609 | 9,951 | 1 |
Figure 59. Terrain heights: Visible area 155
| bin_start | bin_end | count |
|---|---|---|
| 5.94e+04 | 4,117,320 | 4 |
| 4,117,320 | 8,175,240 | 0 |
| 8,175,240 | 12,233,160 | 0 |
| 12,233,160 | 16,291,080 | 0 |
| 16,291,080 | 20,349,000 | 1 |
Figure 60. Terrain heights: Observers 156
| bin_start | bin_end | count |
|---|---|---|
| 2,270 | 2,368 | 3 |
| 2,368 | 2,466 | 0 |
| 2,466 | 2,564 | 0 |
| 2,564 | 2,663 | 0 |
| 2,663 | 2,761 | 2 |
Figure 61. Terrain DH-1 DH-2: Sightline 157
| bin_start | bin_end | count |
|---|---|---|
| 3,840 | 3,840 | 1 |
Figure 62. Terrain DH-1 DH-3: Sightline 158
| bin_start | bin_end | count |
|---|---|---|
| 2,694 | 2,694 | 1 |
Figure 63. Terrain DH-1 DH-3: Ground visible from the observer 159
| bin_start | bin_end | count |
|---|---|---|
| 329.3 | 799.3 | 1 |
| 799.3 | 1,269 | 0 |
| 1,269 | 1,739 | 0 |
| 1,739 | 2,209 | 0 |
| 2,209 | 2,679 | 2 |
Figure 64. Terrain DH-2 DH-3: Sightline 160
| bin_start | bin_end | count |
|---|---|---|
| 3,915 | 3,915 | 1 |
Figure 65. Terrain axis: Least-cost routes 161
| bin_start | bin_end | count |
|---|---|---|
| 1 | 1 | 1 |
Figure 66. Terrain summits: Least-cost routes 162
| bin_start | bin_end | count |
|---|---|---|
| 1 | 1 | 1 |
Figure 67. Terrain axis: Profile line 163
| bin_start | bin_end | count |
|---|---|---|
| 2,689 | 2,689 | 1 |
Figure 68. Terrain summits: Profile line 164
| bin_start | bin_end | count |
|---|---|---|
| 2,759 | 2,759 | 1 |
Figure 69. Terrain: Best buildability areas 165
| bin_start | bin_end | count |
|---|---|---|
| 3,600 | 5.366e+04 | 76 |
| 5.366e+04 | 1.037e+05 | 6 |
| 1.037e+05 | 1.538e+05 | 1 |
| 1.538e+05 | 2.038e+05 | 1 |
| 2.038e+05 | 2.539e+05 | 0 |
| 2.539e+05 | 3.04e+05 | 0 |
| 3.04e+05 | 3.54e+05 | 3 |
| 3.54e+05 | 4.041e+05 | 1 |
Figure 70. Terrain: Best mineability areas 166
| bin_start | bin_end | count |
|---|---|---|
| 4,500 | 3.492e+05 | 11 |
| 3.492e+05 | 6.939e+05 | 0 |
| 6.939e+05 | 1,038,600 | 2 |
| 1,038,600 | 1,383,300 | 0 |
| 1,383,300 | 1,728,000 | 2 |
Figure 71. Terrain: Landing zone candidates 167
| bin_start | bin_end | count |
|---|---|---|
| 1 | 2 | 1 |
| 2 | 3 | 1 |
| 3 | 4 | 1 |
| 4 | 5 | 1 |
| 5 | 6 | 2 |
Figure 72. Terrain: Landing points 168
| bin_start | bin_end | count |
|---|---|---|
| 29.9 | 29.9 | 6 |
Figure 73. Terrain: Visible area 169
| bin_start | bin_end | count |
|---|---|---|
| 49,940,100 | 49,940,100 | 1 |
Figure 74. Terrain: Observers 170
| bin_start | bin_end | count |
|---|---|---|
| 1,496 | 1,648 | 6 |
| 1,648 | 1,800 | 3 |
| 1,800 | 1,952 | 2 |
| 1,952 | 2,103 | 1 |
| 2,103 | 2,255 | 2 |
Figure 75. Terrain: Dominant heights 171
| bin_start | bin_end | count |
|---|---|---|
| 1 | 1.8 | 1 |
| 1.8 | 2.6 | 1 |
| 2.6 | 3.4 | 1 |
| 3.4 | 4.2 | 1 |
| 4.2 | 5 | 1 |
Figure 76. Dropped calls: count per week 199
| period | value |
|---|---|
| 2026-08-03 | 239 |
| 2026-08-10 | 232 |
| 2026-08-17 | 218 |
| 2026-08-24 | 200 |
| 2026-08-31 | 242 |
| 2026-09-07 | 224 |
| 2026-09-14 | 218 |
| 2026-09-21 | 227 |
Figure 77. Dropped calls: week of 2026-08-24 to week of 2026-08-31 by place 200
| group | period | value |
|---|---|---|
| Los Olivos | week of 2026-08-24 | 28 |
| Los Olivos | week of 2026-08-31 | 41 |
| Los Pinos | week of 2026-08-24 | 3 |
| Los Pinos | week of 2026-08-31 | 11 |
| Barrio Norte | week of 2026-08-24 | 12 |
| Barrio Norte | week of 2026-08-31 | 5 |
| La Estacion | week of 2026-08-24 | 12 |
| La Estacion | week of 2026-08-31 | 19 |
| Los Arcos | week of 2026-08-24 | 20 |
| Los Arcos | week of 2026-08-31 | 27 |
| La Fuente | week of 2026-08-24 | 2 |
| La Fuente | week of 2026-08-31 | 7 |
| La Vega | week of 2026-08-24 | 1 |
| La Vega | week of 2026-08-31 | 6 |
| El Cerro | week of 2026-08-24 | 38 |
| El Cerro | week of 2026-08-31 | 34 |
| Las Flores | week of 2026-08-24 | 5 |
| Las Flores | week of 2026-08-31 | 8 |
| El Mercado | week of 2026-08-24 | 8 |
| El Mercado | week of 2026-08-31 | 6 |
| La Ribera | week of 2026-08-24 | 12 |
| La Ribera | week of 2026-08-31 | 14 |
| Las Acacias | week of 2026-08-24 | 26 |
| Las Acacias | week of 2026-08-31 | 28 |
| El Molino | week of 2026-08-24 | 7 |
| El Molino | week of 2026-08-31 | 8 |
| El Puerto Viejo | week of 2026-08-24 | 9 |
| El Puerto Viejo | week of 2026-08-31 | 10 |
| La Alameda | week of 2026-08-24 | 8 |
| La Alameda | week of 2026-08-31 | 9 |
Figure 78. Period change: Dropped calls (week of 2026-08-24 to week of 2026-08-31) 201
| bin_start | bin_end | count |
|---|---|---|
| -1.698 | -0.9305 | 1 |
| -0.9305 | -0.1634 | 2 |
| -0.1634 | 0.6038 | 6 |
| 0.6038 | 1.371 | 3 |
| 1.371 | 2.138 | 4 |
Figure 79. Coverage complaints: count per week 202
| period | value |
|---|---|
| 2026-02-23 | 4 |
| 2026-03-02 | 11 |
| 2026-03-09 | 14 |
| 2026-03-16 | 12 |
| 2026-03-23 | 14 |
| 2026-03-30 | 13 |
| 2026-04-06 | 16 |
| 2026-04-13 | 11 |
| 2026-04-20 | 15 |
| 2026-04-27 | 10 |
| 2026-05-04 | 11 |
| 2026-05-11 | 18 |
| 2026-05-18 | 17 |
| 2026-05-25 | 11 |
| 2026-06-01 | 8 |
| 2026-06-08 | 13 |
| 2026-06-15 | 16 |
| 2026-06-22 | 15 |
| 2026-06-29 | 11 |
| 2026-07-06 | 18 |
| 2026-07-13 | 13 |
| 2026-07-20 | 13 |
| 2026-07-27 | 16 |
| 2026-08-03 | 14 |
| 2026-08-10 | 9 |
| 2026-08-17 | 17 |
| 2026-08-24 | 19 |
| 2026-08-31 | 15 |
| 2026-09-07 | 10 |
| 2026-09-14 | 16 |
| 2026-09-21 | 13 |
| 2026-09-28 | 7 |
Figure 80. Coverage complaints: week of 2026-08-10 to week of 2026-08-17 by place 203
| group | period | value |
|---|---|---|
| El Puerto Viejo | week of 2026-08-10 | 0 |
| El Puerto Viejo | week of 2026-08-17 | 3 |
| Los Olivos | week of 2026-08-10 | 1 |
| Los Olivos | week of 2026-08-17 | 4 |
| El Cerro | week of 2026-08-10 | 2 |
| El Cerro | week of 2026-08-17 | 4 |
| La Fuente | week of 2026-08-10 | 0 |
| La Fuente | week of 2026-08-17 | 1 |
| La Ribera | week of 2026-08-10 | 2 |
| La Ribera | week of 2026-08-17 | 1 |
| Las Acacias | week of 2026-08-10 | 1 |
| Las Acacias | week of 2026-08-17 | 0 |
| Los Arcos | week of 2026-08-10 | 2 |
| Los Arcos | week of 2026-08-17 | 3 |
| Los Pinos | week of 2026-08-10 | 1 |
| Los Pinos | week of 2026-08-17 | 1 |
Figure 81. Period change: Coverage complaints (week of 2026-08-10 to week of 2026-08-17) 204
| bin_start | bin_end | count |
|---|---|---|
| -1 | -0.4536 | 2 |
| -0.4536 | 0.09284 | 1 |
| 0.09284 | 0.6393 | 1 |
| 0.6393 | 1.186 | 2 |
| 1.186 | 1.732 | 2 |
Figure 82. Dropped calls by hour of day 209
| label | count | share |
|---|---|---|
| 00:00 | 30 | 0.0167 |
| 01:00 | 15 | 0.0083 |
| 02:00 | 14 | 0.0078 |
| 03:00 | 6 | 0.0033 |
| 04:00 | 7 | 0.0039 |
| 05:00 | 18 | 0.01 |
| 06:00 | 48 | 0.0267 |
| 07:00 | 96 | 0.0533 |
| 08:00 | 113 | 0.0628 |
| 09:00 | 107 | 0.0594 |
| 10:00 | 100 | 0.0556 |
| 11:00 | 99 | 0.055 |
| 12:00 | 87 | 0.0483 |
| 13:00 | 91 | 0.0506 |
| 14:00 | 87 | 0.0483 |
| 15:00 | 90 | 0.05 |
| 16:00 | 121 | 0.0672 |
| 17:00 | 154 | 0.0856 |
| 18:00 | 138 | 0.0767 |
| 19:00 | 110 | 0.0611 |
| 20:00 | 101 | 0.0561 |
| 21:00 | 80 | 0.0444 |
| 22:00 | 53 | 0.0294 |
| 23:00 | 35 | 0.0194 |
Figure 83. Dropped calls by day of week 210
| label | count | share |
|---|---|---|
| Monday | 185 | 0.1028 |
| Tuesday | 195 | 0.1083 |
| Wednesday | 199 | 0.1106 |
| Thursday | 241 | 0.1339 |
| Friday | 292 | 0.1622 |
| Saturday | 330 | 0.1833 |
| Sunday | 358 | 0.1989 |
Figure 84. Seasonality of Dropped calls 211
| bin_start | bin_end | count |
|---|---|---|
| 31 | 90.2 | 9 |
| 90.2 | 149.4 | 3 |
| 149.4 | 208.6 | 1 |
| 208.6 | 267.8 | 2 |
| 267.8 | 327 | 1 |
Figure 85. Clusters of all inputs together: dropped calls and coverage complaints over time 259
| period | series | value |
|---|---|---|
| 2026-08-03 | coverage | 92 |
| 2026-08-03 | handover | 82 |
| 2026-08-03 | congestion | 39 |
| 2026-08-03 | interference | 26 |
| 2026-08-10 | coverage | 80 |
| 2026-08-10 | handover | 79 |
| 2026-08-10 | congestion | 48 |
| 2026-08-10 | interference | 25 |
| 2026-08-17 | coverage | 82 |
| 2026-08-17 | handover | 86 |
| 2026-08-17 | congestion | 35 |
| 2026-08-17 | interference | 15 |
| 2026-08-24 | coverage | 68 |
| 2026-08-24 | handover | 75 |
| 2026-08-24 | congestion | 37 |
| 2026-08-24 | interference | 20 |
| 2026-08-31 | coverage | 82 |
| 2026-08-31 | handover | 80 |
| 2026-08-31 | congestion | 51 |
| 2026-08-31 | interference | 29 |
| 2026-09-07 | coverage | 76 |
| 2026-09-07 | handover | 74 |
| 2026-09-07 | congestion | 51 |
| 2026-09-07 | interference | 23 |
| 2026-09-14 | coverage | 81 |
| 2026-09-14 | handover | 74 |
| 2026-09-14 | congestion | 34 |
| 2026-09-14 | interference | 29 |
| 2026-09-21 | coverage | 85 |
| 2026-09-21 | handover | 67 |
| 2026-09-21 | congestion | 46 |
| 2026-09-21 | interference | 29 |
Figure 86. Dropped calls over time (occurred_at) 262
| period | series | value |
|---|---|---|
| 2026-08-03 | coverage | 92 |
| 2026-08-03 | handover | 82 |
| 2026-08-03 | congestion | 39 |
| 2026-08-03 | interference | 26 |
| 2026-08-10 | coverage | 80 |
| 2026-08-10 | handover | 79 |
| 2026-08-10 | congestion | 48 |
| 2026-08-10 | interference | 25 |
| 2026-08-17 | coverage | 82 |
| 2026-08-17 | handover | 86 |
| 2026-08-17 | congestion | 35 |
| 2026-08-17 | interference | 15 |
| 2026-08-24 | coverage | 68 |
| 2026-08-24 | handover | 75 |
| 2026-08-24 | congestion | 37 |
| 2026-08-24 | interference | 20 |
| 2026-08-31 | coverage | 82 |
| 2026-08-31 | handover | 80 |
| 2026-08-31 | congestion | 51 |
| 2026-08-31 | interference | 29 |
| 2026-09-07 | coverage | 76 |
| 2026-09-07 | handover | 74 |
| 2026-09-07 | congestion | 51 |
| 2026-09-07 | interference | 23 |
| 2026-09-14 | coverage | 81 |
| 2026-09-14 | handover | 74 |
| 2026-09-14 | congestion | 34 |
| 2026-09-14 | interference | 29 |
| 2026-09-21 | coverage | 85 |
| 2026-09-21 | handover | 67 |
| 2026-09-21 | congestion | 46 |
| 2026-09-21 | interference | 29 |
Figure 87. Coverage complaints over time (date) 263
| period | series | value |
|---|---|---|
| 2026-02-23 | slow data | 2 |
| 2026-02-23 | calls drop | 2 |
| 2026-02-23 | no signal indoors | 0 |
| 2026-03-02 | slow data | 4 |
| 2026-03-02 | calls drop | 6 |
| 2026-03-02 | no signal indoors | 1 |
| 2026-03-09 | slow data | 6 |
| 2026-03-09 | calls drop | 4 |
| 2026-03-09 | no signal indoors | 4 |
| 2026-03-16 | slow data | 3 |
| 2026-03-16 | calls drop | 6 |
| 2026-03-16 | no signal indoors | 3 |
| 2026-03-23 | slow data | 6 |
| 2026-03-23 | calls drop | 5 |
| 2026-03-23 | no signal indoors | 3 |
| 2026-03-30 | slow data | 6 |
| 2026-03-30 | calls drop | 4 |
| 2026-03-30 | no signal indoors | 3 |
| 2026-04-06 | slow data | 3 |
| 2026-04-06 | calls drop | 5 |
| 2026-04-06 | no signal indoors | 8 |
| 2026-04-13 | slow data | 4 |
| 2026-04-13 | calls drop | 5 |
| 2026-04-13 | no signal indoors | 2 |
| 2026-04-20 | slow data | 6 |
| 2026-04-20 | calls drop | 3 |
| 2026-04-20 | no signal indoors | 6 |
| 2026-04-27 | slow data | 5 |
| 2026-04-27 | calls drop | 2 |
| 2026-04-27 | no signal indoors | 3 |
| 2026-05-04 | slow data | 5 |
| 2026-05-04 | calls drop | 4 |
| 2026-05-04 | no signal indoors | 2 |
| 2026-05-11 | slow data | 9 |
| 2026-05-11 | calls drop | 5 |
| 2026-05-11 | no signal indoors | 4 |
| 2026-05-18 | slow data | 7 |
| 2026-05-18 | calls drop | 7 |
| 2026-05-18 | no signal indoors | 3 |
| 2026-05-25 | slow data | 6 |
| 2026-05-25 | calls drop | 2 |
| 2026-05-25 | no signal indoors | 3 |
| 2026-06-01 | slow data | 3 |
| 2026-06-01 | calls drop | 2 |
| 2026-06-01 | no signal indoors | 3 |
| 2026-06-08 | slow data | 3 |
| 2026-06-08 | calls drop | 6 |
| 2026-06-08 | no signal indoors | 4 |
| 2026-06-15 | slow data | 5 |
| 2026-06-15 | calls drop | 3 |
| 2026-06-15 | no signal indoors | 8 |
| 2026-06-22 | slow data | 3 |
| 2026-06-22 | calls drop | 6 |
| 2026-06-22 | no signal indoors | 6 |
| 2026-06-29 | slow data | 4 |
| 2026-06-29 | calls drop | 5 |
| 2026-06-29 | no signal indoors | 2 |
| 2026-07-06 | slow data | 8 |
| 2026-07-06 | calls drop | 4 |
| 2026-07-06 | no signal indoors | 6 |
| 2026-07-13 | slow data | 5 |
| 2026-07-13 | calls drop | 6 |
| 2026-07-13 | no signal indoors | 2 |
| 2026-07-20 | slow data | 5 |
| 2026-07-20 | calls drop | 5 |
| 2026-07-20 | no signal indoors | 3 |
| 2026-07-27 | slow data | 8 |
| 2026-07-27 | calls drop | 3 |
| 2026-07-27 | no signal indoors | 5 |
| 2026-08-03 | slow data | 4 |
| 2026-08-03 | calls drop | 5 |
| 2026-08-03 | no signal indoors | 5 |
| 2026-08-10 | slow data | 4 |
| 2026-08-10 | calls drop | 3 |
| 2026-08-10 | no signal indoors | 2 |
| 2026-08-17 | slow data | 6 |
| 2026-08-17 | calls drop | 6 |
| 2026-08-17 | no signal indoors | 5 |
| 2026-08-24 | slow data | 5 |
| 2026-08-24 | calls drop | 6 |
| 2026-08-24 | no signal indoors | 8 |
| 2026-08-31 | slow data | 5 |
| 2026-08-31 | calls drop | 4 |
| 2026-08-31 | no signal indoors | 6 |
| 2026-09-07 | slow data | 5 |
| 2026-09-07 | calls drop | 2 |
| 2026-09-07 | no signal indoors | 3 |
| 2026-09-14 | slow data | 2 |
| 2026-09-14 | calls drop | 7 |
| 2026-09-14 | no signal indoors | 7 |
| 2026-09-21 | slow data | 6 |
| 2026-09-21 | calls drop | 3 |
| 2026-09-21 | no signal indoors | 4 |
| 2026-09-28 | slow data | 1 |
| 2026-09-28 | calls drop | 4 |
| 2026-09-28 | no signal indoors | 2 |
Figure 88. Cell KPIs by day over time (date) 264
| period | value |
|---|---|
| 2026-08-03 | 98 |
| 2026-08-10 | 98 |
| 2026-08-17 | 98 |
| 2026-08-24 | 98 |
| 2026-08-31 | 98 |
| 2026-09-07 | 98 |
| 2026-09-14 | 98 |
| 2026-09-21 | 98 |
Figure 89. Site leases over time (lease_end_year) 265
| bin_start | bin_end | count |
|---|---|---|
| 2,027 | 2,028 | 5 |
| 2,028 | 2,029 | 1 |
| 2,029 | 2,031 | 0 |
| 2,031 | 2,032 | 1 |
| 2,032 | 2,033 | 7 |
Figure 90. Hot spot analysis: Dropped calls 266
| bin_start | bin_end | band | band_label | count |
|---|---|---|---|---|
| -2 | -1.5 | cold_90 | Cold spot, 90% confidence | 15 |
| -2 | -1.5 | not_significant | Not significant | 32 |
| -1.5 | -1 | not_significant | Not significant | 451 |
| -1 | -0.5 | not_significant | Not significant | 622 |
| -0.5 | 0 | not_significant | Not significant | 414 |
| 0 | 0.5 | not_significant | Not significant | 88 |
| 0.5 | 1 | not_significant | Not significant | 19 |
| 1 | 1.5 | not_significant | Not significant | 13 |
| 1.5 | 2 | hot_90 | Hot spot, 90% confidence | 7 |
| 1.5 | 2 | not_significant | Not significant | 2 |
| 2 | 2.5 | hot_95 | Hot spot, 95% confidence | 15 |
| 2.5 | 3 | hot_99 | Hot spot, 99% confidence | 5 |
| 3 | 3.5 | hot_99 | Hot spot, 99% confidence | 9 |
| 3.5 | 4 | hot_99 | Hot spot, 99% confidence | 13 |
| 4 | 4.5 | hot_99 | Hot spot, 99% confidence | 3 |
| 4.5 | 5 | hot_99 | Hot spot, 99% confidence | 2 |
| 5 | 5.5 | hot_99 | Hot spot, 99% confidence | 9 |
| 5.5 | 6 | hot_99 | Hot spot, 99% confidence | 5 |
| 6 | 6.5 | hot_99 | Hot spot, 99% confidence | 3 |
| 6.5 | 7 | hot_99 | Hot spot, 99% confidence | 5 |
| 7 | 7.5 | hot_99 | Hot spot, 99% confidence | 4 |
| 7.5 | 8 | hot_99 | Hot spot, 99% confidence | 7 |
| 8 | 8.5 | hot_99 | Hot spot, 99% confidence | 5 |
| 8.5 | 9 | hot_99 | Hot spot, 99% confidence | 2 |
| 9 | 9.5 | hot_99 | Hot spot, 99% confidence | 1 |
| 10 | 10.5 | hot_99 | Hot spot, 99% confidence | 2 |
| 10.5 | 11 | hot_99 | Hot spot, 99% confidence | 3 |
| 11 | 11.5 | hot_99 | Hot spot, 99% confidence | 2 |
| 11.5 | 12 | hot_99 | Hot spot, 99% confidence | 2 |
| 12 | 12.5 | hot_99 | Hot spot, 99% confidence | 3 |
| 12.5 | 13 | hot_99 | Hot spot, 99% confidence | 1 |
| 13 | 13.5 | hot_99 | Hot spot, 99% confidence | 2 |
| 13.5 | 14 | hot_99 | Hot spot, 99% confidence | 1 |
| 14 | 14.5 | hot_99 | Hot spot, 99% confidence | 2 |
| 14.5 | 15 | hot_99 | Hot spot, 99% confidence | 3 |
| 15.5 | 16 | hot_99 | Hot spot, 99% confidence | 1 |
| 16 | 16.5 | hot_99 | Hot spot, 99% confidence | 1 |
| 17 | 17.5 | hot_99 | Hot spot, 99% confidence | 2 |
| 18 | 18.5 | hot_99 | Hot spot, 99% confidence | 2 |
| 18.5 | 19 | hot_99 | Hot spot, 99% confidence | 2 |
| 19 | 19.5 | hot_99 | Hot spot, 99% confidence | 3 |
| 19.5 | 20 | hot_99 | Hot spot, 99% confidence | 1 |
| 21 | 21.5 | hot_99 | Hot spot, 99% confidence | 1 |
| 21.5 | 22 | hot_99 | Hot spot, 99% confidence | 1 |
| 22 | 22.5 | hot_99 | Hot spot, 99% confidence | 1 |
| 22.5 | 23 | hot_99 | Hot spot, 99% confidence | 2 |
| 23 | 23.5 | hot_99 | Hot spot, 99% confidence | 2 |
| 24 | 24.5 | hot_99 | Hot spot, 99% confidence | 2 |
| 25.5 | 26 | hot_99 | Hot spot, 99% confidence | 2 |
| 26.5 | 27 | hot_99 | Hot spot, 99% confidence | 1 |
| 27 | 27.5 | hot_99 | Hot spot, 99% confidence | 1 |
| 27.5 | 28 | hot_99 | Hot spot, 99% confidence | 1 |
Figure 91. Hot spot analysis: Coverage complaints 267
| bin_start | bin_end | band | band_label | count |
|---|---|---|---|---|
| -1.5 | -1 | not_significant | Not significant | 47 |
| -1 | -0.5 | not_significant | Not significant | 127 |
| -0.5 | 0 | not_significant | Not significant | 71 |
| 0 | 0.5 | not_significant | Not significant | 21 |
| 0.5 | 1 | not_significant | Not significant | 5 |
| 1 | 1.5 | not_significant | Not significant | 3 |
| 1.5 | 2 | hot_90 | Hot spot, 90% confidence | 2 |
| 1.5 | 2 | hot_95 | Hot spot, 95% confidence | 1 |
| 1.5 | 2 | not_significant | Not significant | 1 |
| 2.5 | 3 | hot_95 | Hot spot, 95% confidence | 2 |
| 2.5 | 3 | hot_99 | Hot spot, 99% confidence | 3 |
| 3 | 3.5 | hot_99 | Hot spot, 99% confidence | 1 |
| 3.5 | 4 | hot_99 | Hot spot, 99% confidence | 1 |
| 4 | 4.5 | hot_99 | Hot spot, 99% confidence | 2 |
| 4.5 | 5 | hot_99 | Hot spot, 99% confidence | 1 |
| 5 | 5.5 | hot_99 | Hot spot, 99% confidence | 3 |
| 5.5 | 6 | hot_99 | Hot spot, 99% confidence | 2 |
| 8 | 8.5 | hot_99 | Hot spot, 99% confidence | 2 |
| 8.5 | 9 | hot_99 | Hot spot, 99% confidence | 3 |
| 9 | 9.5 | hot_99 | Hot spot, 99% confidence | 1 |
| 10.5 | 11 | hot_99 | Hot spot, 99% confidence | 3 |
| 12.5 | 13 | hot_99 | Hot spot, 99% confidence | 1 |
| 13 | 13.5 | hot_99 | Hot spot, 99% confidence | 1 |
| 13.5 | 14 | hot_99 | Hot spot, 99% confidence | 1 |
Figure 92. Hot spot analysis: Small cells 268
| bin_start | bin_end | band | band_label | count |
|---|---|---|---|---|
| -1 | -0.5 | not_significant | Not significant | 5 |
| -0.5 | 0 | not_significant | Not significant | 8 |
| 0 | 0.5 | not_significant | Not significant | 3 |
| 0.5 | 1 | not_significant | Not significant | 2 |
| 1 | 1.5 | not_significant | Not significant | 2 |
| 3 | 3.5 | hot_99 | Hot spot, 99% confidence | 1 |
Figure 93. Emerging hot spots: Coverage complaints 269
| bin_start | bin_end | count |
|---|---|---|
| -0.685 | -0.4285 | 42 |
| -0.4285 | -0.172 | 0 |
| -0.172 | 0.0845 | 0 |
| 0.0845 | 0.341 | 0 |
| 0.341 | 0.5975 | 38 |
| 0.5975 | 0.854 | 0 |
| 0.854 | 1.111 | 0 |
| 1.111 | 1.367 | 14 |
Figure 94. Emerging hot spots: Dropped calls 270
| bin_start | bin_end | count |
|---|---|---|
| -1.205 | -0.9106 | 66 |
| -0.9106 | -0.6162 | 23 |
| -0.6162 | -0.3219 | 8 |
| -0.3219 | -0.0275 | 6 |
| -0.0275 | 0.2669 | 2 |
| 0.2669 | 0.5613 | 0 |
| 0.5613 | 0.8556 | 1 |
| 0.8556 | 1.15 | 3 |
Figure 95. Summarize within: Neighborhoods 271
| bin_start | bin_end | count |
|---|---|---|
| 0 | 0.6 | 7 |
| 0.6 | 1.2 | 5 |
| 1.2 | 1.8 | 0 |
| 1.8 | 2.4 | 3 |
| 2.4 | 3 | 1 |
Figure 96. Summarize within: Neighborhoods 272
| bin_start | bin_end | count |
|---|---|---|
| 0 | 1.8 | 8 |
| 1.8 | 3.6 | 5 |
| 3.6 | 5.4 | 1 |
| 5.4 | 7.2 | 0 |
| 7.2 | 9 | 2 |
Figure 97. Summarize within: Neighborhoods 273
| bin_start | bin_end | count |
|---|---|---|
| 31 | 90.2 | 9 |
| 90.2 | 149.4 | 3 |
| 149.4 | 208.6 | 1 |
| 208.6 | 267.8 | 2 |
| 267.8 | 327 | 1 |
Figure 98. Calculate density: Dropped calls 274
| bin_start | bin_end | count |
|---|---|---|
| 0 | 4 | 136 |
| 4 | 8 | 175 |
| 8 | 12 | 171 |
| 12 | 16 | 170 |
| 16 | 20 | 170 |
| 20 | 24 | 172 |
| 24 | 28 | 171 |
| 28 | 32 | 169 |
| 32 | 36 | 172 |
| 36 | 40 | 173 |
| 40 | 44 | 169 |
| 44 | 48 | 186 |
Figure 99. Calculate density: Coverage complaints 275
| bin_start | bin_end | count |
|---|---|---|
| 0 | 2.1 | 47 |
| 2.1 | 4.2 | 37 |
| 4.2 | 6.3 | 39 |
| 6.3 | 8.4 | 36 |
| 8.4 | 10.5 | 37 |
| 10.5 | 12.6 | 39 |
| 12.6 | 14.7 | 39 |
| 14.7 | 16.8 | 39 |
| 16.8 | 18.9 | 37 |
| 18.9 | 21 | 33 |
Figure 100. Calculate density: Small cells 276
| bin_start | bin_end | count |
|---|---|---|
| 0 | 1.5 | 10 |
| 1.5 | 3 | 8 |
| 3 | 4.5 | 19 |
| 4.5 | 6 | 11 |
| 6 | 7.5 | 24 |
| 7.5 | 9 | 10 |
| 9 | 10.5 | 22 |
| 10.5 | 12 | 13 |
Figure 101. Find point clusters: Dropped calls 277
| cluster | features | fraction | share |
|---|---|---|---|
| Noise | 1,744 | 0.9689 | 96.9% |
| 1 | 32 | 0.01778 | 1.8% |
| 0 | 24 | 0.01333 | 1.3% |
Figure 102. Find point clusters: cluster hulls 278
| cluster | features | fraction | share |
|---|---|---|---|
| 0 | 1 | 0.5 | 50.0% |
| 1 | 1 | 0.5 | 50.0% |
Figure 103. Find point clusters: Coverage complaints 279
| cluster | features | fraction | share |
|---|---|---|---|
| Noise | 320 | 0.7619 | 76.2% |
| 0 | 100 | 0.2381 | 23.8% |
Figure 104. Find point clusters: cluster hulls 280
| cluster | features | fraction | share |
|---|---|---|---|
| 0 | 1 | 1 | 100.0% |
Figure 105. Find outliers: Neighborhoods 281
| value | lag | type |
|---|---|---|
| 1.492 | 0.8836 | NS |
| -1.146 | 0.4296 | NS |
| -0.1431 | -0.1232 | NS |
| 1.74 | -0.319 | NS |
| -0.9566 | 0.0861 | NS |
| 0.3185 | 0.7984 | NS |
| 1.337 | 1.492 | NS |
| -0.6946 | 1.072 | NS |
| 1.072 | -0.6946 | NS |
| -1.568 | -0.5375 | NS |
| 0.4296 | 0.1732 | NS |
| 0.5457 | -0.1431 | NS |
| -0.5388 | -1.568 | NS |
| -0.3985 | -1.568 | NS |
| -1.234 | -0.1431 | NS |
| -0.2563 | -1.568 | NS |
Figure 106. Find point clusters: Coverage complaints over time 282
| period | series | value |
|---|---|---|
| 2026-02-23 | prepaid | 0 |
| 2026-02-23 | postpaid | 3 |
| 2026-02-23 | business | 1 |
| 2026-03-02 | prepaid | 2 |
| 2026-03-02 | postpaid | 3 |
| 2026-03-02 | business | 6 |
| 2026-03-09 | prepaid | 6 |
| 2026-03-09 | postpaid | 6 |
| 2026-03-09 | business | 2 |
| 2026-03-16 | prepaid | 5 |
| 2026-03-16 | postpaid | 4 |
| 2026-03-16 | business | 3 |
| 2026-03-23 | prepaid | 6 |
| 2026-03-23 | postpaid | 4 |
| 2026-03-23 | business | 4 |
| 2026-03-30 | prepaid | 4 |
| 2026-03-30 | postpaid | 3 |
| 2026-03-30 | business | 6 |
| 2026-04-06 | prepaid | 6 |
| 2026-04-06 | postpaid | 4 |
| 2026-04-06 | business | 6 |
| 2026-04-13 | prepaid | 7 |
| 2026-04-13 | postpaid | 3 |
| 2026-04-13 | business | 1 |
| 2026-04-20 | prepaid | 3 |
| 2026-04-20 | postpaid | 5 |
| 2026-04-20 | business | 7 |
| 2026-04-27 | prepaid | 4 |
| 2026-04-27 | postpaid | 4 |
| 2026-04-27 | business | 2 |
| 2026-05-04 | prepaid | 3 |
| 2026-05-04 | postpaid | 4 |
| 2026-05-04 | business | 4 |
| 2026-05-11 | prepaid | 5 |
| 2026-05-11 | postpaid | 8 |
| 2026-05-11 | business | 5 |
| 2026-05-18 | prepaid | 6 |
| 2026-05-18 | postpaid | 4 |
| 2026-05-18 | business | 7 |
| 2026-05-25 | prepaid | 4 |
| 2026-05-25 | postpaid | 2 |
| 2026-05-25 | business | 5 |
| 2026-06-01 | prepaid | 3 |
| 2026-06-01 | postpaid | 3 |
| 2026-06-01 | business | 2 |
| 2026-06-08 | prepaid | 4 |
| 2026-06-08 | postpaid | 4 |
| 2026-06-08 | business | 5 |
| 2026-06-15 | prepaid | 9 |
| 2026-06-15 | postpaid | 4 |
| 2026-06-15 | business | 3 |
| 2026-06-22 | prepaid | 5 |
| 2026-06-22 | postpaid | 6 |
| 2026-06-22 | business | 4 |
| 2026-06-29 | prepaid | 4 |
| 2026-06-29 | postpaid | 2 |
| 2026-06-29 | business | 5 |
| 2026-07-06 | prepaid | 7 |
| 2026-07-06 | postpaid | 3 |
| 2026-07-06 | business | 8 |
| 2026-07-13 | prepaid | 5 |
| 2026-07-13 | postpaid | 3 |
| 2026-07-13 | business | 5 |
| 2026-07-20 | prepaid | 4 |
| 2026-07-20 | postpaid | 5 |
| 2026-07-20 | business | 4 |
| 2026-07-27 | prepaid | 6 |
| 2026-07-27 | postpaid | 7 |
| 2026-07-27 | business | 3 |
| 2026-08-03 | prepaid | 5 |
| 2026-08-03 | postpaid | 4 |
| 2026-08-03 | business | 5 |
| 2026-08-10 | prepaid | 4 |
| 2026-08-10 | postpaid | 4 |
| 2026-08-10 | business | 1 |
| 2026-08-17 | prepaid | 7 |
| 2026-08-17 | postpaid | 3 |
| 2026-08-17 | business | 7 |
| 2026-08-24 | prepaid | 3 |
| 2026-08-24 | postpaid | 8 |
| 2026-08-24 | business | 8 |
| 2026-08-31 | prepaid | 5 |
| 2026-08-31 | postpaid | 8 |
| 2026-08-31 | business | 2 |
| 2026-09-07 | prepaid | 5 |
| 2026-09-07 | postpaid | 2 |
| 2026-09-07 | business | 3 |
| 2026-09-14 | prepaid | 4 |
| 2026-09-14 | postpaid | 9 |
| 2026-09-14 | business | 3 |
| 2026-09-21 | prepaid | 5 |
| 2026-09-21 | postpaid | 2 |
| 2026-09-21 | business | 6 |
| 2026-09-28 | prepaid | 1 |
| 2026-09-28 | postpaid | 3 |
| 2026-09-28 | business | 3 |
Figure 107. Find point clusters: Dropped calls over time 283
| period | series | value |
|---|---|---|
| 2026-08-03 | coverage | 92 |
| 2026-08-03 | handover | 82 |
| 2026-08-03 | congestion | 39 |
| 2026-08-03 | interference | 26 |
| 2026-08-10 | coverage | 80 |
| 2026-08-10 | handover | 79 |
| 2026-08-10 | congestion | 48 |
| 2026-08-10 | interference | 25 |
| 2026-08-17 | coverage | 82 |
| 2026-08-17 | handover | 86 |
| 2026-08-17 | congestion | 35 |
| 2026-08-17 | interference | 15 |
| 2026-08-24 | coverage | 68 |
| 2026-08-24 | handover | 75 |
| 2026-08-24 | congestion | 37 |
| 2026-08-24 | interference | 20 |
| 2026-08-31 | coverage | 82 |
| 2026-08-31 | handover | 80 |
| 2026-08-31 | congestion | 51 |
| 2026-08-31 | interference | 29 |
| 2026-09-07 | coverage | 76 |
| 2026-09-07 | handover | 74 |
| 2026-09-07 | congestion | 51 |
| 2026-09-07 | interference | 23 |
| 2026-09-14 | coverage | 81 |
| 2026-09-14 | handover | 74 |
| 2026-09-14 | congestion | 34 |
| 2026-09-14 | interference | 29 |
| 2026-09-21 | coverage | 85 |
| 2026-09-21 | handover | 67 |
| 2026-09-21 | congestion | 46 |
| 2026-09-21 | interference | 29 |
GeoBit Large Spatial Model. Findings are labeled Evidenced (computed by a tool), Inferred (a reading or reasoning) or Unverified (no evidence yet).