Sample: Real estate and urban planning, Lisbon: report
Project: Sample: Real estate and urban planning, Lisbon
Goal: Describe the project Sample: Real estate and urban planning, Lisbon: run the analyses that tell the most about its data, draw every result, and write a cited report.
Run: 76926ded-9cc8-4578-9472-14b00b3eb370 (running, 11 agent run(s))
Generated: 2026-10-18T06:25:20Z, version 1
Model cost: USD 0.0000 over 0 model call(s)
Data used
| Data | Kind | Rows | Time span | Summary | Source |
|---|---|---|---|---|---|
| Zoning districts | vector, Polygon | 10 | 10 polygon (area) features; 'use' has 4 values (top: residential 5, mixed use 3, commercial 1); 'max_far' 1.2 to 4 (mean 2.32); 'max_height_m' 15 to 40 (mean 23.5); named by 'name' (e.g. Vila Norte, Jardim Primavera, Alto do Moinho); total area 20.02 km2; extent -9.1715,38.7188 to -9.1139,38.7550. Areas (Zoning districts) with max_far to compare and map. | 101 | |
| Parcels | vector, Polygon | 1,100 | 1,100 polygon (area) features; 'zone_code' has 6 values (top: I07 282, R09 189, R04 188); 'vacant' has 2 values (top: False 1051, True 49); 'built_far' 0 to 3.87 (mean 1.459); 'area_m2' 752 to 13,841 (mean 4667); 'slope_deg' 0 to 6.8 (mean 2.608); total area 5.138 km2; extent -9.1709,38.7193 to -9.1450,38.7544. Areas (Parcels) with built_far to compare and map. | 102 | |
| Property sales | vector, Point | 950 | 2022-01-01 to 2026-09-30 | 950 point features; dated by 'date' from 2022-01-01 to 2026-09-30; 'type' has 3 values (top: apartment 431, office 268, house 251); 'price_eur_m2' 2,476 to 8,706 (mean 4799); 'price_eur' 78,920 to 1,343,084 (mean 4.309e+05); 'area_m2' 24 to 242 (mean 89.94); extent -9.1704,38.7199 to -9.1457,38.7539. Dated point events by type: where and when Property sales happen. | 2 |
| Building permits | vector, Point | 380 | 2023-01-01 to 2026-09-01 | 380 point features; dated by 'decision_month' from 2023-01-01 to 2026-09-01; 'type' has 4 values (top: extension 130, new build 127, change of use 88); 'units' 0 to 40 (mean 20.4); extent -9.1702,38.7204 to -9.1457,38.7539. Dated point events by type: where and when Building permits happen. | 3 |
| Transit stations | vector, Point | 12 | 12 point features; 'lines' 1 to 2 (mean 1.333); 'daily_entries' 4,708 to 38,148 (mean 1.733e+04); named by 'name' (e.g. Metro station Jardim Primavera, Metro station Alto do Moinho, Metro station Bairro da Estacao); extent -9.1699,38.7198 to -9.1176,38.7485. Point locations of Transit stations. | 103 | |
| Green spaces | vector, Polygon | 10 | 10 polygon (area) features; 'type' has 3 values (top: garden 7, square 2, park 1); 'area_ha' 1.04 to 1.4 (mean 1.219); named by 'name' (e.g. Jardim Jardim Primavera, Jardim Alto do Moinho, Jardim Bairro da Estacao); total area 0.122 km2; extent -9.1688,38.7218 to -9.1188,38.7511. Areas (Green spaces) with area_ha to compare and map. | 104 | |
| Streets | vector, LineString | 151 | 151 line features; 'class' has 2 values (top: street 132, avenue 19); 'one_way' has 2 values (top: False 94, True 57); named by 'name' (e.g. Avenida Central, Avenida da Liberdade, Avenida do Mar); total length 272.2 km; extent -9.1710,38.7192 to -9.1145,38.7546. Lines (Streets) such as routes or networks. | 105 | |
| City terrain model (DEM) | raster | 1-band float32 raster (dem), 333 x 267 cells; resolution 15; band 1 12.08 to 130.7; extent -9.1715,38.7188 to -9.1140,38.7550. An elevation surface for terrain analysis. | 106 | ||
| Land values by zone and year | table | 90 | 2018-01-01 to 2026-01-01 | Table of 90 rows and 3 columns without geometry; dated by 'year' from 2018-01-01 to 2026-01-01; 'zone_code' has 10 values (top: R01 9, R02 9, R03 9); 'value_eur_m2' 1,319 to 4,341 (mean 1891). A table of Land values by zone and year without locations. | 4 |
| Planning applications | table | 160 | 2025-01-01 to 2025-12-28 | Table of 160 rows and 6 columns without geometry; dated by 'submitted' from 2025-01-01 to 2025-12-28; 'use' has 4 values (top: residential 47, mixed 41, hotel 37); 'status' has 3 values (top: approved 84, pending 61, refused 15); 'units' 1 to 120 (mean 55.81). A table of Planning applications without locations. | 5 |
| Planning committee brief | document | 1-page md document 'Planning committee brief: riverside regeneration'; language en; mentions 4 place(s): Jardim dos Pinheiros (1), Jardim (1), Ribeira Sul (1), Fonte Nova (1). A document about Jardim dos Pinheiros, Jardim, Ribeira Sul. | 107 | ||
| Sample: Real estate and urban planning, Lisbon | record | 108 | |||
| Emerging hot spots: Property sales | layer, Polygon | 81 | 109 | ||
| Emerging hot spots: Building permits | layer, Polygon | 90 | 110 | ||
| Repeat and near repeat classification: Property sales | layer, Point | 950 | 111 | ||
| Summarize within: Parcels | layer, Polygon | 1,100 | 112 | ||
| Summarize within: Parcels | layer, Polygon | 1,100 | 113 | ||
| Summarize within: Parcels | layer, Polygon | 1,100 | 114 | ||
| Hot spot analysis: Property sales | layer, Polygon | 213 | 115 | ||
| Hot spot analysis: Building permits | layer, Point | 380 | 116 | ||
| Calculate density: Property sales | layer, Polygon | 867 | 117 | ||
| Calculate density: Building permits | layer, Polygon | 1,211 | 118 | ||
| Find point clusters: Transit stations | layer, Point | 12 | 119 | ||
| Find point clusters: cluster hulls | layer, Polygon | 1 | 120 | ||
| Find point clusters: Property sales | layer, Point | 950 | 121 | ||
| Find point clusters: Building permits | layer, Point | 380 | 122 | ||
| Find point clusters: cluster hulls | layer, Polygon | 14 | 123 | ||
| Find outliers: Parcels | layer, Polygon | 1,100 | 124 | ||
| Find outliers: Green spaces | layer, Polygon | 10 | 125 | ||
| Find outliers: Zoning districts | layer, Polygon | 10 | 126 |
Timeline
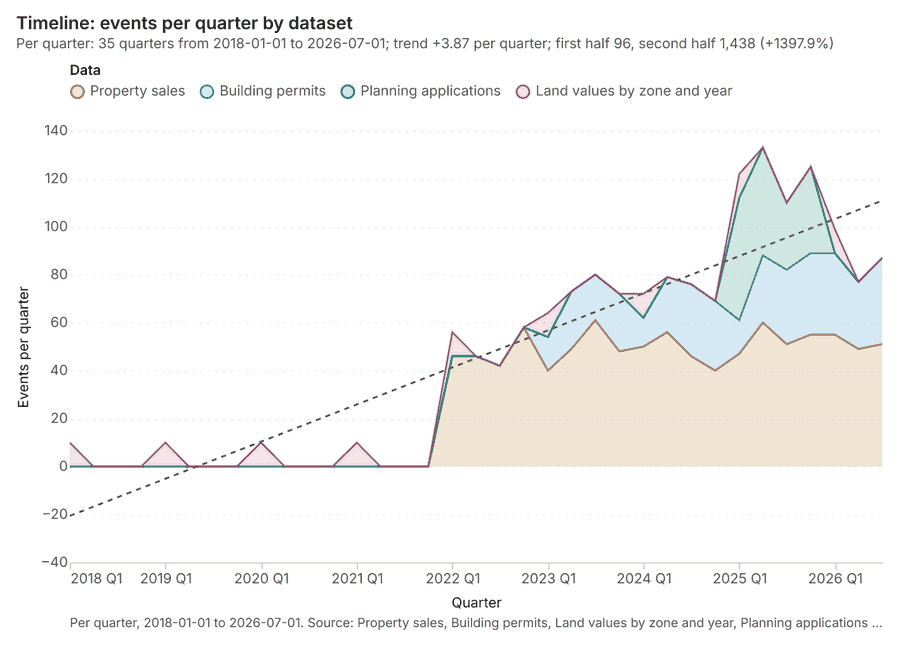
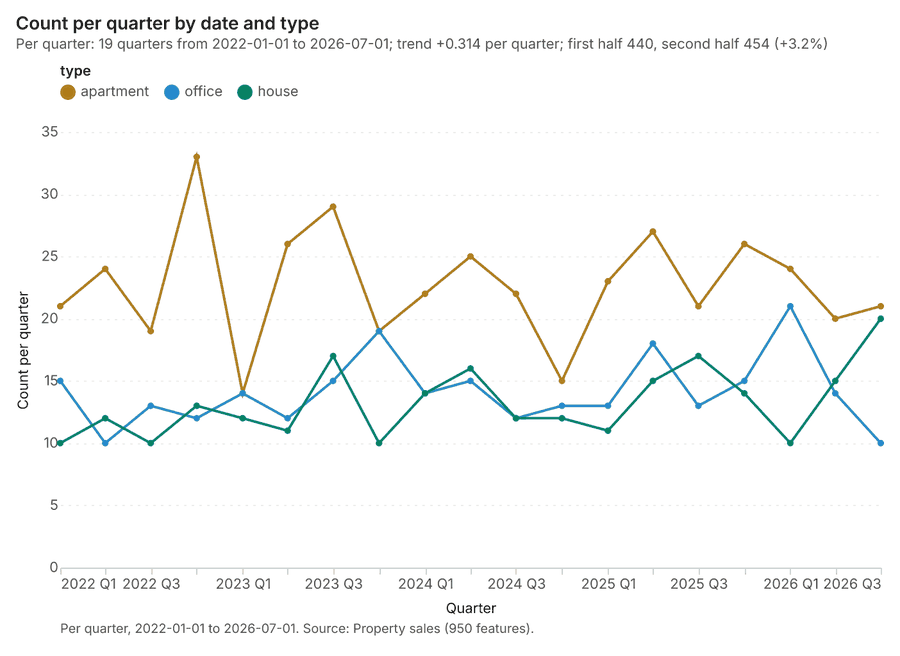
The timeline counts 1,580 dated events in Property sales, Building permits, Land values by zone and year and 1 more per quarter, from Q1 2018 to Q3 2026 12345. By dataset: Property sales 950; Building permits 380; Planning applications 160; Land values by zone and year 90 1. The trend is +3.87 events per quarter; the second half of the quarters has 1,438 against 96 in the first (+1397.9%) 1. 12 of the 35 quarters had no events 1.
Busiest quarters
Quietest quarters with events
Space time hot spots
What this analysis is. Emerging hot spots: Where hot spots are new, consecutive, intensifying, persistent, diminishing, sporadic, oscillating or historical over time 6. In ArcGIS it is Emerging Hot Spot Analysis or Create Space Time Cube 6.
Why it was run on this data. Property sales carry dates in 'date': emerging hot spot analysis finds new, intensifying and fading hot spots per month 7.
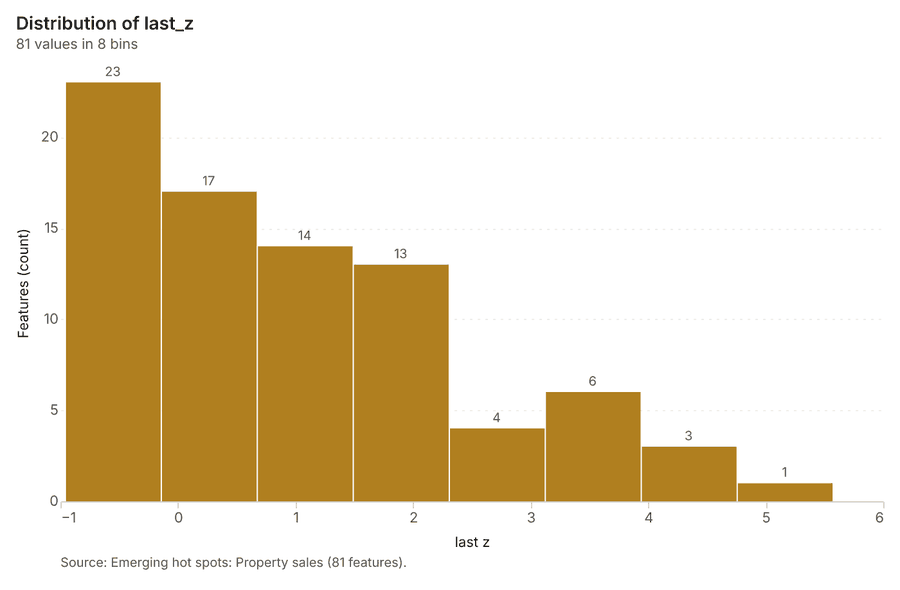
What it found. The emerging hot spots layer, titled "Emerging hot spots: Property sales," was generated with 9 properties per resolution and involved 950 features 8. This analysis resulted in 81 features 8. The process took 21 elapsed milliseconds 8, and the total cost incurred was 0.1475 8.
| Result | Value |
|---|---|
| result, count | 81 |
| result, elapsed ms | 21 |
| result, resolution | 9 |
| result, features used | 950 |
| result, time neighbors | 0 |
| billing, cost | 0.1475 |
| billing, list price | 0.1475 |
| billing, upstream cost | 0 |
Findings
- Evidenced: Space time hot spots on Property sales: Emerging hot spots: 1 layer saved: Emerging hot spots: Property sales (81 features) 89.
- Evidenced: It reported result, count 81; result, elapsed ms 21; result, resolution 9; result, features used 950; result, time neighbors 0; billing, cost 0.1475 8.
Tool gp_space_time_hot_spots; parameters {"project": "acfed0f6-9df9-4775-9325-30c0bbed70e9", "features": {"layer": "Property sales (a421b4df)"}, "interval": "month", "bin_shape": "h3", "resolution": 9, "time_field": "date"}
Space time hot spots
What this analysis is. Emerging hot spots: Where hot spots are new, consecutive, intensifying, persistent, diminishing, sporadic, oscillating or historical over time 6. In ArcGIS it is Emerging Hot Spot Analysis or Create Space Time Cube 6.
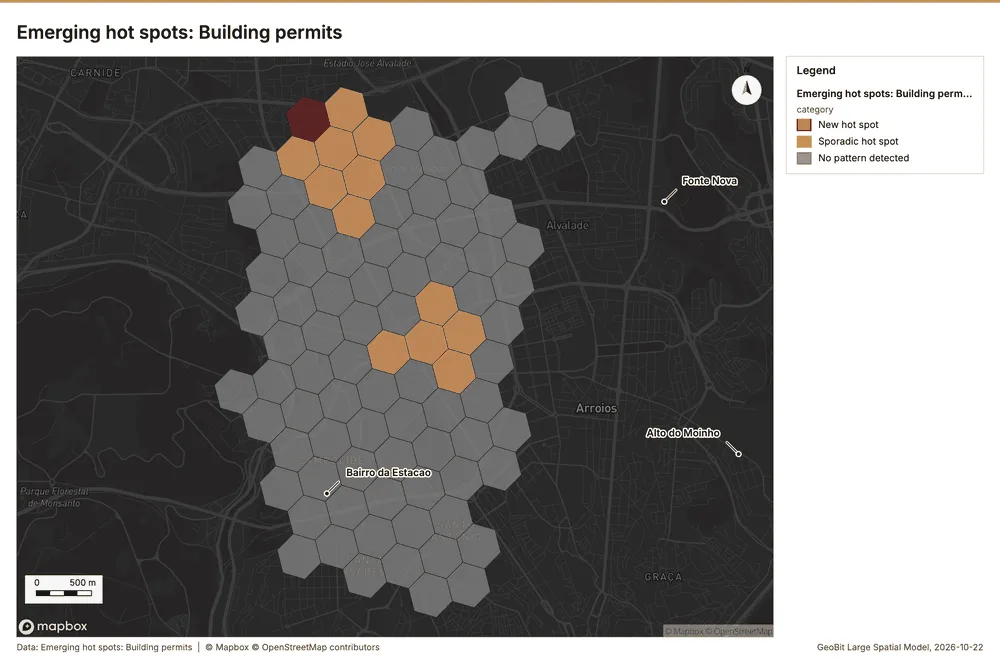
Why it was run on this data. Building permits carry dates in 'decision_month': emerging hot spot analysis finds new, intensifying and fading hot spots per month 10.
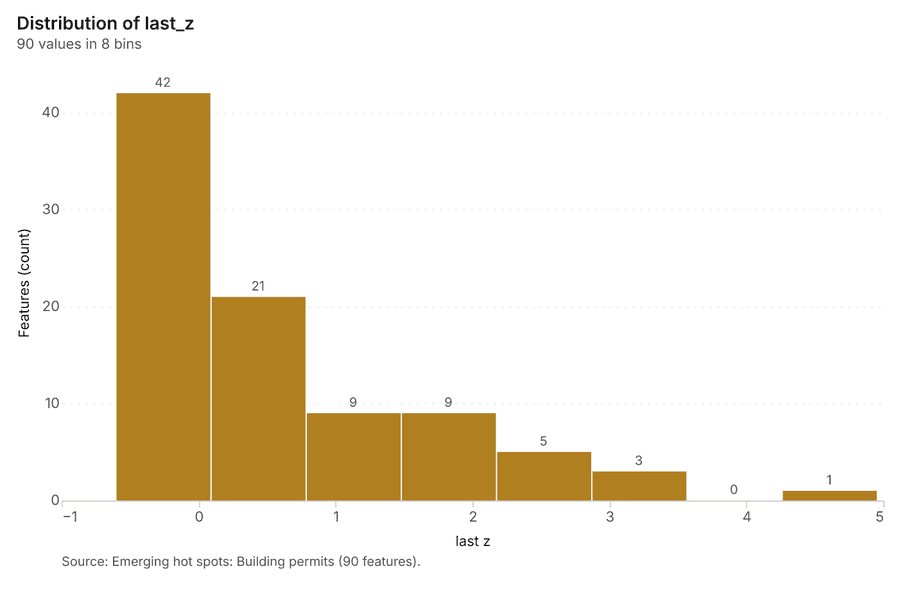
What it found. The gp_space_time_hot_spots tool was run using Building permits data 12, resulting in the saving of emerging hot spots containing 90 features 11.
| Result | Value |
|---|---|
| result, count | 90 |
| result, elapsed ms | 19 |
| result, resolution | 9 |
| result, features used | 380 |
| result, time neighbors | 0 |
| billing, cost | 0.119 |
| billing, list price | 0.119 |
| billing, upstream cost | 0 |
Findings
- Evidenced: Space time hot spots on Building permits: Emerging hot spots: 1 layer saved: Emerging hot spots: Building permits (90 features) 1112.
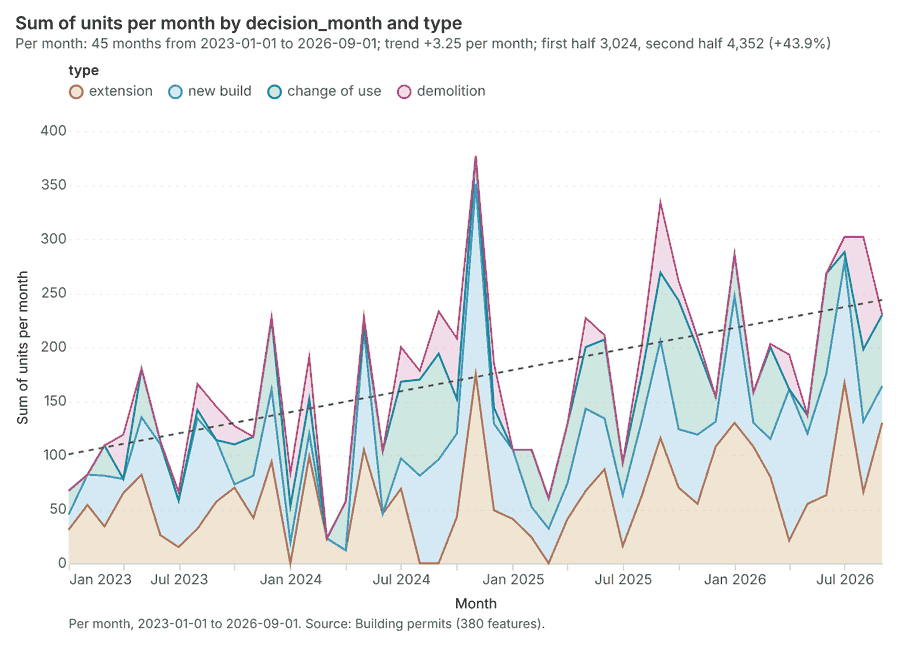
- Evidenced: It reported result, count 90; result, elapsed ms 19; result, resolution 9; result, features used 380; result, time neighbors 0; billing, cost 0.119 11.
Tool gp_space_time_hot_spots; parameters {"agg": "sum", "project": "acfed0f6-9df9-4775-9325-30c0bbed70e9", "features": {"layer": "Building permits (c9732c3b)"}, "interval": "month", "bin_shape": "h3", "resolution": 9, "time_field": "decision_month", "value_field": "units"}
Near repeat
What this analysis is. Repeat and near repeat classification: Classify incidents as originators, repeats (same place) or near repeats within a distance and time window, with a Knox test table 13. In ArcGIS it is Repeat and Near Repeat Classification or Near Repeat Calculator 13.
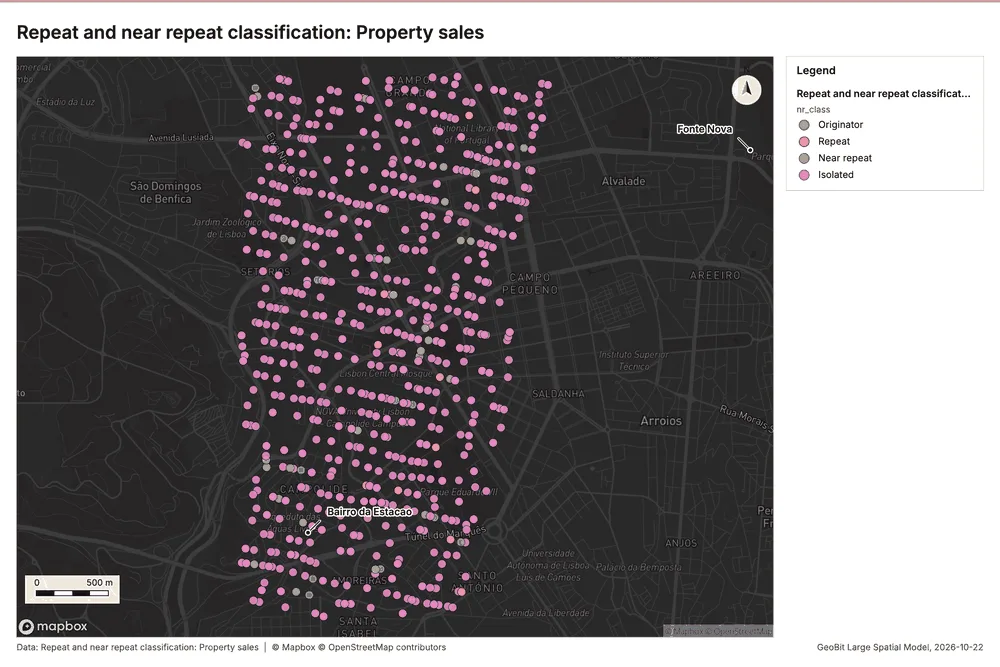
Why it was run on this data. Near repeat analysis tests whether Property sales close in space also follow each other within 30 days 14.
What it found. Near repeat on Property sales: Repeat and near repeat classification: 1 layer saved: Repeat and near repeat classification: Property sales (950 features) 915. It reported result, days 30; result, count 950; result, chains 43; result, distance m 100; result, elapsed ms 23; result, pairs linked 51 15.
| Result | Value |
|---|---|
| result, days | 30 |
| result, count | 950 |
| result, chains | 43 |
| result, distance m | 100 |
| result, elapsed ms | 23 |
| result, pairs linked | 51 |
| billing, cost | 0.0785 |
| billing, list price | 0.0785 |
| billing, upstream cost | 0 |
Findings
- Evidenced: Near repeat on Property sales: Repeat and near repeat classification: 1 layer saved: Repeat and near repeat classification: Property sales (950 features) 915.
- Evidenced: It reported result, days 30; result, count 950; result, chains 43; result, distance m 100; result, elapsed ms 23; result, pairs linked 51 15.
Tool gp_near_repeat; parameters {"days": 30, "project": "acfed0f6-9df9-4775-9325-30c0bbed70e9", "features": {"layer": "Property sales (a421b4df)"}, "distance_m": 100.0, "time_field": "date"}
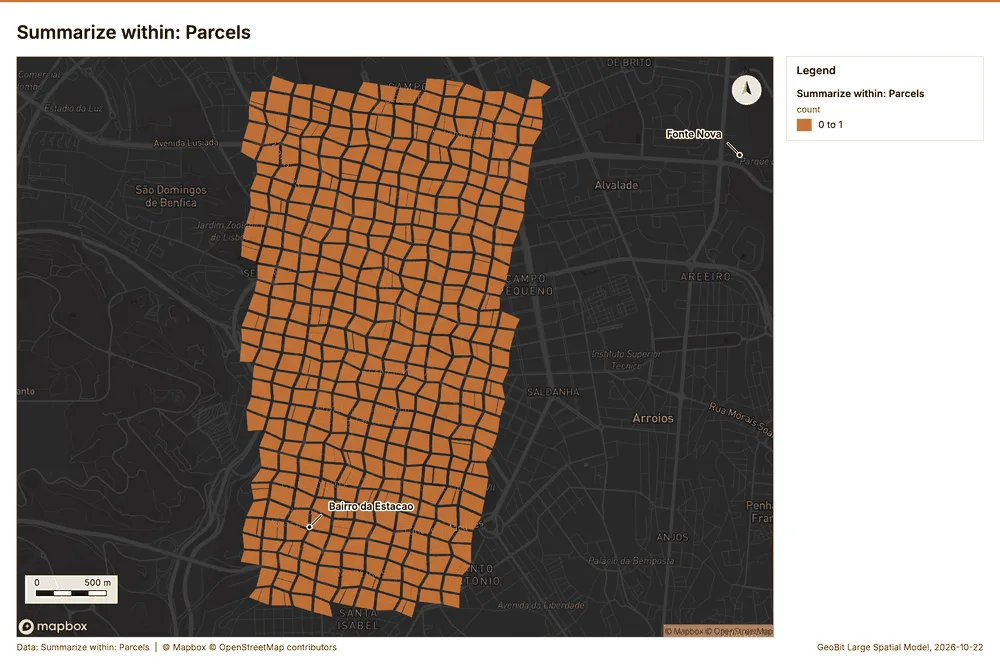
Summarize within
What this analysis is. Summarize within: Count and aggregate the features inside each polygon (or bin), proportionally for lines and polygons 16. In ArcGIS it is Summarize Within or Aggregate Points; in QGIS, native:countpointsinpolygon or native:sumlinelengths 16.
Why it was run on this data. Count Transit stations inside each feature of Parcels; the counts map as a choropleth (natural breaks, sequential colors) 17.
What it found. Summarize within on Transit stations, Parcels: Summarize within: 1 layer saved: Summarize within: Parcels (1100 features) 181920. It reported result, count 1,100; result, elapsed ms 43; billing, cost 0.03226; billing, list price 0.03226; billing, upstream cost 0 18.
| Result | Value |
|---|---|
| result, count | 1,100 |
| result, elapsed ms | 43 |
| billing, cost | 0.03226 |
| billing, list price | 0.03226 |
| billing, upstream cost | 0 |
Findings
- Evidenced: Summarize within on Transit stations, Parcels: Summarize within: 1 layer saved: Summarize within: Parcels (1100 features) 181920.
- Evidenced: It reported result, count 1,100; result, elapsed ms 43; billing, cost 0.03226; billing, list price 0.03226; billing, upstream cost 0 18.
Tool gp_summarize_within; parameters {"stats": [{"stat": "sum", "field": "lines"}], "project": "acfed0f6-9df9-4775-9325-30c0bbed70e9", "features": {"layer": "Transit stations (400e1561)"}, "polygons": {"layer": "Parcels (ccc22cc1)"}}
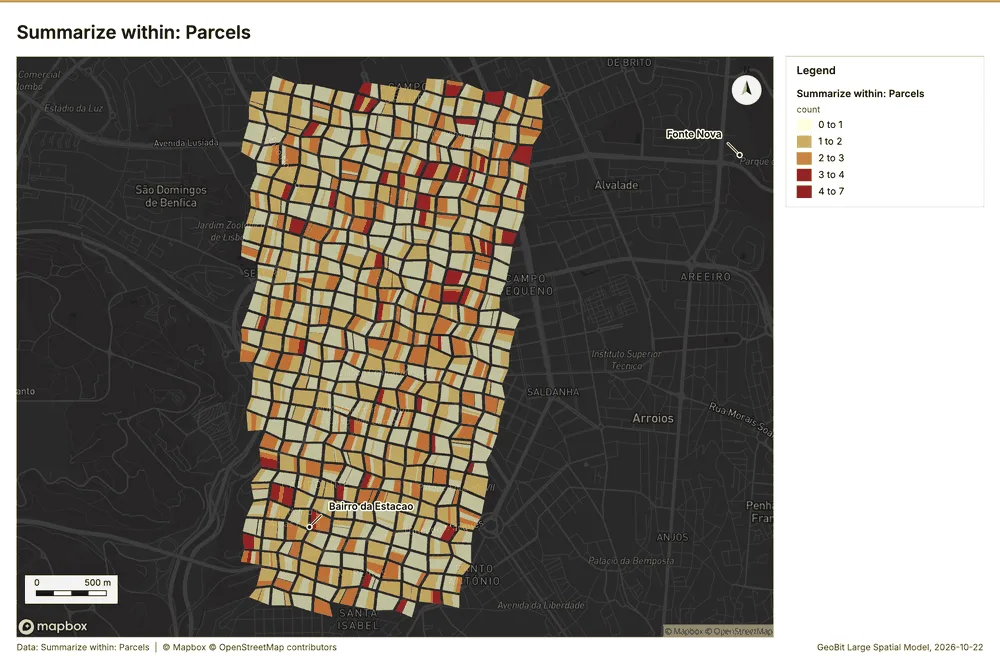
Summarize within
What this analysis is. Summarize within: Count and aggregate the features inside each polygon (or bin), proportionally for lines and polygons 16. In ArcGIS it is Summarize Within or Aggregate Points; in QGIS, native:countpointsinpolygon or native:sumlinelengths 16.
Why it was run on this data. Count Transit stations inside each feature of Parcels; the counts map as a choropleth (natural breaks, sequential colors) 17.
What it found. Summarize within on Property sales, Parcels: Summarize within: 1 layer saved: Summarize within: Parcels (1100 features) 92021. It reported result, count 1,100; result, elapsed ms 471; billing, cost 0.05102; billing, list price 0.05102; billing, upstream cost 0 21.
| Result | Value |
|---|---|
| result, count | 1,100 |
| result, elapsed ms | 471 |
| billing, cost | 0.05102 |
| billing, list price | 0.05102 |
| billing, upstream cost | 0 |
Findings
- Evidenced: Summarize within on Property sales, Parcels: Summarize within: 1 layer saved: Summarize within: Parcels (1100 features) 92021.
- Evidenced: It reported result, count 1,100; result, elapsed ms 471; billing, cost 0.05102; billing, list price 0.05102; billing, upstream cost 0 21.
Tool gp_summarize_within; parameters {"stats": [{"stat": "sum", "field": "price_eur_m2"}], "project": "acfed0f6-9df9-4775-9325-30c0bbed70e9", "features": {"layer": "Property sales (a421b4df)"}, "group_by": "type", "polygons": {"layer": "Parcels (ccc22cc1)"}}
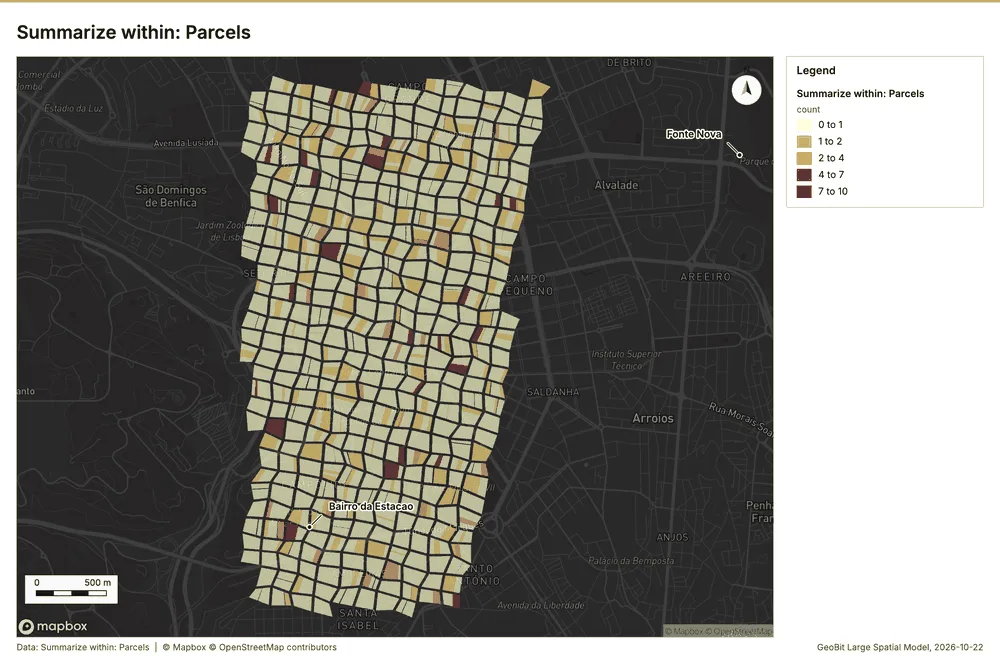
Summarize within
What this analysis is. Summarize within: Count and aggregate the features inside each polygon (or bin), proportionally for lines and polygons 16. In ArcGIS it is Summarize Within or Aggregate Points; in QGIS, native:countpointsinpolygon or native:sumlinelengths 16.
Why it was run on this data. Count Transit stations inside each feature of Parcels; the counts map as a choropleth (natural breaks, sequential colors) 17.
What it found. Summarize within on Building permits, Parcels: Summarize within: 1 layer saved: Summarize within: Parcels (1100 features) 122022. It reported result, count 1,100; result, elapsed ms 49; billing, cost 0.03962; billing, list price 0.03962; billing, upstream cost 0 22.
| Result | Value |
|---|---|
| result, count | 1,100 |
| result, elapsed ms | 49 |
| billing, cost | 0.03962 |
| billing, list price | 0.03962 |
| billing, upstream cost | 0 |
Findings
- Evidenced: Summarize within on Building permits, Parcels: Summarize within: 1 layer saved: Summarize within: Parcels (1100 features) 122022.
- Evidenced: It reported result, count 1,100; result, elapsed ms 49; billing, cost 0.03962; billing, list price 0.03962; billing, upstream cost 0 22.
Tool gp_summarize_within; parameters {"stats": [{"stat": "sum", "field": "units"}], "project": "acfed0f6-9df9-4775-9325-30c0bbed70e9", "features": {"layer": "Building permits (c9732c3b)"}, "group_by": "type", "polygons": {"layer": "Parcels (ccc22cc1)"}}
Zonal statistics
What this analysis is. Zonal statistics: count/min/max/mean/std/sum/median/majority per polygon as a table and as GeoJSON 23. In ArcGIS it is Zonal Statistics as Table (polygons) 23.
Why it was run on this data. Statistics of City terrain model (DEM) inside each feature of Parcels 24.
What it found. The Zonal statistics tool (rs_zonal_statistics) was used for the analysis 25.
Findings
Tool rs_zonal_statistics; parameters {"stats": ["mean", "min", "max", "std"], "zones": "Parcels (ccc22cc1)", "raster_id": "City terrain model (DEM) (45e73a8a)"}
Zonal statistics
What this analysis is. Zonal statistics: count/min/max/mean/std/sum/median/majority per polygon as a table and as GeoJSON 23. In ArcGIS it is Zonal Statistics as Table (polygons) 23.
Why it was run on this data. Statistics of City terrain model (DEM) inside each feature of Parcels 24.
What it found. The zonal statistics tool was utilized for this analysis 26. A total of 10 row(s) were generated for 10 zones 26. This calculation was performed as part of the rs_zonal_statistics process during step 1 26.
Findings
Tool rs_zonal_statistics; parameters {"stats": ["mean", "min", "max", "std"], "zones": "Green spaces (448e3c1b)", "raster_id": "City terrain model (DEM) (45e73a8a)"}
Zonal statistics
What this analysis is. Zonal statistics: count/min/max/mean/std/sum/median/majority per polygon as a table and as GeoJSON 23. In ArcGIS it is Zonal Statistics as Table (polygons) 23.
Why it was run on this data. Statistics of City terrain model (DEM) inside each feature of Parcels 24.
What it found. The rs_zonal_statistics tool produced results for 10 rows and 10 zones 27. This indicator provides zonal statistics for the given dataset 27.
Findings
Tool rs_zonal_statistics; parameters {"stats": ["mean", "min", "max", "std"], "zones": "Zoning districts (f84e0e45)", "raster_id": "City terrain model (DEM) (45e73a8a)"}
Hot spots
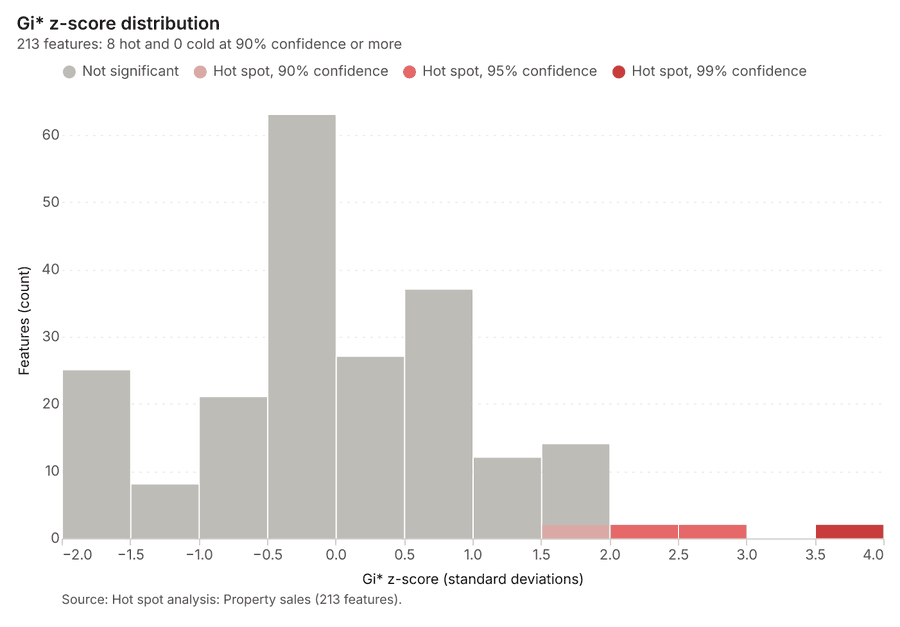
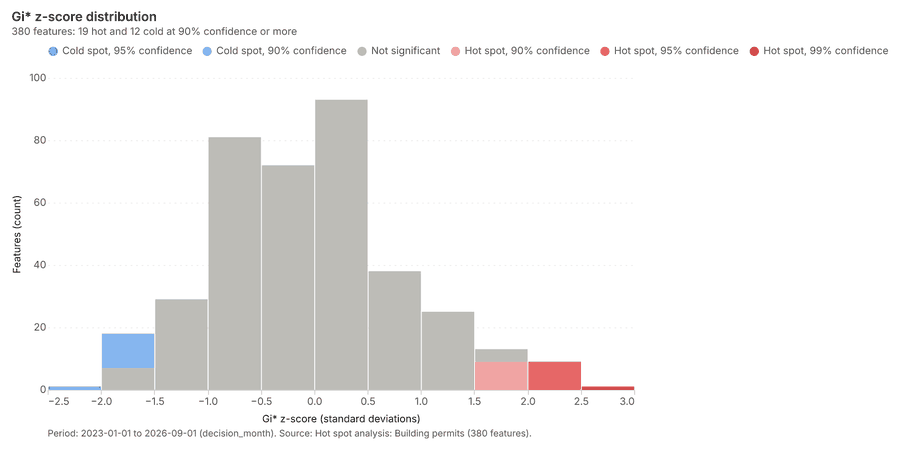
What this analysis is. Hot spot analysis: Getis-Ord Gi* hot and cold spots with z-scores, p-values and confidence bins 28. In ArcGIS it is Find Hot Spots or Hot Spot Analysis (Getis-Ord Gi*); in QGIS, qgis:hotspot (plugin) 28.
Why it was run on this data. 950 points: Getis-Ord Gi* tests whether the concentrations in Property sales are statistically significant 29.
What it found. Hot spots on Property sales: Hot spot analysis: 1 layer saved: Hot spot analysis: Property sales (213 features) 930. It reported result, bins 213; result, count 213; result, elapsed ms 37; result, cell size m 200; result, incidents used 950; result, distance band m 200 30.
| Result | Value |
|---|---|
| result, bins | 213 |
| result, count | 213 |
| result, elapsed ms | 37 |
| result, cell size m | 200 |
| result, incidents used | 950 |
| result, distance band m | 200 |
| billing, cost | 0.069 |
| billing, list price | 0.069 |
| billing, upstream cost | 0 |
Findings
- Evidenced: Hot spots on Property sales: Hot spot analysis: 1 layer saved: Hot spot analysis: Property sales (213 features) 930.
- Evidenced: It reported result, bins 213; result, count 213; result, elapsed ms 37; result, cell size m 200; result, incidents used 950; result, distance band m 200 30.
Tool gp_hot_spots; parameters {"project": "acfed0f6-9df9-4775-9325-30c0bbed70e9", "features": {"layer": "Property sales (a421b4df)"}, "aggregation": "hexagon", "cell_size_m": 200.0, "distance_band_m": 200.0}
Hot spots
What this analysis is. Hot spot analysis: Getis-Ord Gi* hot and cold spots with z-scores, p-values and confidence bins 28. In ArcGIS it is Find Hot Spots or Hot Spot Analysis (Getis-Ord Gi*); in QGIS, qgis:hotspot (plugin) 28.
Why it was run on this data. 380 points: Getis-Ord Gi* tests whether the concentrations in Building permits are statistically significant 31.
What it found. Hot spots on Building permits: Hot spot analysis: 1 layer saved: Hot spot analysis: Building permits (380 features) 1232. It reported result, count 380; result, elapsed ms 10; result, excluded null 0; result, distance band m 500; billing, cost 0.0576; billing, list price 0.0576 32.
| Result | Value |
|---|---|
| result, count | 380 |
| result, elapsed ms | 10 |
| result, excluded null | 0 |
| result, distance band m | 500 |
| billing, cost | 0.0576 |
| billing, list price | 0.0576 |
| billing, upstream cost | 0 |
Findings
- Evidenced: Hot spots on Building permits: Hot spot analysis: 1 layer saved: Hot spot analysis: Building permits (380 features) 1232.
- Evidenced: It reported result, count 380; result, elapsed ms 10; result, excluded null 0; result, distance band m 500; billing, cost 0.0576; billing, list price 0.0576 32.
Tool gp_hot_spots; parameters {"field": "units", "project": "acfed0f6-9df9-4775-9325-30c0bbed70e9", "features": {"layer": "Building permits (c9732c3b)"}, "aggregation": "hexagon", "cell_size_m": 200.0, "distance_band_m": 500.0}
Calculate density
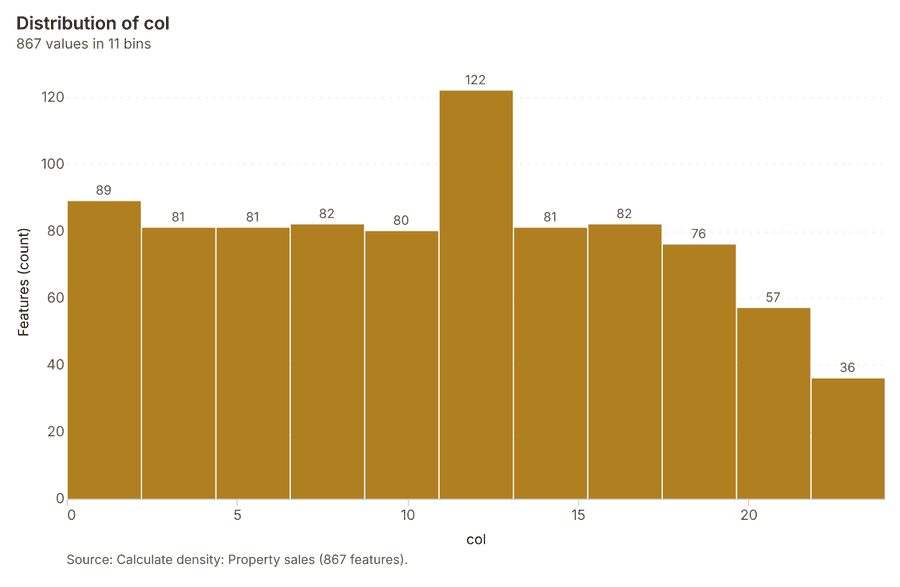
What this analysis is. Calculate density: Kernel density per square kilometer on a grid 33. In ArcGIS it is Calculate Density or Kernel Density; in QGIS, native:heatmapkerneldensityestimation 33.
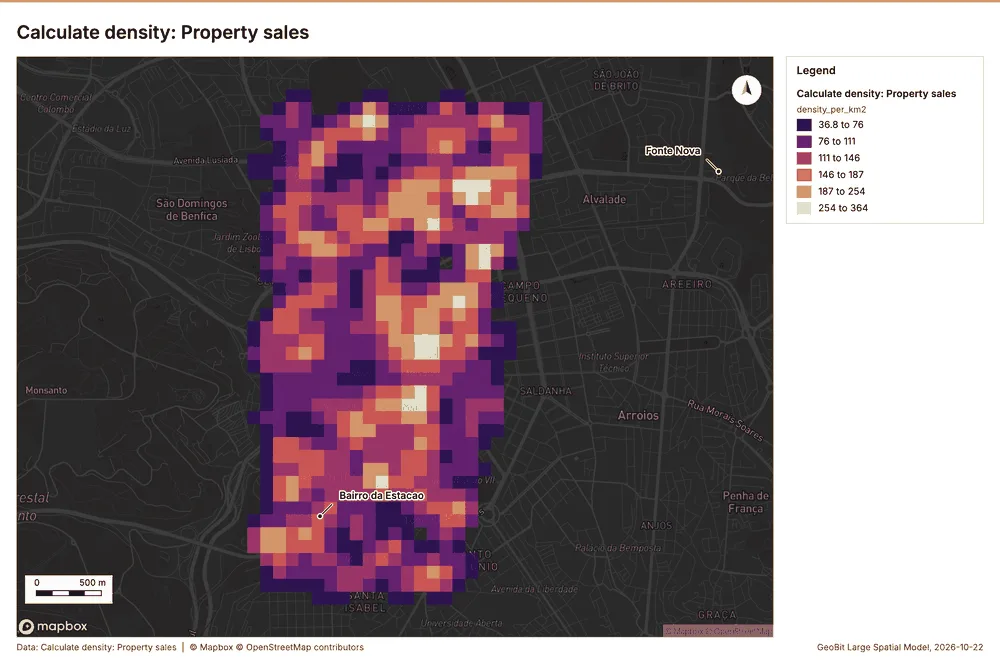
Why it was run on this data. 950 points in Property sales: a density surface shows where they concentrate 34.
What it found. The calculation utilized the Property sales data 9 and produced a total count of
| Result | Value |
|---|---|
| result, count | 867 |
| result, elapsed ms | 31 |
| result, bandwidth m | 200 |
| result, cell size m | 100 |
| result, excluded null | 0 |
| result, max density per km2 | 364 |
| billing, cost | 0.069 |
| billing, list price | 0.069 |
| billing, upstream cost | 0 |
Findings
- Evidenced: Calculate density on Property sales: Calculate density: 1 layer saved: Calculate density: Property sales (867 features) 935.
- Evidenced: It reported result, count 867; result, elapsed ms 31; result, bandwidth m 200; result, cell size m 100; result, excluded null 0; result, max density per km2 364 35.
Tool gp_calculate_density; parameters {"kernel": "quartic", "project": "acfed0f6-9df9-4775-9325-30c0bbed70e9", "features": {"layer": "Property sales (a421b4df)"}, "bandwidth_m": 200.0, "cell_size_m": 100.0}
Calculate density
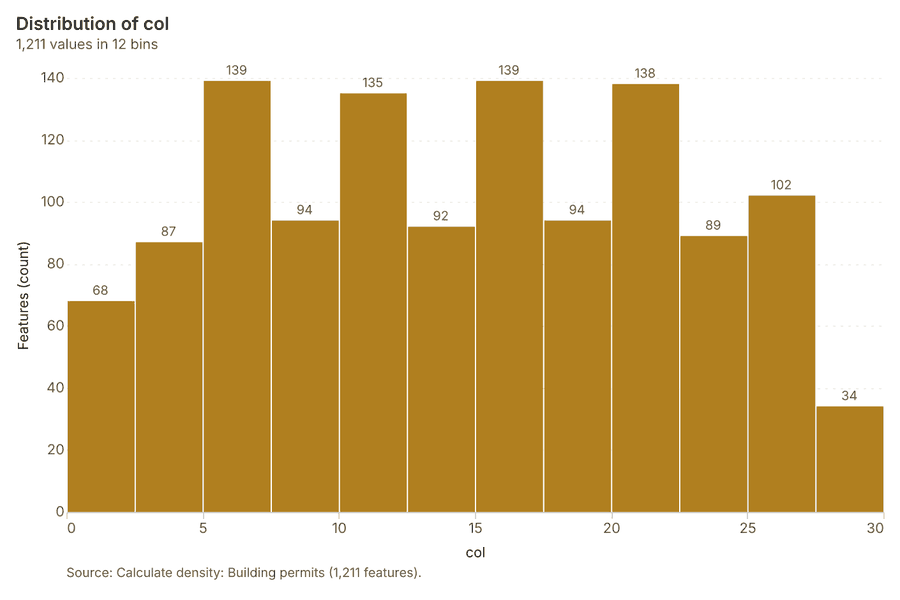
What this analysis is. Calculate density: Kernel density per square kilometer on a grid 33. In ArcGIS it is Calculate Density or Kernel Density; in QGIS, native:heatmapkerneldensityestimation 33.
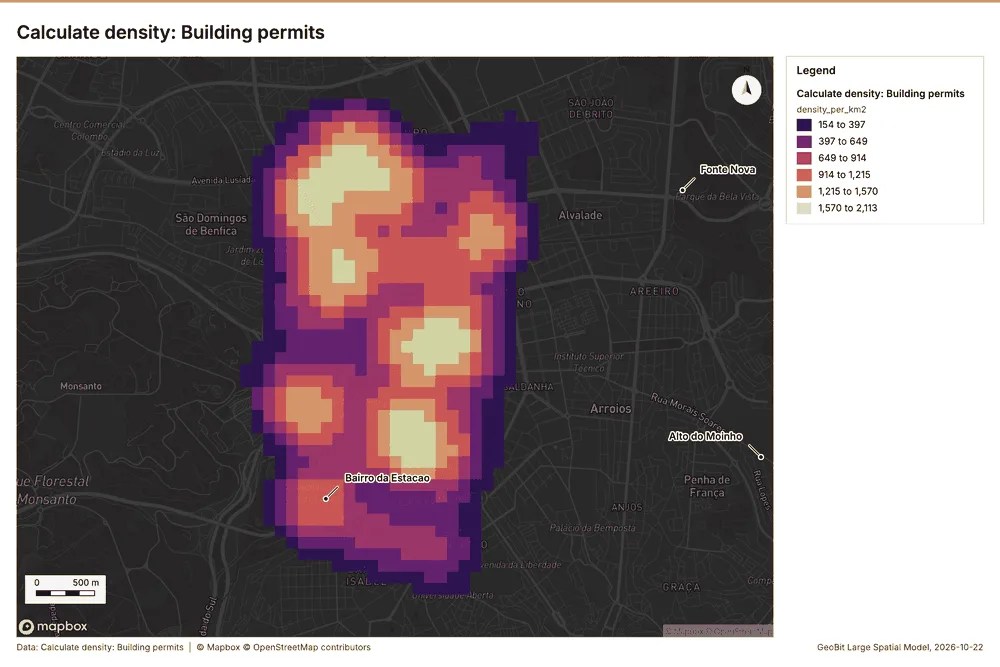
Why it was run on this data. 380 points in Building permits: a density surface shows where they concentrate 36.
What it found. The density calculation used the Building permits layer 12. The process resulted in 1,211 features 37. This calculation required 41 milliseconds and generated a bandwidth of 500 meters 37. The resulting max density per $\text{km}^2$ was 2,113 37.
| Result | Value |
|---|---|
| result, count | 1,211 |
| result, elapsed ms | 41 |
| result, bandwidth m | 500 |
| result, cell size m | 100 |
| result, excluded null | 0 |
| result, max density per km2 | 2,113 |
| billing, cost | 0.0576 |
| billing, list price | 0.0576 |
| billing, upstream cost | 0 |
Findings
- Evidenced: Calculate density on Building permits: Calculate density: 1 layer saved: Calculate density: Building permits (1211 features) 1237.
- Evidenced: It reported result, count 1,211; result, elapsed ms 41; result, bandwidth m 500; result, cell size m 100; result, excluded null 0; result, max density per km2 2,113 37.
Tool gp_calculate_density; parameters {"kernel": "quartic", "project": "acfed0f6-9df9-4775-9325-30c0bbed70e9", "features": {"layer": "Building permits (c9732c3b)"}, "bandwidth_m": 500.0, "cell_size_m": 100.0, "weight_field": "units"}
Find point clusters
What this analysis is. Find point clusters: Density-based clusters (DBSCAN, HDBSCAN or OPTICS, optionally space-time) with hulls and noise 38. In ArcGIS it is Find Point Clusters or Density-based Clustering; in QGIS, native:dbscanclustering or native:stdbscanclustering 38.
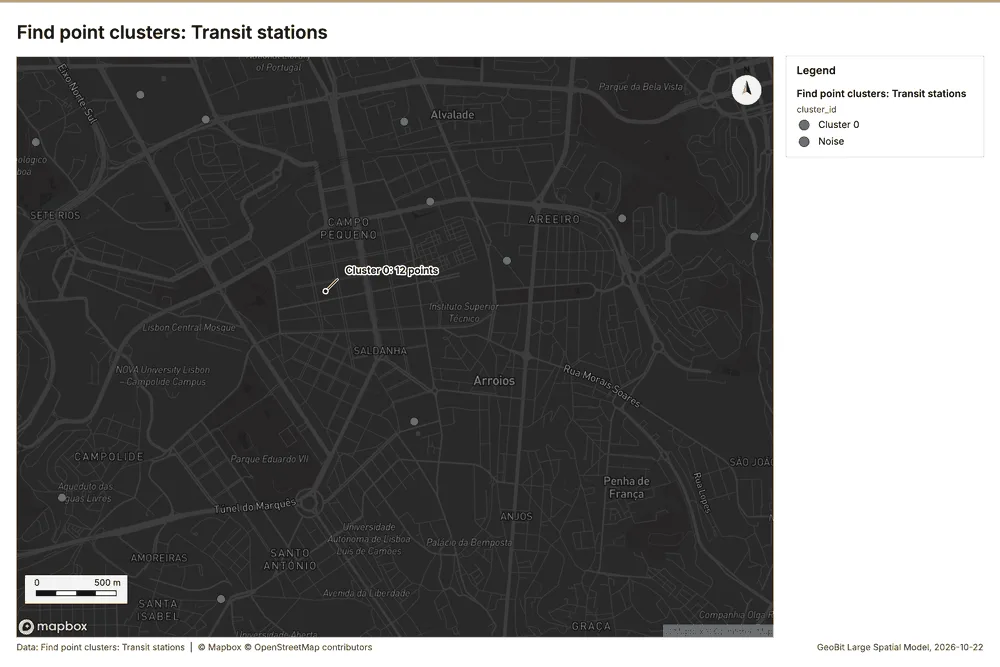
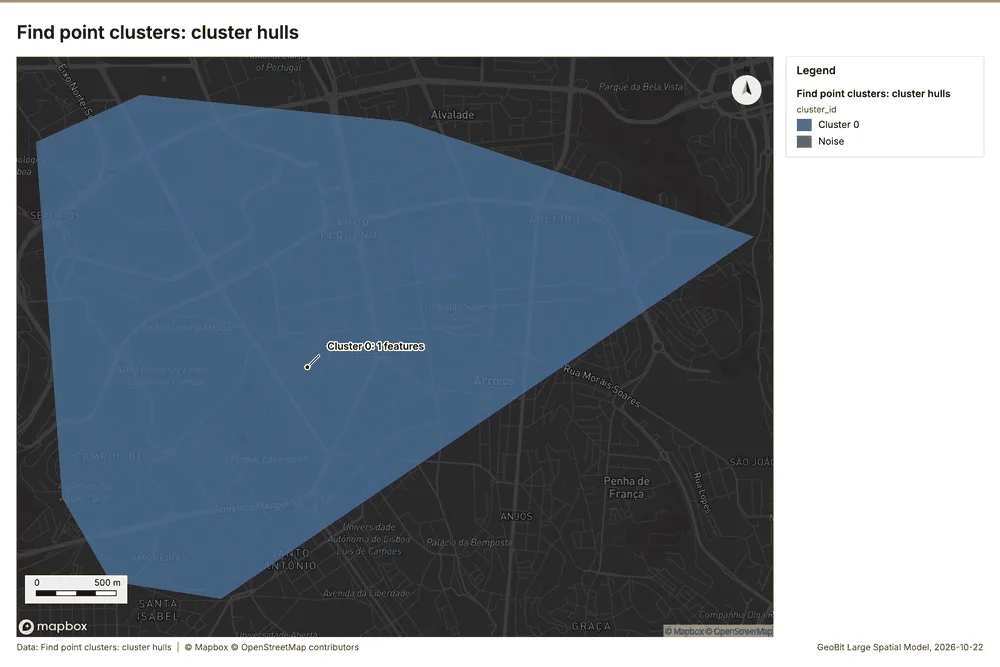
Why it was run on this data. DBSCAN finds dense groups of Transit stations and separates noise 39.
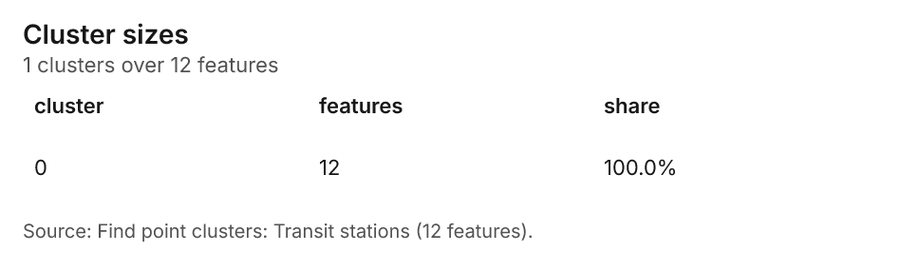
What it found. The gp_find_point_clusters tool processed the Transit stations layer 19. This process yielded $12$ point clusters 40. The resulting noise count was $0$ 40, and the maximum cluster distance was $2,000$ meters 40. The operation was completed in $5$ milliseconds 40 and included $12$ features in the final output 40.
| Result | Value |
|---|---|
| result, count | 12 |
| result, noise | 0 |
| result, distance m | 2,000 |
| result, elapsed ms | 5 |
| result, min points | 3 |
| billing, cost | 0.05024 |
| billing, list price | 0.05024 |
| billing, upstream cost | 0 |
Findings
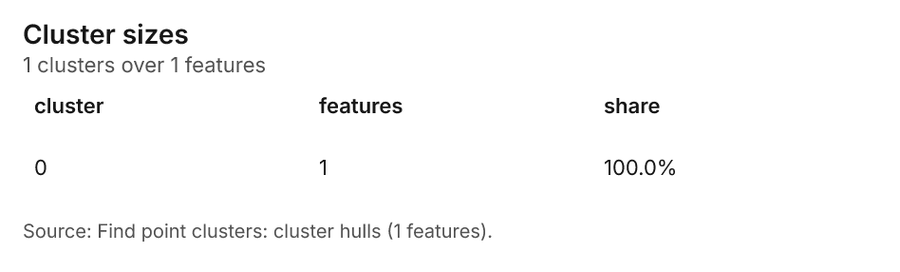
- Evidenced: Find point clusters on Transit stations: Find point clusters: 2 layers saved: Find point clusters: Transit stations (12 features); Find point clusters: cluster hulls (1 feature) 1940.
- Evidenced: It reported result, count 12; result, noise 0; result, distance m 2,000; result, elapsed ms 5; result, min points 3; billing, cost 0.05024 40.
Tool gp_find_point_clusters; parameters {"method": "dbscan", "project": "acfed0f6-9df9-4775-9325-30c0bbed70e9", "features": {"layer": "Transit stations (400e1561)"}, "distance_m": 2000.0, "min_points": 3}
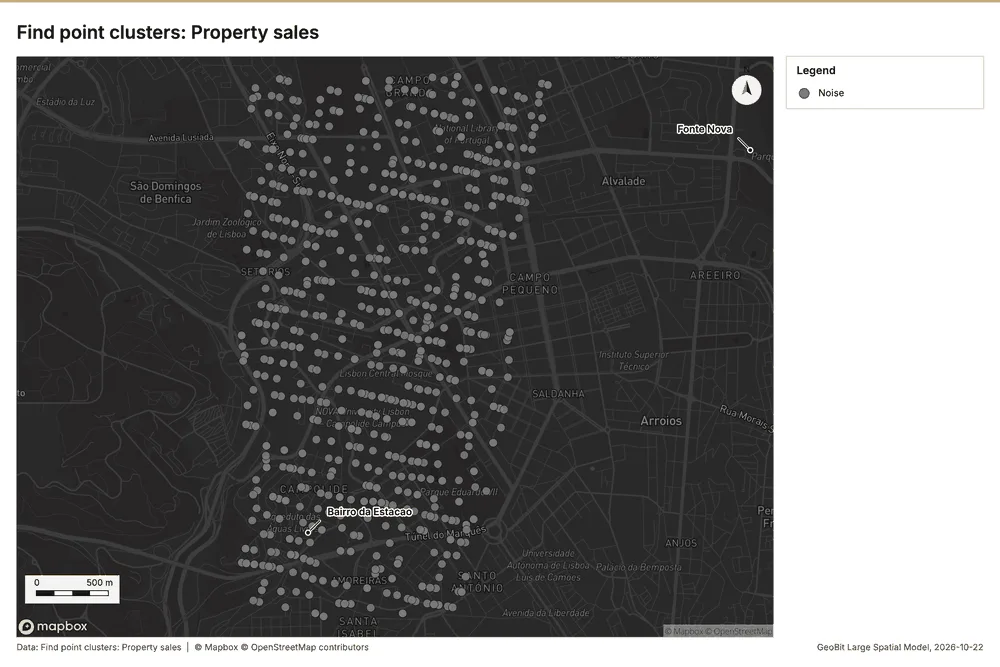
Find point clusters
What this analysis is. Find point clusters: Density-based clusters (DBSCAN, HDBSCAN or OPTICS, optionally space-time) with hulls and noise 38. In ArcGIS it is Find Point Clusters or Density-based Clustering; in QGIS, native:dbscanclustering or native:stdbscanclustering 38.
Why it was run on this data. DBSCAN finds dense groups of Property sales and separates noise 41.
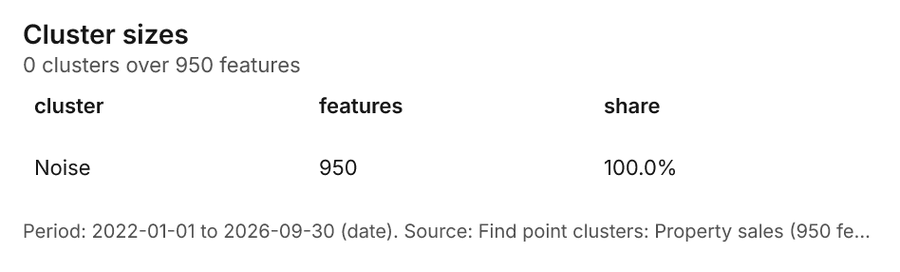
What it found. Find point clusters on Property sales: Find point clusters: 1 layer saved: Find point clusters: Property sales (950 features) 942. It reported result, count 950; result, noise 950; result, distance m 100; result, elapsed ms 12; result, min points 20; billing, cost 0.069 42.
| Result | Value |
|---|---|
| result, count | 950 |
| result, noise | 950 |
| result, distance m | 100 |
| result, elapsed ms | 12 |
| result, min points | 20 |
| billing, cost | 0.069 |
| billing, list price | 0.069 |
| billing, upstream cost | 0 |
Findings
- Evidenced: Find point clusters on Property sales: Find point clusters: 1 layer saved: Find point clusters: Property sales (950 features) 942.
- Evidenced: It reported result, count 950; result, noise 950; result, distance m 100; result, elapsed ms 12; result, min points 20; billing, cost 0.069 42.
Tool gp_find_point_clusters; parameters {"method": "dbscan", "project": "acfed0f6-9df9-4775-9325-30c0bbed70e9", "features": {"layer": "Property sales (a421b4df)"}, "distance_m": 100.0, "min_points": 20}
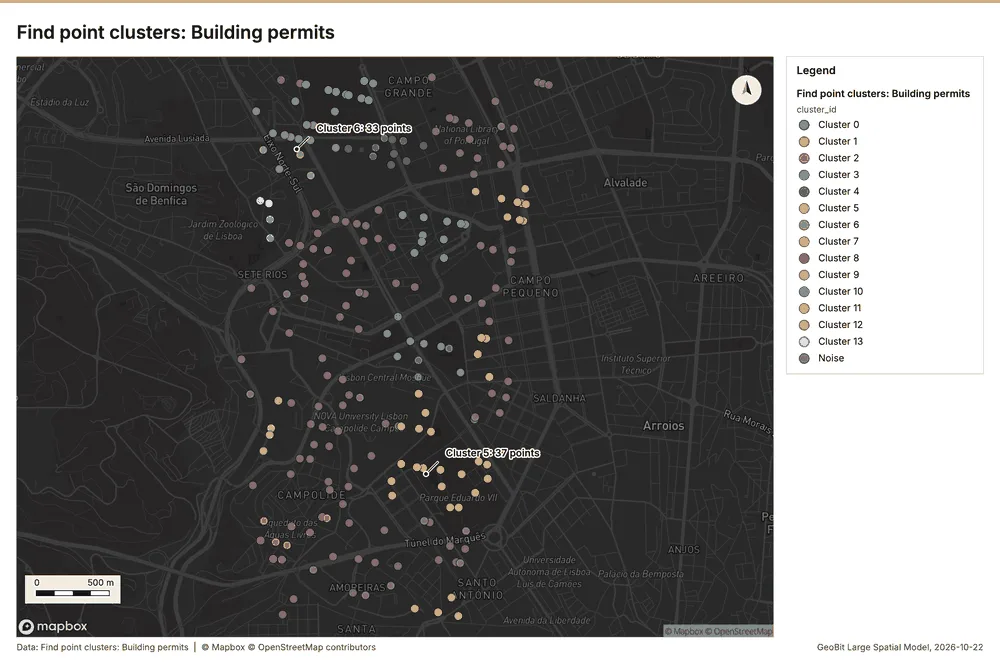
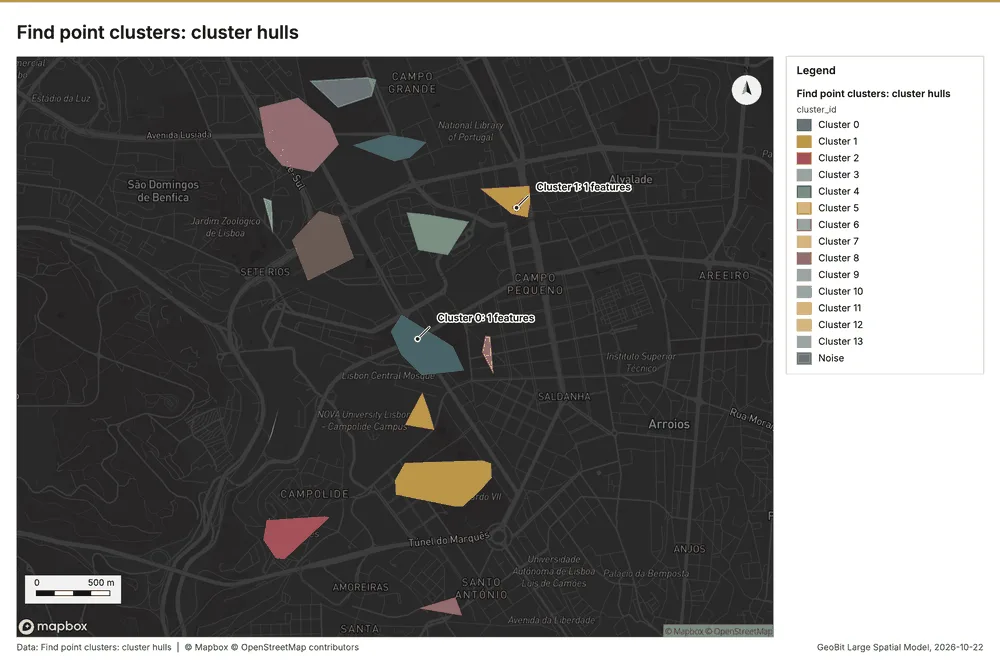
Find point clusters
What this analysis is. Find point clusters: Density-based clusters (DBSCAN, HDBSCAN or OPTICS, optionally space-time) with hulls and noise 38. In ArcGIS it is Find Point Clusters or Density-based Clustering; in QGIS, native:dbscanclustering or native:stdbscanclustering 38.
Why it was run on this data. DBSCAN finds dense groups of Building permits and separates noise 43.
What it found. Building permits served as the input data for the point cluster analysis 12.
| Result | Value |
|---|---|
| result, count | 380 |
| result, noise | 126 |
| result, distance m | 200 |
| result, elapsed ms | 11 |
| result, min points | 10 |
| billing, cost | 0.0576 |
| billing, list price | 0.0576 |
| billing, upstream cost | 0 |
Findings
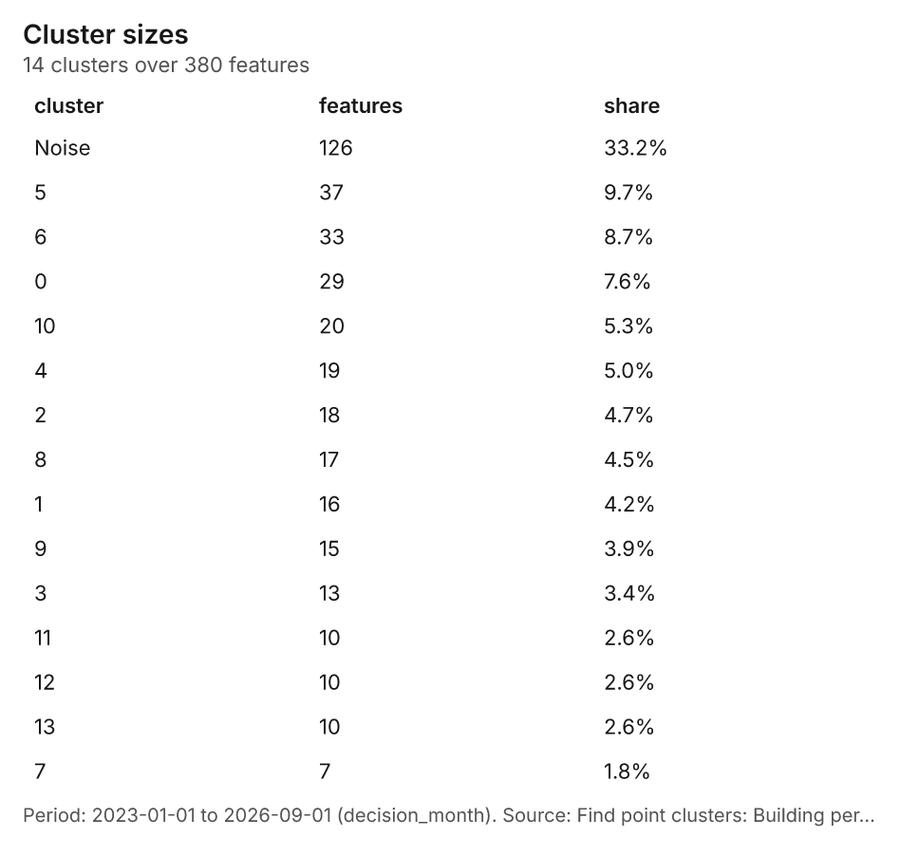
- Evidenced: Find point clusters on Building permits: Find point clusters: 2 layers saved: Find point clusters: Building permits (380 features); Find point clusters: cluster hulls (14 features) 1244.
- Evidenced: It reported result, count 380; result, noise 126; result, distance m 200; result, elapsed ms 11; result, min points 10; billing, cost 0.0576 44.
Tool gp_find_point_clusters; parameters {"method": "dbscan", "project": "acfed0f6-9df9-4775-9325-30c0bbed70e9", "features": {"layer": "Building permits (c9732c3b)"}, "distance_m": 200.0, "min_points": 10}
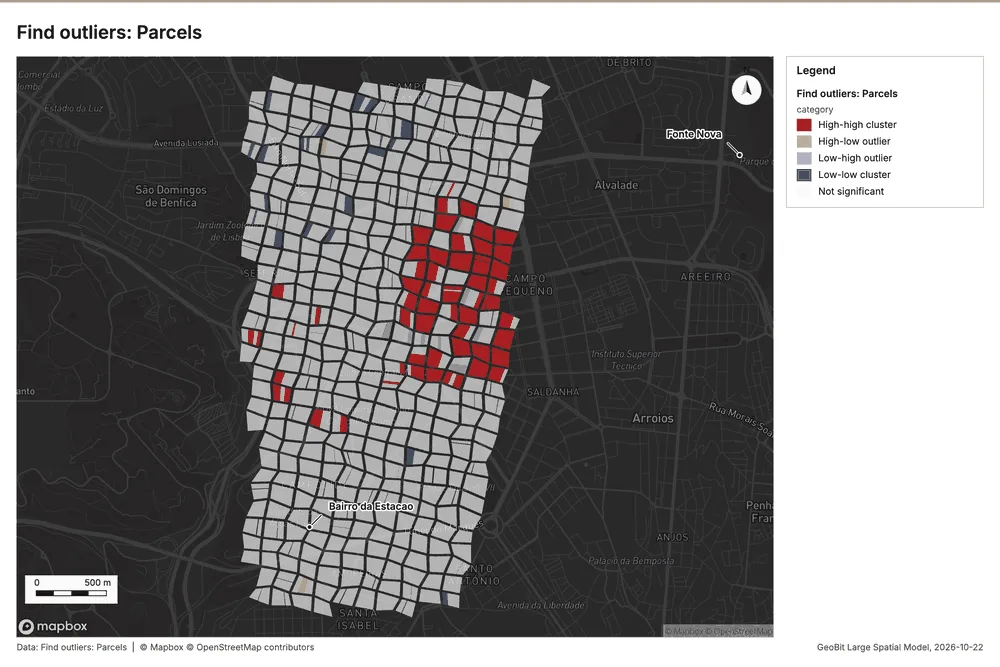
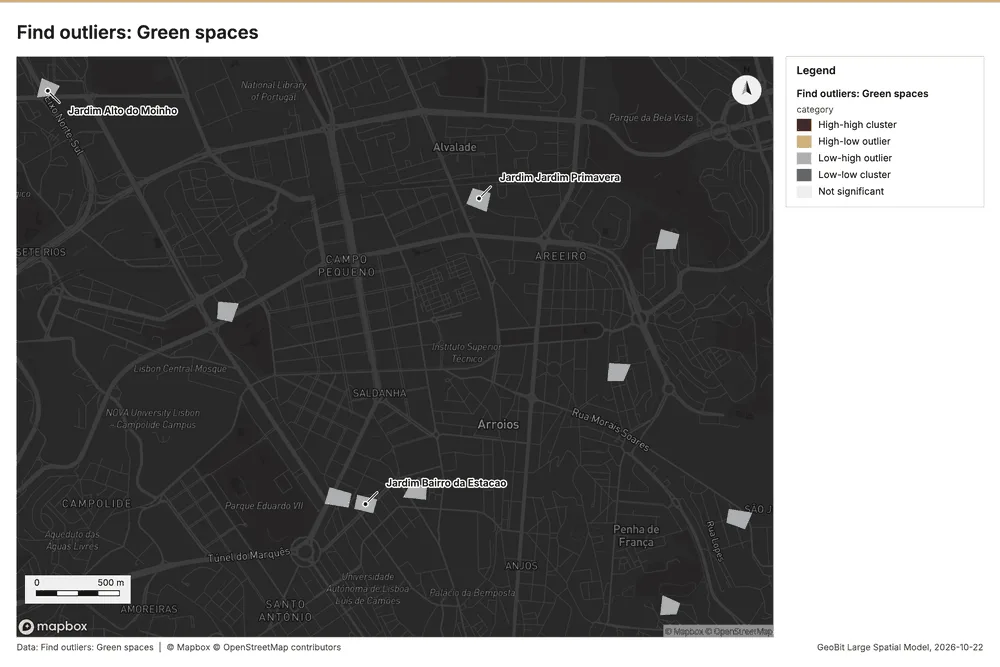
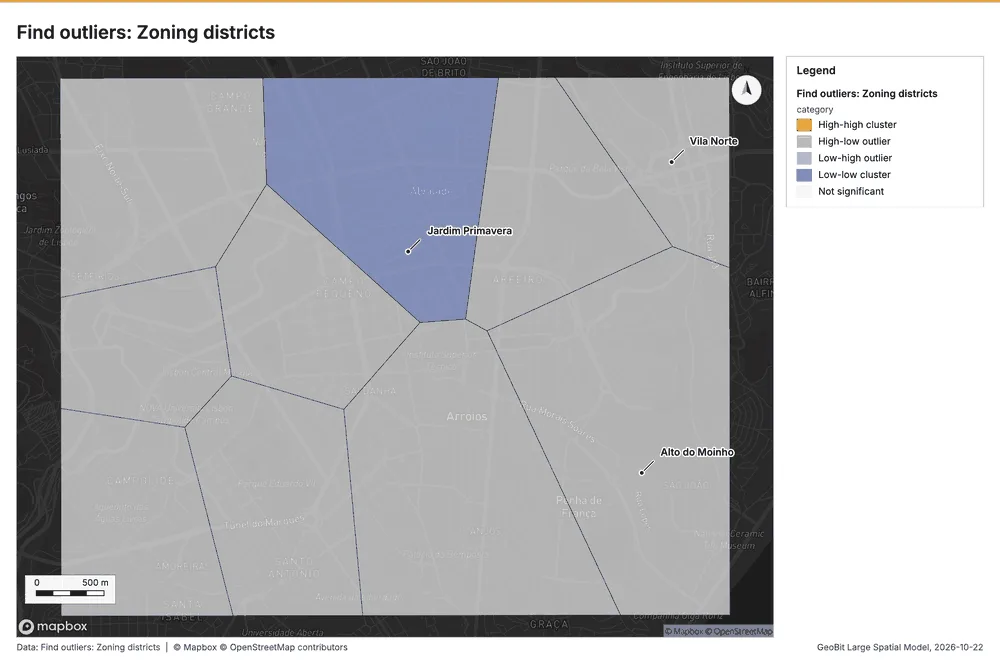
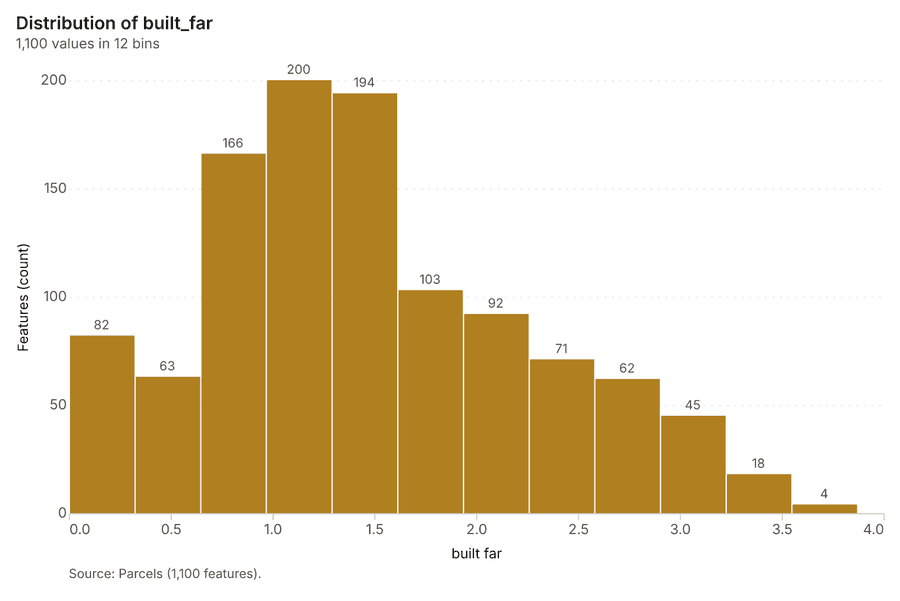
Outliers
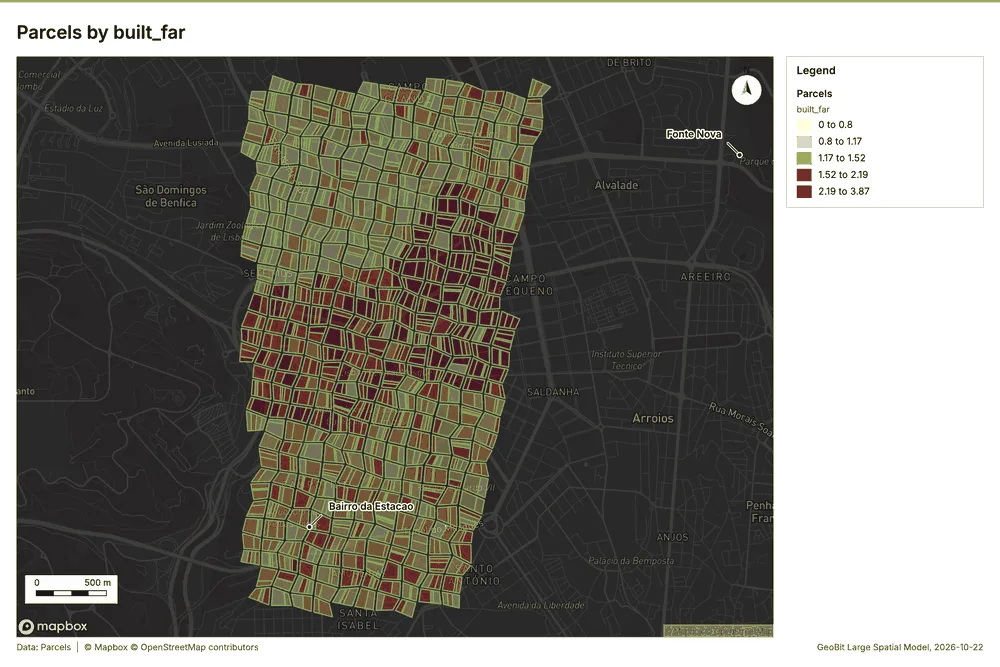
What this analysis is. Find outliers: Anselin local Moran’s I: HH, LL clusters and HL, LH outliers 45. In ArcGIS it is Find Outliers or Cluster and Outlier Analysis (Anselin Local Moran’s I) 45.
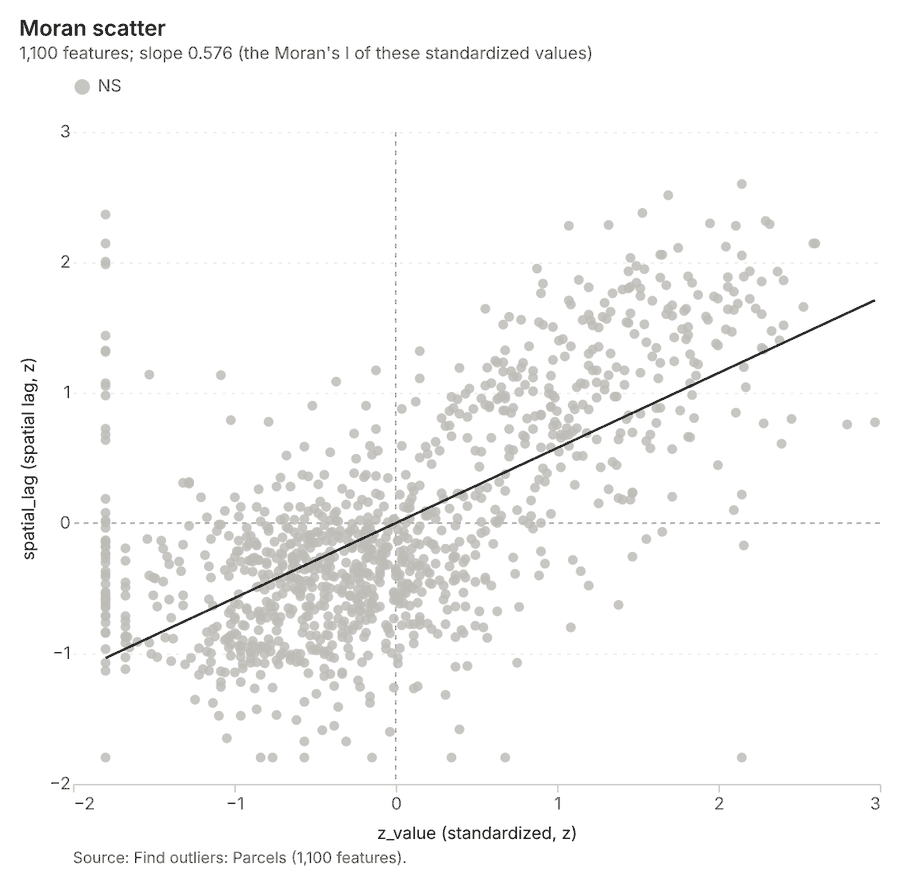
Why it was run on this data. Local Moran's I maps clusters and outliers of 'built_far' 46.
What it found. The gp_outliers tool was utilized on the Parcels layer 20. The analysis result reported a count of 1,100 features 47. This task was completed with an elapsed time of 74 ms 47. Key metrics generated included a distance band of 86.92 m 47, and the billing cost was 0.083 47.
| Result | Value |
|---|---|
| result, count | 1,100 |
| result, elapsed ms | 74 |
| result, permutations | 199 |
| result, excluded null | 0 |
| result, distance band m | 86.92 |
| billing, cost | 0.083 |
| billing, list price | 0.083 |
| billing, upstream cost | 0 |
Findings
- Evidenced: Outliers on Parcels: Find outliers: 1 layer saved: Find outliers: Parcels (1100 features) 2047.
- Evidenced: It reported result, count 1,100; result, elapsed ms 74; result, permutations 199; result, excluded null 0; result, distance band m 86.92; billing, cost 0.083 47.
Tool gp_outliers; parameters {"field": "built_far", "project": "acfed0f6-9df9-4775-9325-30c0bbed70e9", "features": {"layer": "Parcels (ccc22cc1)"}, "aggregation": "hexagon"}
Outliers
What this analysis is. Find outliers: Anselin local Moran’s I: HH, LL clusters and HL, LH outliers 45. In ArcGIS it is Find Outliers or Cluster and Outlier Analysis (Anselin Local Moran’s I) 45.
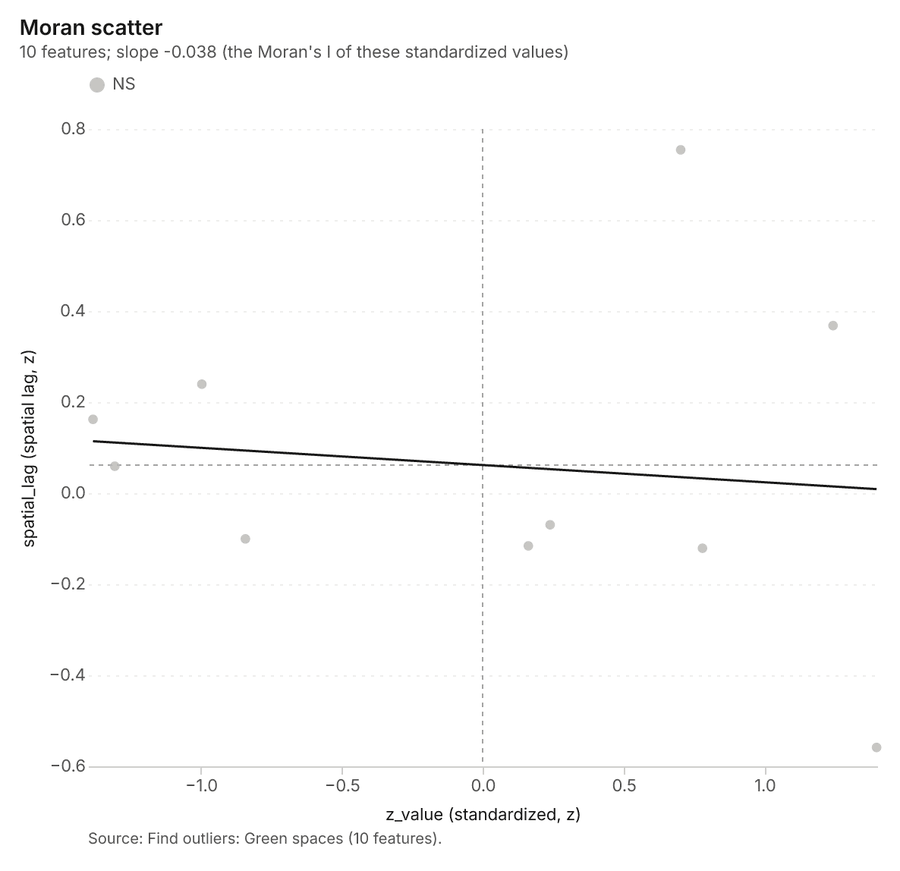
Why it was run on this data. Local Moran's I maps clusters and outliers of 'area_ha' 48.
What it found. Outliers on Green spaces: Find outliers: 1 layer saved: Find outliers: Green spaces (10 features) 4950. It reported result, count 10; result, elapsed ms 3; result, permutations 199; result, excluded null 0; result, distance band m 1,747; billing, cost 0.0503 49.
| Result | Value |
|---|---|
| result, count | 10 |
| result, elapsed ms | 3 |
| result, permutations | 199 |
| result, excluded null | 0 |
| result, distance band m | 1,747 |
| billing, cost | 0.0503 |
| billing, list price | 0.0503 |
| billing, upstream cost | 0 |
Findings
- Evidenced: Outliers on Green spaces: Find outliers: 1 layer saved: Find outliers: Green spaces (10 features) 4950.
- Evidenced: It reported result, count 10; result, elapsed ms 3; result, permutations 199; result, excluded null 0; result, distance band m 1,747; billing, cost 0.0503 49.
Tool gp_outliers; parameters {"field": "area_ha", "project": "acfed0f6-9df9-4775-9325-30c0bbed70e9", "features": {"layer": "Green spaces (448e3c1b)"}, "aggregation": "hexagon"}
Outliers
What this analysis is. Find outliers: Anselin local Moran’s I: HH, LL clusters and HL, LH outliers 45. In ArcGIS it is Find Outliers or Cluster and Outlier Analysis (Anselin Local Moran’s I) 45.
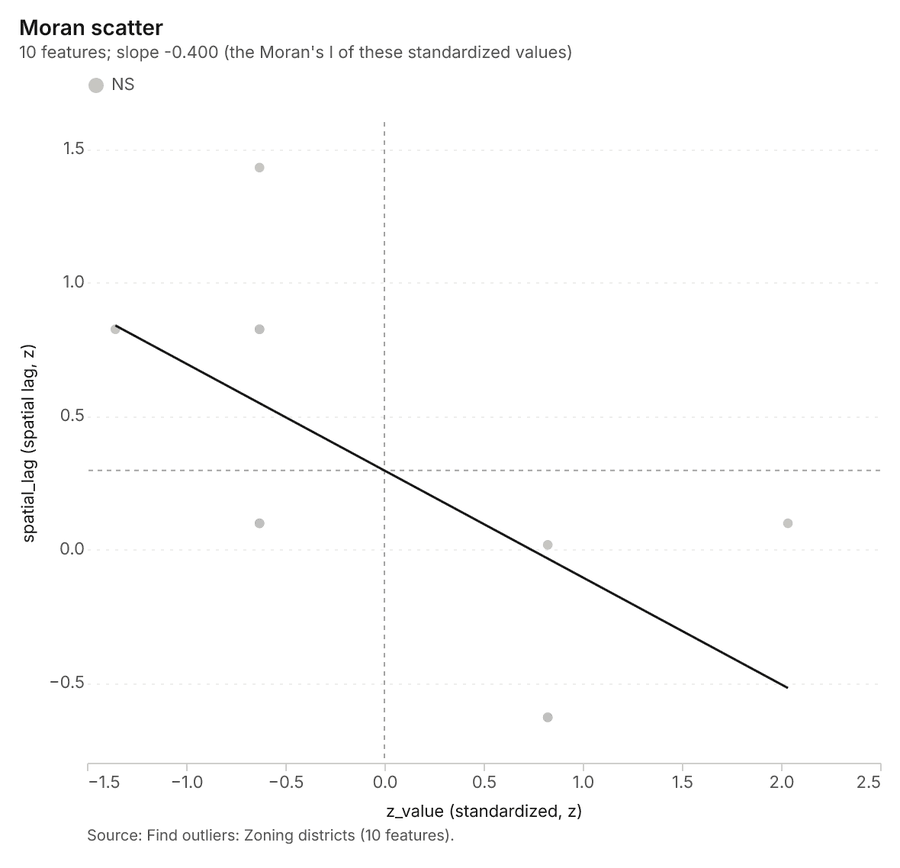
Why it was run on this data. Local Moran's I maps clusters and outliers of 'max_far' 51.
What it found. Outliers on Zoning districts: Find outliers: 1 layer saved: Find outliers: Zoning districts (10 features) 5253. It reported result, count 10; result, elapsed ms 2; result, permutations 199; result, excluded null 0; result, distance band m 1,435; billing, cost 0.0503 52.
| Result | Value |
|---|---|
| result, count | 10 |
| result, elapsed ms | 2 |
| result, permutations | 199 |
| result, excluded null | 0 |
| result, distance band m | 1,435 |
| billing, cost | 0.0503 |
| billing, list price | 0.0503 |
| billing, upstream cost | 0 |
Findings
- Evidenced: Outliers on Zoning districts: Find outliers: 1 layer saved: Find outliers: Zoning districts (10 features) 5253.
- Evidenced: It reported result, count 10; result, elapsed ms 2; result, permutations 199; result, excluded null 0; result, distance band m 1,435; billing, cost 0.0503 52.
Tool gp_outliers; parameters {"field": "max_far", "project": "acfed0f6-9df9-4775-9325-30c0bbed70e9", "features": {"layer": "Zoning districts (f84e0e45)"}, "aggregation": "hexagon"}
Maps and charts
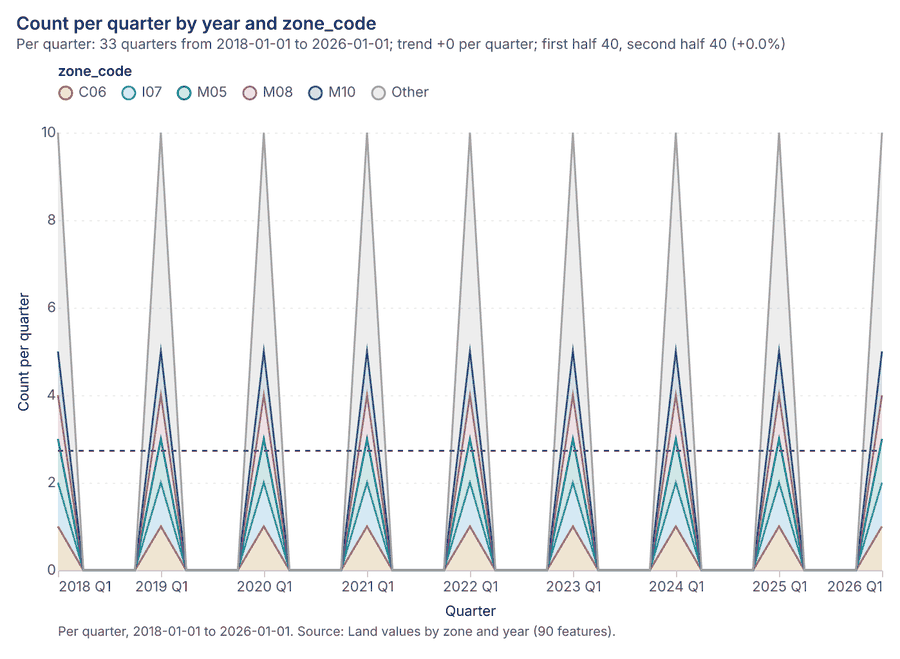
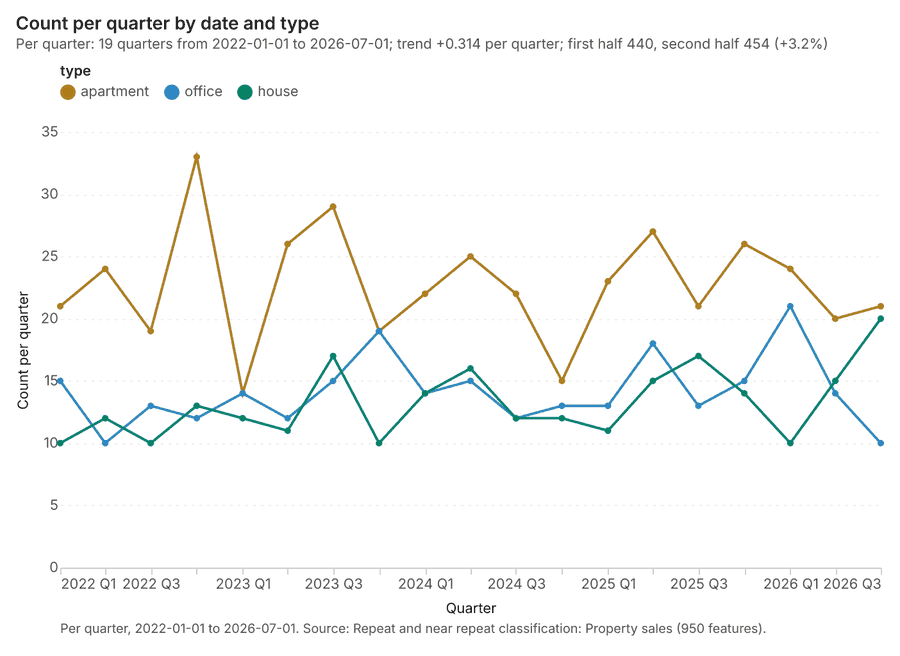
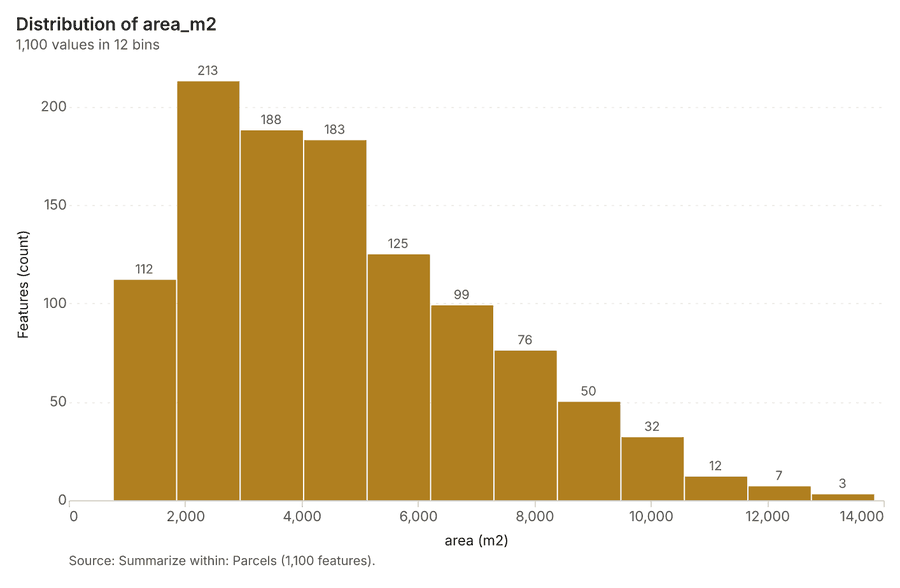
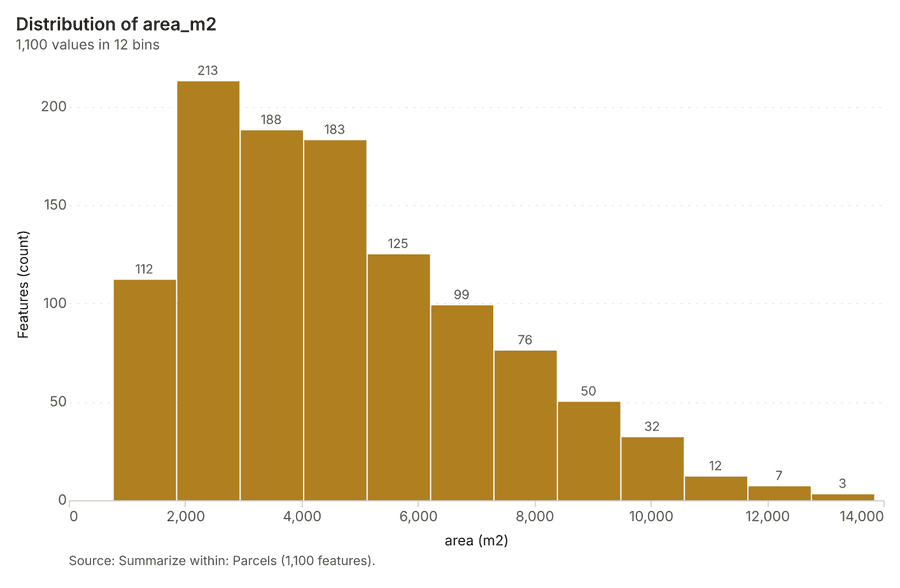
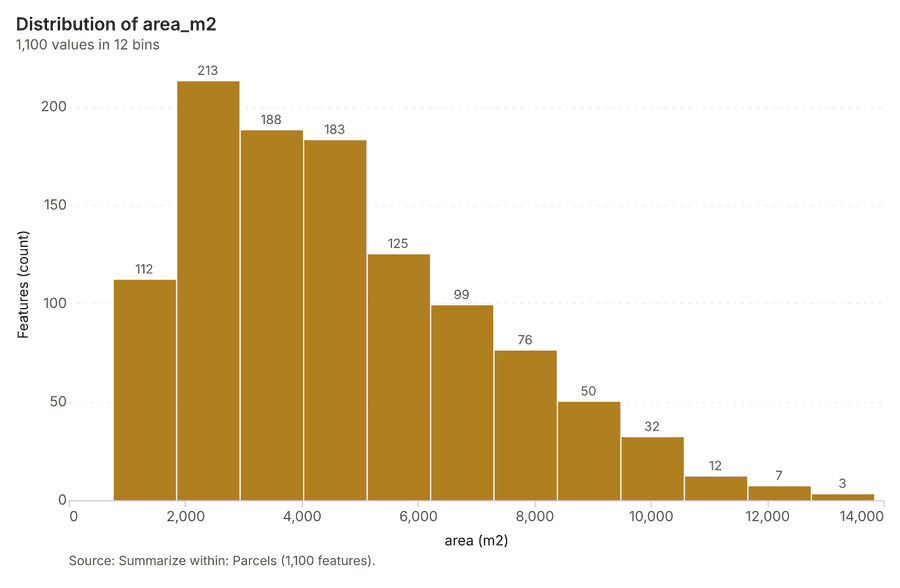
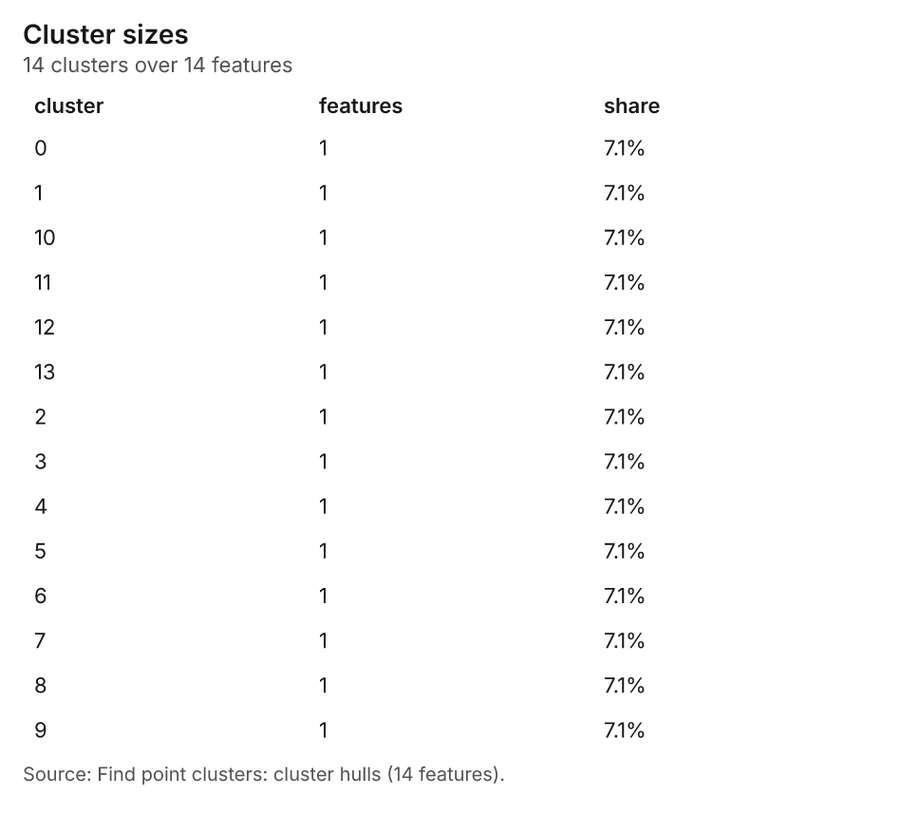
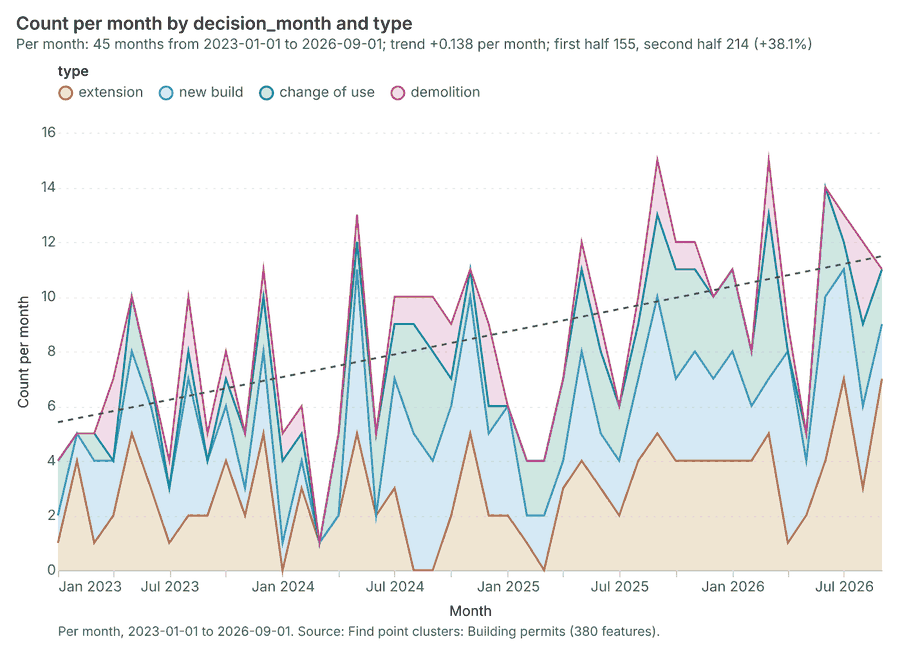
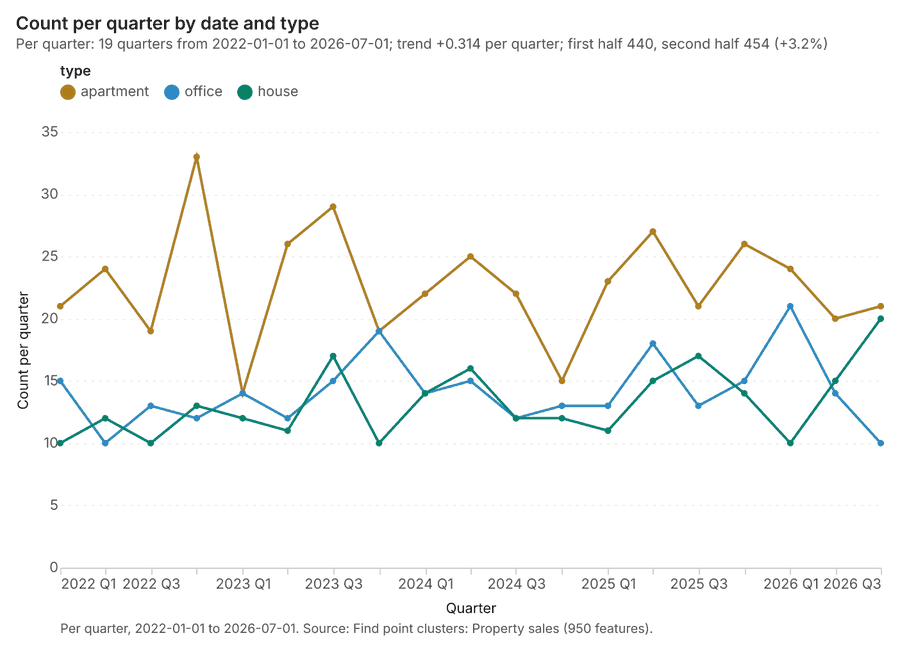
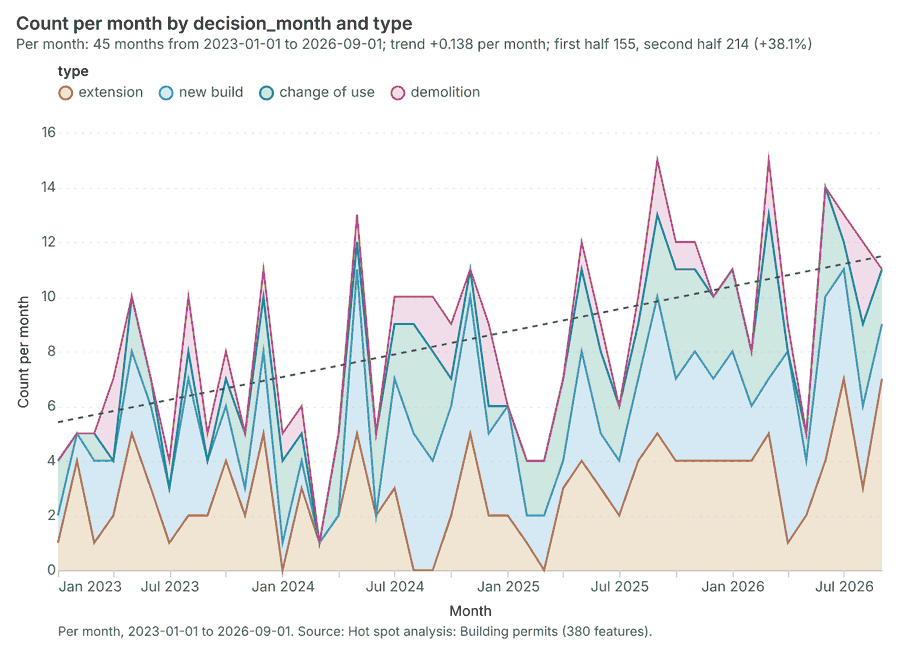
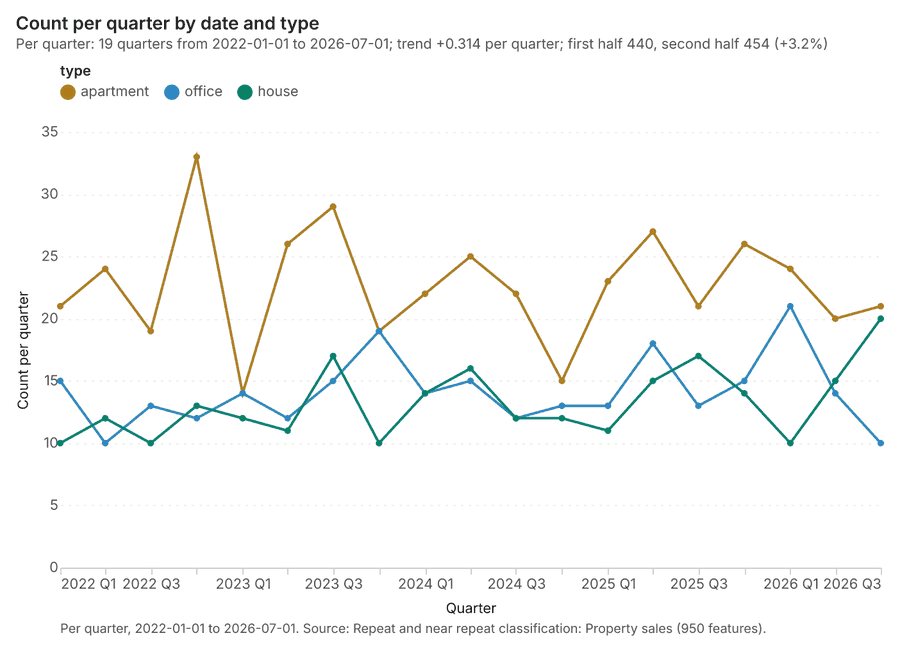
The run also made 21 map image(s) 545556575859606162636465666768697071727374 and 26 chart(s) 75767778798081828384858687888990919293949596979899100.
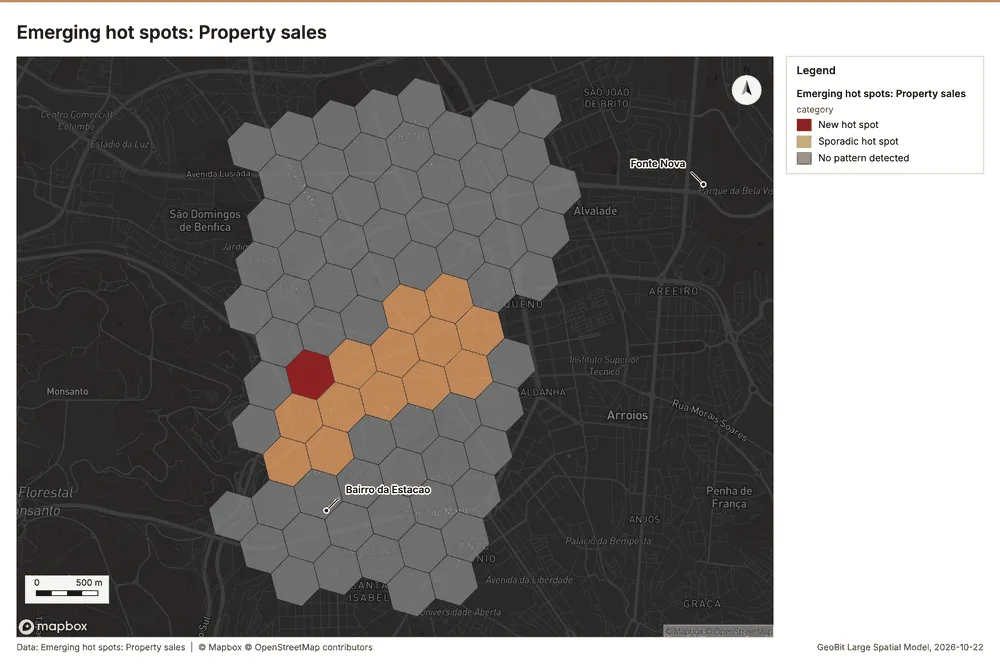
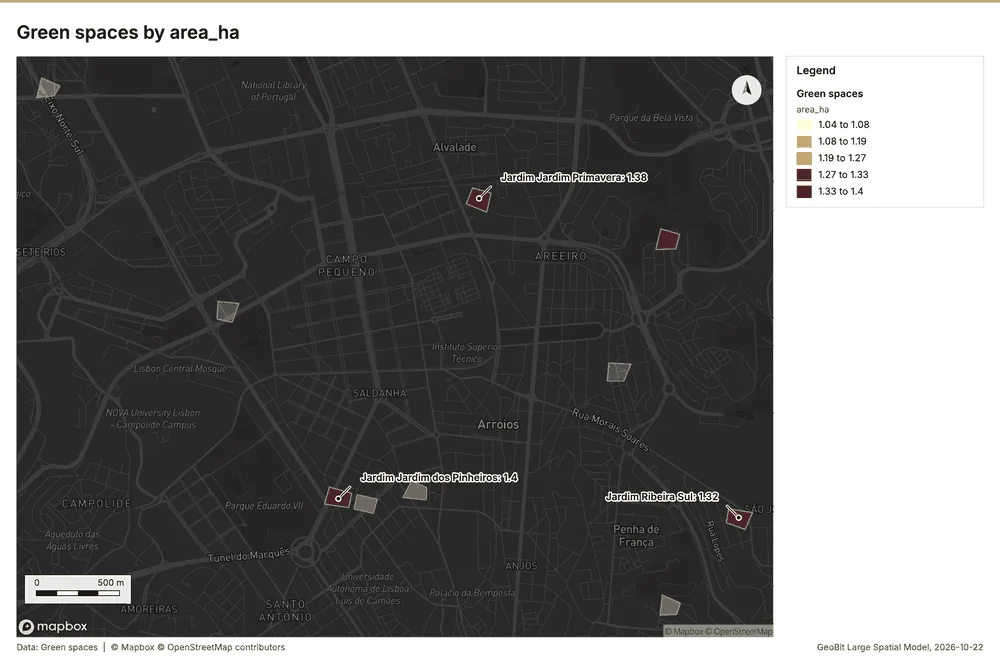
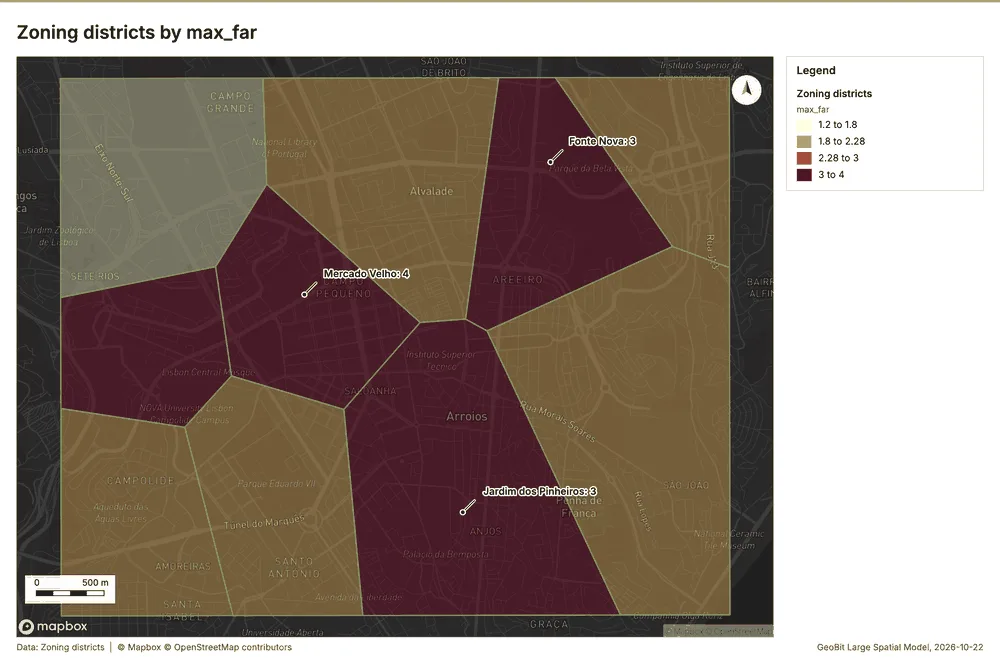
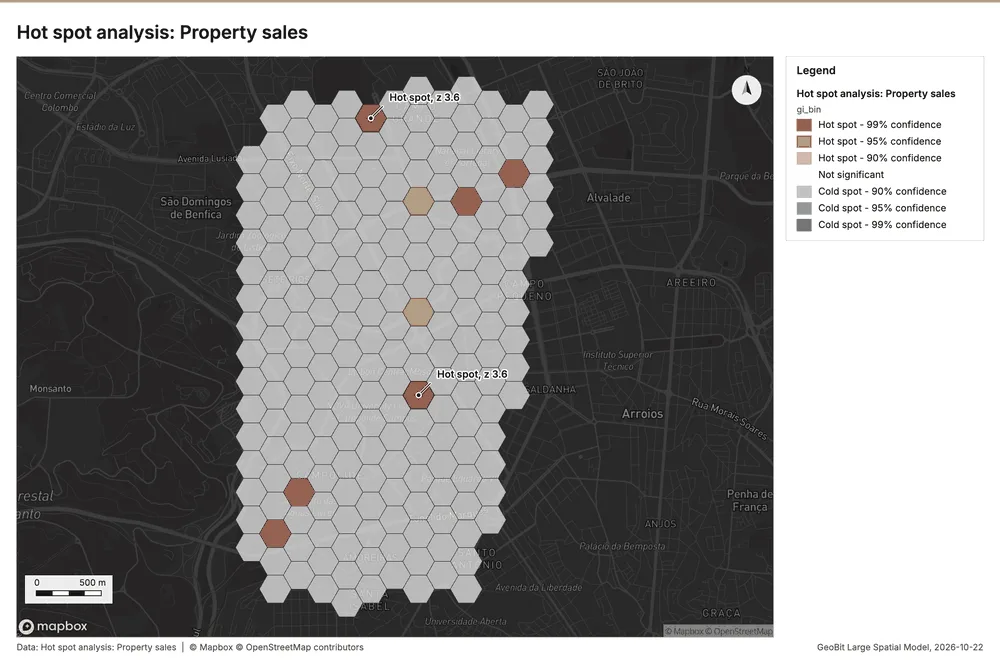
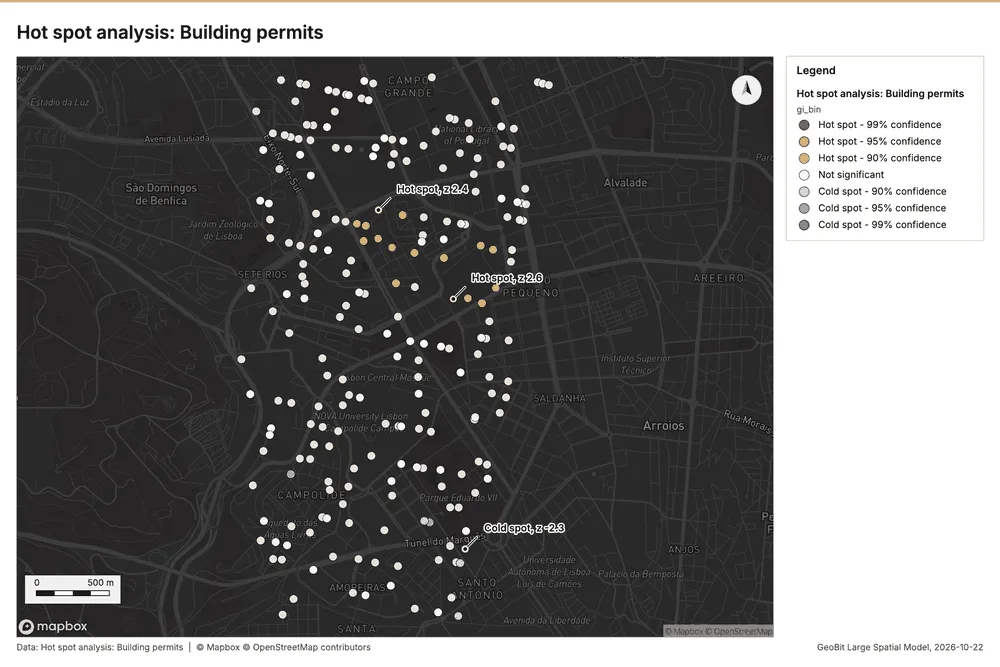
What the map shows. The map, titled "Emerging hot spots: Property sales," displays the pattern of property sales across a hexagonal grid. The majority of the area is colored grey, indicating that no pattern was detected in these regions. A cluster 54
Inferred: read from the image by gemma4:e4b, not evidence.
Changes since the last run
This is the first report of this project.
Sources
- 1Rendering: Chart: Timeline: events per quarter by dataset. 140 rows id efe17a86-8fd3-4c8e-aed1-29ebb025af6d
- 2Dataset: Property sales. vector, 950 rows id 8f893170-c6db-4826-83e8-09af6dc89e27
- 3Dataset: Building permits. vector, 380 rows id aa79bba6-c73f-4b2f-a79e-176493aa4621
- 4Dataset: Land values by zone and year. table, 90 rows id 7cee65a2-b1e0-47a4-98b2-10d181fb8423
- 5Dataset: Planning applications. table, 160 rows id ae83bb58-05b5-4b51-b3f8-ca020020f1d5
- 6Catalog: Emerging hot spots (operation catalog, gp_space_time_hot_spots). Where hot spots are new, consecutive, intensifying, persistent, diminishing, sporadic, oscillating or historical over time. ArcGIS: Emerging Hot Spot Analysis, Create Space Time Cube. id gp_space_time_hot_spots
- 7Plan: Space time hot spots of Property sales (the Start plan's candidate c_37c352605313). Property sales carry dates in 'date': emerging hot spot analysis finds new, intensifying and fading hot spots per month. id f8db5acb-8be1-4e6d-8904-9ee8c04e791a:c_37c352605313
- 8Tool result: gp_space_time_hot_spots, step 0. Emerging hot spots: 1 layer saved: Emerging hot spots: Property sales (81 features). id 3b547b3d-4c3c-4444-9020-8c97986c7155:0
- 9Layer: Property sales. 950 features id a421b4df-eece-4b35-a40f-e8daf4e77a1e
- 10Plan: Space time hot spots of Building permits (the Start plan's candidate c_cd867438faaa). Building permits carry dates in 'decision_month': emerging hot spot analysis finds new, intensifying and fading hot spots per month. id f8db5acb-8be1-4e6d-8904-9ee8c04e791a:c_cd867438faaa
- 11Tool result: gp_space_time_hot_spots, step 1. Emerging hot spots: 1 layer saved: Emerging hot spots: Building permits (90 features). id 3b547b3d-4c3c-4444-9020-8c97986c7155:1
- 12Layer: Building permits. 380 features id c9732c3b-7527-455c-bfff-16e282af4bf8
- 13Catalog: Repeat and near repeat classification (operation catalog, gp_near_repeat). Classify incidents as originators, repeats (same place) or near repeats within a distance and time window, with a Knox test table. ArcGIS: Repeat and Near Repeat Classification, Near Repeat Calculator. id gp_near_repeat
- 14Plan: Near repeat of Property sales (the Start plan's candidate c_71042b703d0d). Near repeat analysis tests whether Property sales close in space also follow each other within 30 days. id f8db5acb-8be1-4e6d-8904-9ee8c04e791a:c_71042b703d0d
- 15Tool result: gp_near_repeat, step 2. Repeat and near repeat classification: 1 layer saved: Repeat and near repeat classification: Property sales (950 features). id 3b547b3d-4c3c-4444-9020-8c97986c7155:2
- 16Catalog: Summarize within (operation catalog, gp_summarize_within). Count and aggregate the features inside each polygon (or bin), proportionally for lines and polygons. ArcGIS: Summarize Within, Aggregate Points. QGIS: native:countpointsinpolygon, native:sumlinelengths. id gp_summarize_within
- 17Plan: Transit stations per feature of Parcels (the Start plan's candidate c_2a92a76984e1). Count Transit stations inside each feature of Parcels; the counts map as a choropleth (natural breaks, sequential colors). id f8db5acb-8be1-4e6d-8904-9ee8c04e791a:c_2a92a76984e1
- 18Tool result: gp_summarize_within, step 0. Summarize within: 1 layer saved: Summarize within: Parcels (1100 features). id 029a787d-7030-40ee-8bec-78edb55a4233:0
- 19Layer: Transit stations. 12 features id 400e1561-f1f1-481c-b9bc-1ac817459feb
- 20Layer: Parcels. 1,100 features id ccc22cc1-2735-4cb4-aa2f-5cc33be687bf
- 21Tool result: gp_summarize_within, step 1. Summarize within: 1 layer saved: Summarize within: Parcels (1100 features). id 029a787d-7030-40ee-8bec-78edb55a4233:1
- 22Tool result: gp_summarize_within, step 2. Summarize within: 1 layer saved: Summarize within: Parcels (1100 features). id 029a787d-7030-40ee-8bec-78edb55a4233:2
- 23Catalog: Zonal statistics (analysis catalog, rs_zonal_statistics). count/min/max/mean/std/sum/median/majority per polygon as a table and as GeoJSON. ArcGIS: Zonal Statistics as Table (polygons). id rs_zonal_statistics
- 24Plan: Zonal statistics of City terrain model (DEM) and Parcels (the Start plan's candidate c_223f208b883c). Statistics of City terrain model (DEM) inside each feature of Parcels. id f8db5acb-8be1-4e6d-8904-9ee8c04e791a:c_223f208b883c
- 25Tool result: rs_zonal_statistics, step 0. Zonal statistics: 1100 row(s). zones 1100. id e1b6768a-3792-454a-b224-e267bd9b2d98:0
- 26Tool result: rs_zonal_statistics, step 1. Zonal statistics: 10 row(s). zones 10. id e1b6768a-3792-454a-b224-e267bd9b2d98:1
- 27Tool result: rs_zonal_statistics, step 2. Zonal statistics: 10 row(s). zones 10. id e1b6768a-3792-454a-b224-e267bd9b2d98:2
- 28Catalog: Hot spot analysis (operation catalog, gp_hot_spots). Getis-Ord Gi* hot and cold spots with z-scores, p-values and confidence bins. ArcGIS: Find Hot Spots, Hot Spot Analysis (Getis-Ord Gi*). QGIS: qgis:hotspot (plugin). id gp_hot_spots
- 29Plan: Hot spots of Property sales (the Start plan's candidate c_acf84d8d58c2). 950 points: Getis-Ord Gi* tests whether the concentrations in Property sales are statistically significant. id f8db5acb-8be1-4e6d-8904-9ee8c04e791a:c_acf84d8d58c2
- 30Tool result: gp_hot_spots, step 0. Hot spot analysis: 1 layer saved: Hot spot analysis: Property sales (213 features). id ba41b9e6-74d7-45fb-bad3-3f51fe7fca0d:0
- 31Plan: Hot spots of Building permits (the Start plan's candidate c_3746fcbd31f7). 380 points: Getis-Ord Gi* tests whether the concentrations in Building permits are statistically significant. id f8db5acb-8be1-4e6d-8904-9ee8c04e791a:c_3746fcbd31f7
- 32Tool result: gp_hot_spots, step 1. Hot spot analysis: 1 layer saved: Hot spot analysis: Building permits (380 features). id ba41b9e6-74d7-45fb-bad3-3f51fe7fca0d:1
- 33Catalog: Calculate density (operation catalog, gp_calculate_density). Kernel density per square kilometer on a grid. ArcGIS: Calculate Density, Kernel Density. QGIS: native:heatmapkerneldensityestimation. id gp_calculate_density
- 34Plan: Kernel density of Property sales (the Start plan's candidate c_18bfb4d14078). 950 points in Property sales: a density surface shows where they concentrate. id f8db5acb-8be1-4e6d-8904-9ee8c04e791a:c_18bfb4d14078
- 35Tool result: gp_calculate_density, step 0. Calculate density: 1 layer saved: Calculate density: Property sales (867 features). id 9ca81de6-468a-4ffe-86a2-5163eb3bafa7:0
- 36Plan: Kernel density of Building permits (the Start plan's candidate c_2c9614b6c24c). 380 points in Building permits: a density surface shows where they concentrate. id f8db5acb-8be1-4e6d-8904-9ee8c04e791a:c_2c9614b6c24c
- 37Tool result: gp_calculate_density, step 1. Calculate density: 1 layer saved: Calculate density: Building permits (1211 features). id 9ca81de6-468a-4ffe-86a2-5163eb3bafa7:1
- 38Catalog: Find point clusters (operation catalog, gp_find_point_clusters). Density-based clusters (DBSCAN, HDBSCAN or OPTICS, optionally space-time) with hulls and noise. ArcGIS: Find Point Clusters, Density-based Clustering. QGIS: native:dbscanclustering, native:stdbscanclustering. id gp_find_point_clusters
- 39Plan: Cluster points of Transit stations (the Start plan's candidate c_5a6f63bcd73b). DBSCAN finds dense groups of Transit stations and separates noise. id f8db5acb-8be1-4e6d-8904-9ee8c04e791a:c_5a6f63bcd73b
- 40Tool result: gp_find_point_clusters, step 0. Find point clusters: 2 layers saved: Find point clusters: Transit stations (12 features); Find point clusters: cluster hulls (1 feature). id f445c7d5-e1f8-40ba-b66a-b6f77ff14617:0
- 41Plan: Cluster points of Property sales (the Start plan's candidate c_4f023019863a). DBSCAN finds dense groups of Property sales and separates noise. id f8db5acb-8be1-4e6d-8904-9ee8c04e791a:c_4f023019863a
- 42Tool result: gp_find_point_clusters, step 1. Find point clusters: 1 layer saved: Find point clusters: Property sales (950 features). id f445c7d5-e1f8-40ba-b66a-b6f77ff14617:1
- 43Plan: Cluster points of Building permits (the Start plan's candidate c_8d2b732415a9). DBSCAN finds dense groups of Building permits and separates noise. id f8db5acb-8be1-4e6d-8904-9ee8c04e791a:c_8d2b732415a9
- 44Tool result: gp_find_point_clusters, step 2. Find point clusters: 2 layers saved: Find point clusters: Building permits (380 features); Find point clusters: cluster hulls (14 features). id f445c7d5-e1f8-40ba-b66a-b6f77ff14617:2
- 45Catalog: Find outliers (operation catalog, gp_outliers). Anselin local Moran’s I: HH, LL clusters and HL, LH outliers. ArcGIS: Find Outliers, Cluster and Outlier Analysis (Anselin Local Moran’s I). id gp_outliers
- 46Plan: Local morans i of Parcels (the Start plan's candidate c_c7bf78360ddf). Local Moran's I maps clusters and outliers of 'built_far'. id f8db5acb-8be1-4e6d-8904-9ee8c04e791a:c_c7bf78360ddf
- 47Tool result: gp_outliers, step 0. Find outliers: 1 layer saved: Find outliers: Parcels (1100 features). id 60b5f86e-cffb-436f-9438-0ad7618a186f:0
- 48Plan: Local morans i of Green spaces (the Start plan's candidate c_f5f393a93740). Local Moran's I maps clusters and outliers of 'area_ha'. id f8db5acb-8be1-4e6d-8904-9ee8c04e791a:c_f5f393a93740
- 49Tool result: gp_outliers, step 1. Find outliers: 1 layer saved: Find outliers: Green spaces (10 features). id 60b5f86e-cffb-436f-9438-0ad7618a186f:1
- 50Layer: Green spaces. 10 features id 448e3c1b-11d3-4dc1-ad29-15c041e2af35
- 51Plan: Local morans i of Zoning districts (the Start plan's candidate c_c8c9fa0162f0). Local Moran's I maps clusters and outliers of 'max_far'. id f8db5acb-8be1-4e6d-8904-9ee8c04e791a:c_c8c9fa0162f0
- 52Tool result: gp_outliers, step 2. Find outliers: 1 layer saved: Find outliers: Zoning districts (10 features). id 60b5f86e-cffb-436f-9438-0ad7618a186f:2
- 53Layer: Zoning districts. 10 features id f84e0e45-37e6-4f41-b7d9-ceb30bbc840a
- 54Rendering: Map: Emerging hot spots: Property sales id be66919c-5ac4-46fc-9303-3b6ae32d215e
- 55Rendering: Map: Emerging hot spots: Building permits id 10e5f0c6-f9d0-4087-bebf-3a342415f755
- 56Rendering: Map: Repeat and near repeat classification: Property sales id 3c1c183a-14b4-4c01-b623-ce0905573f25
- 57Rendering: Map: Summarize within: Parcels id f5aabbb2-9d66-4cde-936d-0fd21fa0e47f
- 58Rendering: Map: Summarize within: Parcels id cf2850e2-e68b-4fe5-9668-bc39c1717ddc
- 59Rendering: Map: Summarize within: Parcels id c7c3fa96-6cbc-43c6-9c0d-fe80010b2209
- 60Rendering: Map: Parcels by built_far id 225b0a21-d925-4a9c-830d-a8ff465d85f3
- 61Rendering: Map: Green spaces by area_ha id d835f68f-d836-45cb-bc1c-330e22a1a5a5
- 62Rendering: Map: Zoning districts by max_far id 5c925f5e-357f-42ad-a25b-84fd46efdb28
- 63Rendering: Map: Hot spot analysis: Property sales id 27148a64-8d81-466d-ba61-2ae85cfd1868
- 64Rendering: Map: Hot spot analysis: Building permits id 5b6f2580-842f-4994-a302-a3bb1b0bf448
- 65Rendering: Map: Calculate density: Property sales id 9c3290f3-cc57-4600-9529-82ee062fb61c
- 66Rendering: Map: Calculate density: Building permits id 91b2edc2-2bf7-4663-bb16-12595287149f
- 67Rendering: Map: Find point clusters: Transit stations id 5608ea02-b2ac-4e51-a075-0e201a1bc4ed
- 68Rendering: Map: Find point clusters: cluster hulls id 9864ff42-febc-4252-a0ba-b1ca69720112
- 69Rendering: Map: Find point clusters: Property sales id 0d51172d-775f-4364-998b-1f2614c6d6c6
- 70Rendering: Map: Find point clusters: Building permits id 450b8dd1-0c4b-4bbf-8e03-6cff33e001f4
- 71Rendering: Map: Find point clusters: cluster hulls id 0eabad24-1821-4dea-a840-3e1ce29b5fcb
- 72Rendering: Map: Find outliers: Parcels id 32f0c9a9-217e-4701-b234-c3234c26ff02
- 73Rendering: Map: Find outliers: Green spaces id bbac1884-3dfd-41d5-99a3-a3dc22b9372a
- 74Rendering: Map: Find outliers: Zoning districts id 1ed7248f-0b15-4174-8c9d-e4fcc7ad2031
- 75Rendering: Chart: Parcels over time (year_built). 12 rows id a56a4586-993b-4959-8f12-cda5bdc8c1bc
- 76Rendering: Chart: Property sales over time (date). 57 rows id d7dcbaa6-e88d-4c73-b1bc-4c18320c9e9e
- 77Rendering: Chart: Building permits over time (decision_month). 180 rows id 803ff097-0db7-4dd0-bf88-08718e9b6106
- 78Rendering: Chart: Land values by zone and year over time (year). 198 rows id a51cb267-2b59-4303-a275-1b299891614b
- 79Rendering: Chart: Emerging hot spots: Property sales. 8 rows id cddb02b3-4f62-47c6-9df5-dead122811ae
- 80Rendering: Chart: Emerging hot spots: Building permits. 8 rows id 9b5c350e-1c14-438a-9d63-489450edc2a3
- 81Rendering: Chart: Repeat and near repeat classification: Property sales. 57 rows id e0196faa-807f-4c10-88ff-a378a575498f
- 82Rendering: Chart: Summarize within: Parcels. 12 rows id 1dbcaea9-a5e4-4882-a88f-ea90a1a7bd7b
- 83Rendering: Chart: Summarize within: Parcels. 12 rows id ed9ee8e2-4579-417f-8013-81e91e4a0afb
- 84Rendering: Chart: Summarize within: Parcels. 12 rows id 73d109a5-5d83-481d-981e-0be9ffa57bd5
- 85Rendering: Chart: Hot spot analysis: Property sales. 12 rows id 517b4c71-81b6-42fe-9408-26c588875b42
- 86Rendering: Chart: Hot spot analysis: Building permits. 13 rows id 7a0cc108-0105-4152-b9f4-1796dc1e0c64
- 87Rendering: Chart: Calculate density: Property sales. 11 rows id 201493fb-714c-40d2-9a76-ddb22527f9a5
- 88Rendering: Chart: Calculate density: Building permits. 12 rows id 741b541a-642f-4d11-af05-b4f10e12c13e
- 89Rendering: Chart: Find point clusters: Transit stations. 1 rows id df5f4fbc-f176-4563-8792-c439140abf7d
- 90Rendering: Chart: Find point clusters: cluster hulls. 1 rows id ec35aed0-af92-4b16-987b-bc0bb9edc445
- 91Rendering: Chart: Find point clusters: Property sales. 1 rows id 420829ca-242a-4203-a03e-1d3c30f92be2
- 92Rendering: Chart: Find point clusters: Building permits. 15 rows id a75725d0-4a42-4c03-b775-4841e49a974a
- 93Rendering: Chart: Find point clusters: cluster hulls. 14 rows id 19c0352e-e8ce-4b43-b68c-e5d9e727c6d8
- 94Rendering: Chart: Find outliers: Parcels. 1100 rows id 22928ec9-70d1-47be-8138-15ef9ace47fc
- 95Rendering: Chart: Find outliers: Green spaces. 10 rows id 986b9bba-697e-48c7-ad92-e4319618143d
- 96Rendering: Chart: Find outliers: Zoning districts. 10 rows id 74b1b0e7-13ca-4b67-abac-f0beab687357
- 97Rendering: Chart: Find point clusters: Building permits over time. 180 rows id f5fafb9d-4abc-4967-900a-fe4195579060
- 98Rendering: Chart: Find point clusters: Property sales over time. 57 rows id 633faacd-1c67-43fc-92f7-c5b129144335
- 99Rendering: Chart: Hot spot analysis: Building permits over time. 180 rows id 63728d45-bd6d-408e-b13d-19cba683b84d
- 100Rendering: Chart: Repeat and near repeat classification: Property sales over time. 57 rows id c2cc74df-5240-4117-b8b3-c351a9f1deb5
- 101Dataset: Zoning districts. vector, 10 rows id e41da161-19b5-48ad-9ac1-ec14aba11071
- 102Dataset: Parcels. vector, 1100 rows id 334e7daf-16c0-41ea-bad4-945a00366679
- 103Dataset: Transit stations. vector, 12 rows id 26d28a13-4955-415e-8c92-76eac9333571
- 104Dataset: Green spaces. vector, 10 rows id 3c7e642e-5612-4d39-9522-1784d7abf668
- 105Dataset: Streets. vector, 151 rows id 4db290a4-42c5-4245-8ecd-06ec0d874f2a
- 106Dataset: City terrain model (DEM). raster, ? rows id b4ace474-faad-4e75-8a4c-267a0401808c
- 107Dataset: Planning committee brief. document, ? rows id b40a0012-69f3-4624-bf05-59a0379f41f9
- 108Record: Sample: Real estate and urban planning, Lisbon id acfed0f6-9df9-4775-9325-30c0bbed70e9
- 109Layer: Emerging hot spots: Property sales. 81 features id dc34ccf4-38d7-4643-8ab2-86b694e35b9c
- 110Layer: Emerging hot spots: Building permits. 90 features id a26af55a-a693-4e98-b7a5-ccf061c4b3dd
- 111Layer: Repeat and near repeat classification: Property sales. 950 features id e13509b5-d34e-404a-8352-c51480e7869b
- 112Layer: Summarize within: Parcels. 1,100 features id d5217ead-227b-4720-8179-db14e5edc246
- 113Layer: Summarize within: Parcels. 1,100 features id 7342e67c-cd62-400b-8ac8-e6893f4004f8
- 114Layer: Summarize within: Parcels. 1,100 features id 1cffb229-6c6c-459d-afd2-b27e02cafa7a
- 115Layer: Hot spot analysis: Property sales. 213 features id e5e5e574-adff-45f1-a500-025bf5057582
- 116Layer: Hot spot analysis: Building permits. 380 features id ce1fd16e-c432-424b-8b6e-95c7442a25ea
- 117Layer: Calculate density: Property sales. 867 features id f054cd23-8647-44c1-ad3f-df8046f553c7
- 118Layer: Calculate density: Building permits. 1,211 features id a54dd906-1fba-477a-b3b4-4b2b57a69d8c
- 119Layer: Find point clusters: Transit stations. 12 features id 712ec0c3-8dd4-4826-b637-a5959f8a8bc2
- 120Layer: Find point clusters: cluster hulls. 1 features id 8f02c57f-8442-4514-8c69-ad2c271b02b5
- 121Layer: Find point clusters: Property sales. 950 features id 060168a0-b1c4-4161-8cf4-2e5e7e616489
- 122Layer: Find point clusters: Building permits. 380 features id 1828d446-6bee-4fc7-8d2a-1e9162eab56b
- 123Layer: Find point clusters: cluster hulls. 14 features id 1280d1a9-f52c-4411-9b1a-bfe208cf113c
- 124Layer: Find outliers: Parcels. 1,100 features id 83bec88a-063d-4158-a3b1-83369d40e2c4
- 125Layer: Find outliers: Green spaces. 10 features id e9005658-d31f-457a-bf22-d38615856ba0
- 126Layer: Find outliers: Zoning districts. 10 features id 940a4302-ccf6-4dc6-ae17-c77fc0e39f96
Appendix: the data behind the chartsShow
Figure 1. Timeline: events per quarter by dataset 1
| period | series | value |
|---|---|---|
| 2018-01-01 | Property sales | 0 |
| 2018-01-01 | Building permits | 0 |
| 2018-01-01 | Planning applications | 0 |
| 2018-01-01 | Land values by zone and year | 10 |
| 2018-04-01 | Property sales | 0 |
| 2018-04-01 | Building permits | 0 |
| 2018-04-01 | Planning applications | 0 |
| 2018-04-01 | Land values by zone and year | 0 |
| 2018-07-01 | Property sales | 0 |
| 2018-07-01 | Building permits | 0 |
| 2018-07-01 | Planning applications | 0 |
| 2018-07-01 | Land values by zone and year | 0 |
| 2018-10-01 | Property sales | 0 |
| 2018-10-01 | Building permits | 0 |
| 2018-10-01 | Planning applications | 0 |
| 2018-10-01 | Land values by zone and year | 0 |
| 2019-01-01 | Property sales | 0 |
| 2019-01-01 | Building permits | 0 |
| 2019-01-01 | Planning applications | 0 |
| 2019-01-01 | Land values by zone and year | 10 |
| 2019-04-01 | Property sales | 0 |
| 2019-04-01 | Building permits | 0 |
| 2019-04-01 | Planning applications | 0 |
| 2019-04-01 | Land values by zone and year | 0 |
| 2019-07-01 | Property sales | 0 |
| 2019-07-01 | Building permits | 0 |
| 2019-07-01 | Planning applications | 0 |
| 2019-07-01 | Land values by zone and year | 0 |
| 2019-10-01 | Property sales | 0 |
| 2019-10-01 | Building permits | 0 |
| 2019-10-01 | Planning applications | 0 |
| 2019-10-01 | Land values by zone and year | 0 |
| 2020-01-01 | Property sales | 0 |
| 2020-01-01 | Building permits | 0 |
| 2020-01-01 | Planning applications | 0 |
| 2020-01-01 | Land values by zone and year | 10 |
| 2020-04-01 | Property sales | 0 |
| 2020-04-01 | Building permits | 0 |
| 2020-04-01 | Planning applications | 0 |
| 2020-04-01 | Land values by zone and year | 0 |
| 2020-07-01 | Property sales | 0 |
| 2020-07-01 | Building permits | 0 |
| 2020-07-01 | Planning applications | 0 |
| 2020-07-01 | Land values by zone and year | 0 |
| 2020-10-01 | Property sales | 0 |
| 2020-10-01 | Building permits | 0 |
| 2020-10-01 | Planning applications | 0 |
| 2020-10-01 | Land values by zone and year | 0 |
| 2021-01-01 | Property sales | 0 |
| 2021-01-01 | Building permits | 0 |
| 2021-01-01 | Planning applications | 0 |
| 2021-01-01 | Land values by zone and year | 10 |
| 2021-04-01 | Property sales | 0 |
| 2021-04-01 | Building permits | 0 |
| 2021-04-01 | Planning applications | 0 |
| 2021-04-01 | Land values by zone and year | 0 |
| 2021-07-01 | Property sales | 0 |
| 2021-07-01 | Building permits | 0 |
| 2021-07-01 | Planning applications | 0 |
| 2021-07-01 | Land values by zone and year | 0 |
| 2021-10-01 | Property sales | 0 |
| 2021-10-01 | Building permits | 0 |
| 2021-10-01 | Planning applications | 0 |
| 2021-10-01 | Land values by zone and year | 0 |
| 2022-01-01 | Property sales | 46 |
| 2022-01-01 | Building permits | 0 |
| 2022-01-01 | Planning applications | 0 |
| 2022-01-01 | Land values by zone and year | 10 |
| 2022-04-01 | Property sales | 46 |
| 2022-04-01 | Building permits | 0 |
| 2022-04-01 | Planning applications | 0 |
| 2022-04-01 | Land values by zone and year | 0 |
| 2022-07-01 | Property sales | 42 |
| 2022-07-01 | Building permits | 0 |
| 2022-07-01 | Planning applications | 0 |
| 2022-07-01 | Land values by zone and year | 0 |
| 2022-10-01 | Property sales | 58 |
| 2022-10-01 | Building permits | 0 |
| 2022-10-01 | Planning applications | 0 |
| 2022-10-01 | Land values by zone and year | 0 |
| 2023-01-01 | Property sales | 40 |
| 2023-01-01 | Building permits | 14 |
| 2023-01-01 | Planning applications | 0 |
| 2023-01-01 | Land values by zone and year | 10 |
| 2023-04-01 | Property sales | 49 |
| 2023-04-01 | Building permits | 24 |
| 2023-04-01 | Planning applications | 0 |
| 2023-04-01 | Land values by zone and year | 0 |
| 2023-07-01 | Property sales | 61 |
| 2023-07-01 | Building permits | 19 |
| 2023-07-01 | Planning applications | 0 |
| 2023-07-01 | Land values by zone and year | 0 |
| 2023-10-01 | Property sales | 48 |
| 2023-10-01 | Building permits | 24 |
| 2023-10-01 | Planning applications | 0 |
| 2023-10-01 | Land values by zone and year | 0 |
| 2024-01-01 | Property sales | 50 |
| 2024-01-01 | Building permits | 12 |
| 2024-01-01 | Planning applications | 0 |
| 2024-01-01 | Land values by zone and year | 10 |
| 2024-04-01 | Property sales | 56 |
| 2024-04-01 | Building permits | 23 |
| 2024-04-01 | Planning applications | 0 |
| 2024-04-01 | Land values by zone and year | 0 |
| 2024-07-01 | Property sales | 46 |
| 2024-07-01 | Building permits | 30 |
| 2024-07-01 | Planning applications | 0 |
| 2024-07-01 | Land values by zone and year | 0 |
| 2024-10-01 | Property sales | 40 |
| 2024-10-01 | Building permits | 29 |
| 2024-10-01 | Planning applications | 0 |
| 2024-10-01 | Land values by zone and year | 0 |
| 2025-01-01 | Property sales | 47 |
| 2025-01-01 | Building permits | 14 |
| 2025-01-01 | Planning applications | 51 |
| 2025-01-01 | Land values by zone and year | 10 |
| 2025-04-01 | Property sales | 60 |
| 2025-04-01 | Building permits | 28 |
| 2025-04-01 | Planning applications | 45 |
| 2025-04-01 | Land values by zone and year | 0 |
| 2025-07-01 | Property sales | 51 |
| 2025-07-01 | Building permits | 31 |
| 2025-07-01 | Planning applications | 28 |
| 2025-07-01 | Land values by zone and year | 0 |
| 2025-10-01 | Property sales | 55 |
| 2025-10-01 | Building permits | 34 |
| 2025-10-01 | Planning applications | 36 |
| 2025-10-01 | Land values by zone and year | 0 |
| 2026-01-01 | Property sales | 55 |
| 2026-01-01 | Building permits | 34 |
| 2026-01-01 | Planning applications | 0 |
| 2026-01-01 | Land values by zone and year | 10 |
| 2026-04-01 | Property sales | 49 |
| 2026-04-01 | Building permits | 28 |
| 2026-04-01 | Planning applications | 0 |
| 2026-04-01 | Land values by zone and year | 0 |
| 2026-07-01 | Property sales | 51 |
| 2026-07-01 | Building permits | 36 |
| 2026-07-01 | Planning applications | 0 |
| 2026-07-01 | Land values by zone and year | 0 |
Figure 23. Parcels over time (year_built) 75
| bin_start | bin_end | count |
|---|---|---|
| 0 | 0.3225 | 82 |
| 0.3225 | 0.645 | 63 |
| 0.645 | 0.9675 | 166 |
| 0.9675 | 1.29 | 200 |
| 1.29 | 1.613 | 194 |
| 1.613 | 1.935 | 103 |
| 1.935 | 2.257 | 92 |
| 2.257 | 2.58 | 71 |
| 2.58 | 2.902 | 62 |
| 2.902 | 3.225 | 45 |
| 3.225 | 3.547 | 18 |
| 3.547 | 3.87 | 4 |
Figure 24. Property sales over time (date) 76
| period | series | value |
|---|---|---|
| 2022-01-01 | apartment | 21 |
| 2022-01-01 | office | 15 |
| 2022-01-01 | house | 10 |
| 2022-04-01 | apartment | 24 |
| 2022-04-01 | office | 10 |
| 2022-04-01 | house | 12 |
| 2022-07-01 | apartment | 19 |
| 2022-07-01 | office | 13 |
| 2022-07-01 | house | 10 |
| 2022-10-01 | apartment | 33 |
| 2022-10-01 | office | 12 |
| 2022-10-01 | house | 13 |
| 2023-01-01 | apartment | 14 |
| 2023-01-01 | office | 14 |
| 2023-01-01 | house | 12 |
| 2023-04-01 | apartment | 26 |
| 2023-04-01 | office | 12 |
| 2023-04-01 | house | 11 |
| 2023-07-01 | apartment | 29 |
| 2023-07-01 | office | 15 |
| 2023-07-01 | house | 17 |
| 2023-10-01 | apartment | 19 |
| 2023-10-01 | office | 19 |
| 2023-10-01 | house | 10 |
| 2024-01-01 | apartment | 22 |
| 2024-01-01 | office | 14 |
| 2024-01-01 | house | 14 |
| 2024-04-01 | apartment | 25 |
| 2024-04-01 | office | 15 |
| 2024-04-01 | house | 16 |
| 2024-07-01 | apartment | 22 |
| 2024-07-01 | office | 12 |
| 2024-07-01 | house | 12 |
| 2024-10-01 | apartment | 15 |
| 2024-10-01 | office | 13 |
| 2024-10-01 | house | 12 |
| 2025-01-01 | apartment | 23 |
| 2025-01-01 | office | 13 |
| 2025-01-01 | house | 11 |
| 2025-04-01 | apartment | 27 |
| 2025-04-01 | office | 18 |
| 2025-04-01 | house | 15 |
| 2025-07-01 | apartment | 21 |
| 2025-07-01 | office | 13 |
| 2025-07-01 | house | 17 |
| 2025-10-01 | apartment | 26 |
| 2025-10-01 | office | 15 |
| 2025-10-01 | house | 14 |
| 2026-01-01 | apartment | 24 |
| 2026-01-01 | office | 21 |
| 2026-01-01 | house | 10 |
| 2026-04-01 | apartment | 20 |
| 2026-04-01 | office | 14 |
| 2026-04-01 | house | 15 |
| 2026-07-01 | apartment | 21 |
| 2026-07-01 | office | 10 |
| 2026-07-01 | house | 20 |
Figure 25. Building permits over time (decision_month) 77
| period | series | value |
|---|---|---|
| 2023-01-01 | extension | 31 |
| 2023-01-01 | new build | 14 |
| 2023-01-01 | change of use | 22 |
| 2023-01-01 | demolition | 0 |
| 2023-02-01 | extension | 54 |
| 2023-02-01 | new build | 28 |
| 2023-02-01 | change of use | 0 |
| 2023-02-01 | demolition | 0 |
| 2023-03-01 | extension | 34 |
| 2023-03-01 | new build | 47 |
| 2023-03-01 | change of use | 28 |
| 2023-03-01 | demolition | 0 |
| 2023-04-01 | extension | 65 |
| 2023-04-01 | new build | 13 |
| 2023-04-01 | change of use | 0 |
| 2023-04-01 | demolition | 41 |
| 2023-05-01 | extension | 82 |
| 2023-05-01 | new build | 53 |
| 2023-05-01 | change of use | 45 |
| 2023-05-01 | demolition | 0 |
| 2023-06-01 | extension | 26 |
| 2023-06-01 | new build | 84 |
| 2023-06-01 | change of use | 3 |
| 2023-06-01 | demolition | 0 |
| 2023-07-01 | extension | 15 |
| 2023-07-01 | new build | 43 |
| 2023-07-01 | change of use | 0 |
| 2023-07-01 | demolition | 8 |
| 2023-08-01 | extension | 32 |
| 2023-08-01 | new build | 102 |
| 2023-08-01 | change of use | 8 |
| 2023-08-01 | demolition | 24 |
| 2023-09-01 | extension | 57 |
| 2023-09-01 | new build | 57 |
| 2023-09-01 | change of use | 0 |
| 2023-09-01 | demolition | 31 |
| 2023-10-01 | extension | 70 |
| 2023-10-01 | new build | 3 |
| 2023-10-01 | change of use | 37 |
| 2023-10-01 | demolition | 17 |
| 2023-11-01 | extension | 42 |
| 2023-11-01 | new build | 39 |
| 2023-11-01 | change of use | 36 |
| 2023-11-01 | demolition | 0 |
| 2023-12-01 | extension | 94 |
| 2023-12-01 | new build | 67 |
| 2023-12-01 | change of use | 65 |
| 2023-12-01 | demolition | 2 |
| 2024-01-01 | extension | 0 |
| 2024-01-01 | new build | 19 |
| 2024-01-01 | change of use | 34 |
| 2024-01-01 | demolition | 30 |
| 2024-02-01 | extension | 99 |
| 2024-02-01 | new build | 21 |
| 2024-02-01 | change of use | 32 |
| 2024-02-01 | demolition | 39 |
| 2024-03-01 | extension | 23 |
| 2024-03-01 | new build | 0 |
| 2024-03-01 | change of use | 0 |
| 2024-03-01 | demolition | 0 |
| 2024-04-01 | extension | 12 |
| 2024-04-01 | new build | 0 |
| 2024-04-01 | change of use | 45 |
| 2024-04-01 | demolition | 0 |
| 2024-05-01 | extension | 105 |
| 2024-05-01 | new build | 110 |
| 2024-05-01 | change of use | 7 |
| 2024-05-01 | demolition | 6 |
| 2024-06-01 | extension | 46 |
| 2024-06-01 | new build | 0 |
| 2024-06-01 | change of use | 58 |
| 2024-06-01 | demolition | 0 |
| 2024-07-01 | extension | 69 |
| 2024-07-01 | new build | 28 |
| 2024-07-01 | change of use | 71 |
| 2024-07-01 | demolition | 32 |
| 2024-08-01 | extension | 0 |
| 2024-08-01 | new build | 81 |
| 2024-08-01 | change of use | 89 |
| 2024-08-01 | demolition | 8 |
| 2024-09-01 | extension | 0 |
| 2024-09-01 | new build | 96 |
| 2024-09-01 | change of use | 98 |
| 2024-09-01 | demolition | 39 |
| 2024-10-01 | extension | 43 |
| 2024-10-01 | new build | 77 |
| 2024-10-01 | change of use | 32 |
| 2024-10-01 | demolition | 56 |
| 2024-11-01 | extension | 175 |
| 2024-11-01 | new build | 176 |
| 2024-11-01 | change of use | 26 |
| 2024-11-01 | demolition | 0 |
| 2024-12-01 | extension | 49 |
| 2024-12-01 | new build | 80 |
| 2024-12-01 | change of use | 15 |
| 2024-12-01 | demolition | 41 |
| 2025-01-01 | extension | 41 |
| 2025-01-01 | new build | 64 |
| 2025-01-01 | change of use | 0 |
| 2025-01-01 | demolition | 0 |
| 2025-02-01 | extension | 24 |
| 2025-02-01 | new build | 28 |
| 2025-02-01 | change of use | 53 |
| 2025-02-01 | demolition | 0 |
| 2025-03-01 | extension | 0 |
| 2025-03-01 | new build | 32 |
| 2025-03-01 | change of use | 28 |
| 2025-03-01 | demolition | 0 |
| 2025-04-01 | extension | 41 |
| 2025-04-01 | new build | 33 |
| 2025-04-01 | change of use | 55 |
| 2025-04-01 | demolition | 0 |
| 2025-05-01 | extension | 67 |
| 2025-05-01 | new build | 76 |
| 2025-05-01 | change of use | 57 |
| 2025-05-01 | demolition | 27 |
| 2025-06-01 | extension | 87 |
| 2025-06-01 | new build | 47 |
| 2025-06-01 | change of use | 73 |
| 2025-06-01 | demolition | 4 |
| 2025-07-01 | extension | 16 |
| 2025-07-01 | new build | 47 |
| 2025-07-01 | change of use | 30 |
| 2025-07-01 | demolition | 0 |
| 2025-08-01 | extension | 62 |
| 2025-08-01 | new build | 69 |
| 2025-08-01 | change of use | 43 |
| 2025-08-01 | demolition | 26 |
| 2025-09-01 | extension | 116 |
| 2025-09-01 | new build | 90 |
| 2025-09-01 | change of use | 63 |
| 2025-09-01 | demolition | 65 |
| 2025-10-01 | extension | 70 |
| 2025-10-01 | new build | 54 |
| 2025-10-01 | change of use | 119 |
| 2025-10-01 | demolition | 18 |
| 2025-11-01 | extension | 55 |
| 2025-11-01 | new build | 64 |
| 2025-11-01 | change of use | 80 |
| 2025-11-01 | demolition | 10 |
| 2025-12-01 | extension | 108 |
| 2025-12-01 | new build | 23 |
| 2025-12-01 | change of use | 23 |
| 2025-12-01 | demolition | 0 |
| 2026-01-01 | extension | 130 |
| 2026-01-01 | new build | 117 |
| 2026-01-01 | change of use | 39 |
| 2026-01-01 | demolition | 0 |
| 2026-02-01 | extension | 108 |
| 2026-02-01 | new build | 22 |
| 2026-02-01 | change of use | 28 |
| 2026-02-01 | demolition | 0 |
| 2026-03-01 | extension | 80 |
| 2026-03-01 | new build | 35 |
| 2026-03-01 | change of use | 85 |
| 2026-03-01 | demolition | 3 |
| 2026-04-01 | extension | 21 |
| 2026-04-01 | new build | 140 |
| 2026-04-01 | change of use | 0 |
| 2026-04-01 | demolition | 32 |
| 2026-05-01 | extension | 55 |
| 2026-05-01 | new build | 65 |
| 2026-05-01 | change of use | 17 |
| 2026-05-01 | demolition | 0 |
| 2026-06-01 | extension | 63 |
| 2026-06-01 | new build | 112 |
| 2026-06-01 | change of use | 93 |
| 2026-06-01 | demolition | 0 |
| 2026-07-01 | extension | 167 |
| 2026-07-01 | new build | 112 |
| 2026-07-01 | change of use | 9 |
| 2026-07-01 | demolition | 14 |
| 2026-08-01 | extension | 66 |
| 2026-08-01 | new build | 65 |
| 2026-08-01 | change of use | 67 |
| 2026-08-01 | demolition | 104 |
| 2026-09-01 | extension | 130 |
| 2026-09-01 | new build | 34 |
| 2026-09-01 | change of use | 66 |
| 2026-09-01 | demolition | 0 |
Figure 26. Land values by zone and year over time (year) 78
| period | series | value |
|---|---|---|
| 2018-01-01 | C06 | 1 |
| 2018-01-01 | I07 | 1 |
| 2018-01-01 | M05 | 1 |
| 2018-01-01 | M08 | 1 |
| 2018-01-01 | M10 | 1 |
| 2018-01-01 | Other | 5 |
| 2018-04-01 | C06 | 0 |
| 2018-04-01 | I07 | 0 |
| 2018-04-01 | M05 | 0 |
| 2018-04-01 | M08 | 0 |
| 2018-04-01 | M10 | 0 |
| 2018-04-01 | Other | 0 |
| 2018-07-01 | C06 | 0 |
| 2018-07-01 | I07 | 0 |
| 2018-07-01 | M05 | 0 |
| 2018-07-01 | M08 | 0 |
| 2018-07-01 | M10 | 0 |
| 2018-07-01 | Other | 0 |
| 2018-10-01 | C06 | 0 |
| 2018-10-01 | I07 | 0 |
| 2018-10-01 | M05 | 0 |
| 2018-10-01 | M08 | 0 |
| 2018-10-01 | M10 | 0 |
| 2018-10-01 | Other | 0 |
| 2019-01-01 | C06 | 1 |
| 2019-01-01 | I07 | 1 |
| 2019-01-01 | M05 | 1 |
| 2019-01-01 | M08 | 1 |
| 2019-01-01 | M10 | 1 |
| 2019-01-01 | Other | 5 |
| 2019-04-01 | C06 | 0 |
| 2019-04-01 | I07 | 0 |
| 2019-04-01 | M05 | 0 |
| 2019-04-01 | M08 | 0 |
| 2019-04-01 | M10 | 0 |
| 2019-04-01 | Other | 0 |
| 2019-07-01 | C06 | 0 |
| 2019-07-01 | I07 | 0 |
| 2019-07-01 | M05 | 0 |
| 2019-07-01 | M08 | 0 |
| 2019-07-01 | M10 | 0 |
| 2019-07-01 | Other | 0 |
| 2019-10-01 | C06 | 0 |
| 2019-10-01 | I07 | 0 |
| 2019-10-01 | M05 | 0 |
| 2019-10-01 | M08 | 0 |
| 2019-10-01 | M10 | 0 |
| 2019-10-01 | Other | 0 |
| 2020-01-01 | C06 | 1 |
| 2020-01-01 | I07 | 1 |
| 2020-01-01 | M05 | 1 |
| 2020-01-01 | M08 | 1 |
| 2020-01-01 | M10 | 1 |
| 2020-01-01 | Other | 5 |
| 2020-04-01 | C06 | 0 |
| 2020-04-01 | I07 | 0 |
| 2020-04-01 | M05 | 0 |
| 2020-04-01 | M08 | 0 |
| 2020-04-01 | M10 | 0 |
| 2020-04-01 | Other | 0 |
| 2020-07-01 | C06 | 0 |
| 2020-07-01 | I07 | 0 |
| 2020-07-01 | M05 | 0 |
| 2020-07-01 | M08 | 0 |
| 2020-07-01 | M10 | 0 |
| 2020-07-01 | Other | 0 |
| 2020-10-01 | C06 | 0 |
| 2020-10-01 | I07 | 0 |
| 2020-10-01 | M05 | 0 |
| 2020-10-01 | M08 | 0 |
| 2020-10-01 | M10 | 0 |
| 2020-10-01 | Other | 0 |
| 2021-01-01 | C06 | 1 |
| 2021-01-01 | I07 | 1 |
| 2021-01-01 | M05 | 1 |
| 2021-01-01 | M08 | 1 |
| 2021-01-01 | M10 | 1 |
| 2021-01-01 | Other | 5 |
| 2021-04-01 | C06 | 0 |
| 2021-04-01 | I07 | 0 |
| 2021-04-01 | M05 | 0 |
| 2021-04-01 | M08 | 0 |
| 2021-04-01 | M10 | 0 |
| 2021-04-01 | Other | 0 |
| 2021-07-01 | C06 | 0 |
| 2021-07-01 | I07 | 0 |
| 2021-07-01 | M05 | 0 |
| 2021-07-01 | M08 | 0 |
| 2021-07-01 | M10 | 0 |
| 2021-07-01 | Other | 0 |
| 2021-10-01 | C06 | 0 |
| 2021-10-01 | I07 | 0 |
| 2021-10-01 | M05 | 0 |
| 2021-10-01 | M08 | 0 |
| 2021-10-01 | M10 | 0 |
| 2021-10-01 | Other | 0 |
| 2022-01-01 | C06 | 1 |
| 2022-01-01 | I07 | 1 |
| 2022-01-01 | M05 | 1 |
| 2022-01-01 | M08 | 1 |
| 2022-01-01 | M10 | 1 |
| 2022-01-01 | Other | 5 |
| 2022-04-01 | C06 | 0 |
| 2022-04-01 | I07 | 0 |
| 2022-04-01 | M05 | 0 |
| 2022-04-01 | M08 | 0 |
| 2022-04-01 | M10 | 0 |
| 2022-04-01 | Other | 0 |
| 2022-07-01 | C06 | 0 |
| 2022-07-01 | I07 | 0 |
| 2022-07-01 | M05 | 0 |
| 2022-07-01 | M08 | 0 |
| 2022-07-01 | M10 | 0 |
| 2022-07-01 | Other | 0 |
| 2022-10-01 | C06 | 0 |
| 2022-10-01 | I07 | 0 |
| 2022-10-01 | M05 | 0 |
| 2022-10-01 | M08 | 0 |
| 2022-10-01 | M10 | 0 |
| 2022-10-01 | Other | 0 |
| 2023-01-01 | C06 | 1 |
| 2023-01-01 | I07 | 1 |
| 2023-01-01 | M05 | 1 |
| 2023-01-01 | M08 | 1 |
| 2023-01-01 | M10 | 1 |
| 2023-01-01 | Other | 5 |
| 2023-04-01 | C06 | 0 |
| 2023-04-01 | I07 | 0 |
| 2023-04-01 | M05 | 0 |
| 2023-04-01 | M08 | 0 |
| 2023-04-01 | M10 | 0 |
| 2023-04-01 | Other | 0 |
| 2023-07-01 | C06 | 0 |
| 2023-07-01 | I07 | 0 |
| 2023-07-01 | M05 | 0 |
| 2023-07-01 | M08 | 0 |
| 2023-07-01 | M10 | 0 |
| 2023-07-01 | Other | 0 |
| 2023-10-01 | C06 | 0 |
| 2023-10-01 | I07 | 0 |
| 2023-10-01 | M05 | 0 |
| 2023-10-01 | M08 | 0 |
| 2023-10-01 | M10 | 0 |
| 2023-10-01 | Other | 0 |
| 2024-01-01 | C06 | 1 |
| 2024-01-01 | I07 | 1 |
| 2024-01-01 | M05 | 1 |
| 2024-01-01 | M08 | 1 |
| 2024-01-01 | M10 | 1 |
| 2024-01-01 | Other | 5 |
| 2024-04-01 | C06 | 0 |
| 2024-04-01 | I07 | 0 |
| 2024-04-01 | M05 | 0 |
| 2024-04-01 | M08 | 0 |
| 2024-04-01 | M10 | 0 |
| 2024-04-01 | Other | 0 |
| 2024-07-01 | C06 | 0 |
| 2024-07-01 | I07 | 0 |
| 2024-07-01 | M05 | 0 |
| 2024-07-01 | M08 | 0 |
| 2024-07-01 | M10 | 0 |
| 2024-07-01 | Other | 0 |
| 2024-10-01 | C06 | 0 |
| 2024-10-01 | I07 | 0 |
| 2024-10-01 | M05 | 0 |
| 2024-10-01 | M08 | 0 |
| 2024-10-01 | M10 | 0 |
| 2024-10-01 | Other | 0 |
| 2025-01-01 | C06 | 1 |
| 2025-01-01 | I07 | 1 |
| 2025-01-01 | M05 | 1 |
| 2025-01-01 | M08 | 1 |
| 2025-01-01 | M10 | 1 |
| 2025-01-01 | Other | 5 |
| 2025-04-01 | C06 | 0 |
| 2025-04-01 | I07 | 0 |
| 2025-04-01 | M05 | 0 |
| 2025-04-01 | M08 | 0 |
| 2025-04-01 | M10 | 0 |
| 2025-04-01 | Other | 0 |
| 2025-07-01 | C06 | 0 |
| 2025-07-01 | I07 | 0 |
| 2025-07-01 | M05 | 0 |
| 2025-07-01 | M08 | 0 |
| 2025-07-01 | M10 | 0 |
| 2025-07-01 | Other | 0 |
| 2025-10-01 | C06 | 0 |
| 2025-10-01 | I07 | 0 |
| 2025-10-01 | M05 | 0 |
| 2025-10-01 | M08 | 0 |
| 2025-10-01 | M10 | 0 |
| 2025-10-01 | Other | 0 |
| 2026-01-01 | C06 | 1 |
| 2026-01-01 | I07 | 1 |
| 2026-01-01 | M05 | 1 |
| 2026-01-01 | M08 | 1 |
| 2026-01-01 | M10 | 1 |
| 2026-01-01 | Other | 5 |
Figure 27. Emerging hot spots: Property sales 79
| bin_start | bin_end | count |
|---|---|---|
| -0.963 | -0.1466 | 23 |
| -0.1466 | 0.6697 | 17 |
| 0.6697 | 1.486 | 14 |
| 1.486 | 2.303 | 13 |
| 2.303 | 3.119 | 4 |
| 3.119 | 3.935 | 6 |
| 3.935 | 4.752 | 3 |
| 4.752 | 5.568 | 1 |
Figure 28. Emerging hot spots: Building permits 80
| bin_start | bin_end | count |
|---|---|---|
| -0.609 | 0.08612 | 42 |
| 0.08612 | 0.7812 | 21 |
| 0.7812 | 1.476 | 9 |
| 1.476 | 2.171 | 9 |
| 2.171 | 2.867 | 5 |
| 2.867 | 3.562 | 3 |
| 3.562 | 4.257 | 0 |
| 4.257 | 4.952 | 1 |
Figure 29. Repeat and near repeat classification: Property sales 81
| period | series | value |
|---|---|---|
| 2022-01-01 | apartment | 21 |
| 2022-01-01 | office | 15 |
| 2022-01-01 | house | 10 |
| 2022-04-01 | apartment | 24 |
| 2022-04-01 | office | 10 |
| 2022-04-01 | house | 12 |
| 2022-07-01 | apartment | 19 |
| 2022-07-01 | office | 13 |
| 2022-07-01 | house | 10 |
| 2022-10-01 | apartment | 33 |
| 2022-10-01 | office | 12 |
| 2022-10-01 | house | 13 |
| 2023-01-01 | apartment | 14 |
| 2023-01-01 | office | 14 |
| 2023-01-01 | house | 12 |
| 2023-04-01 | apartment | 26 |
| 2023-04-01 | office | 12 |
| 2023-04-01 | house | 11 |
| 2023-07-01 | apartment | 29 |
| 2023-07-01 | office | 15 |
| 2023-07-01 | house | 17 |
| 2023-10-01 | apartment | 19 |
| 2023-10-01 | office | 19 |
| 2023-10-01 | house | 10 |
| 2024-01-01 | apartment | 22 |
| 2024-01-01 | office | 14 |
| 2024-01-01 | house | 14 |
| 2024-04-01 | apartment | 25 |
| 2024-04-01 | office | 15 |
| 2024-04-01 | house | 16 |
| 2024-07-01 | apartment | 22 |
| 2024-07-01 | office | 12 |
| 2024-07-01 | house | 12 |
| 2024-10-01 | apartment | 15 |
| 2024-10-01 | office | 13 |
| 2024-10-01 | house | 12 |
| 2025-01-01 | apartment | 23 |
| 2025-01-01 | office | 13 |
| 2025-01-01 | house | 11 |
| 2025-04-01 | apartment | 27 |
| 2025-04-01 | office | 18 |
| 2025-04-01 | house | 15 |
| 2025-07-01 | apartment | 21 |
| 2025-07-01 | office | 13 |
| 2025-07-01 | house | 17 |
| 2025-10-01 | apartment | 26 |
| 2025-10-01 | office | 15 |
| 2025-10-01 | house | 14 |
| 2026-01-01 | apartment | 24 |
| 2026-01-01 | office | 21 |
| 2026-01-01 | house | 10 |
| 2026-04-01 | apartment | 20 |
| 2026-04-01 | office | 14 |
| 2026-04-01 | house | 15 |
| 2026-07-01 | apartment | 21 |
| 2026-07-01 | office | 10 |
| 2026-07-01 | house | 20 |
Figure 30. Summarize within: Parcels 82
| bin_start | bin_end | count |
|---|---|---|
| 752 | 1,843 | 112 |
| 1,843 | 2,934 | 213 |
| 2,934 | 4,024 | 188 |
| 4,024 | 5,115 | 183 |
| 5,115 | 6,206 | 125 |
| 6,206 | 7,296 | 99 |
| 7,296 | 8,387 | 76 |
| 8,387 | 9,478 | 50 |
| 9,478 | 1.057e+04 | 32 |
| 1.057e+04 | 1.166e+04 | 12 |
| 1.166e+04 | 1.275e+04 | 7 |
| 1.275e+04 | 1.384e+04 | 3 |
Figure 31. Summarize within: Parcels 83
| bin_start | bin_end | count |
|---|---|---|
| 752 | 1,843 | 112 |
| 1,843 | 2,934 | 213 |
| 2,934 | 4,024 | 188 |
| 4,024 | 5,115 | 183 |
| 5,115 | 6,206 | 125 |
| 6,206 | 7,296 | 99 |
| 7,296 | 8,387 | 76 |
| 8,387 | 9,478 | 50 |
| 9,478 | 1.057e+04 | 32 |
| 1.057e+04 | 1.166e+04 | 12 |
| 1.166e+04 | 1.275e+04 | 7 |
| 1.275e+04 | 1.384e+04 | 3 |
Figure 32. Summarize within: Parcels 84
| bin_start | bin_end | count |
|---|---|---|
| 752 | 1,843 | 112 |
| 1,843 | 2,934 | 213 |
| 2,934 | 4,024 | 188 |
| 4,024 | 5,115 | 183 |
| 5,115 | 6,206 | 125 |
| 6,206 | 7,296 | 99 |
| 7,296 | 8,387 | 76 |
| 8,387 | 9,478 | 50 |
| 9,478 | 1.057e+04 | 32 |
| 1.057e+04 | 1.166e+04 | 12 |
| 1.166e+04 | 1.275e+04 | 7 |
| 1.275e+04 | 1.384e+04 | 3 |
Figure 33. Hot spot analysis: Property sales 85
| bin_start | bin_end | band | band_label | count |
|---|---|---|---|---|
| -2 | -1.5 | not_significant | Not significant | 25 |
| -1.5 | -1 | not_significant | Not significant | 8 |
| -1 | -0.5 | not_significant | Not significant | 21 |
| -0.5 | 0 | not_significant | Not significant | 63 |
| 0 | 0.5 | not_significant | Not significant | 27 |
| 0.5 | 1 | not_significant | Not significant | 37 |
| 1 | 1.5 | not_significant | Not significant | 12 |
| 1.5 | 2 | hot_90 | Hot spot, 90% confidence | 2 |
| 1.5 | 2 | not_significant | Not significant | 12 |
| 2 | 2.5 | hot_95 | Hot spot, 95% confidence | 2 |
| 2.5 | 3 | hot_95 | Hot spot, 95% confidence | 2 |
| 3.5 | 4 | hot_99 | Hot spot, 99% confidence | 2 |
Figure 34. Hot spot analysis: Building permits 86
| bin_start | bin_end | band | band_label | count |
|---|---|---|---|---|
| -2.5 | -2 | cold_95 | Cold spot, 95% confidence | 1 |
| -2 | -1.5 | cold_90 | Cold spot, 90% confidence | 11 |
| -2 | -1.5 | not_significant | Not significant | 7 |
| -1.5 | -1 | not_significant | Not significant | 29 |
| -1 | -0.5 | not_significant | Not significant | 81 |
| -0.5 | 0 | not_significant | Not significant | 72 |
| 0 | 0.5 | not_significant | Not significant | 93 |
| 0.5 | 1 | not_significant | Not significant | 38 |
| 1 | 1.5 | not_significant | Not significant | 25 |
| 1.5 | 2 | hot_90 | Hot spot, 90% confidence | 9 |
| 1.5 | 2 | not_significant | Not significant | 4 |
| 2 | 2.5 | hot_95 | Hot spot, 95% confidence | 9 |
| 2.5 | 3 | hot_99 | Hot spot, 99% confidence | 1 |
Figure 35. Calculate density: Property sales 87
| bin_start | bin_end | count |
|---|---|---|
| 0 | 2.182 | 89 |
| 2.182 | 4.364 | 81 |
| 4.364 | 6.545 | 81 |
| 6.545 | 8.727 | 82 |
| 8.727 | 10.91 | 80 |
| 10.91 | 13.09 | 122 |
| 13.09 | 15.27 | 81 |
| 15.27 | 17.45 | 82 |
| 17.45 | 19.64 | 76 |
| 19.64 | 21.82 | 57 |
| 21.82 | 24 | 36 |
Figure 36. Calculate density: Building permits 88
| bin_start | bin_end | count |
|---|---|---|
| 0 | 2.5 | 68 |
| 2.5 | 5 | 87 |
| 5 | 7.5 | 139 |
| 7.5 | 10 | 94 |
| 10 | 12.5 | 135 |
| 12.5 | 15 | 92 |
| 15 | 17.5 | 139 |
| 17.5 | 20 | 94 |
| 20 | 22.5 | 138 |
| 22.5 | 25 | 89 |
| 25 | 27.5 | 102 |
| 27.5 | 30 | 34 |
Figure 37. Find point clusters: Transit stations 89
| cluster | features | fraction | share |
|---|---|---|---|
| 0 | 12 | 1 | 100.0% |
Figure 38. Find point clusters: cluster hulls 90
| cluster | features | fraction | share |
|---|---|---|---|
| 0 | 1 | 1 | 100.0% |
Figure 39. Find point clusters: Property sales 91
| cluster | features | fraction | share |
|---|---|---|---|
| Noise | 950 | 1 | 100.0% |
Figure 40. Find point clusters: Building permits 92
| cluster | features | fraction | share |
|---|---|---|---|
| Noise | 126 | 0.3316 | 33.2% |
| 5 | 37 | 0.09737 | 9.7% |
| 6 | 33 | 0.08684 | 8.7% |
| 0 | 29 | 0.07632 | 7.6% |
| 10 | 20 | 0.05263 | 5.3% |
| 4 | 19 | 0.05 | 5.0% |
| 2 | 18 | 0.04737 | 4.7% |
| 8 | 17 | 0.04474 | 4.5% |
| 1 | 16 | 0.0421 | 4.2% |
| 9 | 15 | 0.03947 | 3.9% |
| 3 | 13 | 0.03421 | 3.4% |
| 11 | 10 | 0.02632 | 2.6% |
| 12 | 10 | 0.02632 | 2.6% |
| 13 | 10 | 0.02632 | 2.6% |
| 7 | 7 | 0.01842 | 1.8% |
Figure 41. Find point clusters: cluster hulls 93
| cluster | features | fraction | share |
|---|---|---|---|
| 0 | 1 | 0.07143 | 7.1% |
| 1 | 1 | 0.07143 | 7.1% |
| 10 | 1 | 0.07143 | 7.1% |
| 11 | 1 | 0.07143 | 7.1% |
| 12 | 1 | 0.07143 | 7.1% |
| 13 | 1 | 0.07143 | 7.1% |
| 2 | 1 | 0.07143 | 7.1% |
| 3 | 1 | 0.07143 | 7.1% |
| 4 | 1 | 0.07143 | 7.1% |
| 5 | 1 | 0.07143 | 7.1% |
| 6 | 1 | 0.07143 | 7.1% |
| 7 | 1 | 0.07143 | 7.1% |
| 8 | 1 | 0.07143 | 7.1% |
| 9 | 1 | 0.07143 | 7.1% |
Figure 42. Find outliers: Parcels 94
| value | lag | type |
|---|---|---|
| -1.428 | -0.8778 | NS |
| -0.8984 | -0.9939 | NS |
| -0.615 | -1.065 | NS |
| -1.12 | -0.8688 | NS |
| -0.2331 | -0.615 | NS |
| -0.615 | -0.2331 | NS |
| -1.133 | -0.6335 | NS |
| -0.7752 | -0.9292 | NS |
| -0.4918 | -0.9764 | NS |
| -0.27 | -0.8203 | NS |
| -1.527 | -0.4015 | NS |
| -0.2208 | -0.4548 | NS |
| -0.923 | -0.1037 | NS |
| 0.0133 | -0.5719 | NS |
| -0.7998 | -0.7259 | NS |
| -0.5288 | -0.8614 | NS |
| -0.923 | -0.6643 | NS |
| -1.675 | -1.12 | NS |
| -0.5657 | -1.675 | NS |
| -1.675 | -1.03 | NS |
| -0.3316 | -1.157 | NS |
| -1.317 | -0.6314 | NS |
| -0.9969 | -0.7382 | NS |
| -0.5657 | -1.371 | NS |
| -0.3809 | -1.034 | NS |
| -1.034 | -0.6889 | NS |
| -1.219 | -0.96 | NS |
| -0.96 | -1.219 | NS |
| -0.8121 | -1.004 | NS |
| -0.5904 | -1.003 | NS |
| -1.798 | -0.5616 | NS |
| -0.2824 | -1.018 | NS |
| 0.0996 | -0.3316 | NS |
| -0.0852 | -0.2392 | NS |
| -0.578 | -0.2413 | NS |
| -0.7259 | -1.083 | NS |
| -1.391 | -0.7259 | NS |
| -0.4425 | -0.9846 | NS |
| -1.675 | -0.4918 | NS |
| -0.4672 | -0.8943 | NS |
| -0.5657 | -1.071 | NS |
| -0.8737 | -1.268 | NS |
| -1.675 | -0.7957 | NS |
| -0.8614 | -1.067 | NS |
| -0.652 | -1.05 | NS |
| 1.381 | 0.6417 | NS |
| 0.5554 | 1.054 | NS |
| 0.7279 | 0.884 | NS |
| 1.036 | 1.412 | NS |
| 0.7156 | 1.165 | NS |
| 2.108 | 0.847 | NS |
| 0.7895 | 1.229 | NS |
| 0.4938 | 0.2105 | NS |
| -0.2577 | 0.6868 | NS |
| 0.6786 | 0.3747 | NS |
| 0.9374 | 0.3829 | NS |
| 0.3829 | 0.9497 | NS |
| -1.28 | -0.0206 | NS |
| -0.578 | -0.1961 | NS |
| 0.3706 | -0.4333 | NS |
| 0.6293 | 0.001 | NS |
| -0.5041 | -0.4179 | NS |
| -0.7136 | -0.7197 | NS |
| -0.9353 | -0.7875 | NS |
| -1.022 | -0.9271 | NS |
| -0.9723 | -0.9415 | NS |
| -0.96 | -0.9446 | NS |
| -0.8491 | -0.8214 | NS |
| -1.157 | -1.133 | NS |
| -1.305 | -1.083 | NS |
| -0.9477 | -1.114 | NS |
| -1.145 | -1.065 | NS |
| -0.8491 | -0.9641 | NS |
| -0.7752 | -0.6458 | NS |
| -0.4425 | -1.005 | NS |
| -1.798 | -0.6479 | NS |
| -0.3563 | -1.41 | NS |
| -1.022 | -1.018 | NS |
| -0.9969 | -0.8429 | NS |
| -0.652 | -1.009 | NS |
| -1.022 | -0.7752 | NS |
| -0.8614 | -0.1715 | NS |
| -0.1715 | -1.015 | NS |
| -0.6643 | -0.652 | NS |
| -1.022 | -0.6643 | NS |
| -0.7382 | -0.5626 | NS |
| -0.5534 | -0.716 | NS |
| -0.578 | -0.7423 | NS |
| -0.5411 | -0.6427 | NS |
| -0.7013 | -0.5411 | NS |
| -1.108 | -0.7937 | NS |
| -0.8861 | -0.9045 | NS |
| -0.7013 | -0.9969 | NS |
| -0.615 | -0.1407 | NS |
| 0.3706 | -0.3994 | NS |
| -0.1838 | 0.3706 | NS |
| -0.4672 | -0.2639 | NS |
| 0.038 | -0.5575 | NS |
| -0.5657 | -0.3563 | NS |
| -0.6397 | -0.2639 | NS |
| 0.7279 | 1.122 | NS |
| 1.122 | 0.7279 | NS |
| 1.085 | -0.7998 | NS |
| -1.798 | 0.7238 | NS |
| 0.1981 | 0.0585 | NS |
| 0.8881 | -0.4015 | NS |
| 0.1242 | 0.9312 | NS |
| 0.5924 | 0.654 | NS |
| 1.27 | 0.4281 | NS |
| 0.962 | 0.5801 | NS |
| 0.8018 | 0.6601 | NS |
| 0.3583 | 0.8819 | NS |
| 0.8634 | 0.8203 | NS |
| 0.8511 | 1.116 | NS |
| 0.8881 | 0.3337 | NS |
| 0.5801 | 0.8881 | NS |
| 0.962 | 0.8922 | NS |
| 1.097 | 0.9045 | NS |
| 1.196 | 0.8716 | NS |
| 0.5554 | 0.9086 | NS |
| 1.997 | 1.362 | NS |
| 2.095 | 0.0996 | NS |
| -1.798 | 1.073 | NS |
| -1.145 | -0.9969 | NS |
| -0.9969 | -1.145 | NS |
| -0.3316 | -0.7813 | NS |
| -0.7136 | -0.4672 | NS |
| -0.8491 | -0.6971 | NS |
| 0.001 | -0.5842 | NS |
| -1.391 | -1.058 | NS |
| -1.675 | -0.7136 | NS |
| -0.8984 | -1.04 | NS |
| -1.058 | -0.8984 | NS |
| -0.8984 | -1.071 | NS |
| -0.8121 | -1.075 | NS |
| -1.379 | -0.8861 | NS |
| -0.9477 | -1.079 | NS |
| -1.169 | -0.9846 | NS |
| -1.798 | -0.578 | NS |
| -1.798 | -0.7629 | NS |
| -0.7629 | -1.798 | NS |
| -0.6889 | -0.9477 | NS |
| -1.034 | -0.8787 | NS |
| -0.8984 | -0.9939 | NS |
| -1.675 | -0.5565 | NS |
| -1.342 | -0.2947 | NS |
| -0.1838 | -0.8409 | NS |
| -0.4056 | -1.025 | NS |
| -0.7752 | -0.229 | NS |
| -0.0976 | -0.6397 | NS |
| -0.5041 | -0.3193 | NS |
| -0.5411 | -1.151 | NS |
| -1.798 | -0.2392 | NS |
| -0.8614 | -0.1653 | NS |
| 0.4199 | -0.5329 | NS |
| -0.7505 | -0.1427 | NS |
| 0.0133 | -0.4015 | NS |
| -0.3563 | -0.0976 | NS |
| -0.0976 | -0.153 | NS |
| -0.2331 | -0.5103 | NS |
| -0.8861 | -0.27 | NS |
| -0.1345 | -0.2454 | NS |
| -0.2577 | -0.0483 | NS |
| 0.038 | -0.7834 | NS |
| -0.2947 | -0.1386 | NS |
| -0.3193 | -0.2146 | NS |
| -0.1345 | -0.2824 | NS |
| -0.2331 | -0.424 | NS |
| -0.7136 | -0.2331 | NS |
| -0.2084 | 0.1797 | NS |
| -0.1715 | 0.1612 | NS |
| 0.5308 | -0.076 | NS |
| -0.5657 | 0.5862 | NS |
| 0.6417 | 0.0215 | NS |
| -1.798 | -1.798 | NS |
| -1.798 | 0.079 | NS |
| 1.196 | -0.4795 | NS |
| 0.8388 | 0.1735 | NS |
| 0.3953 | 1.19 | NS |
| 1.849 | 0.8059 | NS |
| 1.356 | 0.9702 | NS |
| 0.6663 | 1.162 | NS |
| 0.5677 | 1.192 | NS |
| 1.714 | 0.5677 | NS |
| 1.097 | 0.7033 | NS |
| 0.7033 | 0.7217 | NS |
| 1.369 | 0.4445 | NS |
| 0.038 | 0.8758 | NS |
| 0.3829 | 0.038 | NS |
| 1.763 | 0.8634 | NS |
| 0.8511 | 1.167 | NS |
| 0.962 | 1.13 | NS |
| 0.7772 | 1.192 | NS |
| 0.4322 | 0.9928 | NS |
| 1.43 | 0.7977 | NS |
| 0.0503 | -0.2084 | NS |
| 0.1489 | 0.2885 | NS |
| 0.3829 | 0.2269 | NS |
| 0.4322 | -0.2762 | NS |
| -0.2454 | -0.3132 | NS |
| -1.058 | 0.0934 | NS |
| -0.6027 | -0.4343 | NS |
| 0.5677 | -0.8799 | NS |
| -1.157 | -0.3316 | NS |
| -0.3193 | -0.4713 | NS |
| -0.6397 | -0.6643 | NS |
| -0.7752 | -0.6191 | NS |
| -0.8984 | -0.7074 | NS |
| -0.036 | -1.601 | NS |
| -1.527 | -0.9169 | NS |
| -1.798 | -1.071 | NS |
| -0.307 | -1.675 | NS |
| -1.675 | -0.2885 | NS |
| -1.046 | -0.8861 | NS |
| -0.8245 | -0.3932 | NS |
| -0.8861 | -0.3727 | NS |
| 0.7526 | -1.071 | NS |
| 0.0133 | -1.077 | NS |
| -0.3563 | 0.0133 | NS |
| -1.317 | 0.309 | NS |
| 0.309 | -1.317 | NS |
| 0.3953 | -1.582 | NS |
| -1.49 | -0.424 | NS |
| -1.243 | -1.354 | NS |
| -1.798 | -0.5842 | NS |
| -0.7629 | -1.262 | NS |
| -0.7259 | -0.7629 | NS |
| -0.3563 | -0.6643 | NS |
| -1.403 | -0.3152 | NS |
| -0.4425 | -0.6355 | NS |
| -0.1468 | -0.7341 | NS |
| 0.0626 | -0.7136 | NS |
| -0.1222 | -0.652 | NS |
| -0.2208 | -0.6735 | NS |
| -1.798 | -0.3932 | NS |
| -0.1961 | -0.0791 | NS |
| -0.4548 | 0.0503 | NS |
| 0.2967 | -0.5863 | NS |
| -0.2331 | -0.0852 | NS |
| -0.0852 | -0.2331 | NS |
| -0.8737 | -0.1438 | NS |
| -0.923 | -0.1797 | NS |
| 0.7649 | -0.6427 | NS |
| -0.4302 | -0.344 | NS |
| 0.0503 | -0.1037 | NS |
| -0.1099 | -0.4302 | NS |
| -0.9107 | -0.2885 | NS |
| -0.307 | -0.4179 | NS |
| 0.0503 | -0.2516 | NS |
| -0.1961 | -0.8737 | NS |
| -1.798 | 0.0215 | NS |
| 0.0133 | -0.5945 | NS |
| 0.0133 | -0.5945 | NS |
| 0.001 | 0.0133 | NS |
| 0.2228 | -0.8121 | NS |
| -0.8121 | 0.0873 | NS |
| -0.0483 | -0.8121 | NS |
| -0.3316 | -0.5164 | NS |
| -0.5164 | -0.4918 | NS |
| 0.1242 | -0.153 | NS |
| 0.001 | -0.4056 | NS |
| -0.307 | -0.3029 | NS |
| 0.0996 | 0.2782 | NS |
| -0.0852 | -0.2146 | NS |
| -0.27 | -0.1838 | NS |
| -0.1838 | -0.27 | NS |
| 1.122 | 1.042 | NS |
| 1.245 | 1.171 | NS |
| 1.221 | 1.332 | NS |
| 1.048 | 0.6725 | NS |
| 0.6786 | 0.8634 | NS |
| 0.6786 | 0.2474 | NS |
| 0.3583 | -0.2577 | NS |
| -0.2577 | 0.3829 | NS |
| 0.346 | 0.6663 | NS |
| 0.6293 | 0.9497 | NS |
| 1.553 | 0.6293 | NS |
| 0.038 | 0.5924 | NS |
| 0.8018 | 0.6088 | NS |
| 0.5924 | 1.073 | NS |
| 1.073 | 0.5924 | NS |
| 1.295 | 1.024 | NS |
| 0.6663 | 1.233 | NS |
| 0.9743 | 0.9805 | NS |
| 0.4815 | 0.8758 | NS |
| 1.578 | 0.5739 | NS |
| 0.6663 | 0.8634 | NS |
| 0.9866 | 0.962 | NS |
| 1.467 | 0.6951 | NS |
| 0.4569 | 1.032 | NS |
| 0.6417 | 0.962 | NS |
| -0.96 | -0.9785 | NS |
| -0.7998 | -0.96 | NS |
| -1.798 | -0.1468 | NS |
| -0.1468 | -1.798 | NS |
| -0.615 | -1.51 | NS |
| -1.058 | -1.145 | NS |
| -1.675 | -0.9189 | NS |
| -0.27 | -0.6602 | NS |
| -0.344 | -0.116 | NS |
| 0.038 | -0.4548 | NS |
| -1.502 | -0.5534 | NS |
| -0.7382 | -1.471 | NS |
| -1.675 | -0.8676 | NS |
| -0.2331 | -1.206 | NS |
| -0.7382 | -0.7505 | NS |
| -0.8861 | -0.9353 | NS |
| -1.133 | -0.8121 | NS |
| -1.219 | -1.163 | NS |
| -1.083 | -1.219 | NS |
| -0.7629 | -0.6807 | NS |
| 0.0873 | -0.7752 | NS |
| -1.403 | -0.5863 | NS |
| -0.4795 | -0.96 | NS |
| -0.5164 | -0.9723 | NS |
| -0.8368 | -1.163 | NS |
| -1.034 | -0.9538 | NS |
| -1.601 | -0.9107 | NS |
| -0.8614 | -1.428 | NS |
| -1.798 | -0.8368 | NS |
| -0.8368 | -1.798 | NS |
| -1.108 | -0.0606 | NS |
| -0.4179 | -0.9785 | NS |
| -0.5041 | 0.1119 | NS |
| 0.1119 | -0.5041 | NS |
| -0.344 | -0.0575 | NS |
| -0.652 | 0.2803 | NS |
| 0.0873 | 0.0339 | NS |
| 1.097 | -0.2824 | NS |
| -0.4672 | -0.3481 | NS |
| -0.0852 | -0.2577 | NS |
| -0.0483 | -0.0647 | NS |
| -1.798 | -0.4672 | NS |
| -0.7382 | -0.8245 | NS |
| -0.1222 | 0.0256 | NS |
| 0.0256 | -0.96 | NS |
| 0.1612 | -0.5288 | NS |
| -0.5288 | -0.1407 | NS |
| -0.2331 | -0.385 | NS |
| -0.9107 | -0.1622 | NS |
| 0.2721 | -0.4384 | NS |
| -0.1715 | -0.2618 | NS |
| -1.034 | -0.0976 | NS |
| 0.0133 | -1.034 | NS |
| -0.5288 | -0.9415 | NS |
| -1.798 | -0.5288 | NS |
| -0.0236 | -0.9969 | NS |
| -0.9969 | 0.1981 | NS |
| 0.4199 | -0.8429 | NS |
| 1.418 | 1.171 | NS |
| 0.6663 | 1.523 | NS |
| 1.627 | 1.11 | NS |
| -0.1838 | 0.9004 | NS |
| 1.319 | 0.2597 | NS |
| 0.7033 | 0.5677 | NS |
| 0.4076 | 0.2228 | NS |
| 0.7033 | 0.5102 | NS |
| 0.2228 | 0.4528 | NS |
| 0.2474 | 0.6232 | NS |
| 1.024 | 0.6786 | NS |
| 0.6786 | 0.9558 | NS |
| 1.11 | 0.8727 | NS |
| 0.9866 | 0.7772 | NS |
| 1.024 | 0.654 | NS |
| 0.654 | 1.042 | NS |
| 0.999 | 0.7526 | NS |
| 0.7526 | 1.122 | NS |
| 0.5308 | 0.9558 | NS |
| 1.245 | 0.6417 | NS |
| 0.5185 | 0.4322 | NS |
| 0.4322 | -0.6397 | NS |
| -0.0236 | -0.0113 | NS |
| -0.0113 | 0.0318 | NS |
| -0.9723 | -0.1345 | NS |
| 0.309 | -0.7752 | NS |
| -0.578 | -0.5 | NS |
| -1.083 | -1.256 | NS |
| -0.8368 | -0.9436 | NS |
| -1.169 | -0.8368 | NS |
| -0.7505 | -0.7197 | NS |
| -1.477 | -0.6397 | NS |
| -1.44 | -0.4487 | NS |
| -0.1592 | -1.379 | NS |
| -1.317 | -0.1653 | NS |
| -0.8245 | -0.9477 | NS |
| -0.9477 | -0.7813 | NS |
| -0.652 | -0.4302 | NS |
| -0.4302 | -0.8553 | NS |
| -1.798 | -1.133 | NS |
| -1.133 | -1.379 | NS |
| -0.7875 | -0.8902 | NS |
| -0.96 | -1.025 | NS |
| -1.798 | -0.7095 | NS |
| -0.96 | -1.477 | NS |
| -1.477 | -1.028 | NS |
| -1.095 | -1.477 | NS |
| -1.65 | -0.9538 | NS |
| -1.046 | -1.65 | NS |
| -0.2947 | -0.96 | NS |
| -0.96 | -0.2947 | NS |
| -0.8491 | -0.2824 | NS |
| -0.1468 | -0.5041 | NS |
| -1.798 | -0.1838 | NS |
| 0.1365 | -1.252 | NS |
| -0.5041 | -0.7875 | NS |
| -1.453 | -0.1345 | NS |
| 0.5431 | -0.7998 | NS |
| -0.7998 | -0.0236 | NS |
| 0.3583 | -0.4425 | NS |
| -0.8368 | -0.7197 | NS |
| -1.798 | -0.8429 | NS |
| 0.1489 | -0.3255 | NS |
| 0.0873 | 0.1612 | NS |
| -1.798 | 0.1858 | NS |
| 0.346 | -1.798 | NS |
| -0.4425 | -1.173 | NS |
| -1.194 | -1.12 | NS |
| -1.798 | -0.6355 | NS |
| -0.1468 | -0.5472 | NS |
| -0.923 | -0.036 | NS |
| -1.798 | -0.1386 | NS |
| -0.307 | -0.6355 | NS |
| 0.1119 | -0.7752 | NS |
| -0.2208 | -0.6643 | NS |
| 0.0133 | -0.1345 | NS |
| 0.4692 | -0.1222 | NS |
| -0.7382 | 0.2803 | NS |
| -0.6889 | -0.1879 | NS |
| -0.1838 | -0.7444 | NS |
| -0.7998 | -0.3152 | NS |
| 1.245 | 0.962 | NS |
| 1.393 | 0.6909 | NS |
| 0.1489 | 1.11 | NS |
| 0.6786 | 0.9774 | NS |
| 0.7649 | 1.005 | NS |
| 0.8511 | 1.011 | NS |
| 1.159 | 0.9086 | NS |
| 1.11 | 0.2936 | NS |
| 0.9004 | 0.8326 | NS |
| 0.962 | 0.0708 | NS |
| -1.798 | 0.9784 | NS |
| 1.147 | -0.3686 | NS |
| -0.3686 | 1.085 | NS |
| 0.4445 | 0.8142 | NS |
| 0.6417 | 0.3152 | NS |
| 0.1858 | 0.5862 | NS |
| 1.061 | 0.7279 | NS |
| 0.8018 | 1.061 | NS |
| 1.553 | -0.1222 | NS |
| -0.1222 | 1.171 | NS |
| 0.7895 | 0.6725 | NS |
| 1.147 | 1.073 | NS |
| 1.073 | 0.8018 | NS |
| 0.9743 | 0.6786 | NS |
| -1.798 | 0.6376 | NS |
| 0.5554 | -0.4364 | NS |
| 0.925 | -0.3111 | NS |
| 0.0873 | 0.1181 | NS |
| 0.2474 | 0.0873 | NS |
| -1.145 | -0.4179 | NS |
| -0.4179 | -0.7813 | NS |
| -0.4179 | -0.8614 | NS |
| -0.8121 | -0.5103 | NS |
| -0.5534 | -0.6397 | NS |
| -0.4672 | -0.6314 | NS |
| -0.5288 | -0.6355 | NS |
| 0.038 | -0.4856 | NS |
| -0.1715 | -0.6828 | NS |
| -0.5041 | -0.3604 | NS |
| -0.6273 | -0.3193 | NS |
| -0.2824 | -0.4343 | NS |
| -0.7382 | -1.052 | NS |
| -1.157 | -0.9107 | NS |
| -1.058 | -0.3604 | NS |
| -0.3193 | -0.7546 | NS |
| -0.3316 | -0.8429 | NS |
| -1.157 | -0.5842 | NS |
| -0.8368 | -0.7444 | NS |
| -0.3809 | -1.554 | NS |
| -1.662 | -0.8737 | NS |
| -1.798 | -0.5934 | NS |
| -0.4425 | -1.116 | NS |
| -1.675 | -0.4548 | NS |
| -0.4548 | -1.588 | NS |
| 0.1981 | -0.7711 | NS |
| -0.2208 | -0.6314 | NS |
| -0.4179 | -0.5657 | NS |
| -1.675 | -0.193 | NS |
| -0.1715 | -0.1838 | NS |
| -0.1838 | -0.3809 | NS |
| -0.1592 | -0.2084 | NS |
| -0.27 | -0.1592 | NS |
| -0.036 | -0.845 | NS |
| -0.578 | -0.036 | NS |
| -0.5904 | -0.5 | NS |
| -0.1961 | -0.5472 | NS |
| -0.5041 | -0.1509 | NS |
| -0.8491 | -0.6766 | NS |
| -0.4795 | -0.0688 | NS |
| 0.2474 | -0.3111 | NS |
600 more rows in the chart's JSON (chart-22928ec9-70d1-47be-8138-15ef9ace47fc.json in the bundle).
Figure 43. Find outliers: Green spaces 95
| value | lag | type |
|---|---|---|
| 1.243 | 0.3681 | NS |
| -1.382 | 0.1622 | NS |
| -0.9962 | 0.2394 | NS |
| -0.8417 | -0.1004 | NS |
| -1.305 | 0.0592 | NS |
| 0.78 | -0.121 | NS |
| 1.398 | -0.5586 | NS |
| 0.2394 | -0.0695 | NS |
| 0.1622 | -0.1158 | NS |
| 0.7027 | 0.7542 | NS |
Figure 44. Find outliers: Zoning districts 96
| value | lag | type |
|---|---|---|
| -0.6299 | 0.8237 | NS |
| -0.6299 | 1.429 | NS |
| -0.6299 | 0.8237 | NS |
| -0.6299 | 0.0969 | NS |
| 0.8237 | 0.0162 | NS |
| 2.035 | 0.0969 | NS |
| -1.357 | 0.8237 | NS |
| 0.8237 | -0.6299 | NS |
| -0.6299 | 0.0969 | NS |
| 0.8237 | -0.6299 | NS |
Figure 45. Find point clusters: Building permits over time 97
| period | series | value |
|---|---|---|
| 2023-01-01 | extension | 1 |
| 2023-01-01 | new build | 1 |
| 2023-01-01 | change of use | 2 |
| 2023-01-01 | demolition | 0 |
| 2023-02-01 | extension | 4 |
| 2023-02-01 | new build | 1 |
| 2023-02-01 | change of use | 0 |
| 2023-02-01 | demolition | 0 |
| 2023-03-01 | extension | 1 |
| 2023-03-01 | new build | 3 |
| 2023-03-01 | change of use | 1 |
| 2023-03-01 | demolition | 0 |
| 2023-04-01 | extension | 2 |
| 2023-04-01 | new build | 2 |
| 2023-04-01 | change of use | 0 |
| 2023-04-01 | demolition | 3 |
| 2023-05-01 | extension | 5 |
| 2023-05-01 | new build | 3 |
| 2023-05-01 | change of use | 2 |
| 2023-05-01 | demolition | 0 |
| 2023-06-01 | extension | 3 |
| 2023-06-01 | new build | 3 |
| 2023-06-01 | change of use | 1 |
| 2023-06-01 | demolition | 0 |
| 2023-07-01 | extension | 1 |
| 2023-07-01 | new build | 2 |
| 2023-07-01 | change of use | 0 |
| 2023-07-01 | demolition | 1 |
| 2023-08-01 | extension | 2 |
| 2023-08-01 | new build | 5 |
| 2023-08-01 | change of use | 1 |
| 2023-08-01 | demolition | 2 |
| 2023-09-01 | extension | 2 |
| 2023-09-01 | new build | 2 |
| 2023-09-01 | change of use | 0 |
| 2023-09-01 | demolition | 1 |
| 2023-10-01 | extension | 4 |
| 2023-10-01 | new build | 2 |
| 2023-10-01 | change of use | 1 |
| 2023-10-01 | demolition | 1 |
| 2023-11-01 | extension | 2 |
| 2023-11-01 | new build | 1 |
| 2023-11-01 | change of use | 2 |
| 2023-11-01 | demolition | 0 |
| 2023-12-01 | extension | 5 |
| 2023-12-01 | new build | 3 |
| 2023-12-01 | change of use | 2 |
| 2023-12-01 | demolition | 1 |
| 2024-01-01 | extension | 0 |
| 2024-01-01 | new build | 1 |
| 2024-01-01 | change of use | 3 |
| 2024-01-01 | demolition | 1 |
| 2024-02-01 | extension | 3 |
| 2024-02-01 | new build | 1 |
| 2024-02-01 | change of use | 1 |
| 2024-02-01 | demolition | 1 |
| 2024-03-01 | extension | 1 |
| 2024-03-01 | new build | 0 |
| 2024-03-01 | change of use | 0 |
| 2024-03-01 | demolition | 0 |
| 2024-04-01 | extension | 2 |
| 2024-04-01 | new build | 0 |
| 2024-04-01 | change of use | 3 |
| 2024-04-01 | demolition | 0 |
| 2024-05-01 | extension | 5 |
| 2024-05-01 | new build | 6 |
| 2024-05-01 | change of use | 1 |
| 2024-05-01 | demolition | 1 |
| 2024-06-01 | extension | 2 |
| 2024-06-01 | new build | 0 |
| 2024-06-01 | change of use | 3 |
| 2024-06-01 | demolition | 0 |
| 2024-07-01 | extension | 3 |
| 2024-07-01 | new build | 4 |
| 2024-07-01 | change of use | 2 |
| 2024-07-01 | demolition | 1 |
| 2024-08-01 | extension | 0 |
| 2024-08-01 | new build | 5 |
| 2024-08-01 | change of use | 4 |
| 2024-08-01 | demolition | 1 |
| 2024-09-01 | extension | 0 |
| 2024-09-01 | new build | 4 |
| 2024-09-01 | change of use | 4 |
| 2024-09-01 | demolition | 2 |
| 2024-10-01 | extension | 2 |
| 2024-10-01 | new build | 4 |
| 2024-10-01 | change of use | 1 |
| 2024-10-01 | demolition | 2 |
| 2024-11-01 | extension | 5 |
| 2024-11-01 | new build | 5 |
| 2024-11-01 | change of use | 1 |
| 2024-11-01 | demolition | 0 |
| 2024-12-01 | extension | 2 |
| 2024-12-01 | new build | 3 |
| 2024-12-01 | change of use | 1 |
| 2024-12-01 | demolition | 3 |
| 2025-01-01 | extension | 2 |
| 2025-01-01 | new build | 4 |
| 2025-01-01 | change of use | 0 |
| 2025-01-01 | demolition | 0 |
| 2025-02-01 | extension | 1 |
| 2025-02-01 | new build | 1 |
| 2025-02-01 | change of use | 2 |
| 2025-02-01 | demolition | 0 |
| 2025-03-01 | extension | 0 |
| 2025-03-01 | new build | 2 |
| 2025-03-01 | change of use | 2 |
| 2025-03-01 | demolition | 0 |
| 2025-04-01 | extension | 3 |
| 2025-04-01 | new build | 1 |
| 2025-04-01 | change of use | 3 |
| 2025-04-01 | demolition | 0 |
| 2025-05-01 | extension | 4 |
| 2025-05-01 | new build | 4 |
| 2025-05-01 | change of use | 3 |
| 2025-05-01 | demolition | 1 |
| 2025-06-01 | extension | 3 |
| 2025-06-01 | new build | 2 |
| 2025-06-01 | change of use | 3 |
| 2025-06-01 | demolition | 1 |
| 2025-07-01 | extension | 2 |
| 2025-07-01 | new build | 2 |
| 2025-07-01 | change of use | 2 |
| 2025-07-01 | demolition | 0 |
| 2025-08-01 | extension | 4 |
| 2025-08-01 | new build | 3 |
| 2025-08-01 | change of use | 2 |
| 2025-08-01 | demolition | 1 |
| 2025-09-01 | extension | 5 |
| 2025-09-01 | new build | 5 |
| 2025-09-01 | change of use | 3 |
| 2025-09-01 | demolition | 2 |
| 2025-10-01 | extension | 4 |
| 2025-10-01 | new build | 3 |
| 2025-10-01 | change of use | 4 |
| 2025-10-01 | demolition | 1 |
| 2025-11-01 | extension | 4 |
| 2025-11-01 | new build | 4 |
| 2025-11-01 | change of use | 3 |
| 2025-11-01 | demolition | 1 |
| 2025-12-01 | extension | 4 |
| 2025-12-01 | new build | 3 |
| 2025-12-01 | change of use | 3 |
| 2025-12-01 | demolition | 0 |
| 2026-01-01 | extension | 4 |
| 2026-01-01 | new build | 4 |
| 2026-01-01 | change of use | 3 |
| 2026-01-01 | demolition | 0 |
| 2026-02-01 | extension | 4 |
| 2026-02-01 | new build | 2 |
| 2026-02-01 | change of use | 2 |
| 2026-02-01 | demolition | 0 |
| 2026-03-01 | extension | 5 |
| 2026-03-01 | new build | 2 |
| 2026-03-01 | change of use | 6 |
| 2026-03-01 | demolition | 2 |
| 2026-04-01 | extension | 1 |
| 2026-04-01 | new build | 7 |
| 2026-04-01 | change of use | 0 |
| 2026-04-01 | demolition | 1 |
| 2026-05-01 | extension | 2 |
| 2026-05-01 | new build | 2 |
| 2026-05-01 | change of use | 1 |
| 2026-05-01 | demolition | 0 |
| 2026-06-01 | extension | 4 |
| 2026-06-01 | new build | 6 |
| 2026-06-01 | change of use | 4 |
| 2026-06-01 | demolition | 0 |
| 2026-07-01 | extension | 7 |
| 2026-07-01 | new build | 4 |
| 2026-07-01 | change of use | 1 |
| 2026-07-01 | demolition | 1 |
| 2026-08-01 | extension | 3 |
| 2026-08-01 | new build | 3 |
| 2026-08-01 | change of use | 3 |
| 2026-08-01 | demolition | 3 |
| 2026-09-01 | extension | 7 |
| 2026-09-01 | new build | 2 |
| 2026-09-01 | change of use | 2 |
| 2026-09-01 | demolition | 0 |
Figure 46. Find point clusters: Property sales over time 98
| period | series | value |
|---|---|---|
| 2022-01-01 | apartment | 21 |
| 2022-01-01 | office | 15 |
| 2022-01-01 | house | 10 |
| 2022-04-01 | apartment | 24 |
| 2022-04-01 | office | 10 |
| 2022-04-01 | house | 12 |
| 2022-07-01 | apartment | 19 |
| 2022-07-01 | office | 13 |
| 2022-07-01 | house | 10 |
| 2022-10-01 | apartment | 33 |
| 2022-10-01 | office | 12 |
| 2022-10-01 | house | 13 |
| 2023-01-01 | apartment | 14 |
| 2023-01-01 | office | 14 |
| 2023-01-01 | house | 12 |
| 2023-04-01 | apartment | 26 |
| 2023-04-01 | office | 12 |
| 2023-04-01 | house | 11 |
| 2023-07-01 | apartment | 29 |
| 2023-07-01 | office | 15 |
| 2023-07-01 | house | 17 |
| 2023-10-01 | apartment | 19 |
| 2023-10-01 | office | 19 |
| 2023-10-01 | house | 10 |
| 2024-01-01 | apartment | 22 |
| 2024-01-01 | office | 14 |
| 2024-01-01 | house | 14 |
| 2024-04-01 | apartment | 25 |
| 2024-04-01 | office | 15 |
| 2024-04-01 | house | 16 |
| 2024-07-01 | apartment | 22 |
| 2024-07-01 | office | 12 |
| 2024-07-01 | house | 12 |
| 2024-10-01 | apartment | 15 |
| 2024-10-01 | office | 13 |
| 2024-10-01 | house | 12 |
| 2025-01-01 | apartment | 23 |
| 2025-01-01 | office | 13 |
| 2025-01-01 | house | 11 |
| 2025-04-01 | apartment | 27 |
| 2025-04-01 | office | 18 |
| 2025-04-01 | house | 15 |
| 2025-07-01 | apartment | 21 |
| 2025-07-01 | office | 13 |
| 2025-07-01 | house | 17 |
| 2025-10-01 | apartment | 26 |
| 2025-10-01 | office | 15 |
| 2025-10-01 | house | 14 |
| 2026-01-01 | apartment | 24 |
| 2026-01-01 | office | 21 |
| 2026-01-01 | house | 10 |
| 2026-04-01 | apartment | 20 |
| 2026-04-01 | office | 14 |
| 2026-04-01 | house | 15 |
| 2026-07-01 | apartment | 21 |
| 2026-07-01 | office | 10 |
| 2026-07-01 | house | 20 |
Figure 47. Hot spot analysis: Building permits over time 99
| period | series | value |
|---|---|---|
| 2023-01-01 | extension | 1 |
| 2023-01-01 | new build | 1 |
| 2023-01-01 | change of use | 2 |
| 2023-01-01 | demolition | 0 |
| 2023-02-01 | extension | 4 |
| 2023-02-01 | new build | 1 |
| 2023-02-01 | change of use | 0 |
| 2023-02-01 | demolition | 0 |
| 2023-03-01 | extension | 1 |
| 2023-03-01 | new build | 3 |
| 2023-03-01 | change of use | 1 |
| 2023-03-01 | demolition | 0 |
| 2023-04-01 | extension | 2 |
| 2023-04-01 | new build | 2 |
| 2023-04-01 | change of use | 0 |
| 2023-04-01 | demolition | 3 |
| 2023-05-01 | extension | 5 |
| 2023-05-01 | new build | 3 |
| 2023-05-01 | change of use | 2 |
| 2023-05-01 | demolition | 0 |
| 2023-06-01 | extension | 3 |
| 2023-06-01 | new build | 3 |
| 2023-06-01 | change of use | 1 |
| 2023-06-01 | demolition | 0 |
| 2023-07-01 | extension | 1 |
| 2023-07-01 | new build | 2 |
| 2023-07-01 | change of use | 0 |
| 2023-07-01 | demolition | 1 |
| 2023-08-01 | extension | 2 |
| 2023-08-01 | new build | 5 |
| 2023-08-01 | change of use | 1 |
| 2023-08-01 | demolition | 2 |
| 2023-09-01 | extension | 2 |
| 2023-09-01 | new build | 2 |
| 2023-09-01 | change of use | 0 |
| 2023-09-01 | demolition | 1 |
| 2023-10-01 | extension | 4 |
| 2023-10-01 | new build | 2 |
| 2023-10-01 | change of use | 1 |
| 2023-10-01 | demolition | 1 |
| 2023-11-01 | extension | 2 |
| 2023-11-01 | new build | 1 |
| 2023-11-01 | change of use | 2 |
| 2023-11-01 | demolition | 0 |
| 2023-12-01 | extension | 5 |
| 2023-12-01 | new build | 3 |
| 2023-12-01 | change of use | 2 |
| 2023-12-01 | demolition | 1 |
| 2024-01-01 | extension | 0 |
| 2024-01-01 | new build | 1 |
| 2024-01-01 | change of use | 3 |
| 2024-01-01 | demolition | 1 |
| 2024-02-01 | extension | 3 |
| 2024-02-01 | new build | 1 |
| 2024-02-01 | change of use | 1 |
| 2024-02-01 | demolition | 1 |
| 2024-03-01 | extension | 1 |
| 2024-03-01 | new build | 0 |
| 2024-03-01 | change of use | 0 |
| 2024-03-01 | demolition | 0 |
| 2024-04-01 | extension | 2 |
| 2024-04-01 | new build | 0 |
| 2024-04-01 | change of use | 3 |
| 2024-04-01 | demolition | 0 |
| 2024-05-01 | extension | 5 |
| 2024-05-01 | new build | 6 |
| 2024-05-01 | change of use | 1 |
| 2024-05-01 | demolition | 1 |
| 2024-06-01 | extension | 2 |
| 2024-06-01 | new build | 0 |
| 2024-06-01 | change of use | 3 |
| 2024-06-01 | demolition | 0 |
| 2024-07-01 | extension | 3 |
| 2024-07-01 | new build | 4 |
| 2024-07-01 | change of use | 2 |
| 2024-07-01 | demolition | 1 |
| 2024-08-01 | extension | 0 |
| 2024-08-01 | new build | 5 |
| 2024-08-01 | change of use | 4 |
| 2024-08-01 | demolition | 1 |
| 2024-09-01 | extension | 0 |
| 2024-09-01 | new build | 4 |
| 2024-09-01 | change of use | 4 |
| 2024-09-01 | demolition | 2 |
| 2024-10-01 | extension | 2 |
| 2024-10-01 | new build | 4 |
| 2024-10-01 | change of use | 1 |
| 2024-10-01 | demolition | 2 |
| 2024-11-01 | extension | 5 |
| 2024-11-01 | new build | 5 |
| 2024-11-01 | change of use | 1 |
| 2024-11-01 | demolition | 0 |
| 2024-12-01 | extension | 2 |
| 2024-12-01 | new build | 3 |
| 2024-12-01 | change of use | 1 |
| 2024-12-01 | demolition | 3 |
| 2025-01-01 | extension | 2 |
| 2025-01-01 | new build | 4 |
| 2025-01-01 | change of use | 0 |
| 2025-01-01 | demolition | 0 |
| 2025-02-01 | extension | 1 |
| 2025-02-01 | new build | 1 |
| 2025-02-01 | change of use | 2 |
| 2025-02-01 | demolition | 0 |
| 2025-03-01 | extension | 0 |
| 2025-03-01 | new build | 2 |
| 2025-03-01 | change of use | 2 |
| 2025-03-01 | demolition | 0 |
| 2025-04-01 | extension | 3 |
| 2025-04-01 | new build | 1 |
| 2025-04-01 | change of use | 3 |
| 2025-04-01 | demolition | 0 |
| 2025-05-01 | extension | 4 |
| 2025-05-01 | new build | 4 |
| 2025-05-01 | change of use | 3 |
| 2025-05-01 | demolition | 1 |
| 2025-06-01 | extension | 3 |
| 2025-06-01 | new build | 2 |
| 2025-06-01 | change of use | 3 |
| 2025-06-01 | demolition | 1 |
| 2025-07-01 | extension | 2 |
| 2025-07-01 | new build | 2 |
| 2025-07-01 | change of use | 2 |
| 2025-07-01 | demolition | 0 |
| 2025-08-01 | extension | 4 |
| 2025-08-01 | new build | 3 |
| 2025-08-01 | change of use | 2 |
| 2025-08-01 | demolition | 1 |
| 2025-09-01 | extension | 5 |
| 2025-09-01 | new build | 5 |
| 2025-09-01 | change of use | 3 |
| 2025-09-01 | demolition | 2 |
| 2025-10-01 | extension | 4 |
| 2025-10-01 | new build | 3 |
| 2025-10-01 | change of use | 4 |
| 2025-10-01 | demolition | 1 |
| 2025-11-01 | extension | 4 |
| 2025-11-01 | new build | 4 |
| 2025-11-01 | change of use | 3 |
| 2025-11-01 | demolition | 1 |
| 2025-12-01 | extension | 4 |
| 2025-12-01 | new build | 3 |
| 2025-12-01 | change of use | 3 |
| 2025-12-01 | demolition | 0 |
| 2026-01-01 | extension | 4 |
| 2026-01-01 | new build | 4 |
| 2026-01-01 | change of use | 3 |
| 2026-01-01 | demolition | 0 |
| 2026-02-01 | extension | 4 |
| 2026-02-01 | new build | 2 |
| 2026-02-01 | change of use | 2 |
| 2026-02-01 | demolition | 0 |
| 2026-03-01 | extension | 5 |
| 2026-03-01 | new build | 2 |
| 2026-03-01 | change of use | 6 |
| 2026-03-01 | demolition | 2 |
| 2026-04-01 | extension | 1 |
| 2026-04-01 | new build | 7 |
| 2026-04-01 | change of use | 0 |
| 2026-04-01 | demolition | 1 |
| 2026-05-01 | extension | 2 |
| 2026-05-01 | new build | 2 |
| 2026-05-01 | change of use | 1 |
| 2026-05-01 | demolition | 0 |
| 2026-06-01 | extension | 4 |
| 2026-06-01 | new build | 6 |
| 2026-06-01 | change of use | 4 |
| 2026-06-01 | demolition | 0 |
| 2026-07-01 | extension | 7 |
| 2026-07-01 | new build | 4 |
| 2026-07-01 | change of use | 1 |
| 2026-07-01 | demolition | 1 |
| 2026-08-01 | extension | 3 |
| 2026-08-01 | new build | 3 |
| 2026-08-01 | change of use | 3 |
| 2026-08-01 | demolition | 3 |
| 2026-09-01 | extension | 7 |
| 2026-09-01 | new build | 2 |
| 2026-09-01 | change of use | 2 |
| 2026-09-01 | demolition | 0 |
Figure 48. Repeat and near repeat classification: Property sales over time 100
| period | series | value |
|---|---|---|
| 2022-01-01 | apartment | 21 |
| 2022-01-01 | office | 15 |
| 2022-01-01 | house | 10 |
| 2022-04-01 | apartment | 24 |
| 2022-04-01 | office | 10 |
| 2022-04-01 | house | 12 |
| 2022-07-01 | apartment | 19 |
| 2022-07-01 | office | 13 |
| 2022-07-01 | house | 10 |
| 2022-10-01 | apartment | 33 |
| 2022-10-01 | office | 12 |
| 2022-10-01 | house | 13 |
| 2023-01-01 | apartment | 14 |
| 2023-01-01 | office | 14 |
| 2023-01-01 | house | 12 |
| 2023-04-01 | apartment | 26 |
| 2023-04-01 | office | 12 |
| 2023-04-01 | house | 11 |
| 2023-07-01 | apartment | 29 |
| 2023-07-01 | office | 15 |
| 2023-07-01 | house | 17 |
| 2023-10-01 | apartment | 19 |
| 2023-10-01 | office | 19 |
| 2023-10-01 | house | 10 |
| 2024-01-01 | apartment | 22 |
| 2024-01-01 | office | 14 |
| 2024-01-01 | house | 14 |
| 2024-04-01 | apartment | 25 |
| 2024-04-01 | office | 15 |
| 2024-04-01 | house | 16 |
| 2024-07-01 | apartment | 22 |
| 2024-07-01 | office | 12 |
| 2024-07-01 | house | 12 |
| 2024-10-01 | apartment | 15 |
| 2024-10-01 | office | 13 |
| 2024-10-01 | house | 12 |
| 2025-01-01 | apartment | 23 |
| 2025-01-01 | office | 13 |
| 2025-01-01 | house | 11 |
| 2025-04-01 | apartment | 27 |
| 2025-04-01 | office | 18 |
| 2025-04-01 | house | 15 |
| 2025-07-01 | apartment | 21 |
| 2025-07-01 | office | 13 |
| 2025-07-01 | house | 17 |
| 2025-10-01 | apartment | 26 |
| 2025-10-01 | office | 15 |
| 2025-10-01 | house | 14 |
| 2026-01-01 | apartment | 24 |
| 2026-01-01 | office | 21 |
| 2026-01-01 | house | 10 |
| 2026-04-01 | apartment | 20 |
| 2026-04-01 | office | 14 |
| 2026-04-01 | house | 15 |
| 2026-07-01 | apartment | 21 |
| 2026-07-01 | office | 10 |
| 2026-07-01 | house | 20 |
GeoBit Large Spatial Model. Findings are labeled Evidenced (computed by a tool), Inferred (a reading or reasoning) or Unverified (no evidence yet).