Sample: Forestry and wildfire, Bend: report
Project: Sample: Forestry and wildfire, Bend
Goal: Describe the project Sample: Forestry and wildfire, Bend: run the analyses that tell the most about its data, draw every result, and write a cited report.
Run: 8ded6244-4d76-45b7-a92e-f62fd8a76afe (running, 11 agent run(s))
Generated: 2026-10-18T06:17:30Z, version 1
Model cost: USD 0.0000 over 0 model call(s)
Data used
| Data | Kind | Rows | Time span | Summary | Source |
|---|---|---|---|---|---|
| Fuel units | vector, Polygon | 36 | 36 polygon (area) features; 'fuel_model' has 5 values (top: timber litter 10, timber understory 7, slash 7); 'fuel_load_t_ha' 1.5 to 37.1 (mean 15.26); 'canopy_cover_pct' 7 to 91 (mean 45.36); 'last_burned' 1996 to 2020 (mean 2011); total area 80.03 km2; extent -121.4833,43.9831 to -121.3566,44.0568. Areas (Fuel units) with fuel_load_t_ha to compare and map. | 98 | |
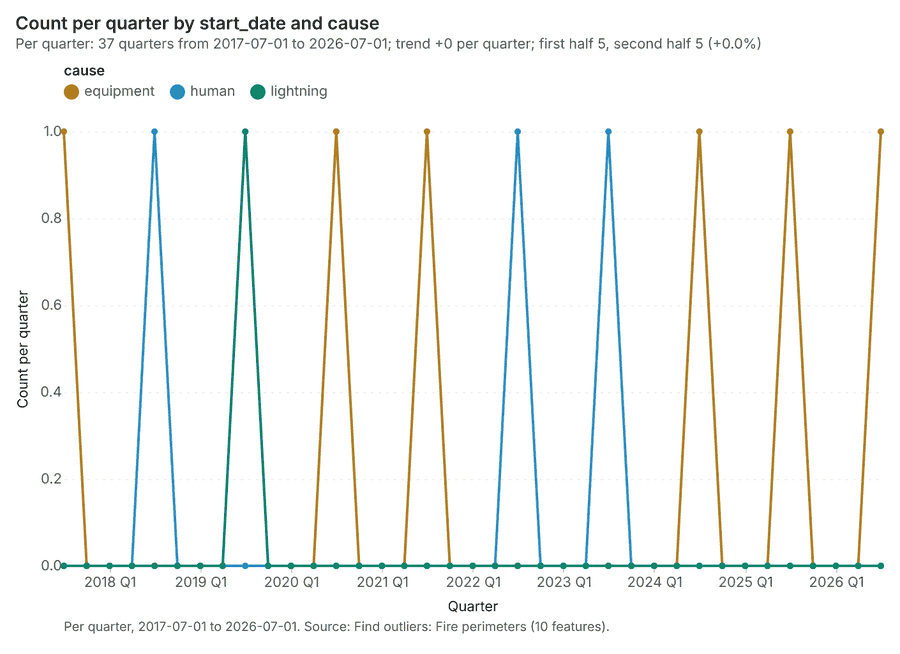
| Fire perimeters | vector, Polygon | 10 | 2017-08-10 to 2026-07-16 | 10 polygon (area) features; dated by 'start_date' from 2017-08-10 to 2026-07-16; 'cause' has 3 values (top: equipment 6, human 3, lightning 1); 'acres' 85 to 378 (mean 219.2); 'containment_days' 2 to 20 (mean 11); named by 'fire_name' (e.g. Westbrook Fire, Station Quarter Fire, Riverside Fire); total area 8.894 km2; extent -121.4744,43.9952 to -121.3725,44.0490. Areas (Fire perimeters) with acres to compare and map. | 2 |
| Ignitions | vector, Point | 900 | 2018-01-07 to 2026-09-30 | 900 point features; dated by 'detected_at' from 2018-01-07 to 2026-09-30; 'cause' has 7 values (top: lightning 243, campfire 186, vehicle 112); 'final_acres' 0 to 45.9 (mean 1.727); 'elevation_m' 1158 to 1737 (mean 1449); extent -121.4824,43.9841 to -121.3576,44.0560. Dated point events by cause: where and when Ignitions happen. | 3 |
| Forest roads | vector, LineString | 15 | 15 line features; 'surface' has 3 values (top: native 8, gravel 6, paved 1); 'gated' has 2 values (top: False 10, True 5); named by 'name' (e.g. Highway corridor, Forest Road 314, Forest Road 321); total length 74.47 km; extent -121.4826,43.9869 to -121.3584,44.0558. Lines (Forest roads) such as routes or networks. | 99 | |
| Weather stations | vector, Point | 6 | 6 point features; 'elevation_m' 1253 to 1663 (mean 1503); named by 'name' (e.g. RAWS weather station 1, RAWS weather station 2, RAWS weather station 3); extent -121.4578,44.0051 to -121.3674,44.0455. Point locations of Weather stations. | 100 | |
| Fire lookouts | vector, Point | 3 | 3 point features; 'staffed' has 2 values (top: True 2, False 1); 'tower_height_m' 9 to 12 (mean 11); named by 'name' (e.g. Pine Butte lookout, Cinder Butte lookout, Eagle Butte lookout); extent -121.4430,44.0109 to -121.3763,44.0430. Point locations of Fire lookouts by staffed. | 101 | |
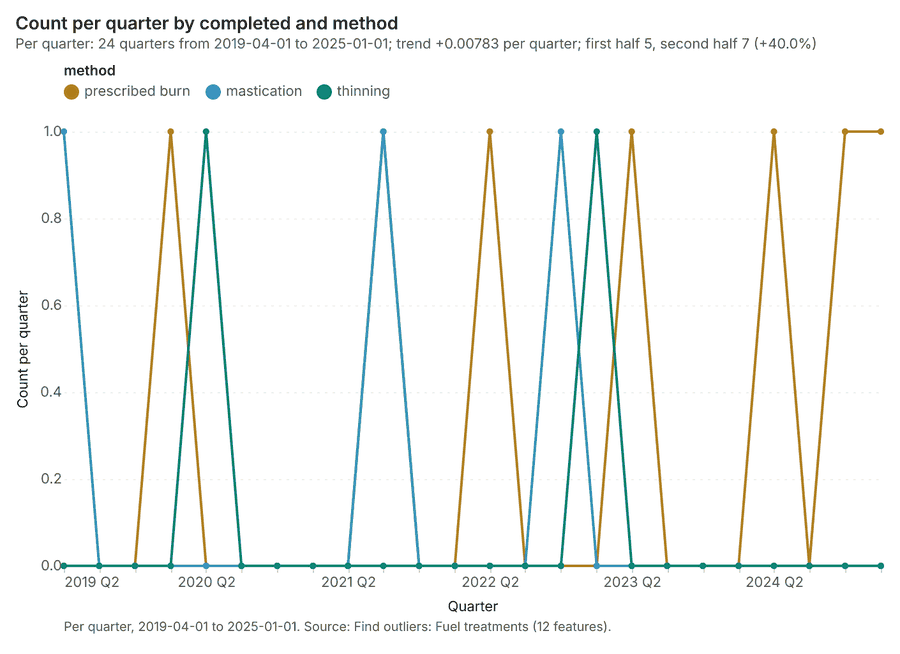
| Fuel treatments | vector, Polygon | 12 | 2019-06-01 to 2025-01-01 | 12 polygon (area) features; dated by 'completed' from 2019-06-01 to 2025-01-01; 'method' has 3 values (top: prescribed burn 7, mastication 3, thinning 2); 'acres' 62 to 188 (mean 119.8); total area 5.842 km2; extent -121.4681,44.0078 to -121.3572,44.0561. Areas (Fuel treatments) with acres to compare and map. | 4 |
| Forest terrain model (DEM) | raster | 1-band float32 raster (dem), 333 x 267 cells; resolution 30; band 1 1152 to 1745; extent -121.4833,43.9830 to -121.3568,44.0568. An elevation surface for terrain analysis. | 102 | ||
| Station weather by day | table | 918 | 2026-05-01 to 2026-09-30 | Table of 918 rows and 6 columns without geometry; dated by 'date' from 2026-05-01 to 2026-09-30; 'temp_max_c' 14.6 to 42.8 (mean 29.96); 'rh_min_pct' 5 to 56 (mean 25.28); 'wind_kmh' 0 to 29 (mean 13.63). A table of Station weather by day without locations. | 5 |
| Treatment costs | table | 12 | Table of 12 rows and 4 columns without geometry; 'method' has 3 values (top: prescribed burn 7, mastication 3, thinning 2); 'cost_usd_per_acre' 472 to 1,391 (mean 910); 'crew_days' 5 to 40 (mean 25.67). A table of Treatment costs without locations. | 103 | |
| Fuels treatment plan | document | 1-page pdf document 'Fuels treatment plan'; language en; mentions 5 place(s): Highway corridor (2), Thornbury Vale Fire (1), Queensway Fire (1), Pine Butte lookout (1), Cinder Butte lookout (1). A document about Highway corridor, Thornbury Vale Fire, Queensway Fire. | 104 | ||
| Sample: Forestry and wildfire, Bend | record | 105 | |||
| Hot spot analysis: Ignitions | layer, Polygon | 344 | 106 | ||
| Hot spot analysis: Fire perimeters | layer, Polygon | 10 | 107 | ||
| Hot spot analysis: Fuel treatments | layer, Polygon | 12 | 108 | ||
| Emerging hot spots: Ignitions | layer, Polygon | 135 | 109 | ||
| Repeat and near repeat classification: Ignitions | layer, Point | 900 | 110 | ||
| Summarize within: Fire perimeters | layer, Polygon | 10 | 111 | ||
| Summarize within: Fire perimeters | layer, Polygon | 10 | 112 | ||
| Summarize within: Fire perimeters | layer, Polygon | 10 | 113 | ||
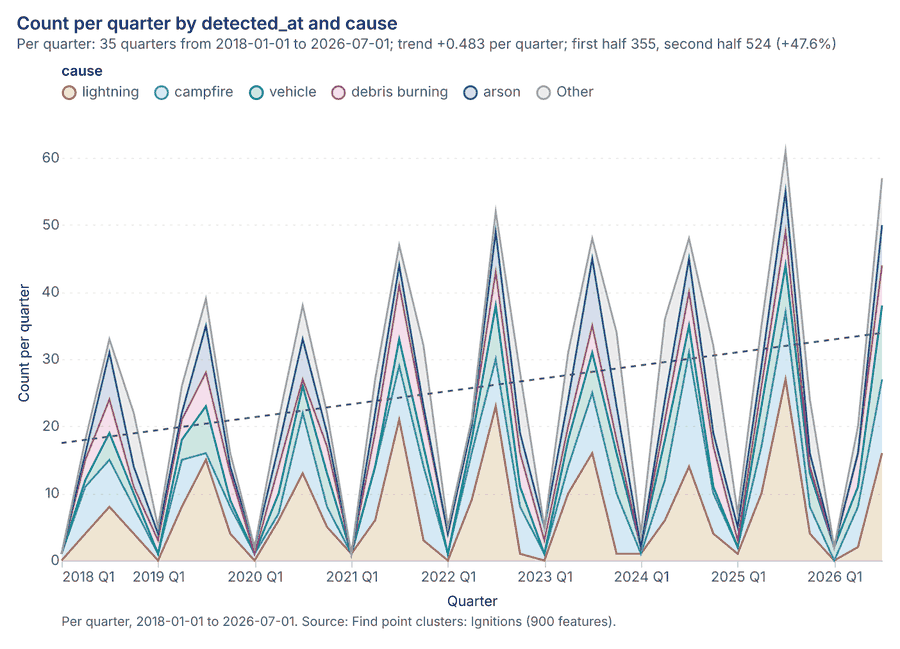
| Find point clusters: Ignitions | layer, Point | 900 | 114 | ||
| Find point clusters: cluster hulls | layer, Polygon | 1 | 115 | ||
| Calculate density: Ignitions | layer, Polygon | 2,136 | 116 | ||
| Find outliers: Fire perimeters | layer, Polygon | 10 | 117 | ||
| Find outliers: Fuel treatments | layer, Polygon | 12 | 118 | ||
| Find outliers: Fuel units | layer, Polygon | 36 | 119 |
Timeline
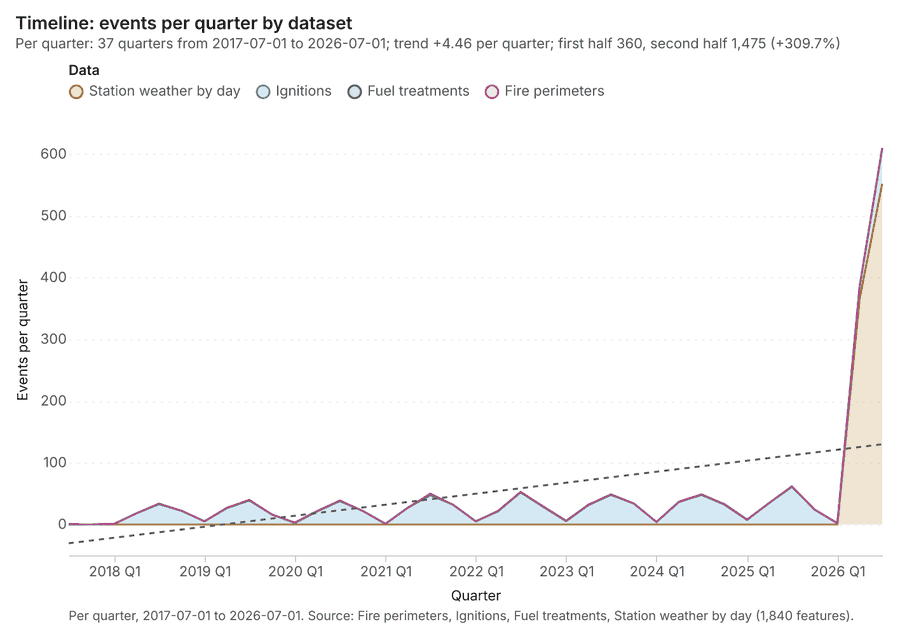
The timeline counts 1,840 dated events in Fire perimeters, Ignitions, Fuel treatments and 1 more per quarter, from Q3 2017 to Q3 2026 12345. By dataset: Station weather by day 918; Ignitions 900; Fuel treatments 12; Fire perimeters 10 1. The trend is +4.46 events per quarter; the second half of the quarters has 1,475 against 360 in the first (+309.7%) 1. 1 of the 37 quarters had no events 1. Change point detection found no shift in the counts 6.
Busiest quarters
Quietest quarters with events
Hot spots
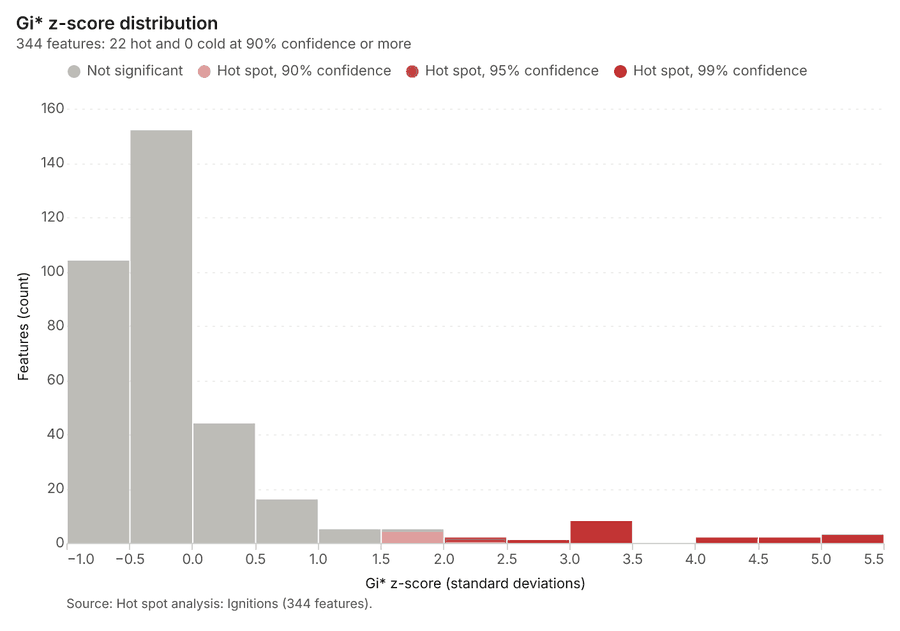
What this analysis is. Hot spot analysis: Getis-Ord Gi* hot and cold spots with z-scores, p-values and confidence bins 7. In ArcGIS it is Find Hot Spots or Hot Spot Analysis (Getis-Ord Gi*); in QGIS, qgis:hotspot (plugin) 7.
Why it was run on this data. 900 points: Getis-Ord Gi* tests whether the concentrations in Ignitions are statistically significant 8.
What it found. Hot spots on Ignitions: Hot spot analysis: 1 layer saved: Hot spot analysis: Ignitions (344 features) 910. It reported result, bins 344; result, count 344; result, elapsed ms 21; result, cell size m 500; result, incidents used 900; result, distance band m 500 9.
| Result | Value |
|---|---|
| result, bins | 344 |
| result, count | 344 |
| result, elapsed ms | 21 |
| result, cell size m | 500 |
| result, incidents used | 900 |
| result, distance band m | 500 |
| billing, cost | 0.068 |
| billing, list price | 0.068 |
| billing, upstream cost | 0 |
Findings
- Evidenced: Hot spots on Ignitions: Hot spot analysis: 1 layer saved: Hot spot analysis: Ignitions (344 features) 910.
- Evidenced: It reported result, bins 344; result, count 344; result, elapsed ms 21; result, cell size m 500; result, incidents used 900; result, distance band m 500 9.
Tool gp_hot_spots; parameters {"project": "721d878b-84af-42eb-9c9c-858bf9a6a75e", "features": {"layer": "Ignitions (73bb3d60)"}, "aggregation": "hexagon", "cell_size_m": 500.0, "distance_band_m": 500.0}
Hot spots
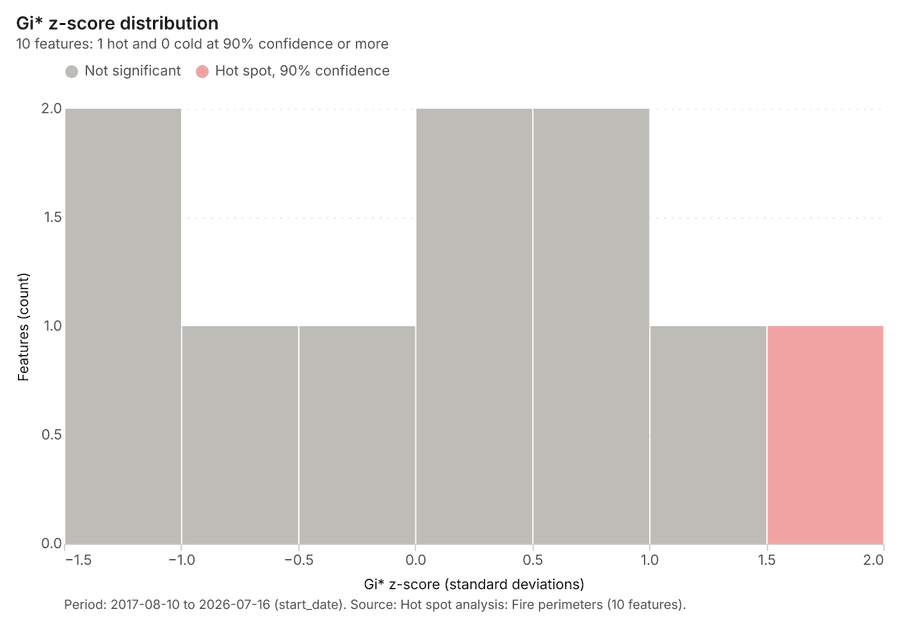
What this analysis is. Hot spot analysis: Getis-Ord Gi* hot and cold spots with z-scores, p-values and confidence bins 7. In ArcGIS it is Find Hot Spots or Hot Spot Analysis (Getis-Ord Gi*); in QGIS, qgis:hotspot (plugin) 7.
Why it was run on this data. Gi* hot spots of 'acres' across the areas 11.
What it found. Hot spots on Fire perimeters: Hot spot analysis: 1 layer saved: Hot spot analysis: Fire perimeters (10 features) 1213. It reported result, count 10; result, elapsed ms 3; result, excluded null 0; result, distance band m 2,652; billing, cost 0.0502; billing, list price 0.0502 12.
| Result | Value |
|---|---|
| result, count | 10 |
| result, elapsed ms | 3 |
| result, excluded null | 0 |
| result, distance band m | 2,652 |
| billing, cost | 0.0502 |
| billing, list price | 0.0502 |
| billing, upstream cost | 0 |
Findings
- Evidenced: Hot spots on Fire perimeters: Hot spot analysis: 1 layer saved: Hot spot analysis: Fire perimeters (10 features) 1213.
- Evidenced: It reported result, count 10; result, elapsed ms 3; result, excluded null 0; result, distance band m 2,652; billing, cost 0.0502; billing, list price 0.0502 12.
Tool gp_hot_spots; parameters {"field": "acres", "project": "721d878b-84af-42eb-9c9c-858bf9a6a75e", "features": {"layer": "Fire perimeters (4401c868)"}}
Hot spots
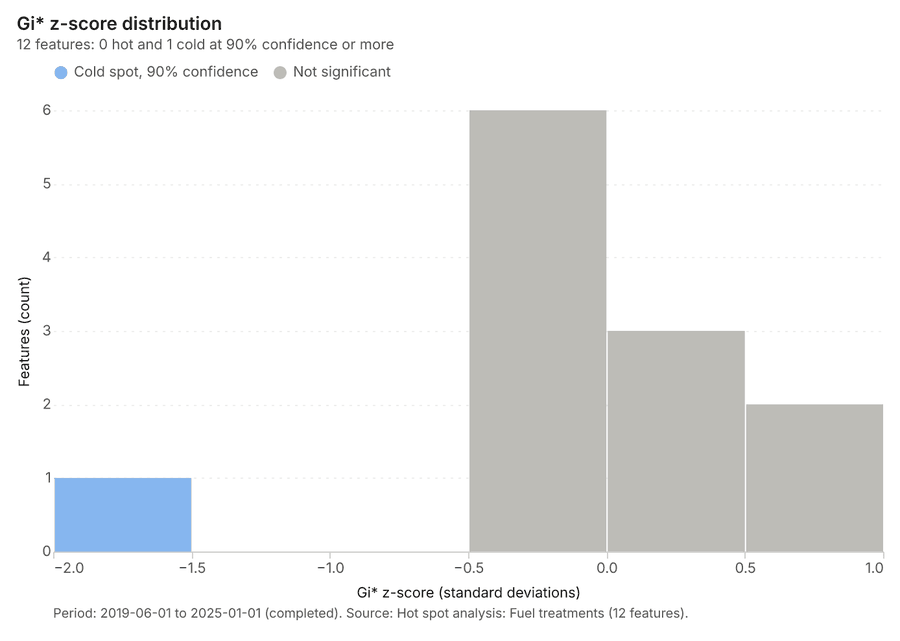
What this analysis is. Hot spot analysis: Getis-Ord Gi* hot and cold spots with z-scores, p-values and confidence bins 7. In ArcGIS it is Find Hot Spots or Hot Spot Analysis (Getis-Ord Gi*); in QGIS, qgis:hotspot (plugin) 7.
Why it was run on this data. Gi* hot spots of 'acres' across the areas 14.
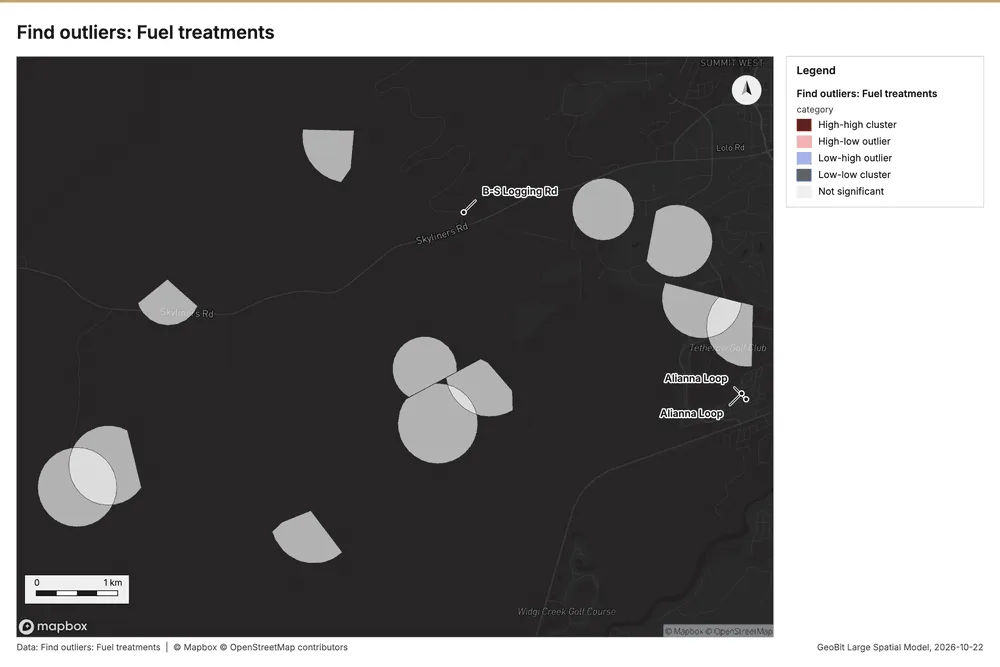
What it found. Hot spots on Fuel treatments: Hot spot analysis: 1 layer saved: Hot spot analysis: Fuel treatments (12 features) 1516. It reported result, count 12; result, elapsed ms 2; result, excluded null 0; result, distance band m 2,799; billing, cost 0.05024; billing, list price 0.05024 15.
| Result | Value |
|---|---|
| result, count | 12 |
| result, elapsed ms | 2 |
| result, excluded null | 0 |
| result, distance band m | 2,799 |
| billing, cost | 0.05024 |
| billing, list price | 0.05024 |
| billing, upstream cost | 0 |
Findings
- Evidenced: Hot spots on Fuel treatments: Hot spot analysis: 1 layer saved: Hot spot analysis: Fuel treatments (12 features) 1516.
- Evidenced: It reported result, count 12; result, elapsed ms 2; result, excluded null 0; result, distance band m 2,799; billing, cost 0.05024; billing, list price 0.05024 15.
Tool gp_hot_spots; parameters {"field": "acres", "project": "721d878b-84af-42eb-9c9c-858bf9a6a75e", "features": {"layer": "Fuel treatments (d603668d)"}}
Space time hot spots
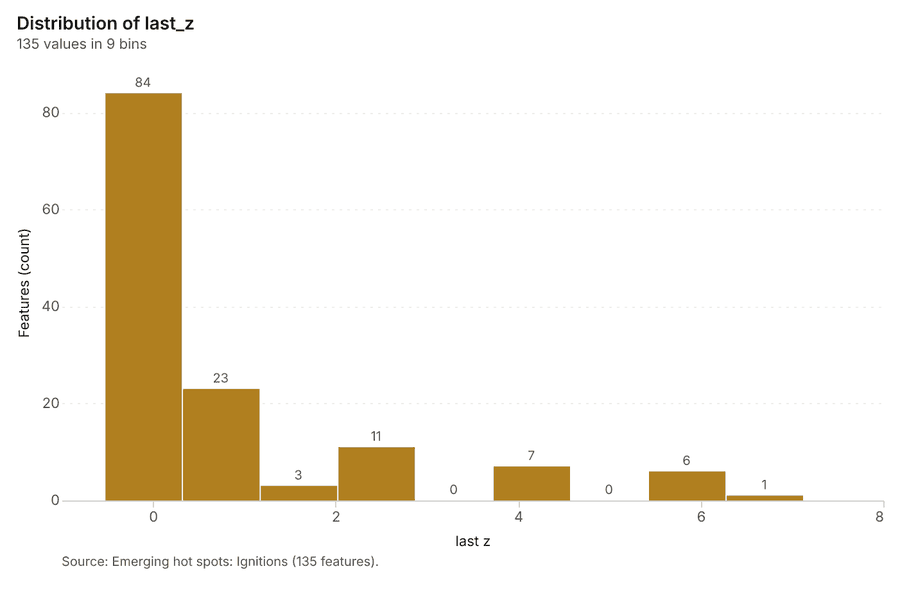
What this analysis is. Emerging hot spots: Where hot spots are new, consecutive, intensifying, persistent, diminishing, sporadic, oscillating or historical over time 17. In ArcGIS it is Emerging Hot Spot Analysis or Create Space Time Cube 17.
Why it was run on this data. Ignitions carry dates in 'detected_at': emerging hot spot analysis finds new, intensifying and fading hot spots per month 18.
What it found. Space time hot spots on Ignitions: Emerging hot spots: 1 layer saved: Emerging hot spots: Ignitions (135 features) 1019. It reported result, count 135; result, elapsed ms 35; result, resolution 8; result, features used 900; result, time neighbors 0; billing, cost 0.145 19.
| Result | Value |
|---|---|
| result, count | 135 |
| result, elapsed ms | 35 |
| result, resolution | 8 |
| result, features used | 900 |
| result, time neighbors | 0 |
| billing, cost | 0.145 |
| billing, list price | 0.145 |
| billing, upstream cost | 0 |
Findings
- Evidenced: Space time hot spots on Ignitions: Emerging hot spots: 1 layer saved: Emerging hot spots: Ignitions (135 features) 1019.
- Evidenced: It reported result, count 135; result, elapsed ms 35; result, resolution 8; result, features used 900; result, time neighbors 0; billing, cost 0.145 19.
Tool gp_space_time_hot_spots; parameters {"project": "721d878b-84af-42eb-9c9c-858bf9a6a75e", "features": {"layer": "Ignitions (73bb3d60)"}, "interval": "month", "bin_shape": "h3", "resolution": 8, "time_field": "detected_at"}
Near repeat
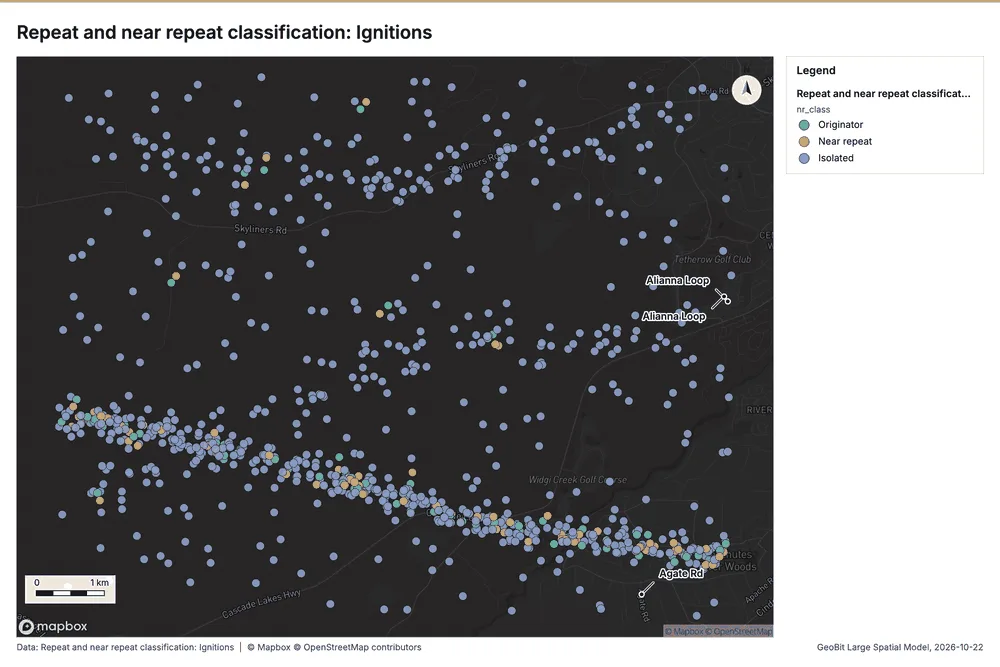
What this analysis is. Repeat and near repeat classification: Classify incidents as originators, repeats (same place) or near repeats within a distance and time window, with a Knox test table 20. In ArcGIS it is Repeat and Near Repeat Classification or Near Repeat Calculator 20.
Why it was run on this data. Near repeat analysis tests whether Ignitions close in space also follow each other within 30 days 21.
What it found. The near repeat classification utilized the gp_near_repeat tool 22 and processed the Ignitions dataset 10. The tool yielded overall results showing a count of 900 22, 63 chains 22, and a maximum distance of 200 m 22. The execution was efficient, linking 80 pairs in an elapsed time of 18 ms 22. Financially, the operation incurred a cost of 0.077 22.
| Result | Value |
|---|---|
| result, days | 30 |
| result, count | 900 |
| result, chains | 63 |
| result, distance m | 200 |
| result, elapsed ms | 18 |
| result, pairs linked | 80 |
| billing, cost | 0.077 |
| billing, list price | 0.077 |
| billing, upstream cost | 0 |
Findings
- Evidenced: Near repeat on Ignitions: Repeat and near repeat classification: 1 layer saved: Repeat and near repeat classification: Ignitions (900 features) 1022.
- Evidenced: It reported result, days 30; result, count 900; result, chains 63; result, distance m 200; result, elapsed ms 18; result, pairs linked 80 22.
Tool gp_near_repeat; parameters {"days": 30, "project": "721d878b-84af-42eb-9c9c-858bf9a6a75e", "features": {"layer": "Ignitions (73bb3d60)"}, "distance_m": 200.0, "time_field": "detected_at"}
Change point detection
What this analysis is. Change point detection: When did the level, count, trend or variability change 23? For the whole study area or for every bin 23. In ArcGIS it is Change Point Detection 23.
Why it was run on this data. Change point detection finds when the monthly count of Ignitions shifted 24.
What it found. Change point detection was executed using the tool gp_change_point_detection 6. The input data for the analysis was Ignitions 10. The tool summary reported that change point detection was successfully done, although no map output was generated 6.
Findings
Tool gp_change_point_detection; parameters {"method": "count", "project": "721d878b-84af-42eb-9c9c-858bf9a6a75e", "features": {"layer": "Ignitions (73bb3d60)"}, "interval": "month", "time_field": "detected_at"}
Summarize within
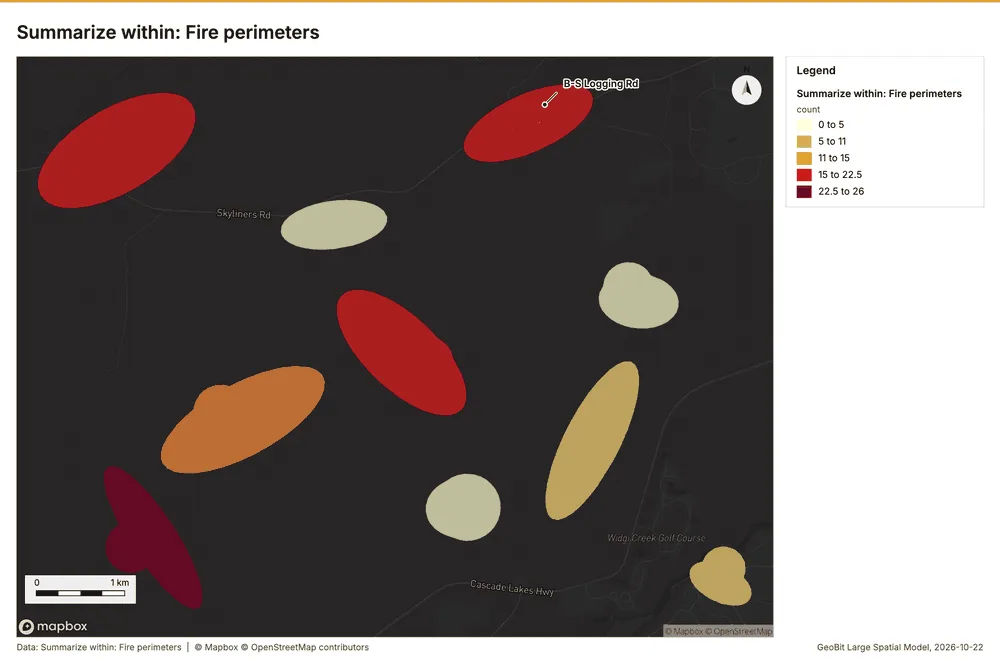
What this analysis is. Summarize within: Count and aggregate the features inside each polygon (or bin), proportionally for lines and polygons 25. In ArcGIS it is Summarize Within or Aggregate Points; in QGIS, native:countpointsinpolygon or native:sumlinelengths 25.
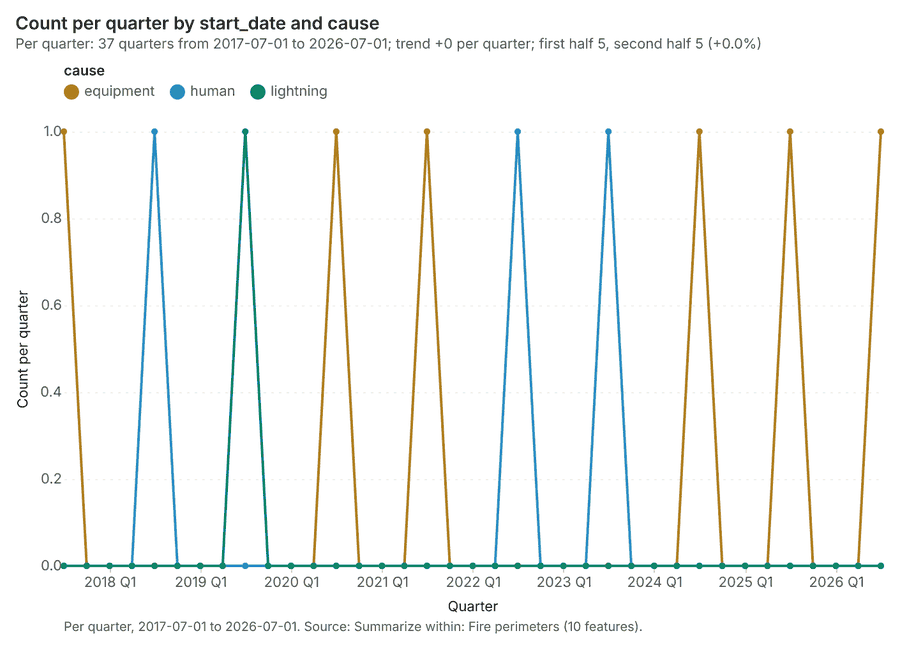
Why it was run on this data. Count Ignitions inside each feature of Fire perimeters by cause; the counts map as a choropleth (natural breaks, sequential colors) 26.
What it found. Summarize within on Ignitions, Fire perimeters: Summarize within: 1 layer saved: Summarize within: Fire perimeters (10 features) 101327. It reported result, count 10; result, elapsed ms 3; billing, cost 0.02822; billing, list price 0.02822; billing, upstream cost 0 27.
| Result | Value |
|---|---|
| result, count | 10 |
| result, elapsed ms | 3 |
| billing, cost | 0.02822 |
| billing, list price | 0.02822 |
| billing, upstream cost | 0 |
Findings
- Evidenced: Summarize within on Ignitions, Fire perimeters: Summarize within: 1 layer saved: Summarize within: Fire perimeters (10 features) 101327.
- Evidenced: It reported result, count 10; result, elapsed ms 3; billing, cost 0.02822; billing, list price 0.02822; billing, upstream cost 0 27.
Tool gp_summarize_within; parameters {"stats": [{"stat": "sum", "field": "final_acres"}], "project": "721d878b-84af-42eb-9c9c-858bf9a6a75e", "features": {"layer": "Ignitions (73bb3d60)"}, "group_by": "cause", "polygons": {"layer": "Fire perimeters (4401c868)"}}
Summarize within
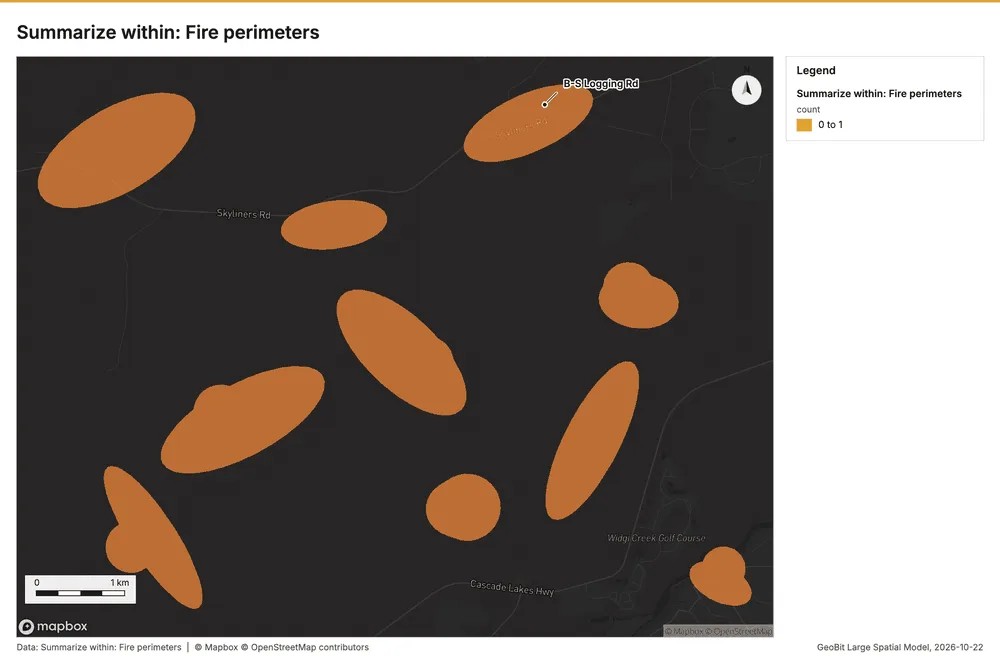
What this analysis is. Summarize within: Count and aggregate the features inside each polygon (or bin), proportionally for lines and polygons 25. In ArcGIS it is Summarize Within or Aggregate Points; in QGIS, native:countpointsinpolygon or native:sumlinelengths 25.
Why it was run on this data. Count Ignitions inside each feature of Fire perimeters by cause; the counts map as a choropleth (natural breaks, sequential colors) 26.
What it found. The analysis used Fire perimeters 13 and Fire lookouts 29 as inputs for the gp_summarize_within function 28.
| Result | Value |
|---|---|
| result, count | 10 |
| result, elapsed ms | 2 |
| billing, cost | 0.01028 |
| billing, list price | 0.01028 |
| billing, upstream cost | 0 |
Findings
- Evidenced: Summarize within on Fire lookouts, Fire perimeters: Summarize within: 1 layer saved: Summarize within: Fire perimeters (10 features) 132829.
- Evidenced: It reported result, count 10; result, elapsed ms 2; billing, cost 0.01028; billing, list price 0.01028; billing, upstream cost 0 28.
Tool gp_summarize_within; parameters {"stats": [{"stat": "sum", "field": "tower_height_m"}], "project": "721d878b-84af-42eb-9c9c-858bf9a6a75e", "features": {"layer": "Fire lookouts (81fdbe6e)"}, "group_by": "staffed", "polygons": {"layer": "Fire perimeters (4401c868)"}}
Summarize within
What this analysis is. Summarize within: Count and aggregate the features inside each polygon (or bin), proportionally for lines and polygons 25. In ArcGIS it is Summarize Within or Aggregate Points; in QGIS, native:countpointsinpolygon or native:sumlinelengths 25.
Why it was run on this data. Count Ignitions inside each feature of Fire perimeters by cause; the counts map as a choropleth (natural breaks, sequential colors) 26.
What it found. Summarize within on Weather stations, Fire perimeters: Summarize within: 1 layer saved: Summarize within: Fire perimeters (10 features) 133031. It reported result, count 10; result, elapsed ms 2; billing, cost 0.01034; billing, list price 0.01034; billing, upstream cost 0 30.
| Result | Value |
|---|---|
| result, count | 10 |
| result, elapsed ms | 2 |
| billing, cost | 0.01034 |
| billing, list price | 0.01034 |
| billing, upstream cost | 0 |
Findings
- Evidenced: Summarize within on Weather stations, Fire perimeters: Summarize within: 1 layer saved: Summarize within: Fire perimeters (10 features) 133031.
- Evidenced: It reported result, count 10; result, elapsed ms 2; billing, cost 0.01034; billing, list price 0.01034; billing, upstream cost 0 30.
Tool gp_summarize_within; parameters {"stats": [{"stat": "sum", "field": "elevation_m"}], "project": "721d878b-84af-42eb-9c9c-858bf9a6a75e", "features": {"layer": "Weather stations (6b183e69)"}, "polygons": {"layer": "Fire perimeters (4401c868)"}}
Zonal statistics
What this analysis is. Zonal statistics: count/min/max/mean/std/sum/median/majority per polygon as a table and as GeoJSON 32. In ArcGIS it is Zonal Statistics as Table (polygons) 32.
Why it was run on this data. Statistics of Forest terrain model (DEM) inside each feature of Fire perimeters 33.
What it found. The analysis utilized the zonal statistics tool, specifically tool rs_zonal_statistics 34. This tool summary indicates that the zonal statistics were run, yielding 10 row(s) for 10 zones 34. Available source information for this process is provided by rs_zonal_statistics at step 0 34.
Findings
Tool rs_zonal_statistics; parameters {"stats": ["mean", "min", "max", "std"], "zones": "Fire perimeters (4401c868)", "raster_id": "Forest terrain model (DEM) (71497b8b)"}
Zonal statistics
What this analysis is. Zonal statistics: count/min/max/mean/std/sum/median/majority per polygon as a table and as GeoJSON 32. In ArcGIS it is Zonal Statistics as Table (polygons) 32.
Why it was run on this data. Statistics of Forest terrain model (DEM) inside each feature of Fire perimeters 33.
What it found. The tool rs_zonal_statistics processes 12 rows and 12 zones 35. It is listed as the function rs_zonal_statistics during step 1 35.
Findings
Tool rs_zonal_statistics; parameters {"stats": ["mean", "min", "max", "std"], "zones": "Fuel treatments (d603668d)", "raster_id": "Forest terrain model (DEM) (71497b8b)"}
Zonal statistics
What this analysis is. Zonal statistics: count/min/max/mean/std/sum/median/majority per polygon as a table and as GeoJSON 32. In ArcGIS it is Zonal Statistics as Table (polygons) 32.
Why it was run on this data. Statistics of Forest terrain model (DEM) inside each feature of Fire perimeters 33.
What it found. The Zonal statistics analysis utilized the rs_zonal_statistics tool 36. The tool summary indicates that Zonal statistics generated 36 row(s) 36.
Findings
Tool rs_zonal_statistics; parameters {"stats": ["mean", "min", "max", "std"], "zones": "Fuel units (42f78cee)", "raster_id": "Forest terrain model (DEM) (71497b8b)"}
Find point clusters
What this analysis is. Find point clusters: Density-based clusters (DBSCAN, HDBSCAN or OPTICS, optionally space-time) with hulls and noise 37. In ArcGIS it is Find Point Clusters or Density-based Clustering; in QGIS, native:dbscanclustering or native:stdbscanclustering 37.
Why it was run on this data. DBSCAN finds dense groups of Ignitions and separates noise 38.
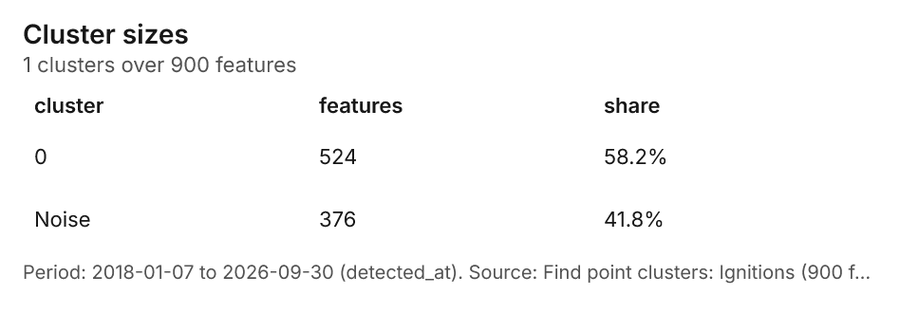
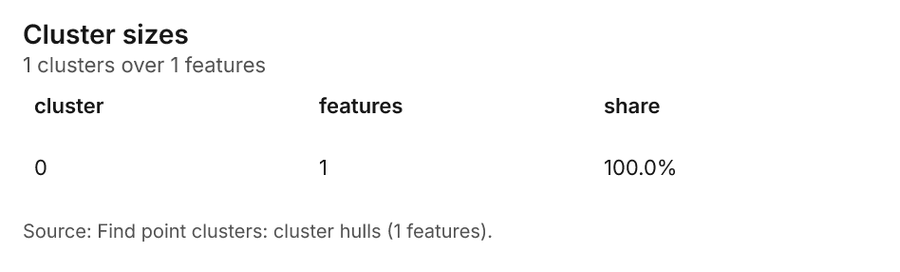
What it found. Find point clusters on Ignitions: Find point clusters: 2 layers saved: Find point clusters: Ignitions (900 features); Find point clusters: cluster hulls (1 feature) 1039. It reported result, count 900; result, noise 376; result, distance m 500; result, elapsed ms 15; result, min points 20; billing, cost 0.068 39.
| Result | Value |
|---|---|
| result, count | 900 |
| result, noise | 376 |
| result, distance m | 500 |
| result, elapsed ms | 15 |
| result, min points | 20 |
| billing, cost | 0.068 |
| billing, list price | 0.068 |
| billing, upstream cost | 0 |
Findings
- Evidenced: Find point clusters on Ignitions: Find point clusters: 2 layers saved: Find point clusters: Ignitions (900 features); Find point clusters: cluster hulls (1 feature) 1039.
- Evidenced: It reported result, count 900; result, noise 376; result, distance m 500; result, elapsed ms 15; result, min points 20; billing, cost 0.068 39.
Tool gp_find_point_clusters; parameters {"method": "dbscan", "project": "721d878b-84af-42eb-9c9c-858bf9a6a75e", "features": {"layer": "Ignitions (73bb3d60)"}, "distance_m": 500.0, "min_points": 20}
Nearest neighbor index
What this analysis is. Average nearest neighbor: Clark-Evans ratio: clustered, dispersed or random 40. In ArcGIS it is Average Nearest Neighbor; in QGIS, native:nearestneighbouranalysis 40.
Why it was run on this data. The average nearest neighbor ratio says whether Ignitions are clustered, random or dispersed 41.
What it found. Nearest neighbor index on Ignitions: Average nearest neighbor: done; no map output 1042. It reported result, n 900; result, p value 0; result, z score -9.013; result, elapsed ms 4; result, study area m2 76,190,873; result, nearest neighbor ratio 0.843 42.
| Result | Value |
|---|---|
| result, n | 900 |
| result, p value | 0 |
| result, z score | -9.013 |
| result, elapsed ms | 4 |
| result, study area m2 | 76,190,873 |
| result, nearest neighbor ratio | 0.843 |
| result, expected mean distance m | 145.5 |
| result, observed mean distance m | 122.6 |
| billing, cost | 0.02 |
| billing, list price | 0.02 |
| billing, upstream cost | 0 |
Findings
- Evidenced: Nearest neighbor index on Ignitions: Average nearest neighbor: done; no map output 1042.
- Evidenced: It reported result, n 900; result, p value 0; result, z score -9.013; result, elapsed ms 4; result, study area m2 76,190,873; result, nearest neighbor ratio 0.843 42.
Tool gp_nearest_neighbor_index; parameters {"project": "721d878b-84af-42eb-9c9c-858bf9a6a75e", "features": {"layer": "Ignitions (73bb3d60)"}}
Nearest neighbor index
What this analysis is. Average nearest neighbor: Clark-Evans ratio: clustered, dispersed or random 40. In ArcGIS it is Average Nearest Neighbor; in QGIS, native:nearestneighbouranalysis 40.
Why it was run on this data. The average nearest neighbor ratio says whether Weather stations are clustered, random or dispersed 43.
What it found. The nearest neighbor index tool was applied using Weather stations 31 and calculated a nearest neighbor ratio of 2.891 44.
| Result | Value |
|---|---|
| result, n | 6 |
| result, p value | 0 |
| result, z score | 8.863 |
| result, elapsed ms | 0 |
| result, study area m2 | 26,350,582 |
| result, nearest neighbor ratio | 2.891 |
| result, expected mean distance m | 1,048 |
| result, observed mean distance m | 3,030 |
| billing, cost | 0.02 |
| billing, list price | 0.02 |
| billing, upstream cost | 0 |
Findings
- Evidenced: Nearest neighbor index on Weather stations: Average nearest neighbor: done; no map output 3144.
- Evidenced: It reported result, n 6; result, p value 0; result, z score 8.863; result, elapsed ms 0; result, study area m2 26,350,582; result, nearest neighbor ratio 2.891 44.
Tool gp_nearest_neighbor_index; parameters {"project": "721d878b-84af-42eb-9c9c-858bf9a6a75e", "features": {"layer": "Weather stations (6b183e69)"}}
Calculate density
What this analysis is. Calculate density: Kernel density per square kilometer on a grid 45. In ArcGIS it is Calculate Density or Kernel Density; in QGIS, native:heatmapkerneldensityestimation 45.
Why it was run on this data. 900 points in Ignitions: a density surface shows where they concentrate 46.
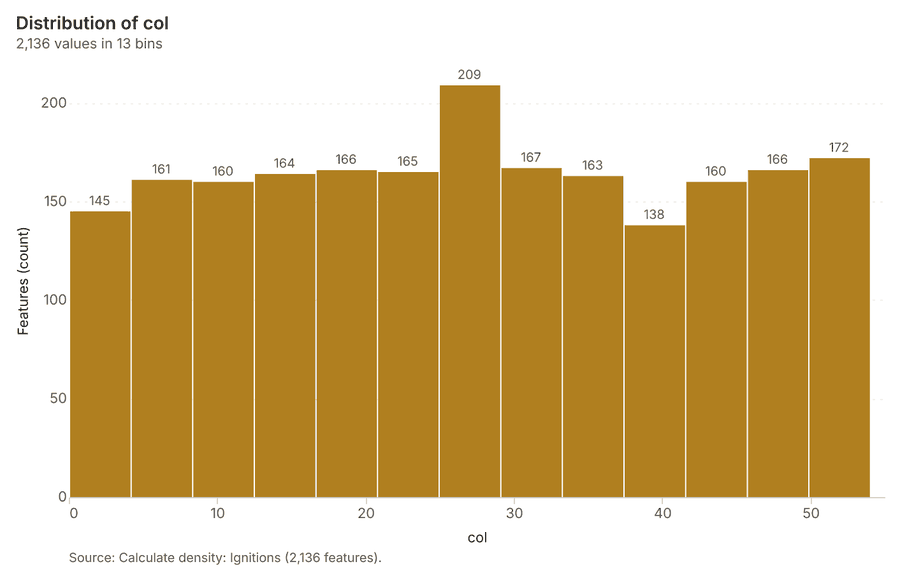
What it found. The density calculation utilized the Ignitions data 10, resulting in 2,136 features 47. The process was completed in 61 elapsed milliseconds 47, using a 500 meter bandwidth and a 200 meter cell size 47.
| Result | Value |
|---|---|
| result, count | 2,136 |
| result, elapsed ms | 61 |
| result, bandwidth m | 500 |
| result, cell size m | 200 |
| result, excluded null | 0 |
| result, max density per km2 | 102.6 |
| billing, cost | 0.068 |
| billing, list price | 0.068 |
| billing, upstream cost | 0 |
Findings
- Evidenced: Calculate density on Ignitions: Calculate density: 1 layer saved: Calculate density: Ignitions (2136 features) 1047.
- Evidenced: It reported result, count 2,136; result, elapsed ms 61; result, bandwidth m 500; result, cell size m 200; result, excluded null 0; result, max density per km2 102.6 47.
Tool gp_calculate_density; parameters {"kernel": "quartic", "project": "721d878b-84af-42eb-9c9c-858bf9a6a75e", "features": {"layer": "Ignitions (73bb3d60)"}, "bandwidth_m": 500.0, "cell_size_m": 200.0}
Outliers
What this analysis is. Find outliers: Anselin local Moran’s I: HH, LL clusters and HL, LH outliers 48. In ArcGIS it is Find Outliers or Cluster and Outlier Analysis (Anselin Local Moran’s I) 48.
Why it was run on this data. Local Moran's I maps clusters and outliers of 'acres' 49.
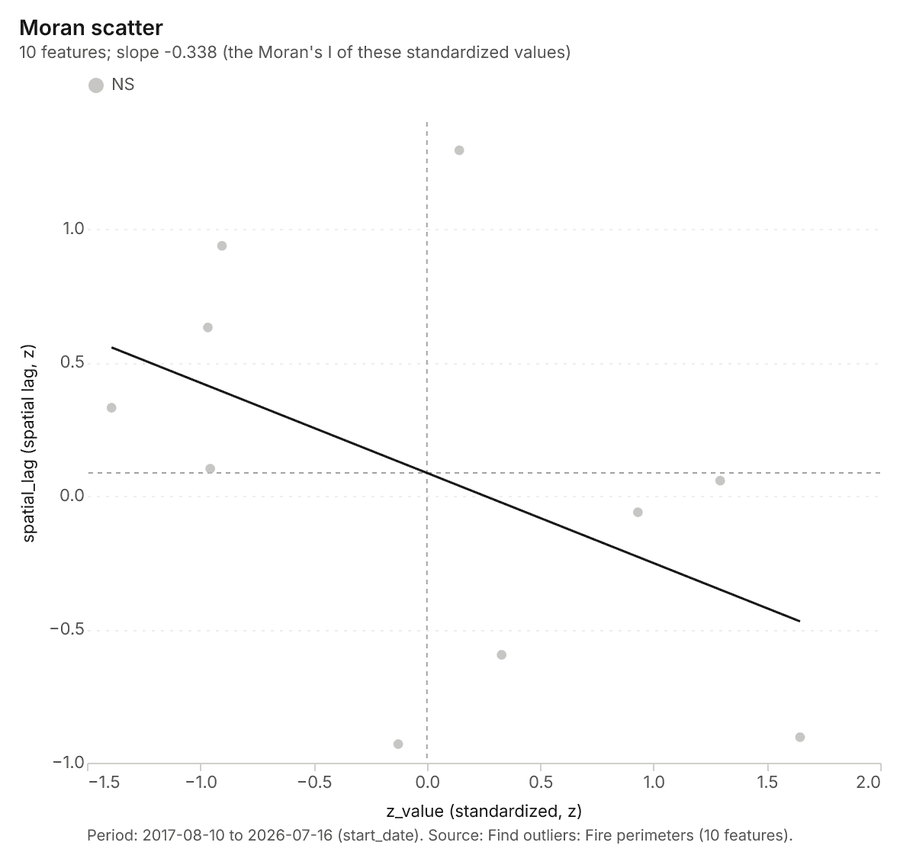
What it found. Outliers on Fire perimeters: Find outliers: 1 layer saved: Find outliers: Fire perimeters (10 features) 1350. It reported result, count 10; result, elapsed ms 8; result, permutations 199; result, excluded null 0; result, distance band m 2,652; billing, cost 0.0503 50.
| Result | Value |
|---|---|
| result, count | 10 |
| result, elapsed ms | 8 |
| result, permutations | 199 |
| result, excluded null | 0 |
| result, distance band m | 2,652 |
| billing, cost | 0.0503 |
| billing, list price | 0.0503 |
| billing, upstream cost | 0 |
Findings
- Evidenced: Outliers on Fire perimeters: Find outliers: 1 layer saved: Find outliers: Fire perimeters (10 features) 1350.
- Evidenced: It reported result, count 10; result, elapsed ms 8; result, permutations 199; result, excluded null 0; result, distance band m 2,652; billing, cost 0.0503 50.
Tool gp_outliers; parameters {"field": "acres", "project": "721d878b-84af-42eb-9c9c-858bf9a6a75e", "features": {"layer": "Fire perimeters (4401c868)"}, "aggregation": "hexagon"}
Outliers
What this analysis is. Find outliers: Anselin local Moran’s I: HH, LL clusters and HL, LH outliers 48. In ArcGIS it is Find Outliers or Cluster and Outlier Analysis (Anselin Local Moran’s I) 48.
Why it was run on this data. Local Moran's I maps clusters and outliers of 'acres' 51.
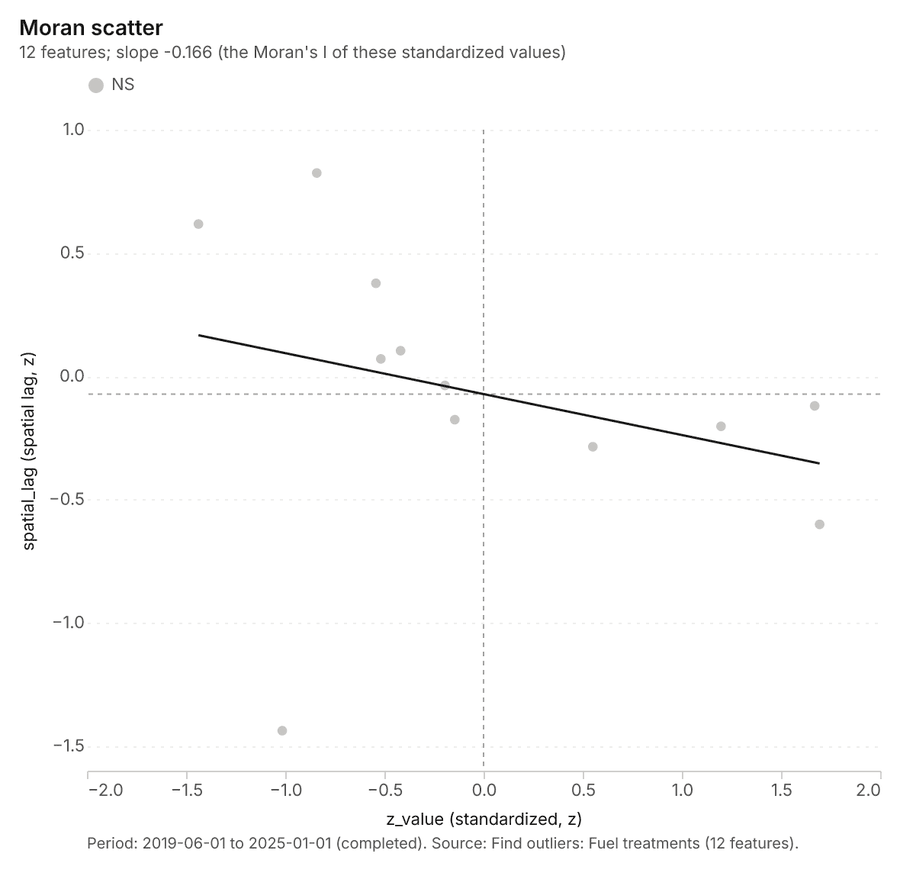
What it found. Outliers on Fuel treatments: Find outliers: 1 layer saved: Find outliers: Fuel treatments (12 features) 1652. It reported result, count 12; result, elapsed ms 3; result, permutations 199; result, excluded null 0; result, distance band m 2,799; billing, cost 0.05036 52.
| Result | Value |
|---|---|
| result, count | 12 |
| result, elapsed ms | 3 |
| result, permutations | 199 |
| result, excluded null | 0 |
| result, distance band m | 2,799 |
| billing, cost | 0.05036 |
| billing, list price | 0.05036 |
| billing, upstream cost | 0 |
Findings
- Evidenced: Outliers on Fuel treatments: Find outliers: 1 layer saved: Find outliers: Fuel treatments (12 features) 1652.
- Evidenced: It reported result, count 12; result, elapsed ms 3; result, permutations 199; result, excluded null 0; result, distance band m 2,799; billing, cost 0.05036 52.
Tool gp_outliers; parameters {"field": "acres", "project": "721d878b-84af-42eb-9c9c-858bf9a6a75e", "features": {"layer": "Fuel treatments (d603668d)"}, "aggregation": "hexagon"}
Outliers
What this analysis is. Find outliers: Anselin local Moran’s I: HH, LL clusters and HL, LH outliers 48. In ArcGIS it is Find Outliers or Cluster and Outlier Analysis (Anselin Local Moran’s I) 48.
Why it was run on this data. Local Moran's I maps clusters and outliers of 'fuel_load_t_ha' 53.
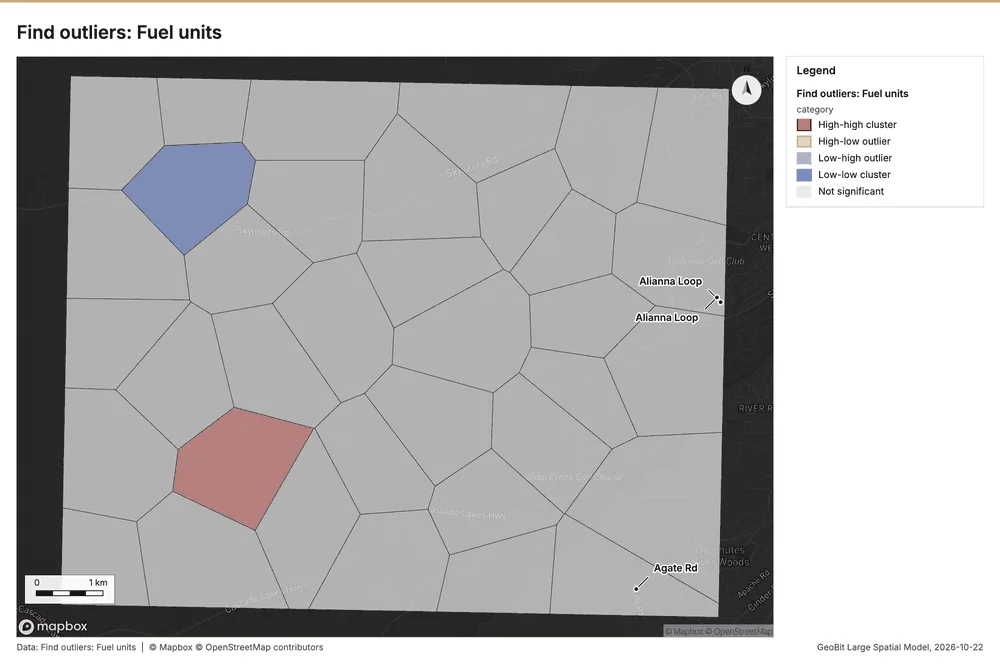
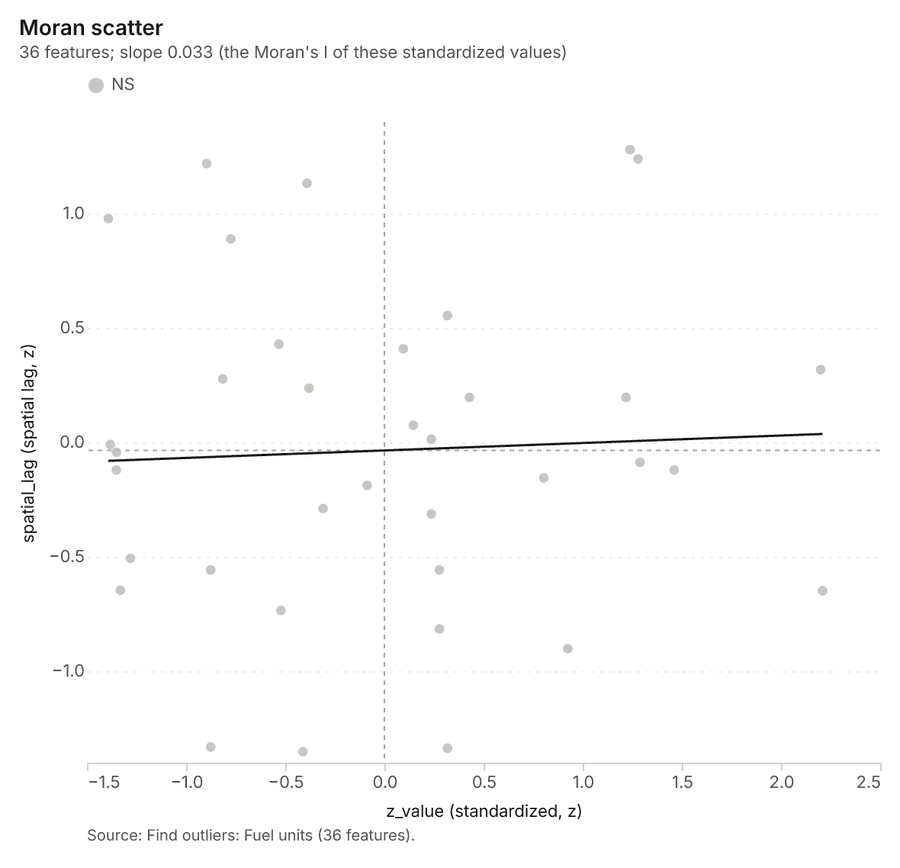
What it found. The outlier analysis was performed on the Fuel units layer using the gp_outliers tool 54, which successfully saved 1 layer and analyzed 36 features 54. Key results indicate a result count of 36, and the process required an elapsed time of 2 milliseconds 54.
| Result | Value |
|---|---|
| result, count | 36 |
| result, elapsed ms | 2 |
| result, permutations | 199 |
| result, excluded null | 0 |
| result, distance band m | 1,580 |
| billing, cost | 0.05108 |
| billing, list price | 0.05108 |
| billing, upstream cost | 0 |
Findings
- Evidenced: Outliers on Fuel units: Find outliers: 1 layer saved: Find outliers: Fuel units (36 features) 5455.
- Evidenced: It reported result, count 36; result, elapsed ms 2; result, permutations 199; result, excluded null 0; result, distance band m 1,580; billing, cost 0.05108 54.
Tool gp_outliers; parameters {"field": "fuel_load_t_ha", "project": "721d878b-84af-42eb-9c9c-858bf9a6a75e", "features": {"layer": "Fuel units (42f78cee)"}, "aggregation": "hexagon"}
Maps and charts
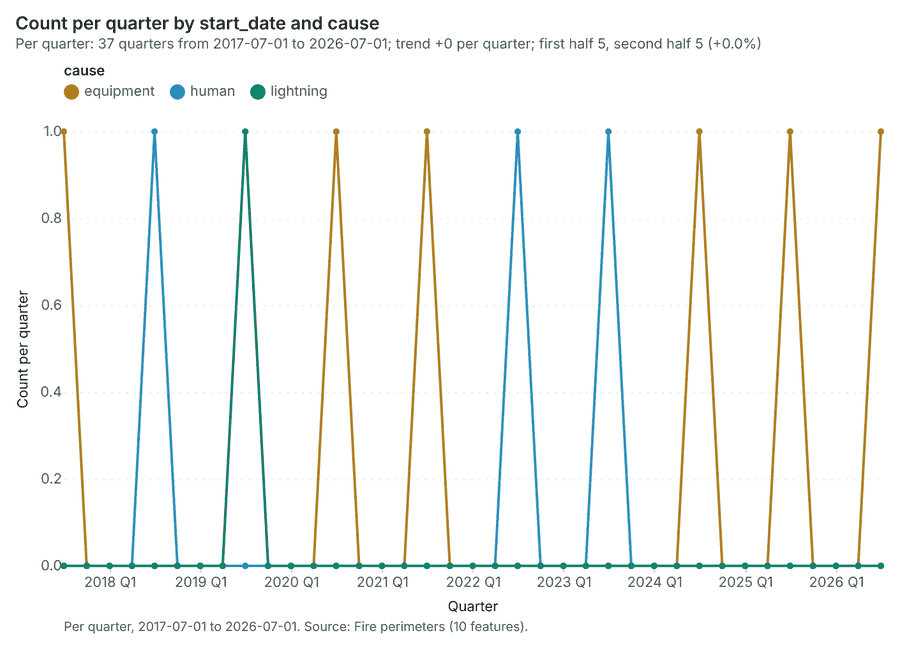
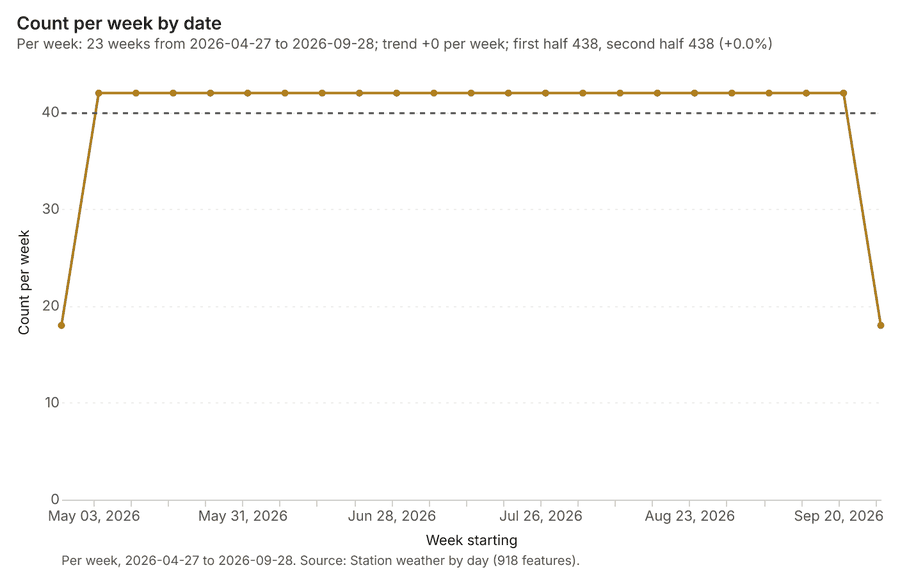
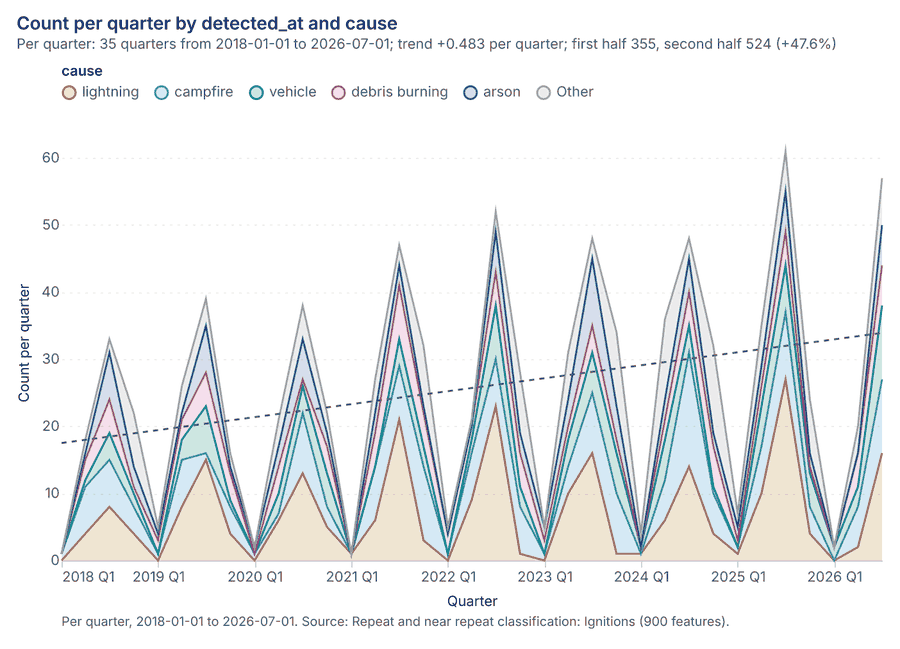
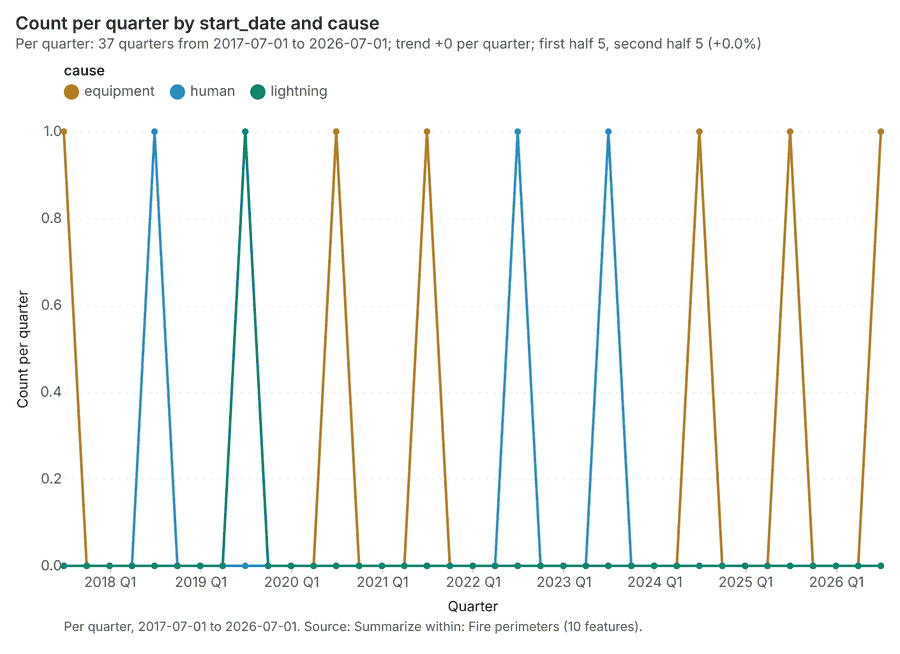
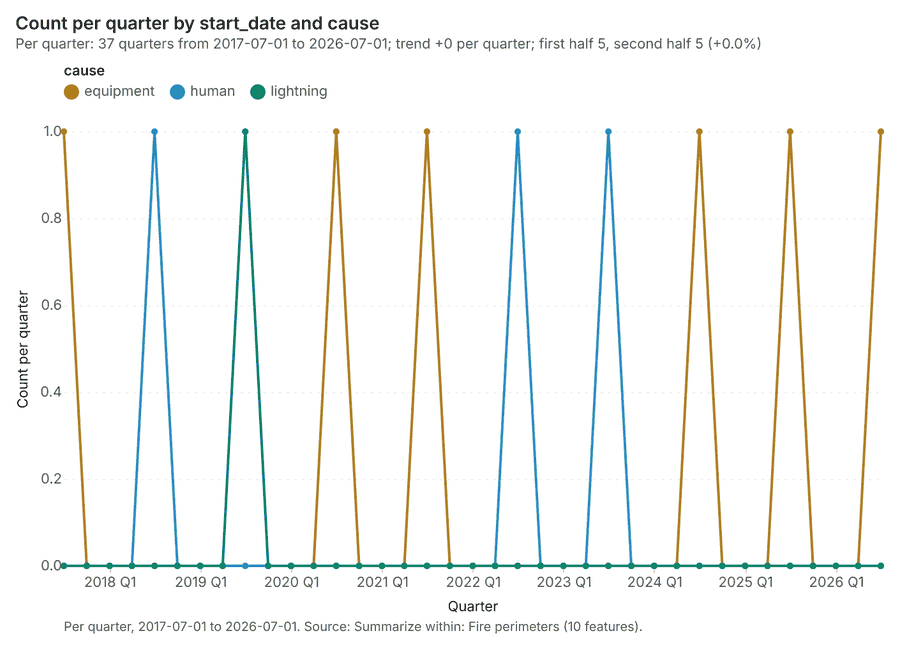
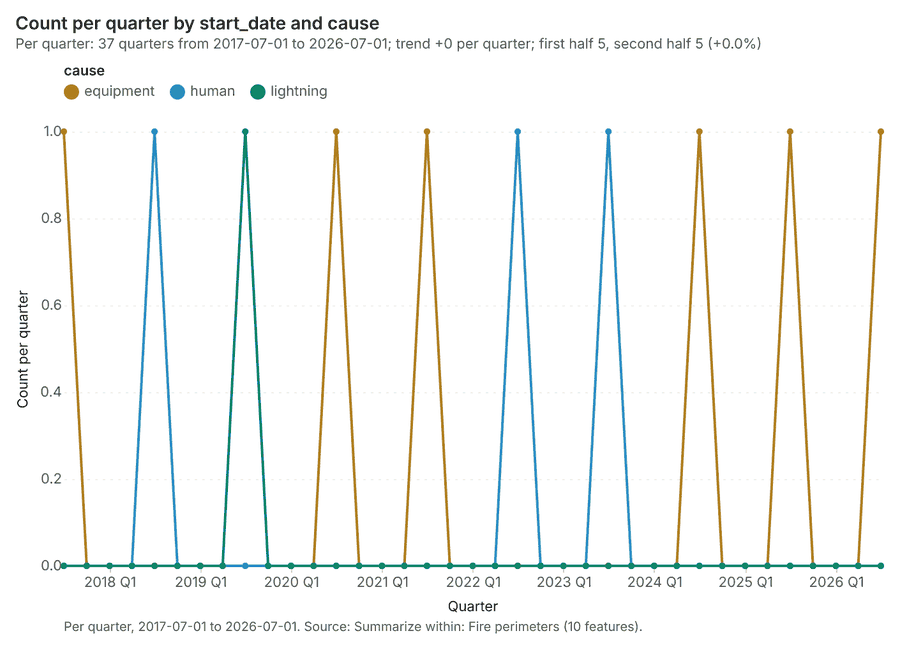
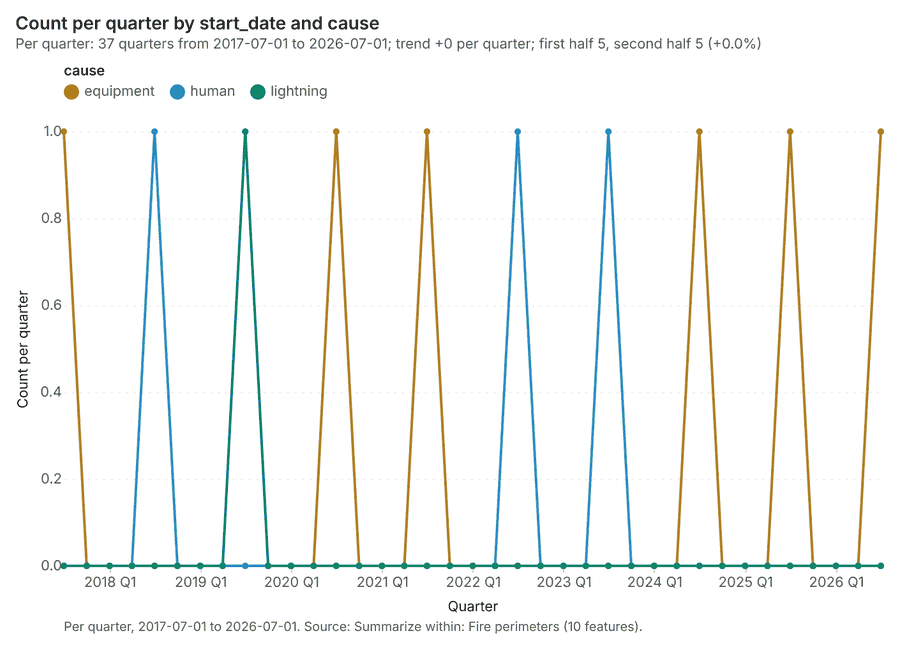
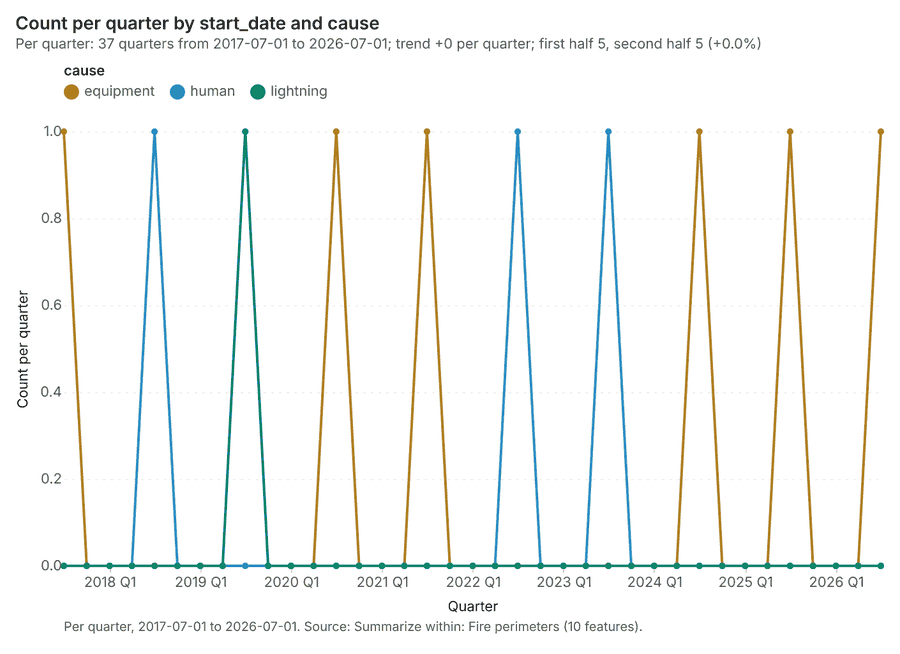
The run also made 17 map image(s) 5657585960616263646566676869707172 and 25 chart(s) 73747576777879808182838485868788899091929394959697.
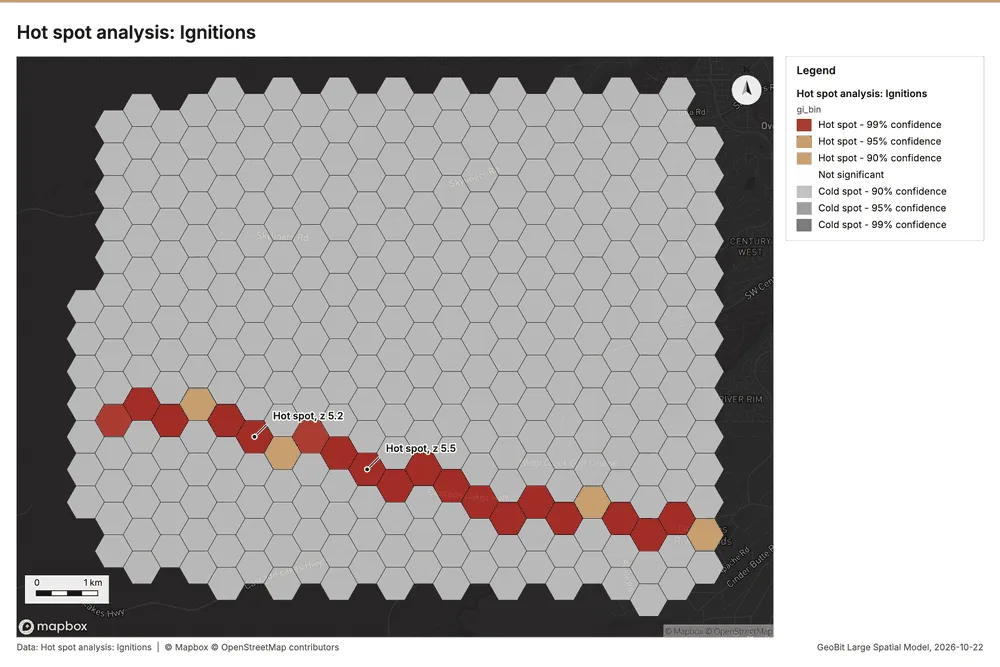
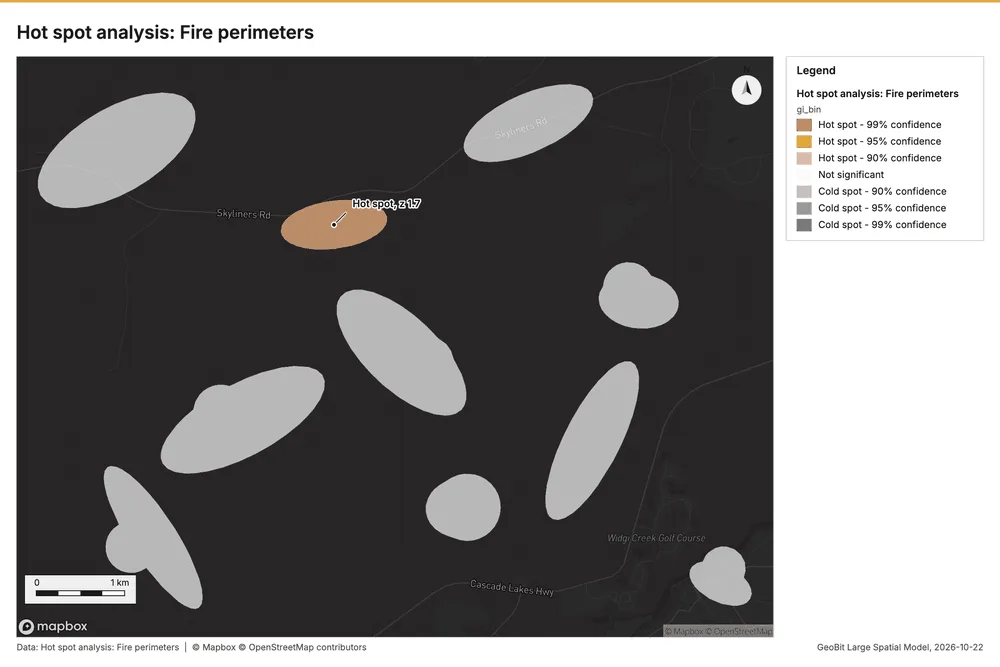
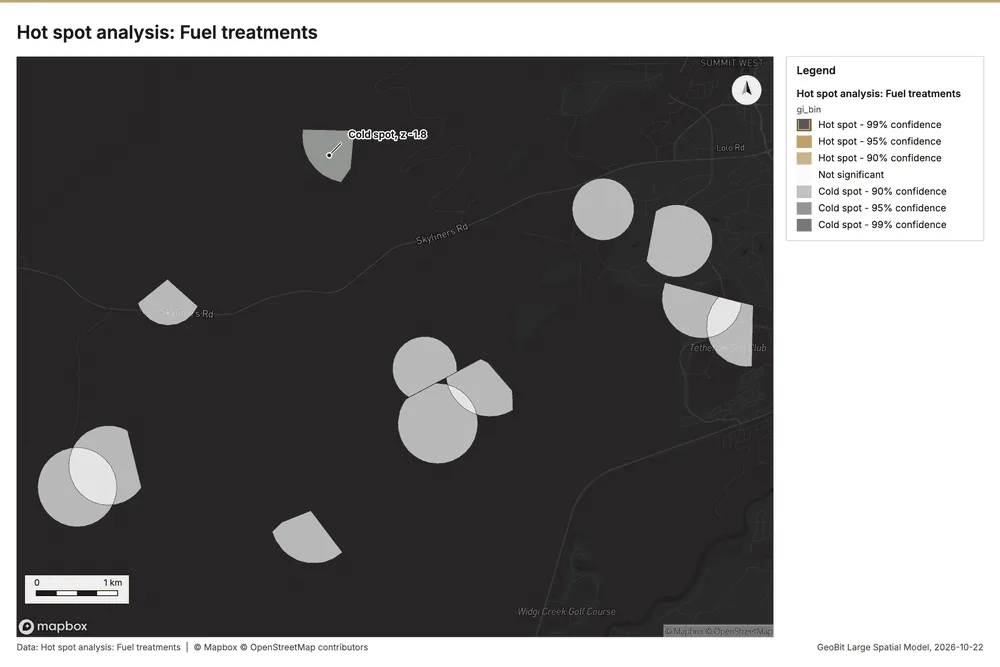
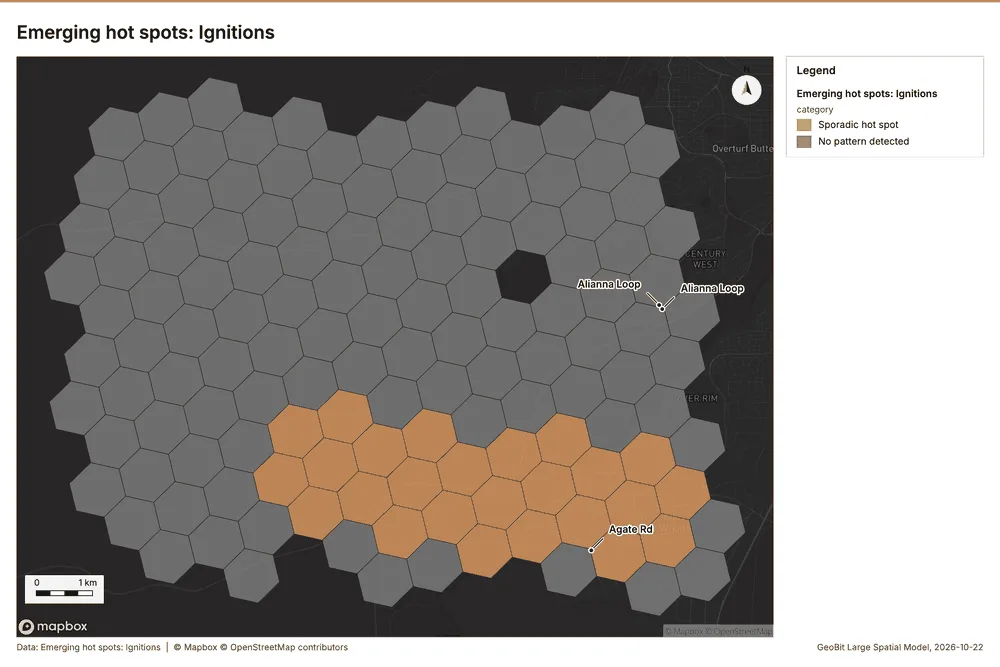
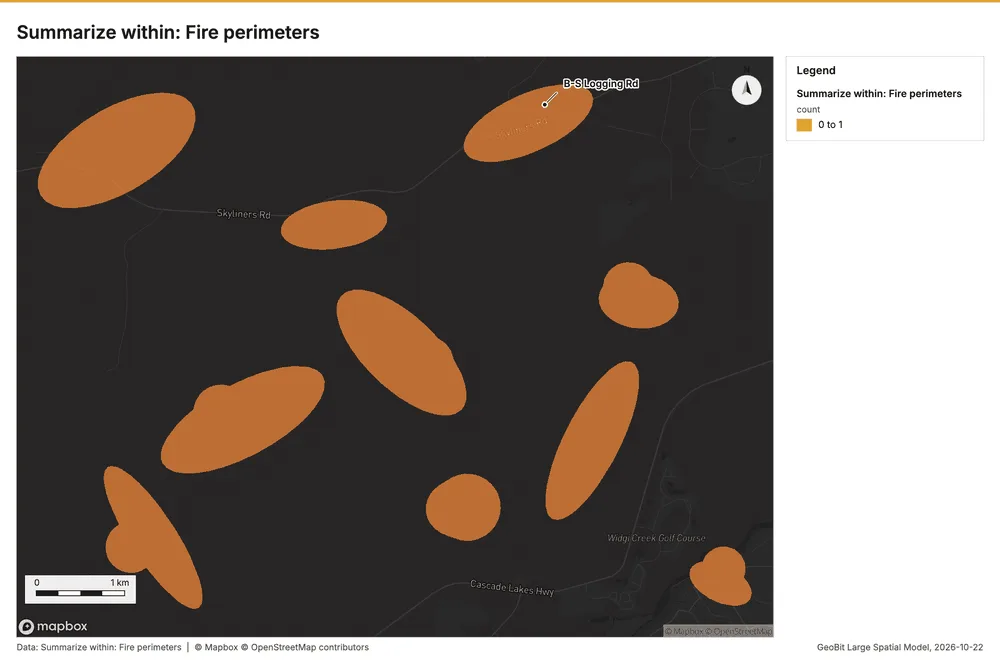
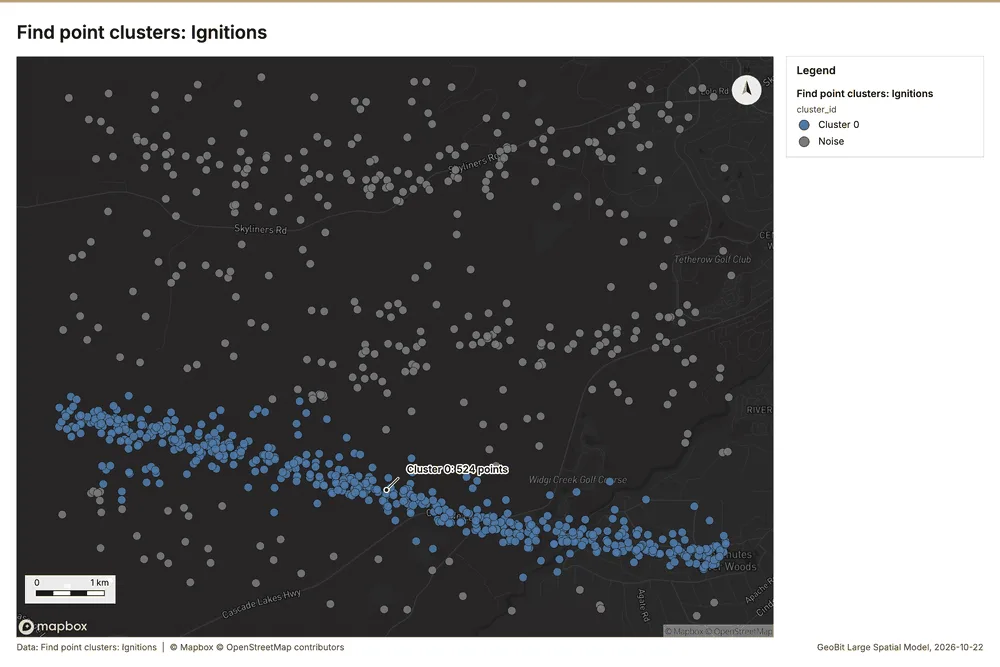
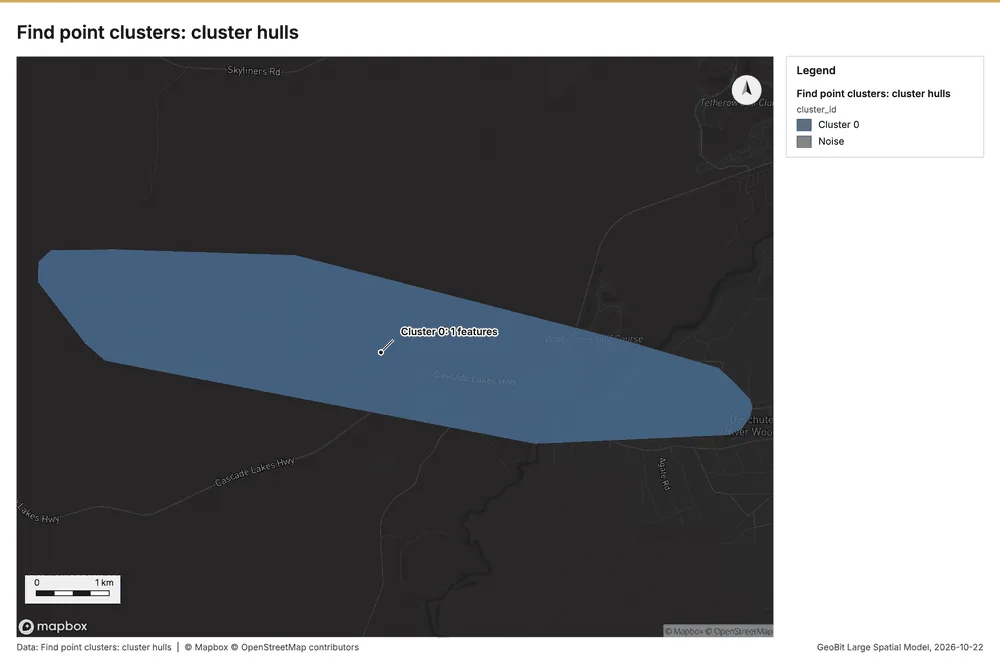
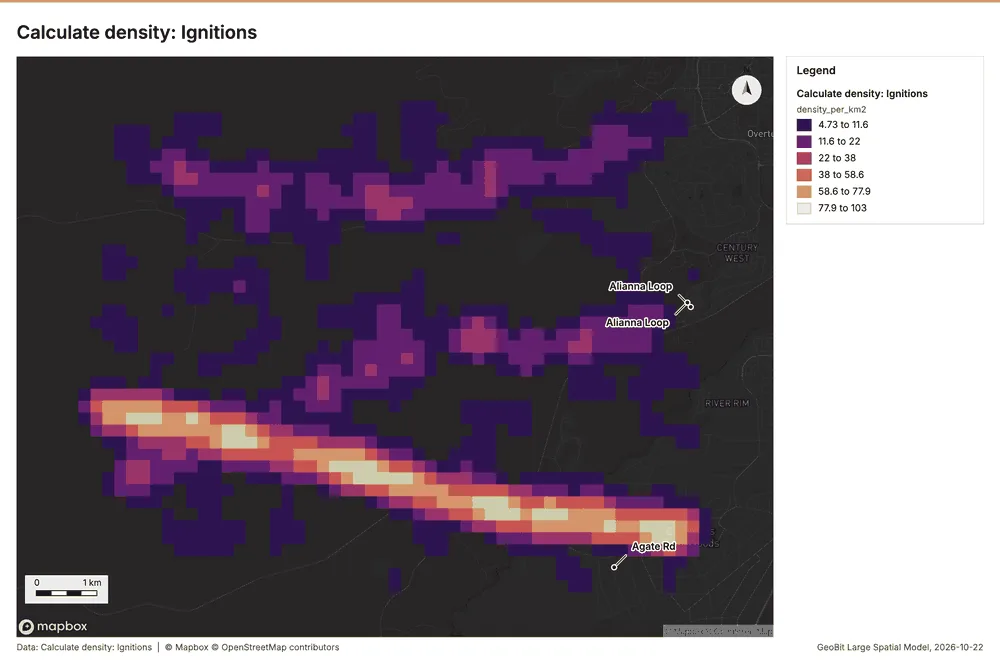
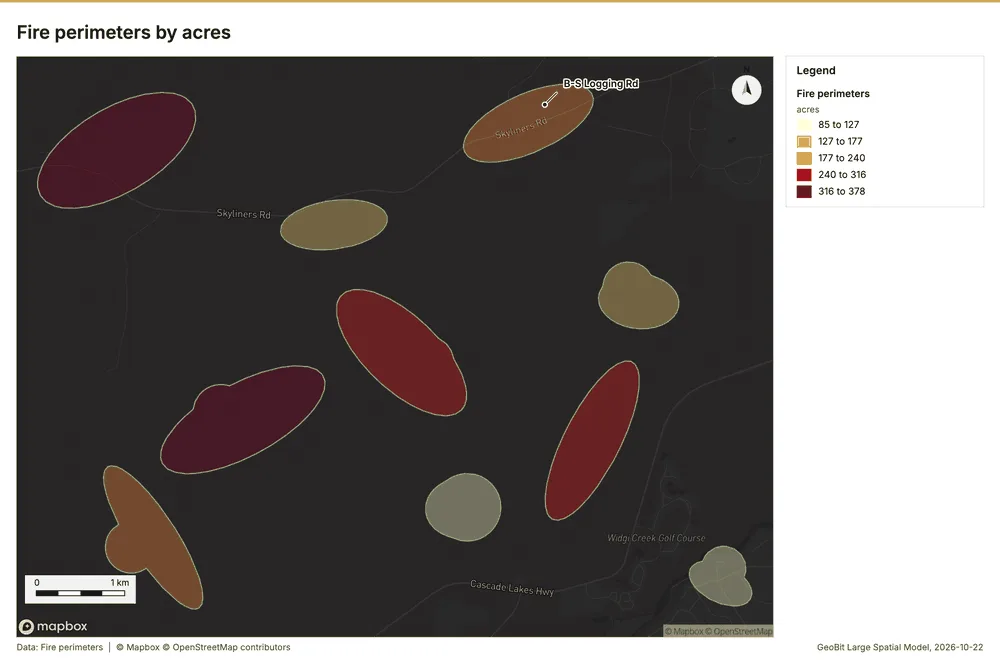
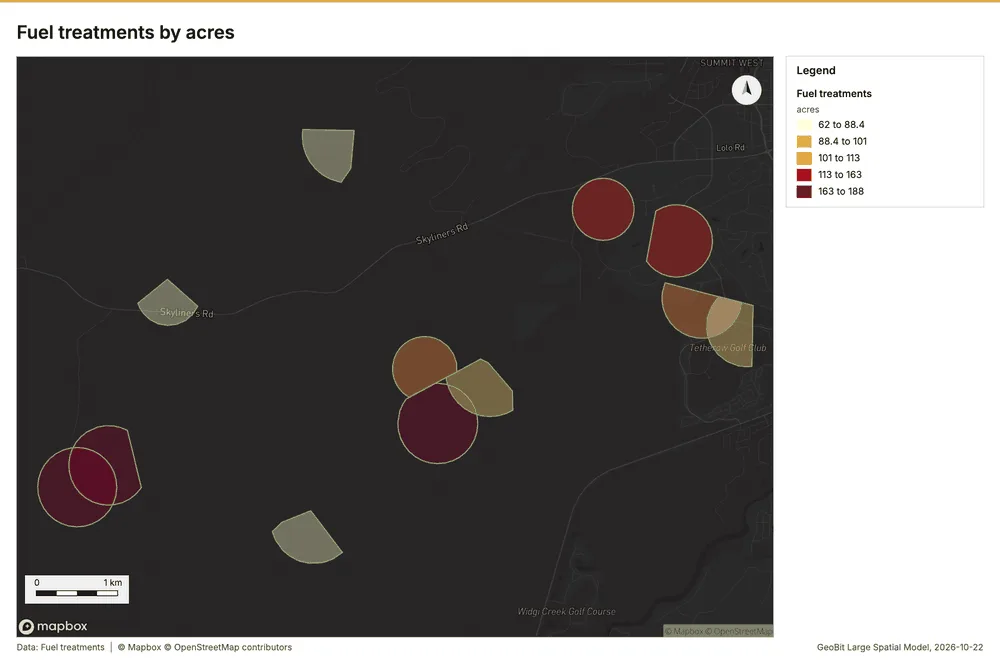
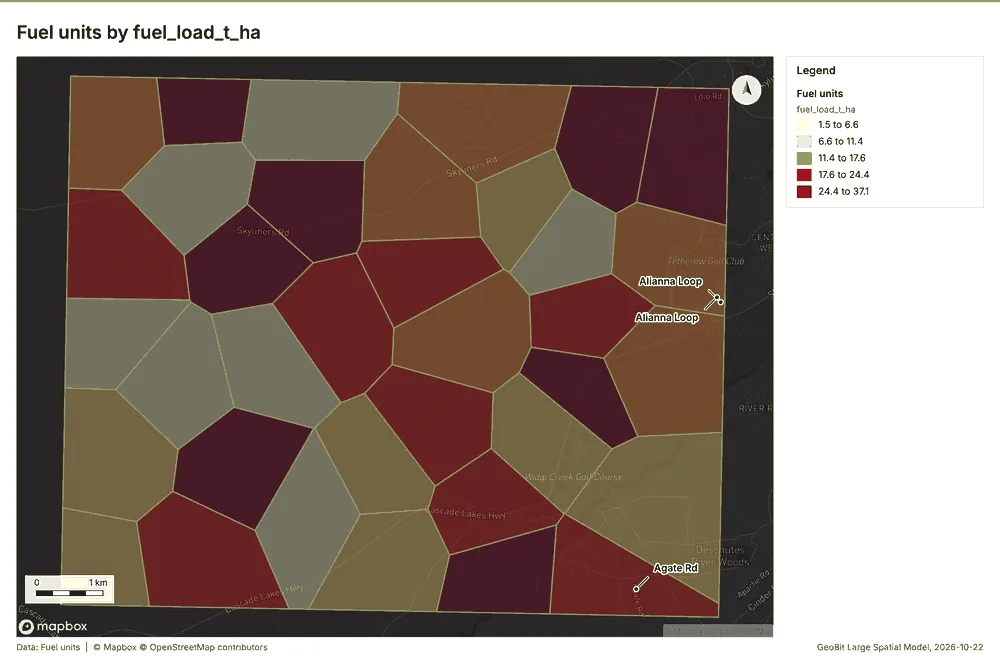
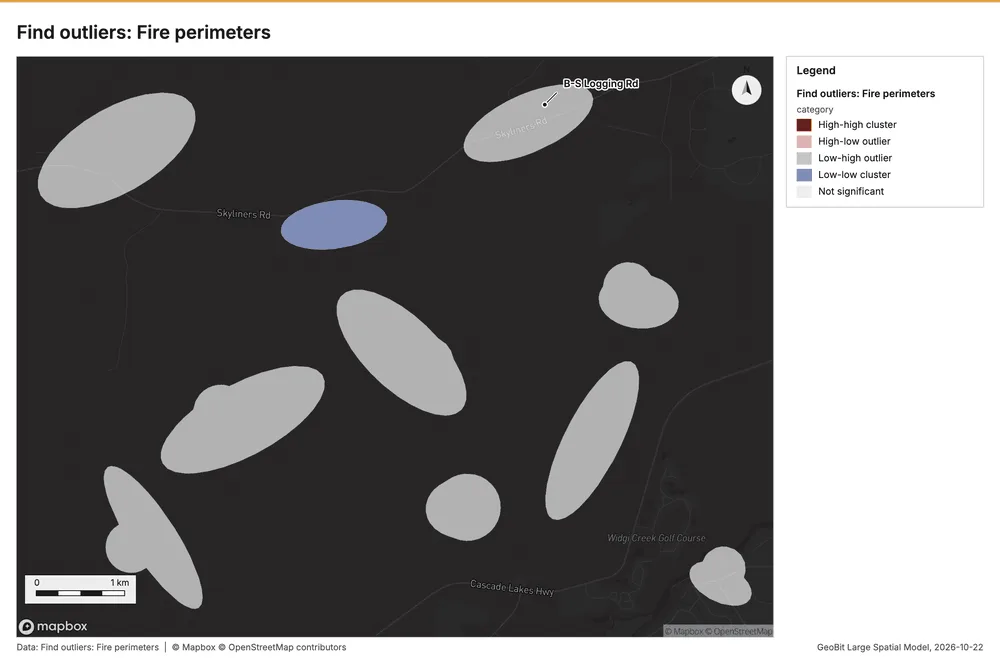
What the map shows. The map displays a clear, concentrated hot spot pattern for ignitions, showing a pronounced band of elevated activity 56
Inferred: read from the image by gemma4:e4b, not evidence.
Changes since the last run
This is the first report of this project.
Sources
- 1Rendering: Chart: Timeline: events per quarter by dataset. 148 rows id 797c6488-16c8-42a7-904d-8adb7f974668
- 2Dataset: Fire perimeters. vector, 10 rows id 0b1e7d40-89ae-4b37-84e1-6536d5653088
- 3Dataset: Ignitions. vector, 900 rows id 02464168-4470-4a98-855b-8ef6d9cdbfa9
- 4Dataset: Fuel treatments. vector, 12 rows id cfd664dc-8716-42bf-982f-5f1be0e31a76
- 5Dataset: Station weather by day. table, 918 rows id 6ea34ef2-dc8d-4e46-8fa7-1ac3431365c9
- 6Tool result: gp_change_point_detection, step 2. Change point detection: done; no map output. id 47a00a32-eb67-4c26-bfcb-905c59a0b600:2
- 7Catalog: Hot spot analysis (operation catalog, gp_hot_spots). Getis-Ord Gi* hot and cold spots with z-scores, p-values and confidence bins. ArcGIS: Find Hot Spots, Hot Spot Analysis (Getis-Ord Gi*). QGIS: qgis:hotspot (plugin). id gp_hot_spots
- 8Plan: Hot spots of Ignitions (the Start plan's candidate c_0e0a46dce832). 900 points: Getis-Ord Gi* tests whether the concentrations in Ignitions are statistically significant. id 186bc213-2630-4d8c-bbef-bc1854404d12:c_0e0a46dce832
- 9Tool result: gp_hot_spots, step 0. Hot spot analysis: 1 layer saved: Hot spot analysis: Ignitions (344 features). id 8f951621-3c96-471a-b3ef-37aee18172da:0
- 10Layer: Ignitions. 900 features id 73bb3d60-f194-4b32-b9a6-832891cc6297
- 11Plan: Hot spots of Fire perimeters (the Start plan's candidate c_9b033ea5babc). Gi* hot spots of 'acres' across the areas. id 186bc213-2630-4d8c-bbef-bc1854404d12:c_9b033ea5babc
- 12Tool result: gp_hot_spots, step 1. Hot spot analysis: 1 layer saved: Hot spot analysis: Fire perimeters (10 features). id 8f951621-3c96-471a-b3ef-37aee18172da:1
- 13Layer: Fire perimeters. 10 features id 4401c868-dc08-4f13-9bc9-d6e9bb6c8164
- 14Plan: Hot spots of Fuel treatments (the Start plan's candidate c_a70567ae8653). Gi* hot spots of 'acres' across the areas. id 186bc213-2630-4d8c-bbef-bc1854404d12:c_a70567ae8653
- 15Tool result: gp_hot_spots, step 2. Hot spot analysis: 1 layer saved: Hot spot analysis: Fuel treatments (12 features). id 8f951621-3c96-471a-b3ef-37aee18172da:2
- 16Layer: Fuel treatments. 12 features id d603668d-1752-4332-9003-5646b7e22e12
- 17Catalog: Emerging hot spots (operation catalog, gp_space_time_hot_spots). Where hot spots are new, consecutive, intensifying, persistent, diminishing, sporadic, oscillating or historical over time. ArcGIS: Emerging Hot Spot Analysis, Create Space Time Cube. id gp_space_time_hot_spots
- 18Plan: Space time hot spots of Ignitions (the Start plan's candidate c_60f3f9ce8f26). Ignitions carry dates in 'detected_at': emerging hot spot analysis finds new, intensifying and fading hot spots per month. id 186bc213-2630-4d8c-bbef-bc1854404d12:c_60f3f9ce8f26
- 19Tool result: gp_space_time_hot_spots, step 0. Emerging hot spots: 1 layer saved: Emerging hot spots: Ignitions (135 features). id 47a00a32-eb67-4c26-bfcb-905c59a0b600:0
- 20Catalog: Repeat and near repeat classification (operation catalog, gp_near_repeat). Classify incidents as originators, repeats (same place) or near repeats within a distance and time window, with a Knox test table. ArcGIS: Repeat and Near Repeat Classification, Near Repeat Calculator. id gp_near_repeat
- 21Plan: Near repeat of Ignitions (the Start plan's candidate c_10f86c3efd81). Near repeat analysis tests whether Ignitions close in space also follow each other within 30 days. id 186bc213-2630-4d8c-bbef-bc1854404d12:c_10f86c3efd81
- 22Tool result: gp_near_repeat, step 1. Repeat and near repeat classification: 1 layer saved: Repeat and near repeat classification: Ignitions (900 features). id 47a00a32-eb67-4c26-bfcb-905c59a0b600:1
- 23Catalog: Change point detection (operation catalog, gp_change_point_detection). When did the level, count, trend or variability change? For the whole study area or for every bin. ArcGIS: Change Point Detection. id gp_change_point_detection
- 24Plan: Change points of Ignitions (the Start plan's candidate c_03da66dfe7e8). Change point detection finds when the monthly count of Ignitions shifted. id 186bc213-2630-4d8c-bbef-bc1854404d12:c_03da66dfe7e8
- 25Catalog: Summarize within (operation catalog, gp_summarize_within). Count and aggregate the features inside each polygon (or bin), proportionally for lines and polygons. ArcGIS: Summarize Within, Aggregate Points. QGIS: native:countpointsinpolygon, native:sumlinelengths. id gp_summarize_within
- 26Plan: Ignitions per feature of Fire perimeters (the Start plan's candidate c_2c750e088dcf). Count Ignitions inside each feature of Fire perimeters by cause; the counts map as a choropleth (natural breaks, sequential colors). id 186bc213-2630-4d8c-bbef-bc1854404d12:c_2c750e088dcf
- 27Tool result: gp_summarize_within, step 0. Summarize within: 1 layer saved: Summarize within: Fire perimeters (10 features). id d0d6a5af-89c4-4ed0-a643-2d3531685abc:0
- 28Tool result: gp_summarize_within, step 1. Summarize within: 1 layer saved: Summarize within: Fire perimeters (10 features). id d0d6a5af-89c4-4ed0-a643-2d3531685abc:1
- 29Layer: Fire lookouts. 3 features id 81fdbe6e-83c1-4f4d-8dc9-e59c43c15d96
- 30Tool result: gp_summarize_within, step 2. Summarize within: 1 layer saved: Summarize within: Fire perimeters (10 features). id d0d6a5af-89c4-4ed0-a643-2d3531685abc:2
- 31Layer: Weather stations. 6 features id 6b183e69-c85a-4bf5-8192-07431db200f4
- 32Catalog: Zonal statistics (analysis catalog, rs_zonal_statistics). count/min/max/mean/std/sum/median/majority per polygon as a table and as GeoJSON. ArcGIS: Zonal Statistics as Table (polygons). id rs_zonal_statistics
- 33Plan: Zonal statistics of Forest terrain model (DEM) and Fire perimeters (the Start plan's candidate c_f8c34509825d). Statistics of Forest terrain model (DEM) inside each feature of Fire perimeters. id 186bc213-2630-4d8c-bbef-bc1854404d12:c_f8c34509825d
- 34Tool result: rs_zonal_statistics, step 0. Zonal statistics: 10 row(s). zones 10. id 585cf8a3-03c6-4f2b-ae1f-4e561bc33bf0:0
- 35Tool result: rs_zonal_statistics, step 1. Zonal statistics: 12 row(s). zones 12. id 585cf8a3-03c6-4f2b-ae1f-4e561bc33bf0:1
- 36Tool result: rs_zonal_statistics, step 2. Zonal statistics: 36 row(s). zones 36. id 585cf8a3-03c6-4f2b-ae1f-4e561bc33bf0:2
- 37Catalog: Find point clusters (operation catalog, gp_find_point_clusters). Density-based clusters (DBSCAN, HDBSCAN or OPTICS, optionally space-time) with hulls and noise. ArcGIS: Find Point Clusters, Density-based Clustering. QGIS: native:dbscanclustering, native:stdbscanclustering. id gp_find_point_clusters
- 38Plan: Cluster points of Ignitions (the Start plan's candidate c_03b5374e7f2f). DBSCAN finds dense groups of Ignitions and separates noise. id 186bc213-2630-4d8c-bbef-bc1854404d12:c_03b5374e7f2f
- 39Tool result: gp_find_point_clusters, step 0. Find point clusters: 2 layers saved: Find point clusters: Ignitions (900 features); Find point clusters: cluster hulls (1 feature). id d750a3d5-f804-48d7-a5ab-cea0c64036e0:0
- 40Catalog: Average nearest neighbor (operation catalog, gp_nearest_neighbor_index). Clark-Evans ratio: clustered, dispersed or random. ArcGIS: Average Nearest Neighbor. QGIS: native:nearestneighbouranalysis. id gp_nearest_neighbor_index
- 41Plan: Nearest neighbor index of Ignitions (the Start plan's candidate c_394da09ac152). The average nearest neighbor ratio says whether Ignitions are clustered, random or dispersed. id 186bc213-2630-4d8c-bbef-bc1854404d12:c_394da09ac152
- 42Tool result: gp_nearest_neighbor_index, step 1. Average nearest neighbor: done; no map output. id d750a3d5-f804-48d7-a5ab-cea0c64036e0:1
- 43Plan: Nearest neighbor index of Weather stations (the Start plan's candidate c_30762cad9c11). The average nearest neighbor ratio says whether Weather stations are clustered, random or dispersed. id 186bc213-2630-4d8c-bbef-bc1854404d12:c_30762cad9c11
- 44Tool result: gp_nearest_neighbor_index, step 2. Average nearest neighbor: done; no map output. id d750a3d5-f804-48d7-a5ab-cea0c64036e0:2
- 45Catalog: Calculate density (operation catalog, gp_calculate_density). Kernel density per square kilometer on a grid. ArcGIS: Calculate Density, Kernel Density. QGIS: native:heatmapkerneldensityestimation. id gp_calculate_density
- 46Plan: Kernel density of Ignitions (the Start plan's candidate c_8031c96859c6). 900 points in Ignitions: a density surface shows where they concentrate. id 186bc213-2630-4d8c-bbef-bc1854404d12:c_8031c96859c6
- 47Tool result: gp_calculate_density, step 0. Calculate density: 1 layer saved: Calculate density: Ignitions (2136 features). id a9724881-6b90-401e-86d3-b3e78a11a086:0
- 48Catalog: Find outliers (operation catalog, gp_outliers). Anselin local Moran’s I: HH, LL clusters and HL, LH outliers. ArcGIS: Find Outliers, Cluster and Outlier Analysis (Anselin Local Moran’s I). id gp_outliers
- 49Plan: Local morans i of Fire perimeters (the Start plan's candidate c_97cb8e0f2668). Local Moran's I maps clusters and outliers of 'acres'. id 186bc213-2630-4d8c-bbef-bc1854404d12:c_97cb8e0f2668
- 50Tool result: gp_outliers, step 0. Find outliers: 1 layer saved: Find outliers: Fire perimeters (10 features). id d2855091-5bee-4e72-92bc-f4d96c2ad80a:0
- 51Plan: Local morans i of Fuel treatments (the Start plan's candidate c_f3914935665b). Local Moran's I maps clusters and outliers of 'acres'. id 186bc213-2630-4d8c-bbef-bc1854404d12:c_f3914935665b
- 52Tool result: gp_outliers, step 1. Find outliers: 1 layer saved: Find outliers: Fuel treatments (12 features). id d2855091-5bee-4e72-92bc-f4d96c2ad80a:1
- 53Plan: Local morans i of Fuel units (the Start plan's candidate c_d1cbc9b93230). Local Moran's I maps clusters and outliers of 'fuel_load_t_ha'. id 186bc213-2630-4d8c-bbef-bc1854404d12:c_d1cbc9b93230
- 54Tool result: gp_outliers, step 2. Find outliers: 1 layer saved: Find outliers: Fuel units (36 features). id d2855091-5bee-4e72-92bc-f4d96c2ad80a:2
- 55Layer: Fuel units. 36 features id 42f78cee-8de2-430c-8f54-a3b77306f0e7
- 56Rendering: Map: Hot spot analysis: Ignitions id bb63cb93-55aa-4f5b-9b90-3bf45d6dc57f
- 57Rendering: Map: Hot spot analysis: Fire perimeters id c5abc0f0-1d90-42a7-890d-973a23eae10f
- 58Rendering: Map: Hot spot analysis: Fuel treatments id b4e60dce-bab6-4223-a5db-f854367edcc9
- 59Rendering: Map: Emerging hot spots: Ignitions id 86125b2e-c24e-46d9-bf32-2bc320dd67bf
- 60Rendering: Map: Repeat and near repeat classification: Ignitions id d2b0ab7d-8519-4953-a574-41a63e22f158
- 61Rendering: Map: Summarize within: Fire perimeters id 1b0b59ae-d26e-448d-99f4-13f97a2e6e22
- 62Rendering: Map: Summarize within: Fire perimeters id 79f494a0-8339-4630-9f2b-1eb51920b75e
- 63Rendering: Map: Summarize within: Fire perimeters id 157a695e-39d9-4eda-a959-2757ef39dd1f
- 64Rendering: Map: Find point clusters: Ignitions id 769cd190-b6cd-4baf-bb26-89b68980f41b
- 65Rendering: Map: Find point clusters: cluster hulls id 39ce8fbd-9d74-4a4f-9be5-a6510ea09ce6
- 66Rendering: Map: Calculate density: Ignitions id dc62fd3d-336d-4e9a-b0cb-53b02e35914a
- 67Rendering: Map: Fire perimeters by acres id b5a6d9fb-5e10-4e3d-8f27-49001ad00173
- 68Rendering: Map: Fuel treatments by acres id ad8c35df-63f5-4cf4-bc47-ecf9d02f74f8
- 69Rendering: Map: Fuel units by fuel_load_t_ha id 102ee2da-8af4-42d9-9311-7ee514591e21
- 70Rendering: Map: Find outliers: Fire perimeters id 74f7137e-d925-4cf8-8637-4cf18c53ed90
- 71Rendering: Map: Find outliers: Fuel treatments id f7d92071-015a-4f7a-853e-6834d900f625
- 72Rendering: Map: Find outliers: Fuel units id 2b4bb626-f282-4cd0-9678-a86f686584ce
- 73Rendering: Chart: Fire perimeters over time (start_date). 111 rows id 3cb8b4ab-f4bc-4698-939c-3d9a7ff84f07
- 74Rendering: Chart: Station weather by day over time (date). 23 rows id ddf56570-bae6-49fc-b4c3-4800008acb48
- 75Rendering: Chart: Hot spot analysis: Ignitions. 13 rows id ac627744-6825-4c3d-9670-c93a9bfb2e42
- 76Rendering: Chart: Hot spot analysis: Fire perimeters. 7 rows id 3c9aad31-e9ac-49eb-982d-37bc396afad8
- 77Rendering: Chart: Hot spot analysis: Fuel treatments. 4 rows id 638ff2d9-34f9-403b-a35d-d9a308e3ec25
- 78Rendering: Chart: Emerging hot spots: Ignitions. 9 rows id 0a4caa2f-337b-4a6b-b4d4-b142afafe031
- 79Rendering: Chart: Repeat and near repeat classification: Ignitions. 210 rows id 632a779a-47b0-4035-b53d-354cabd5d360
- 80Rendering: Chart: Summarize within: Fire perimeters. 111 rows id 22ee21d5-58dc-4e1e-a070-6a67a901c965
- 81Rendering: Chart: Summarize within: Fire perimeters. 111 rows id db2f619e-43fa-4d26-9640-fb162068f74e
- 82Rendering: Chart: Summarize within: Fire perimeters. 111 rows id b7f0dd9d-22ad-4e93-9b93-cf9a83fadf84
- 83Rendering: Chart: Find point clusters: Ignitions. 2 rows id 1e027e4b-22a2-45d5-9086-2a36c8138f69
- 84Rendering: Chart: Find point clusters: cluster hulls. 1 rows id 0789a6b7-999c-4f6b-9d42-1cd13d066287
- 85Rendering: Chart: Calculate density: Ignitions. 13 rows id 0be10378-cba5-4926-a390-c5d82995b1a3
- 86Rendering: Chart: Find outliers: Fire perimeters. 10 rows id 84e826fe-c1a8-45f7-9c15-b536ccc175c6
- 87Rendering: Chart: Find outliers: Fuel treatments. 12 rows id 8efc3778-a287-41ed-b887-f7929e06afc2
- 88Rendering: Chart: Find outliers: Fuel units. 36 rows id 05890114-2897-4a1f-b199-efec992907fe
- 89Rendering: Chart: Find outliers: Fuel treatments over time. 72 rows id af3a74cb-f5e6-45e1-aee7-be2f209870ab
- 90Rendering: Chart: Find outliers: Fire perimeters over time. 111 rows id ffd1204d-4f08-4461-8cd1-44fcce92e2c2
- 91Rendering: Chart: Find point clusters: Ignitions over time. 210 rows id 2d0515c1-e371-4a5e-aded-37ced56bb910
- 92Rendering: Chart: Summarize within: Fire perimeters over time. 111 rows id 3f4630a7-8117-4a45-ad96-0b64158a7db3
- 93Rendering: Chart: Summarize within: Fire perimeters over time. 111 rows id 01777e29-c207-4718-a2ee-d69065a84d99
- 94Rendering: Chart: Summarize within: Fire perimeters over time. 111 rows id ff1e5279-5ea0-474a-9e56-4e42867284ca
- 95Rendering: Chart: Repeat and near repeat classification: Ignitions over time. 210 rows id cb6bd5ac-4983-40a6-adb2-f8cbdca32ee7
- 96Rendering: Chart: Hot spot analysis: Fuel treatments over time. 48 rows id 94c4e65c-ee4e-4a2b-9d8c-c1fa5cd5282a
- 97Rendering: Chart: Hot spot analysis: Fire perimeters over time. 111 rows id d8ab7b19-e10f-4683-bd70-1708bd93b637
- 98Dataset: Fuel units. vector, 36 rows id fc5028cb-a84d-444c-a982-49a4f156c28e
- 99Dataset: Forest roads. vector, 15 rows id c0892d0e-cdf3-4371-9e82-477a931a88d7
- 100Dataset: Weather stations. vector, 6 rows id 720b6843-88fb-4d45-b04c-efa7b051e0a4
- 101Dataset: Fire lookouts. vector, 3 rows id 57d287f4-2d44-451b-9f1c-7e45316002b6
- 102Dataset: Forest terrain model (DEM). raster, ? rows id 81d246c7-6131-4938-9f61-f7279a97cc5e
- 103Dataset: Treatment costs. table, 12 rows id 8c3b32c2-3535-489c-94ca-7cf557f9e65d
- 104Dataset: Fuels treatment plan. document, ? rows id 275ae7d9-0d0b-407c-aa5b-b35298e6ba4e
- 105Record: Sample: Forestry and wildfire, Bend id 721d878b-84af-42eb-9c9c-858bf9a6a75e
- 106Layer: Hot spot analysis: Ignitions. 344 features id 0fd14c27-6dc5-40ab-9367-9526fed96488
- 107Layer: Hot spot analysis: Fire perimeters. 10 features id 712f8542-d935-4ffb-9017-4996ae740395
- 108Layer: Hot spot analysis: Fuel treatments. 12 features id 17998548-cdf7-4623-86fa-b34232ee3f92
- 109Layer: Emerging hot spots: Ignitions. 135 features id 6cd30a8d-a6bb-41fa-aa35-bde687bf9907
- 110Layer: Repeat and near repeat classification: Ignitions. 900 features id e22031fb-e461-400b-8e9e-72ffaa953304
- 111Layer: Summarize within: Fire perimeters. 10 features id b8d71f1c-d5f1-49e2-a2bd-f7b2532714da
- 112Layer: Summarize within: Fire perimeters. 10 features id f9a795e9-aa11-4cf7-919f-3fd6479f41aa
- 113Layer: Summarize within: Fire perimeters. 10 features id 072dac32-c222-4fd9-a81b-67d2bbd389f9
- 114Layer: Find point clusters: Ignitions. 900 features id f0f43900-3843-44c7-a966-3fad40f516a7
- 115Layer: Find point clusters: cluster hulls. 1 features id 9eb7e362-3675-466c-b2bd-13b526913ffe
- 116Layer: Calculate density: Ignitions. 2,136 features id 4c8afb06-e51c-4b81-abd6-8abc0805636a
- 117Layer: Find outliers: Fire perimeters. 10 features id 32df7e83-bd50-4624-8151-7a1c53594cda
- 118Layer: Find outliers: Fuel treatments. 12 features id d3cbfd02-4bf8-4255-8459-f80c861e5a3c
- 119Layer: Find outliers: Fuel units. 36 features id 4f521496-6165-4997-b713-4947d4e59c52
Appendix: the data behind the chartsShow
Figure 1. Timeline: events per quarter by dataset 1
| period | series | value |
|---|---|---|
| 2017-07-01 | Station weather by day | 0 |
| 2017-07-01 | Ignitions | 0 |
| 2017-07-01 | Fuel treatments | 0 |
| 2017-07-01 | Fire perimeters | 1 |
| 2017-10-01 | Station weather by day | 0 |
| 2017-10-01 | Ignitions | 0 |
| 2017-10-01 | Fuel treatments | 0 |
| 2017-10-01 | Fire perimeters | 0 |
| 2018-01-01 | Station weather by day | 0 |
| 2018-01-01 | Ignitions | 1 |
| 2018-01-01 | Fuel treatments | 0 |
| 2018-01-01 | Fire perimeters | 0 |
| 2018-04-01 | Station weather by day | 0 |
| 2018-04-01 | Ignitions | 18 |
| 2018-04-01 | Fuel treatments | 0 |
| 2018-04-01 | Fire perimeters | 0 |
| 2018-07-01 | Station weather by day | 0 |
| 2018-07-01 | Ignitions | 33 |
| 2018-07-01 | Fuel treatments | 0 |
| 2018-07-01 | Fire perimeters | 1 |
| 2018-10-01 | Station weather by day | 0 |
| 2018-10-01 | Ignitions | 22 |
| 2018-10-01 | Fuel treatments | 0 |
| 2018-10-01 | Fire perimeters | 0 |
| 2019-01-01 | Station weather by day | 0 |
| 2019-01-01 | Ignitions | 5 |
| 2019-01-01 | Fuel treatments | 0 |
| 2019-01-01 | Fire perimeters | 0 |
| 2019-04-01 | Station weather by day | 0 |
| 2019-04-01 | Ignitions | 26 |
| 2019-04-01 | Fuel treatments | 1 |
| 2019-04-01 | Fire perimeters | 0 |
| 2019-07-01 | Station weather by day | 0 |
| 2019-07-01 | Ignitions | 39 |
| 2019-07-01 | Fuel treatments | 0 |
| 2019-07-01 | Fire perimeters | 1 |
| 2019-10-01 | Station weather by day | 0 |
| 2019-10-01 | Ignitions | 16 |
| 2019-10-01 | Fuel treatments | 0 |
| 2019-10-01 | Fire perimeters | 0 |
| 2020-01-01 | Station weather by day | 0 |
| 2020-01-01 | Ignitions | 2 |
| 2020-01-01 | Fuel treatments | 1 |
| 2020-01-01 | Fire perimeters | 0 |
| 2020-04-01 | Station weather by day | 0 |
| 2020-04-01 | Ignitions | 21 |
| 2020-04-01 | Fuel treatments | 1 |
| 2020-04-01 | Fire perimeters | 0 |
| 2020-07-01 | Station weather by day | 0 |
| 2020-07-01 | Ignitions | 38 |
| 2020-07-01 | Fuel treatments | 0 |
| 2020-07-01 | Fire perimeters | 1 |
| 2020-10-01 | Station weather by day | 0 |
| 2020-10-01 | Ignitions | 22 |
| 2020-10-01 | Fuel treatments | 0 |
| 2020-10-01 | Fire perimeters | 0 |
| 2021-01-01 | Station weather by day | 0 |
| 2021-01-01 | Ignitions | 1 |
| 2021-01-01 | Fuel treatments | 0 |
| 2021-01-01 | Fire perimeters | 0 |
| 2021-04-01 | Station weather by day | 0 |
| 2021-04-01 | Ignitions | 27 |
| 2021-04-01 | Fuel treatments | 0 |
| 2021-04-01 | Fire perimeters | 0 |
| 2021-07-01 | Station weather by day | 0 |
| 2021-07-01 | Ignitions | 47 |
| 2021-07-01 | Fuel treatments | 2 |
| 2021-07-01 | Fire perimeters | 1 |
| 2021-10-01 | Station weather by day | 0 |
| 2021-10-01 | Ignitions | 32 |
| 2021-10-01 | Fuel treatments | 0 |
| 2021-10-01 | Fire perimeters | 0 |
| 2022-01-01 | Station weather by day | 0 |
| 2022-01-01 | Ignitions | 5 |
| 2022-01-01 | Fuel treatments | 0 |
| 2022-01-01 | Fire perimeters | 0 |
| 2022-04-01 | Station weather by day | 0 |
| 2022-04-01 | Ignitions | 21 |
| 2022-04-01 | Fuel treatments | 1 |
| 2022-04-01 | Fire perimeters | 0 |
| 2022-07-01 | Station weather by day | 0 |
| 2022-07-01 | Ignitions | 52 |
| 2022-07-01 | Fuel treatments | 0 |
| 2022-07-01 | Fire perimeters | 1 |
| 2022-10-01 | Station weather by day | 0 |
| 2022-10-01 | Ignitions | 28 |
| 2022-10-01 | Fuel treatments | 1 |
| 2022-10-01 | Fire perimeters | 0 |
| 2023-01-01 | Station weather by day | 0 |
| 2023-01-01 | Ignitions | 5 |
| 2023-01-01 | Fuel treatments | 1 |
| 2023-01-01 | Fire perimeters | 0 |
| 2023-04-01 | Station weather by day | 0 |
| 2023-04-01 | Ignitions | 31 |
| 2023-04-01 | Fuel treatments | 1 |
| 2023-04-01 | Fire perimeters | 0 |
| 2023-07-01 | Station weather by day | 0 |
| 2023-07-01 | Ignitions | 48 |
| 2023-07-01 | Fuel treatments | 0 |
| 2023-07-01 | Fire perimeters | 1 |
| 2023-10-01 | Station weather by day | 0 |
| 2023-10-01 | Ignitions | 34 |
| 2023-10-01 | Fuel treatments | 0 |
| 2023-10-01 | Fire perimeters | 0 |
| 2024-01-01 | Station weather by day | 0 |
| 2024-01-01 | Ignitions | 4 |
| 2024-01-01 | Fuel treatments | 0 |
| 2024-01-01 | Fire perimeters | 0 |
| 2024-04-01 | Station weather by day | 0 |
| 2024-04-01 | Ignitions | 36 |
| 2024-04-01 | Fuel treatments | 1 |
| 2024-04-01 | Fire perimeters | 0 |
| 2024-07-01 | Station weather by day | 0 |
| 2024-07-01 | Ignitions | 48 |
| 2024-07-01 | Fuel treatments | 0 |
| 2024-07-01 | Fire perimeters | 1 |
| 2024-10-01 | Station weather by day | 0 |
| 2024-10-01 | Ignitions | 32 |
| 2024-10-01 | Fuel treatments | 1 |
| 2024-10-01 | Fire perimeters | 0 |
| 2025-01-01 | Station weather by day | 0 |
| 2025-01-01 | Ignitions | 7 |
| 2025-01-01 | Fuel treatments | 1 |
| 2025-01-01 | Fire perimeters | 0 |
| 2025-04-01 | Station weather by day | 0 |
| 2025-04-01 | Ignitions | 35 |
| 2025-04-01 | Fuel treatments | 0 |
| 2025-04-01 | Fire perimeters | 0 |
| 2025-07-01 | Station weather by day | 0 |
| 2025-07-01 | Ignitions | 61 |
| 2025-07-01 | Fuel treatments | 0 |
| 2025-07-01 | Fire perimeters | 1 |
| 2025-10-01 | Station weather by day | 0 |
| 2025-10-01 | Ignitions | 24 |
| 2025-10-01 | Fuel treatments | 0 |
| 2025-10-01 | Fire perimeters | 0 |
| 2026-01-01 | Station weather by day | 0 |
| 2026-01-01 | Ignitions | 2 |
| 2026-01-01 | Fuel treatments | 0 |
| 2026-01-01 | Fire perimeters | 0 |
| 2026-04-01 | Station weather by day | 366 |
| 2026-04-01 | Ignitions | 20 |
| 2026-04-01 | Fuel treatments | 0 |
| 2026-04-01 | Fire perimeters | 0 |
| 2026-07-01 | Station weather by day | 552 |
| 2026-07-01 | Ignitions | 57 |
| 2026-07-01 | Fuel treatments | 0 |
| 2026-07-01 | Fire perimeters | 1 |
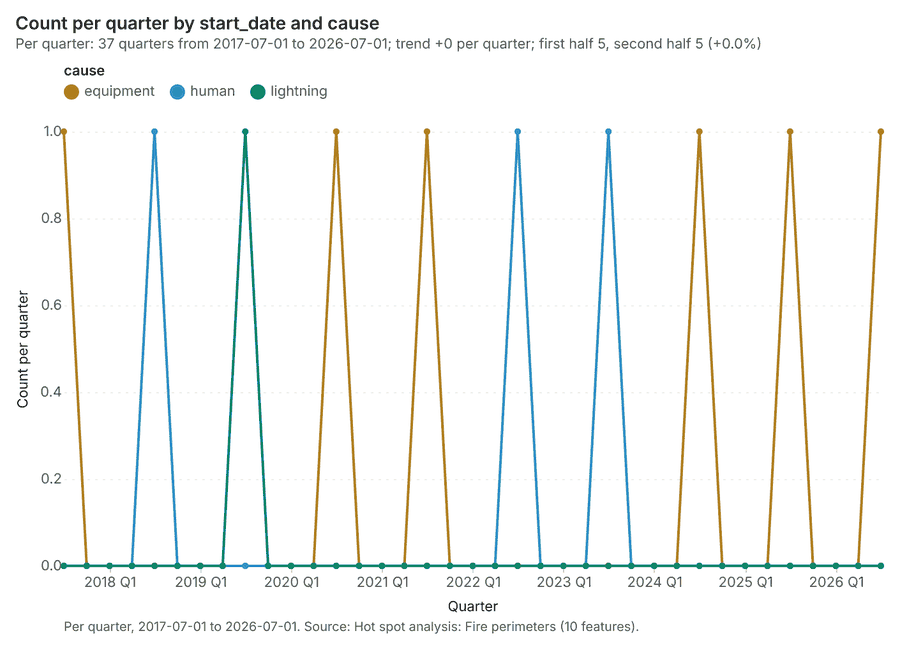
Figure 19. Fire perimeters over time (start_date) 73
| period | series | value |
|---|---|---|
| 2017-07-01 | equipment | 1 |
| 2017-07-01 | human | 0 |
| 2017-07-01 | lightning | 0 |
| 2017-10-01 | equipment | 0 |
| 2017-10-01 | human | 0 |
| 2017-10-01 | lightning | 0 |
| 2018-01-01 | equipment | 0 |
| 2018-01-01 | human | 0 |
| 2018-01-01 | lightning | 0 |
| 2018-04-01 | equipment | 0 |
| 2018-04-01 | human | 0 |
| 2018-04-01 | lightning | 0 |
| 2018-07-01 | equipment | 0 |
| 2018-07-01 | human | 1 |
| 2018-07-01 | lightning | 0 |
| 2018-10-01 | equipment | 0 |
| 2018-10-01 | human | 0 |
| 2018-10-01 | lightning | 0 |
| 2019-01-01 | equipment | 0 |
| 2019-01-01 | human | 0 |
| 2019-01-01 | lightning | 0 |
| 2019-04-01 | equipment | 0 |
| 2019-04-01 | human | 0 |
| 2019-04-01 | lightning | 0 |
| 2019-07-01 | equipment | 0 |
| 2019-07-01 | human | 0 |
| 2019-07-01 | lightning | 1 |
| 2019-10-01 | equipment | 0 |
| 2019-10-01 | human | 0 |
| 2019-10-01 | lightning | 0 |
| 2020-01-01 | equipment | 0 |
| 2020-01-01 | human | 0 |
| 2020-01-01 | lightning | 0 |
| 2020-04-01 | equipment | 0 |
| 2020-04-01 | human | 0 |
| 2020-04-01 | lightning | 0 |
| 2020-07-01 | equipment | 1 |
| 2020-07-01 | human | 0 |
| 2020-07-01 | lightning | 0 |
| 2020-10-01 | equipment | 0 |
| 2020-10-01 | human | 0 |
| 2020-10-01 | lightning | 0 |
| 2021-01-01 | equipment | 0 |
| 2021-01-01 | human | 0 |
| 2021-01-01 | lightning | 0 |
| 2021-04-01 | equipment | 0 |
| 2021-04-01 | human | 0 |
| 2021-04-01 | lightning | 0 |
| 2021-07-01 | equipment | 1 |
| 2021-07-01 | human | 0 |
| 2021-07-01 | lightning | 0 |
| 2021-10-01 | equipment | 0 |
| 2021-10-01 | human | 0 |
| 2021-10-01 | lightning | 0 |
| 2022-01-01 | equipment | 0 |
| 2022-01-01 | human | 0 |
| 2022-01-01 | lightning | 0 |
| 2022-04-01 | equipment | 0 |
| 2022-04-01 | human | 0 |
| 2022-04-01 | lightning | 0 |
| 2022-07-01 | equipment | 0 |
| 2022-07-01 | human | 1 |
| 2022-07-01 | lightning | 0 |
| 2022-10-01 | equipment | 0 |
| 2022-10-01 | human | 0 |
| 2022-10-01 | lightning | 0 |
| 2023-01-01 | equipment | 0 |
| 2023-01-01 | human | 0 |
| 2023-01-01 | lightning | 0 |
| 2023-04-01 | equipment | 0 |
| 2023-04-01 | human | 0 |
| 2023-04-01 | lightning | 0 |
| 2023-07-01 | equipment | 0 |
| 2023-07-01 | human | 1 |
| 2023-07-01 | lightning | 0 |
| 2023-10-01 | equipment | 0 |
| 2023-10-01 | human | 0 |
| 2023-10-01 | lightning | 0 |
| 2024-01-01 | equipment | 0 |
| 2024-01-01 | human | 0 |
| 2024-01-01 | lightning | 0 |
| 2024-04-01 | equipment | 0 |
| 2024-04-01 | human | 0 |
| 2024-04-01 | lightning | 0 |
| 2024-07-01 | equipment | 1 |
| 2024-07-01 | human | 0 |
| 2024-07-01 | lightning | 0 |
| 2024-10-01 | equipment | 0 |
| 2024-10-01 | human | 0 |
| 2024-10-01 | lightning | 0 |
| 2025-01-01 | equipment | 0 |
| 2025-01-01 | human | 0 |
| 2025-01-01 | lightning | 0 |
| 2025-04-01 | equipment | 0 |
| 2025-04-01 | human | 0 |
| 2025-04-01 | lightning | 0 |
| 2025-07-01 | equipment | 1 |
| 2025-07-01 | human | 0 |
| 2025-07-01 | lightning | 0 |
| 2025-10-01 | equipment | 0 |
| 2025-10-01 | human | 0 |
| 2025-10-01 | lightning | 0 |
| 2026-01-01 | equipment | 0 |
| 2026-01-01 | human | 0 |
| 2026-01-01 | lightning | 0 |
| 2026-04-01 | equipment | 0 |
| 2026-04-01 | human | 0 |
| 2026-04-01 | lightning | 0 |
| 2026-07-01 | equipment | 1 |
| 2026-07-01 | human | 0 |
| 2026-07-01 | lightning | 0 |
Figure 20. Station weather by day over time (date) 74
| period | value |
|---|---|
| 2026-04-27 | 18 |
| 2026-05-04 | 42 |
| 2026-05-11 | 42 |
| 2026-05-18 | 42 |
| 2026-05-25 | 42 |
| 2026-06-01 | 42 |
| 2026-06-08 | 42 |
| 2026-06-15 | 42 |
| 2026-06-22 | 42 |
| 2026-06-29 | 42 |
| 2026-07-06 | 42 |
| 2026-07-13 | 42 |
| 2026-07-20 | 42 |
| 2026-07-27 | 42 |
| 2026-08-03 | 42 |
| 2026-08-10 | 42 |
| 2026-08-17 | 42 |
| 2026-08-24 | 42 |
| 2026-08-31 | 42 |
| 2026-09-07 | 42 |
| 2026-09-14 | 42 |
| 2026-09-21 | 42 |
| 2026-09-28 | 18 |
Figure 21. Hot spot analysis: Ignitions 75
| bin_start | bin_end | band | band_label | count |
|---|---|---|---|---|
| -1 | -0.5 | not_significant | Not significant | 104 |
| -0.5 | 0 | not_significant | Not significant | 152 |
| 0 | 0.5 | not_significant | Not significant | 44 |
| 0.5 | 1 | not_significant | Not significant | 16 |
| 1 | 1.5 | not_significant | Not significant | 5 |
| 1.5 | 2 | hot_90 | Hot spot, 90% confidence | 4 |
| 1.5 | 2 | not_significant | Not significant | 1 |
| 2 | 2.5 | hot_95 | Hot spot, 95% confidence | 2 |
| 2.5 | 3 | hot_99 | Hot spot, 99% confidence | 1 |
| 3 | 3.5 | hot_99 | Hot spot, 99% confidence | 8 |
| 4 | 4.5 | hot_99 | Hot spot, 99% confidence | 2 |
| 4.5 | 5 | hot_99 | Hot spot, 99% confidence | 2 |
| 5 | 5.5 | hot_99 | Hot spot, 99% confidence | 3 |
Figure 22. Hot spot analysis: Fire perimeters 76
| bin_start | bin_end | band | band_label | count |
|---|---|---|---|---|
| -1.5 | -1 | not_significant | Not significant | 2 |
| -1 | -0.5 | not_significant | Not significant | 1 |
| -0.5 | 0 | not_significant | Not significant | 1 |
| 0 | 0.5 | not_significant | Not significant | 2 |
| 0.5 | 1 | not_significant | Not significant | 2 |
| 1 | 1.5 | not_significant | Not significant | 1 |
| 1.5 | 2 | hot_90 | Hot spot, 90% confidence | 1 |
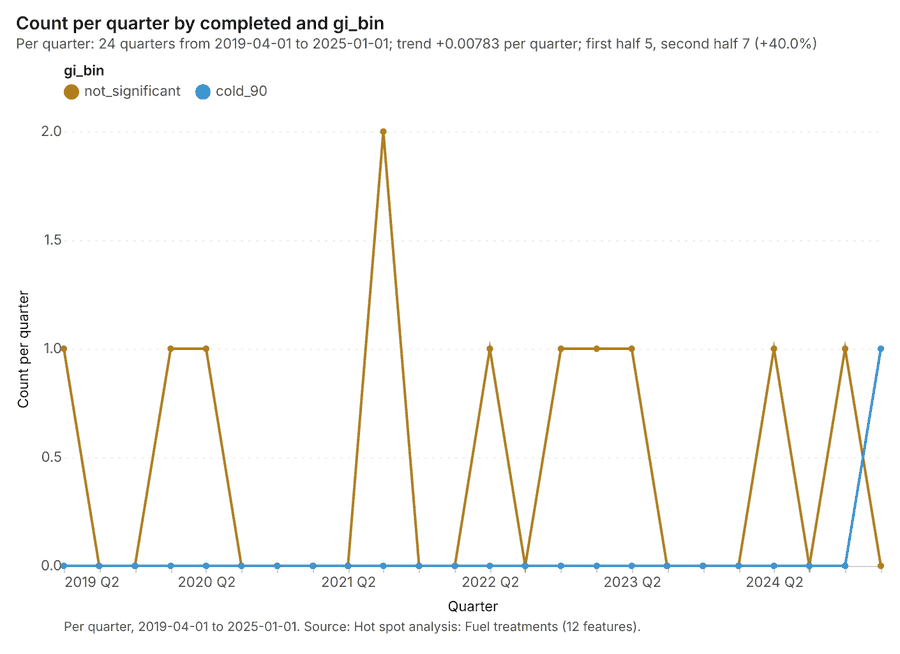
Figure 23. Hot spot analysis: Fuel treatments 77
| bin_start | bin_end | band | band_label | count |
|---|---|---|---|---|
| -2 | -1.5 | cold_90 | Cold spot, 90% confidence | 1 |
| -0.5 | 0 | not_significant | Not significant | 6 |
| 0 | 0.5 | not_significant | Not significant | 3 |
| 0.5 | 1 | not_significant | Not significant | 2 |
Figure 24. Emerging hot spots: Ignitions 78
| bin_start | bin_end | count |
|---|---|---|
| -0.534 | 0.3166 | 84 |
| 0.3166 | 1.167 | 23 |
| 1.167 | 2.018 | 3 |
| 2.018 | 2.868 | 11 |
| 2.868 | 3.719 | 0 |
| 3.719 | 4.569 | 7 |
| 4.569 | 5.42 | 0 |
| 5.42 | 6.27 | 6 |
| 6.27 | 7.121 | 1 |
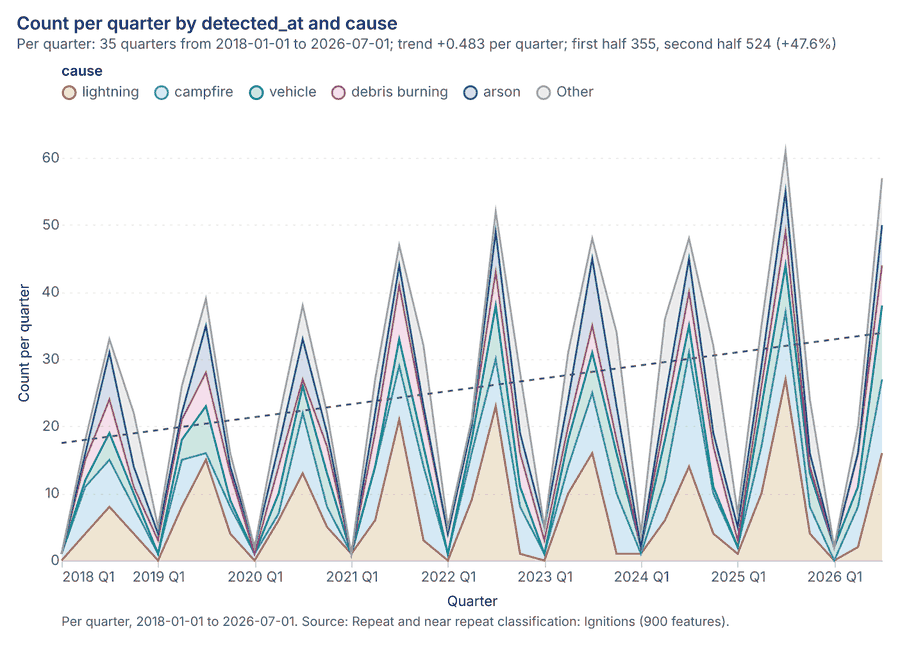
Figure 25. Repeat and near repeat classification: Ignitions 79
| period | series | value |
|---|---|---|
| 2018-01-01 | lightning | 0 |
| 2018-01-01 | campfire | 1 |
| 2018-01-01 | vehicle | 0 |
| 2018-01-01 | debris burning | 0 |
| 2018-01-01 | arson | 0 |
| 2018-01-01 | Other | 0 |
| 2018-04-01 | lightning | 4 |
| 2018-04-01 | campfire | 7 |
| 2018-04-01 | vehicle | 1 |
| 2018-04-01 | debris burning | 3 |
| 2018-04-01 | arson | 1 |
| 2018-04-01 | Other | 2 |
| 2018-07-01 | lightning | 8 |
| 2018-07-01 | campfire | 7 |
| 2018-07-01 | vehicle | 4 |
| 2018-07-01 | debris burning | 5 |
| 2018-07-01 | arson | 7 |
| 2018-07-01 | Other | 2 |
| 2018-10-01 | lightning | 4 |
| 2018-10-01 | campfire | 4 |
| 2018-10-01 | vehicle | 2 |
| 2018-10-01 | debris burning | 1 |
| 2018-10-01 | arson | 3 |
| 2018-10-01 | Other | 8 |
| 2019-01-01 | lightning | 0 |
| 2019-01-01 | campfire | 1 |
| 2019-01-01 | vehicle | 0 |
| 2019-01-01 | debris burning | 2 |
| 2019-01-01 | arson | 1 |
| 2019-01-01 | Other | 1 |
| 2019-04-01 | lightning | 8 |
| 2019-04-01 | campfire | 7 |
| 2019-04-01 | vehicle | 3 |
| 2019-04-01 | debris burning | 3 |
| 2019-04-01 | arson | 1 |
| 2019-04-01 | Other | 4 |
| 2019-07-01 | lightning | 15 |
| 2019-07-01 | campfire | 1 |
| 2019-07-01 | vehicle | 7 |
| 2019-07-01 | debris burning | 5 |
| 2019-07-01 | arson | 7 |
| 2019-07-01 | Other | 4 |
| 2019-10-01 | lightning | 4 |
| 2019-10-01 | campfire | 4 |
| 2019-10-01 | vehicle | 1 |
| 2019-10-01 | debris burning | 4 |
| 2019-10-01 | arson | 1 |
| 2019-10-01 | Other | 2 |
| 2020-01-01 | lightning | 0 |
| 2020-01-01 | campfire | 1 |
| 2020-01-01 | vehicle | 0 |
| 2020-01-01 | debris burning | 0 |
| 2020-01-01 | arson | 1 |
| 2020-01-01 | Other | 0 |
| 2020-04-01 | lightning | 6 |
| 2020-04-01 | campfire | 1 |
| 2020-04-01 | vehicle | 3 |
| 2020-04-01 | debris burning | 4 |
| 2020-04-01 | arson | 3 |
| 2020-04-01 | Other | 4 |
| 2020-07-01 | lightning | 13 |
| 2020-07-01 | campfire | 9 |
| 2020-07-01 | vehicle | 4 |
| 2020-07-01 | debris burning | 1 |
| 2020-07-01 | arson | 6 |
| 2020-07-01 | Other | 5 |
| 2020-10-01 | lightning | 5 |
| 2020-10-01 | campfire | 3 |
| 2020-10-01 | vehicle | 5 |
| 2020-10-01 | debris burning | 4 |
| 2020-10-01 | arson | 2 |
| 2020-10-01 | Other | 3 |
| 2021-01-01 | lightning | 1 |
| 2021-01-01 | campfire | 0 |
| 2021-01-01 | vehicle | 0 |
| 2021-01-01 | debris burning | 0 |
| 2021-01-01 | arson | 0 |
| 2021-01-01 | Other | 0 |
| 2021-04-01 | lightning | 6 |
| 2021-04-01 | campfire | 8 |
| 2021-04-01 | vehicle | 0 |
| 2021-04-01 | debris burning | 5 |
| 2021-04-01 | arson | 3 |
| 2021-04-01 | Other | 5 |
| 2021-07-01 | lightning | 21 |
| 2021-07-01 | campfire | 8 |
| 2021-07-01 | vehicle | 4 |
| 2021-07-01 | debris burning | 8 |
| 2021-07-01 | arson | 3 |
| 2021-07-01 | Other | 3 |
| 2021-10-01 | lightning | 3 |
| 2021-10-01 | campfire | 11 |
| 2021-10-01 | vehicle | 3 |
| 2021-10-01 | debris burning | 5 |
| 2021-10-01 | arson | 1 |
| 2021-10-01 | Other | 9 |
| 2022-01-01 | lightning | 0 |
| 2022-01-01 | campfire | 1 |
| 2022-01-01 | vehicle | 0 |
| 2022-01-01 | debris burning | 3 |
| 2022-01-01 | arson | 0 |
| 2022-01-01 | Other | 1 |
| 2022-04-01 | lightning | 9 |
| 2022-04-01 | campfire | 7 |
| 2022-04-01 | vehicle | 2 |
| 2022-04-01 | debris burning | 2 |
| 2022-04-01 | arson | 0 |
| 2022-04-01 | Other | 1 |
| 2022-07-01 | lightning | 23 |
| 2022-07-01 | campfire | 7 |
| 2022-07-01 | vehicle | 8 |
| 2022-07-01 | debris burning | 5 |
| 2022-07-01 | arson | 6 |
| 2022-07-01 | Other | 3 |
| 2022-10-01 | lightning | 1 |
| 2022-10-01 | campfire | 7 |
| 2022-10-01 | vehicle | 3 |
| 2022-10-01 | debris burning | 5 |
| 2022-10-01 | arson | 3 |
| 2022-10-01 | Other | 9 |
| 2023-01-01 | lightning | 0 |
| 2023-01-01 | campfire | 1 |
| 2023-01-01 | vehicle | 0 |
| 2023-01-01 | debris burning | 2 |
| 2023-01-01 | arson | 2 |
| 2023-01-01 | Other | 0 |
| 2023-04-01 | lightning | 10 |
| 2023-04-01 | campfire | 4 |
| 2023-04-01 | vehicle | 4 |
| 2023-04-01 | debris burning | 2 |
| 2023-04-01 | arson | 4 |
| 2023-04-01 | Other | 7 |
| 2023-07-01 | lightning | 16 |
| 2023-07-01 | campfire | 9 |
| 2023-07-01 | vehicle | 6 |
| 2023-07-01 | debris burning | 4 |
| 2023-07-01 | arson | 10 |
| 2023-07-01 | Other | 3 |
| 2023-10-01 | lightning | 1 |
| 2023-10-01 | campfire | 9 |
| 2023-10-01 | vehicle | 6 |
| 2023-10-01 | debris burning | 2 |
| 2023-10-01 | arson | 5 |
| 2023-10-01 | Other | 11 |
| 2024-01-01 | lightning | 1 |
| 2024-01-01 | campfire | 0 |
| 2024-01-01 | vehicle | 1 |
| 2024-01-01 | debris burning | 0 |
| 2024-01-01 | arson | 0 |
| 2024-01-01 | Other | 2 |
| 2024-04-01 | lightning | 6 |
| 2024-04-01 | campfire | 6 |
| 2024-04-01 | vehicle | 6 |
| 2024-04-01 | debris burning | 3 |
| 2024-04-01 | arson | 3 |
| 2024-04-01 | Other | 12 |
| 2024-07-01 | lightning | 14 |
| 2024-07-01 | campfire | 17 |
| 2024-07-01 | vehicle | 4 |
| 2024-07-01 | debris burning | 5 |
| 2024-07-01 | arson | 5 |
| 2024-07-01 | Other | 3 |
| 2024-10-01 | lightning | 4 |
| 2024-10-01 | campfire | 6 |
| 2024-10-01 | vehicle | 1 |
| 2024-10-01 | debris burning | 6 |
| 2024-10-01 | arson | 2 |
| 2024-10-01 | Other | 13 |
| 2025-01-01 | lightning | 1 |
| 2025-01-01 | campfire | 1 |
| 2025-01-01 | vehicle | 0 |
| 2025-01-01 | debris burning | 1 |
| 2025-01-01 | arson | 2 |
| 2025-01-01 | Other | 2 |
| 2025-04-01 | lightning | 10 |
| 2025-04-01 | campfire | 7 |
| 2025-04-01 | vehicle | 6 |
| 2025-04-01 | debris burning | 3 |
| 2025-04-01 | arson | 3 |
| 2025-04-01 | Other | 6 |
| 2025-07-01 | lightning | 27 |
| 2025-07-01 | campfire | 10 |
| 2025-07-01 | vehicle | 7 |
| 2025-07-01 | debris burning | 5 |
| 2025-07-01 | arson | 6 |
| 2025-07-01 | Other | 6 |
| 2025-10-01 | lightning | 4 |
| 2025-10-01 | campfire | 4 |
| 2025-10-01 | vehicle | 5 |
| 2025-10-01 | debris burning | 1 |
| 2025-10-01 | arson | 2 |
| 2025-10-01 | Other | 8 |
| 2026-01-01 | lightning | 0 |
| 2026-01-01 | campfire | 0 |
| 2026-01-01 | vehicle | 2 |
| 2026-01-01 | debris burning | 0 |
| 2026-01-01 | arson | 0 |
| 2026-01-01 | Other | 0 |
| 2026-04-01 | lightning | 2 |
| 2026-04-01 | campfire | 6 |
| 2026-04-01 | vehicle | 3 |
| 2026-04-01 | debris burning | 5 |
| 2026-04-01 | arson | 0 |
| 2026-04-01 | Other | 4 |
| 2026-07-01 | lightning | 16 |
| 2026-07-01 | campfire | 11 |
| 2026-07-01 | vehicle | 11 |
| 2026-07-01 | debris burning | 6 |
| 2026-07-01 | arson | 6 |
| 2026-07-01 | Other | 7 |
Figure 26. Summarize within: Fire perimeters 80
| period | series | value |
|---|---|---|
| 2017-07-01 | equipment | 1 |
| 2017-07-01 | human | 0 |
| 2017-07-01 | lightning | 0 |
| 2017-10-01 | equipment | 0 |
| 2017-10-01 | human | 0 |
| 2017-10-01 | lightning | 0 |
| 2018-01-01 | equipment | 0 |
| 2018-01-01 | human | 0 |
| 2018-01-01 | lightning | 0 |
| 2018-04-01 | equipment | 0 |
| 2018-04-01 | human | 0 |
| 2018-04-01 | lightning | 0 |
| 2018-07-01 | equipment | 0 |
| 2018-07-01 | human | 1 |
| 2018-07-01 | lightning | 0 |
| 2018-10-01 | equipment | 0 |
| 2018-10-01 | human | 0 |
| 2018-10-01 | lightning | 0 |
| 2019-01-01 | equipment | 0 |
| 2019-01-01 | human | 0 |
| 2019-01-01 | lightning | 0 |
| 2019-04-01 | equipment | 0 |
| 2019-04-01 | human | 0 |
| 2019-04-01 | lightning | 0 |
| 2019-07-01 | equipment | 0 |
| 2019-07-01 | human | 0 |
| 2019-07-01 | lightning | 1 |
| 2019-10-01 | equipment | 0 |
| 2019-10-01 | human | 0 |
| 2019-10-01 | lightning | 0 |
| 2020-01-01 | equipment | 0 |
| 2020-01-01 | human | 0 |
| 2020-01-01 | lightning | 0 |
| 2020-04-01 | equipment | 0 |
| 2020-04-01 | human | 0 |
| 2020-04-01 | lightning | 0 |
| 2020-07-01 | equipment | 1 |
| 2020-07-01 | human | 0 |
| 2020-07-01 | lightning | 0 |
| 2020-10-01 | equipment | 0 |
| 2020-10-01 | human | 0 |
| 2020-10-01 | lightning | 0 |
| 2021-01-01 | equipment | 0 |
| 2021-01-01 | human | 0 |
| 2021-01-01 | lightning | 0 |
| 2021-04-01 | equipment | 0 |
| 2021-04-01 | human | 0 |
| 2021-04-01 | lightning | 0 |
| 2021-07-01 | equipment | 1 |
| 2021-07-01 | human | 0 |
| 2021-07-01 | lightning | 0 |
| 2021-10-01 | equipment | 0 |
| 2021-10-01 | human | 0 |
| 2021-10-01 | lightning | 0 |
| 2022-01-01 | equipment | 0 |
| 2022-01-01 | human | 0 |
| 2022-01-01 | lightning | 0 |
| 2022-04-01 | equipment | 0 |
| 2022-04-01 | human | 0 |
| 2022-04-01 | lightning | 0 |
| 2022-07-01 | equipment | 0 |
| 2022-07-01 | human | 1 |
| 2022-07-01 | lightning | 0 |
| 2022-10-01 | equipment | 0 |
| 2022-10-01 | human | 0 |
| 2022-10-01 | lightning | 0 |
| 2023-01-01 | equipment | 0 |
| 2023-01-01 | human | 0 |
| 2023-01-01 | lightning | 0 |
| 2023-04-01 | equipment | 0 |
| 2023-04-01 | human | 0 |
| 2023-04-01 | lightning | 0 |
| 2023-07-01 | equipment | 0 |
| 2023-07-01 | human | 1 |
| 2023-07-01 | lightning | 0 |
| 2023-10-01 | equipment | 0 |
| 2023-10-01 | human | 0 |
| 2023-10-01 | lightning | 0 |
| 2024-01-01 | equipment | 0 |
| 2024-01-01 | human | 0 |
| 2024-01-01 | lightning | 0 |
| 2024-04-01 | equipment | 0 |
| 2024-04-01 | human | 0 |
| 2024-04-01 | lightning | 0 |
| 2024-07-01 | equipment | 1 |
| 2024-07-01 | human | 0 |
| 2024-07-01 | lightning | 0 |
| 2024-10-01 | equipment | 0 |
| 2024-10-01 | human | 0 |
| 2024-10-01 | lightning | 0 |
| 2025-01-01 | equipment | 0 |
| 2025-01-01 | human | 0 |
| 2025-01-01 | lightning | 0 |
| 2025-04-01 | equipment | 0 |
| 2025-04-01 | human | 0 |
| 2025-04-01 | lightning | 0 |
| 2025-07-01 | equipment | 1 |
| 2025-07-01 | human | 0 |
| 2025-07-01 | lightning | 0 |
| 2025-10-01 | equipment | 0 |
| 2025-10-01 | human | 0 |
| 2025-10-01 | lightning | 0 |
| 2026-01-01 | equipment | 0 |
| 2026-01-01 | human | 0 |
| 2026-01-01 | lightning | 0 |
| 2026-04-01 | equipment | 0 |
| 2026-04-01 | human | 0 |
| 2026-04-01 | lightning | 0 |
| 2026-07-01 | equipment | 1 |
| 2026-07-01 | human | 0 |
| 2026-07-01 | lightning | 0 |
Figure 27. Summarize within: Fire perimeters 81
| period | series | value |
|---|---|---|
| 2017-07-01 | equipment | 1 |
| 2017-07-01 | human | 0 |
| 2017-07-01 | lightning | 0 |
| 2017-10-01 | equipment | 0 |
| 2017-10-01 | human | 0 |
| 2017-10-01 | lightning | 0 |
| 2018-01-01 | equipment | 0 |
| 2018-01-01 | human | 0 |
| 2018-01-01 | lightning | 0 |
| 2018-04-01 | equipment | 0 |
| 2018-04-01 | human | 0 |
| 2018-04-01 | lightning | 0 |
| 2018-07-01 | equipment | 0 |
| 2018-07-01 | human | 1 |
| 2018-07-01 | lightning | 0 |
| 2018-10-01 | equipment | 0 |
| 2018-10-01 | human | 0 |
| 2018-10-01 | lightning | 0 |
| 2019-01-01 | equipment | 0 |
| 2019-01-01 | human | 0 |
| 2019-01-01 | lightning | 0 |
| 2019-04-01 | equipment | 0 |
| 2019-04-01 | human | 0 |
| 2019-04-01 | lightning | 0 |
| 2019-07-01 | equipment | 0 |
| 2019-07-01 | human | 0 |
| 2019-07-01 | lightning | 1 |
| 2019-10-01 | equipment | 0 |
| 2019-10-01 | human | 0 |
| 2019-10-01 | lightning | 0 |
| 2020-01-01 | equipment | 0 |
| 2020-01-01 | human | 0 |
| 2020-01-01 | lightning | 0 |
| 2020-04-01 | equipment | 0 |
| 2020-04-01 | human | 0 |
| 2020-04-01 | lightning | 0 |
| 2020-07-01 | equipment | 1 |
| 2020-07-01 | human | 0 |
| 2020-07-01 | lightning | 0 |
| 2020-10-01 | equipment | 0 |
| 2020-10-01 | human | 0 |
| 2020-10-01 | lightning | 0 |
| 2021-01-01 | equipment | 0 |
| 2021-01-01 | human | 0 |
| 2021-01-01 | lightning | 0 |
| 2021-04-01 | equipment | 0 |
| 2021-04-01 | human | 0 |
| 2021-04-01 | lightning | 0 |
| 2021-07-01 | equipment | 1 |
| 2021-07-01 | human | 0 |
| 2021-07-01 | lightning | 0 |
| 2021-10-01 | equipment | 0 |
| 2021-10-01 | human | 0 |
| 2021-10-01 | lightning | 0 |
| 2022-01-01 | equipment | 0 |
| 2022-01-01 | human | 0 |
| 2022-01-01 | lightning | 0 |
| 2022-04-01 | equipment | 0 |
| 2022-04-01 | human | 0 |
| 2022-04-01 | lightning | 0 |
| 2022-07-01 | equipment | 0 |
| 2022-07-01 | human | 1 |
| 2022-07-01 | lightning | 0 |
| 2022-10-01 | equipment | 0 |
| 2022-10-01 | human | 0 |
| 2022-10-01 | lightning | 0 |
| 2023-01-01 | equipment | 0 |
| 2023-01-01 | human | 0 |
| 2023-01-01 | lightning | 0 |
| 2023-04-01 | equipment | 0 |
| 2023-04-01 | human | 0 |
| 2023-04-01 | lightning | 0 |
| 2023-07-01 | equipment | 0 |
| 2023-07-01 | human | 1 |
| 2023-07-01 | lightning | 0 |
| 2023-10-01 | equipment | 0 |
| 2023-10-01 | human | 0 |
| 2023-10-01 | lightning | 0 |
| 2024-01-01 | equipment | 0 |
| 2024-01-01 | human | 0 |
| 2024-01-01 | lightning | 0 |
| 2024-04-01 | equipment | 0 |
| 2024-04-01 | human | 0 |
| 2024-04-01 | lightning | 0 |
| 2024-07-01 | equipment | 1 |
| 2024-07-01 | human | 0 |
| 2024-07-01 | lightning | 0 |
| 2024-10-01 | equipment | 0 |
| 2024-10-01 | human | 0 |
| 2024-10-01 | lightning | 0 |
| 2025-01-01 | equipment | 0 |
| 2025-01-01 | human | 0 |
| 2025-01-01 | lightning | 0 |
| 2025-04-01 | equipment | 0 |
| 2025-04-01 | human | 0 |
| 2025-04-01 | lightning | 0 |
| 2025-07-01 | equipment | 1 |
| 2025-07-01 | human | 0 |
| 2025-07-01 | lightning | 0 |
| 2025-10-01 | equipment | 0 |
| 2025-10-01 | human | 0 |
| 2025-10-01 | lightning | 0 |
| 2026-01-01 | equipment | 0 |
| 2026-01-01 | human | 0 |
| 2026-01-01 | lightning | 0 |
| 2026-04-01 | equipment | 0 |
| 2026-04-01 | human | 0 |
| 2026-04-01 | lightning | 0 |
| 2026-07-01 | equipment | 1 |
| 2026-07-01 | human | 0 |
| 2026-07-01 | lightning | 0 |
Figure 28. Summarize within: Fire perimeters 82
| period | series | value |
|---|---|---|
| 2017-07-01 | equipment | 1 |
| 2017-07-01 | human | 0 |
| 2017-07-01 | lightning | 0 |
| 2017-10-01 | equipment | 0 |
| 2017-10-01 | human | 0 |
| 2017-10-01 | lightning | 0 |
| 2018-01-01 | equipment | 0 |
| 2018-01-01 | human | 0 |
| 2018-01-01 | lightning | 0 |
| 2018-04-01 | equipment | 0 |
| 2018-04-01 | human | 0 |
| 2018-04-01 | lightning | 0 |
| 2018-07-01 | equipment | 0 |
| 2018-07-01 | human | 1 |
| 2018-07-01 | lightning | 0 |
| 2018-10-01 | equipment | 0 |
| 2018-10-01 | human | 0 |
| 2018-10-01 | lightning | 0 |
| 2019-01-01 | equipment | 0 |
| 2019-01-01 | human | 0 |
| 2019-01-01 | lightning | 0 |
| 2019-04-01 | equipment | 0 |
| 2019-04-01 | human | 0 |
| 2019-04-01 | lightning | 0 |
| 2019-07-01 | equipment | 0 |
| 2019-07-01 | human | 0 |
| 2019-07-01 | lightning | 1 |
| 2019-10-01 | equipment | 0 |
| 2019-10-01 | human | 0 |
| 2019-10-01 | lightning | 0 |
| 2020-01-01 | equipment | 0 |
| 2020-01-01 | human | 0 |
| 2020-01-01 | lightning | 0 |
| 2020-04-01 | equipment | 0 |
| 2020-04-01 | human | 0 |
| 2020-04-01 | lightning | 0 |
| 2020-07-01 | equipment | 1 |
| 2020-07-01 | human | 0 |
| 2020-07-01 | lightning | 0 |
| 2020-10-01 | equipment | 0 |
| 2020-10-01 | human | 0 |
| 2020-10-01 | lightning | 0 |
| 2021-01-01 | equipment | 0 |
| 2021-01-01 | human | 0 |
| 2021-01-01 | lightning | 0 |
| 2021-04-01 | equipment | 0 |
| 2021-04-01 | human | 0 |
| 2021-04-01 | lightning | 0 |
| 2021-07-01 | equipment | 1 |
| 2021-07-01 | human | 0 |
| 2021-07-01 | lightning | 0 |
| 2021-10-01 | equipment | 0 |
| 2021-10-01 | human | 0 |
| 2021-10-01 | lightning | 0 |
| 2022-01-01 | equipment | 0 |
| 2022-01-01 | human | 0 |
| 2022-01-01 | lightning | 0 |
| 2022-04-01 | equipment | 0 |
| 2022-04-01 | human | 0 |
| 2022-04-01 | lightning | 0 |
| 2022-07-01 | equipment | 0 |
| 2022-07-01 | human | 1 |
| 2022-07-01 | lightning | 0 |
| 2022-10-01 | equipment | 0 |
| 2022-10-01 | human | 0 |
| 2022-10-01 | lightning | 0 |
| 2023-01-01 | equipment | 0 |
| 2023-01-01 | human | 0 |
| 2023-01-01 | lightning | 0 |
| 2023-04-01 | equipment | 0 |
| 2023-04-01 | human | 0 |
| 2023-04-01 | lightning | 0 |
| 2023-07-01 | equipment | 0 |
| 2023-07-01 | human | 1 |
| 2023-07-01 | lightning | 0 |
| 2023-10-01 | equipment | 0 |
| 2023-10-01 | human | 0 |
| 2023-10-01 | lightning | 0 |
| 2024-01-01 | equipment | 0 |
| 2024-01-01 | human | 0 |
| 2024-01-01 | lightning | 0 |
| 2024-04-01 | equipment | 0 |
| 2024-04-01 | human | 0 |
| 2024-04-01 | lightning | 0 |
| 2024-07-01 | equipment | 1 |
| 2024-07-01 | human | 0 |
| 2024-07-01 | lightning | 0 |
| 2024-10-01 | equipment | 0 |
| 2024-10-01 | human | 0 |
| 2024-10-01 | lightning | 0 |
| 2025-01-01 | equipment | 0 |
| 2025-01-01 | human | 0 |
| 2025-01-01 | lightning | 0 |
| 2025-04-01 | equipment | 0 |
| 2025-04-01 | human | 0 |
| 2025-04-01 | lightning | 0 |
| 2025-07-01 | equipment | 1 |
| 2025-07-01 | human | 0 |
| 2025-07-01 | lightning | 0 |
| 2025-10-01 | equipment | 0 |
| 2025-10-01 | human | 0 |
| 2025-10-01 | lightning | 0 |
| 2026-01-01 | equipment | 0 |
| 2026-01-01 | human | 0 |
| 2026-01-01 | lightning | 0 |
| 2026-04-01 | equipment | 0 |
| 2026-04-01 | human | 0 |
| 2026-04-01 | lightning | 0 |
| 2026-07-01 | equipment | 1 |
| 2026-07-01 | human | 0 |
| 2026-07-01 | lightning | 0 |
Figure 29. Find point clusters: Ignitions 83
| cluster | features | fraction | share |
|---|---|---|---|
| 0 | 524 | 0.5822 | 58.2% |
| Noise | 376 | 0.4178 | 41.8% |
Figure 30. Find point clusters: cluster hulls 84
| cluster | features | fraction | share |
|---|---|---|---|
| 0 | 1 | 1 | 100.0% |
Figure 31. Calculate density: Ignitions 85
| bin_start | bin_end | count |
|---|---|---|
| 0 | 4.154 | 145 |
| 4.154 | 8.308 | 161 |
| 8.308 | 12.46 | 160 |
| 12.46 | 16.62 | 164 |
| 16.62 | 20.77 | 166 |
| 20.77 | 24.92 | 165 |
| 24.92 | 29.08 | 209 |
| 29.08 | 33.23 | 167 |
| 33.23 | 37.38 | 163 |
| 37.38 | 41.54 | 138 |
| 41.54 | 45.69 | 160 |
| 45.69 | 49.85 | 166 |
| 49.85 | 54 | 172 |
Figure 32. Find outliers: Fire perimeters 86
| value | lag | type |
|---|---|---|
| 1.294 | 0.0567 | NS |
| -0.956 | 0.1016 | NS |
| 1.647 | -0.9042 | NS |
| -0.9664 | 0.6304 | NS |
| -1.391 | 0.3297 | NS |
| -0.9042 | 0.9363 | NS |
| -0.1265 | -0.9301 | NS |
| 0.1431 | 1.294 | NS |
| 0.9311 | -0.0617 | NS |
| 0.3297 | -0.5957 | NS |
Figure 33. Find outliers: Fuel treatments 87
| value | lag | type |
|---|---|---|
| -0.4185 | 0.1036 | NS |
| 1.695 | -0.6008 | NS |
| -0.1947 | -0.0373 | NS |
| -0.5179 | 0.0704 | NS |
| -0.8411 | 0.8245 | NS |
| -1.015 | -1.438 | NS |
| 1.198 | -0.203 | NS |
| -1.438 | 0.6174 | NS |
| 1.67 | -0.1202 | NS |
| -0.5428 | 0.3771 | NS |
| -0.145 | -0.1761 | NS |
| 0.5511 | -0.2859 | NS |
Figure 34. Find outliers: Fuel units 88
| value | lag | type |
|---|---|---|
| 0.2369 | 0.0143 | NS |
| 1.289 | -0.0868 | NS |
| 0.4292 | 0.1965 | NS |
| 0.3179 | 0.554 | NS |
| -0.3803 | 0.2369 | NS |
| 0.3179 | -1.336 | NS |
| -0.5219 | -0.7344 | NS |
| 0.8035 | -0.1551 | NS |
| -1.392 | 0.9781 | NS |
| 0.2774 | -0.8153 | NS |
| 0.0953 | 0.4089 | NS |
| 1.239 | 1.279 | NS |
| -0.7749 | 0.8895 | NS |
| 2.21 | -0.6484 | NS |
| -1.352 | -0.043 | NS |
| 1.218 | 0.1965 | NS |
| -0.876 | -1.331 | NS |
| -0.3904 | 1.132 | NS |
| 0.9249 | -0.9013 | NS |
| -1.331 | -0.6459 | NS |
| -0.532 | 0.4292 | NS |
| -0.8963 | 1.218 | NS |
| -0.4106 | -1.352 | NS |
| 2.2 | 0.3179 | NS |
| -1.281 | -0.5067 | NS |
| -0.0868 | -0.188 | NS |
| -1.352 | -0.1206 | NS |
| 0.1459 | 0.075 | NS |
| 1.461 | -0.1206 | NS |
| -0.876 | -0.5573 | NS |
| 1.279 | 1.239 | NS |
| -0.8153 | 0.2774 | NS |
| -0.3094 | -0.2892 | NS |
| 0.2369 | -0.3128 | NS |
| -1.382 | -0.0093 | NS |
| 0.2774 | -0.5573 | NS |
Figure 35. Find outliers: Fuel treatments over time 89
| period | series | value |
|---|---|---|
| 2019-04-01 | prescribed burn | 0 |
| 2019-04-01 | mastication | 1 |
| 2019-04-01 | thinning | 0 |
| 2019-07-01 | prescribed burn | 0 |
| 2019-07-01 | mastication | 0 |
| 2019-07-01 | thinning | 0 |
| 2019-10-01 | prescribed burn | 0 |
| 2019-10-01 | mastication | 0 |
| 2019-10-01 | thinning | 0 |
| 2020-01-01 | prescribed burn | 1 |
| 2020-01-01 | mastication | 0 |
| 2020-01-01 | thinning | 0 |
| 2020-04-01 | prescribed burn | 0 |
| 2020-04-01 | mastication | 0 |
| 2020-04-01 | thinning | 1 |
| 2020-07-01 | prescribed burn | 0 |
| 2020-07-01 | mastication | 0 |
| 2020-07-01 | thinning | 0 |
| 2020-10-01 | prescribed burn | 0 |
| 2020-10-01 | mastication | 0 |
| 2020-10-01 | thinning | 0 |
| 2021-01-01 | prescribed burn | 0 |
| 2021-01-01 | mastication | 0 |
| 2021-01-01 | thinning | 0 |
| 2021-04-01 | prescribed burn | 0 |
| 2021-04-01 | mastication | 0 |
| 2021-04-01 | thinning | 0 |
| 2021-07-01 | prescribed burn | 1 |
| 2021-07-01 | mastication | 1 |
| 2021-07-01 | thinning | 0 |
| 2021-10-01 | prescribed burn | 0 |
| 2021-10-01 | mastication | 0 |
| 2021-10-01 | thinning | 0 |
| 2022-01-01 | prescribed burn | 0 |
| 2022-01-01 | mastication | 0 |
| 2022-01-01 | thinning | 0 |
| 2022-04-01 | prescribed burn | 1 |
| 2022-04-01 | mastication | 0 |
| 2022-04-01 | thinning | 0 |
| 2022-07-01 | prescribed burn | 0 |
| 2022-07-01 | mastication | 0 |
| 2022-07-01 | thinning | 0 |
| 2022-10-01 | prescribed burn | 0 |
| 2022-10-01 | mastication | 1 |
| 2022-10-01 | thinning | 0 |
| 2023-01-01 | prescribed burn | 0 |
| 2023-01-01 | mastication | 0 |
| 2023-01-01 | thinning | 1 |
| 2023-04-01 | prescribed burn | 1 |
| 2023-04-01 | mastication | 0 |
| 2023-04-01 | thinning | 0 |
| 2023-07-01 | prescribed burn | 0 |
| 2023-07-01 | mastication | 0 |
| 2023-07-01 | thinning | 0 |
| 2023-10-01 | prescribed burn | 0 |
| 2023-10-01 | mastication | 0 |
| 2023-10-01 | thinning | 0 |
| 2024-01-01 | prescribed burn | 0 |
| 2024-01-01 | mastication | 0 |
| 2024-01-01 | thinning | 0 |
| 2024-04-01 | prescribed burn | 1 |
| 2024-04-01 | mastication | 0 |
| 2024-04-01 | thinning | 0 |
| 2024-07-01 | prescribed burn | 0 |
| 2024-07-01 | mastication | 0 |
| 2024-07-01 | thinning | 0 |
| 2024-10-01 | prescribed burn | 1 |
| 2024-10-01 | mastication | 0 |
| 2024-10-01 | thinning | 0 |
| 2025-01-01 | prescribed burn | 1 |
| 2025-01-01 | mastication | 0 |
| 2025-01-01 | thinning | 0 |
Figure 36. Find outliers: Fire perimeters over time 90
| period | series | value |
|---|---|---|
| 2017-07-01 | equipment | 1 |
| 2017-07-01 | human | 0 |
| 2017-07-01 | lightning | 0 |
| 2017-10-01 | equipment | 0 |
| 2017-10-01 | human | 0 |
| 2017-10-01 | lightning | 0 |
| 2018-01-01 | equipment | 0 |
| 2018-01-01 | human | 0 |
| 2018-01-01 | lightning | 0 |
| 2018-04-01 | equipment | 0 |
| 2018-04-01 | human | 0 |
| 2018-04-01 | lightning | 0 |
| 2018-07-01 | equipment | 0 |
| 2018-07-01 | human | 1 |
| 2018-07-01 | lightning | 0 |
| 2018-10-01 | equipment | 0 |
| 2018-10-01 | human | 0 |
| 2018-10-01 | lightning | 0 |
| 2019-01-01 | equipment | 0 |
| 2019-01-01 | human | 0 |
| 2019-01-01 | lightning | 0 |
| 2019-04-01 | equipment | 0 |
| 2019-04-01 | human | 0 |
| 2019-04-01 | lightning | 0 |
| 2019-07-01 | equipment | 0 |
| 2019-07-01 | human | 0 |
| 2019-07-01 | lightning | 1 |
| 2019-10-01 | equipment | 0 |
| 2019-10-01 | human | 0 |
| 2019-10-01 | lightning | 0 |
| 2020-01-01 | equipment | 0 |
| 2020-01-01 | human | 0 |
| 2020-01-01 | lightning | 0 |
| 2020-04-01 | equipment | 0 |
| 2020-04-01 | human | 0 |
| 2020-04-01 | lightning | 0 |
| 2020-07-01 | equipment | 1 |
| 2020-07-01 | human | 0 |
| 2020-07-01 | lightning | 0 |
| 2020-10-01 | equipment | 0 |
| 2020-10-01 | human | 0 |
| 2020-10-01 | lightning | 0 |
| 2021-01-01 | equipment | 0 |
| 2021-01-01 | human | 0 |
| 2021-01-01 | lightning | 0 |
| 2021-04-01 | equipment | 0 |
| 2021-04-01 | human | 0 |
| 2021-04-01 | lightning | 0 |
| 2021-07-01 | equipment | 1 |
| 2021-07-01 | human | 0 |
| 2021-07-01 | lightning | 0 |
| 2021-10-01 | equipment | 0 |
| 2021-10-01 | human | 0 |
| 2021-10-01 | lightning | 0 |
| 2022-01-01 | equipment | 0 |
| 2022-01-01 | human | 0 |
| 2022-01-01 | lightning | 0 |
| 2022-04-01 | equipment | 0 |
| 2022-04-01 | human | 0 |
| 2022-04-01 | lightning | 0 |
| 2022-07-01 | equipment | 0 |
| 2022-07-01 | human | 1 |
| 2022-07-01 | lightning | 0 |
| 2022-10-01 | equipment | 0 |
| 2022-10-01 | human | 0 |
| 2022-10-01 | lightning | 0 |
| 2023-01-01 | equipment | 0 |
| 2023-01-01 | human | 0 |
| 2023-01-01 | lightning | 0 |
| 2023-04-01 | equipment | 0 |
| 2023-04-01 | human | 0 |
| 2023-04-01 | lightning | 0 |
| 2023-07-01 | equipment | 0 |
| 2023-07-01 | human | 1 |
| 2023-07-01 | lightning | 0 |
| 2023-10-01 | equipment | 0 |
| 2023-10-01 | human | 0 |
| 2023-10-01 | lightning | 0 |
| 2024-01-01 | equipment | 0 |
| 2024-01-01 | human | 0 |
| 2024-01-01 | lightning | 0 |
| 2024-04-01 | equipment | 0 |
| 2024-04-01 | human | 0 |
| 2024-04-01 | lightning | 0 |
| 2024-07-01 | equipment | 1 |
| 2024-07-01 | human | 0 |
| 2024-07-01 | lightning | 0 |
| 2024-10-01 | equipment | 0 |
| 2024-10-01 | human | 0 |
| 2024-10-01 | lightning | 0 |
| 2025-01-01 | equipment | 0 |
| 2025-01-01 | human | 0 |
| 2025-01-01 | lightning | 0 |
| 2025-04-01 | equipment | 0 |
| 2025-04-01 | human | 0 |
| 2025-04-01 | lightning | 0 |
| 2025-07-01 | equipment | 1 |
| 2025-07-01 | human | 0 |
| 2025-07-01 | lightning | 0 |
| 2025-10-01 | equipment | 0 |
| 2025-10-01 | human | 0 |
| 2025-10-01 | lightning | 0 |
| 2026-01-01 | equipment | 0 |
| 2026-01-01 | human | 0 |
| 2026-01-01 | lightning | 0 |
| 2026-04-01 | equipment | 0 |
| 2026-04-01 | human | 0 |
| 2026-04-01 | lightning | 0 |
| 2026-07-01 | equipment | 1 |
| 2026-07-01 | human | 0 |
| 2026-07-01 | lightning | 0 |
Figure 37. Find point clusters: Ignitions over time 91
| period | series | value |
|---|---|---|
| 2018-01-01 | lightning | 0 |
| 2018-01-01 | campfire | 1 |
| 2018-01-01 | vehicle | 0 |
| 2018-01-01 | debris burning | 0 |
| 2018-01-01 | arson | 0 |
| 2018-01-01 | Other | 0 |
| 2018-04-01 | lightning | 4 |
| 2018-04-01 | campfire | 7 |
| 2018-04-01 | vehicle | 1 |
| 2018-04-01 | debris burning | 3 |
| 2018-04-01 | arson | 1 |
| 2018-04-01 | Other | 2 |
| 2018-07-01 | lightning | 8 |
| 2018-07-01 | campfire | 7 |
| 2018-07-01 | vehicle | 4 |
| 2018-07-01 | debris burning | 5 |
| 2018-07-01 | arson | 7 |
| 2018-07-01 | Other | 2 |
| 2018-10-01 | lightning | 4 |
| 2018-10-01 | campfire | 4 |
| 2018-10-01 | vehicle | 2 |
| 2018-10-01 | debris burning | 1 |
| 2018-10-01 | arson | 3 |
| 2018-10-01 | Other | 8 |
| 2019-01-01 | lightning | 0 |
| 2019-01-01 | campfire | 1 |
| 2019-01-01 | vehicle | 0 |
| 2019-01-01 | debris burning | 2 |
| 2019-01-01 | arson | 1 |
| 2019-01-01 | Other | 1 |
| 2019-04-01 | lightning | 8 |
| 2019-04-01 | campfire | 7 |
| 2019-04-01 | vehicle | 3 |
| 2019-04-01 | debris burning | 3 |
| 2019-04-01 | arson | 1 |
| 2019-04-01 | Other | 4 |
| 2019-07-01 | lightning | 15 |
| 2019-07-01 | campfire | 1 |
| 2019-07-01 | vehicle | 7 |
| 2019-07-01 | debris burning | 5 |
| 2019-07-01 | arson | 7 |
| 2019-07-01 | Other | 4 |
| 2019-10-01 | lightning | 4 |
| 2019-10-01 | campfire | 4 |
| 2019-10-01 | vehicle | 1 |
| 2019-10-01 | debris burning | 4 |
| 2019-10-01 | arson | 1 |
| 2019-10-01 | Other | 2 |
| 2020-01-01 | lightning | 0 |
| 2020-01-01 | campfire | 1 |
| 2020-01-01 | vehicle | 0 |
| 2020-01-01 | debris burning | 0 |
| 2020-01-01 | arson | 1 |
| 2020-01-01 | Other | 0 |
| 2020-04-01 | lightning | 6 |
| 2020-04-01 | campfire | 1 |
| 2020-04-01 | vehicle | 3 |
| 2020-04-01 | debris burning | 4 |
| 2020-04-01 | arson | 3 |
| 2020-04-01 | Other | 4 |
| 2020-07-01 | lightning | 13 |
| 2020-07-01 | campfire | 9 |
| 2020-07-01 | vehicle | 4 |
| 2020-07-01 | debris burning | 1 |
| 2020-07-01 | arson | 6 |
| 2020-07-01 | Other | 5 |
| 2020-10-01 | lightning | 5 |
| 2020-10-01 | campfire | 3 |
| 2020-10-01 | vehicle | 5 |
| 2020-10-01 | debris burning | 4 |
| 2020-10-01 | arson | 2 |
| 2020-10-01 | Other | 3 |
| 2021-01-01 | lightning | 1 |
| 2021-01-01 | campfire | 0 |
| 2021-01-01 | vehicle | 0 |
| 2021-01-01 | debris burning | 0 |
| 2021-01-01 | arson | 0 |
| 2021-01-01 | Other | 0 |
| 2021-04-01 | lightning | 6 |
| 2021-04-01 | campfire | 8 |
| 2021-04-01 | vehicle | 0 |
| 2021-04-01 | debris burning | 5 |
| 2021-04-01 | arson | 3 |
| 2021-04-01 | Other | 5 |
| 2021-07-01 | lightning | 21 |
| 2021-07-01 | campfire | 8 |
| 2021-07-01 | vehicle | 4 |
| 2021-07-01 | debris burning | 8 |
| 2021-07-01 | arson | 3 |
| 2021-07-01 | Other | 3 |
| 2021-10-01 | lightning | 3 |
| 2021-10-01 | campfire | 11 |
| 2021-10-01 | vehicle | 3 |
| 2021-10-01 | debris burning | 5 |
| 2021-10-01 | arson | 1 |
| 2021-10-01 | Other | 9 |
| 2022-01-01 | lightning | 0 |
| 2022-01-01 | campfire | 1 |
| 2022-01-01 | vehicle | 0 |
| 2022-01-01 | debris burning | 3 |
| 2022-01-01 | arson | 0 |
| 2022-01-01 | Other | 1 |
| 2022-04-01 | lightning | 9 |
| 2022-04-01 | campfire | 7 |
| 2022-04-01 | vehicle | 2 |
| 2022-04-01 | debris burning | 2 |
| 2022-04-01 | arson | 0 |
| 2022-04-01 | Other | 1 |
| 2022-07-01 | lightning | 23 |
| 2022-07-01 | campfire | 7 |
| 2022-07-01 | vehicle | 8 |
| 2022-07-01 | debris burning | 5 |
| 2022-07-01 | arson | 6 |
| 2022-07-01 | Other | 3 |
| 2022-10-01 | lightning | 1 |
| 2022-10-01 | campfire | 7 |
| 2022-10-01 | vehicle | 3 |
| 2022-10-01 | debris burning | 5 |
| 2022-10-01 | arson | 3 |
| 2022-10-01 | Other | 9 |
| 2023-01-01 | lightning | 0 |
| 2023-01-01 | campfire | 1 |
| 2023-01-01 | vehicle | 0 |
| 2023-01-01 | debris burning | 2 |
| 2023-01-01 | arson | 2 |
| 2023-01-01 | Other | 0 |
| 2023-04-01 | lightning | 10 |
| 2023-04-01 | campfire | 4 |
| 2023-04-01 | vehicle | 4 |
| 2023-04-01 | debris burning | 2 |
| 2023-04-01 | arson | 4 |
| 2023-04-01 | Other | 7 |
| 2023-07-01 | lightning | 16 |
| 2023-07-01 | campfire | 9 |
| 2023-07-01 | vehicle | 6 |
| 2023-07-01 | debris burning | 4 |
| 2023-07-01 | arson | 10 |
| 2023-07-01 | Other | 3 |
| 2023-10-01 | lightning | 1 |
| 2023-10-01 | campfire | 9 |
| 2023-10-01 | vehicle | 6 |
| 2023-10-01 | debris burning | 2 |
| 2023-10-01 | arson | 5 |
| 2023-10-01 | Other | 11 |
| 2024-01-01 | lightning | 1 |
| 2024-01-01 | campfire | 0 |
| 2024-01-01 | vehicle | 1 |
| 2024-01-01 | debris burning | 0 |
| 2024-01-01 | arson | 0 |
| 2024-01-01 | Other | 2 |
| 2024-04-01 | lightning | 6 |
| 2024-04-01 | campfire | 6 |
| 2024-04-01 | vehicle | 6 |
| 2024-04-01 | debris burning | 3 |
| 2024-04-01 | arson | 3 |
| 2024-04-01 | Other | 12 |
| 2024-07-01 | lightning | 14 |
| 2024-07-01 | campfire | 17 |
| 2024-07-01 | vehicle | 4 |
| 2024-07-01 | debris burning | 5 |
| 2024-07-01 | arson | 5 |
| 2024-07-01 | Other | 3 |
| 2024-10-01 | lightning | 4 |
| 2024-10-01 | campfire | 6 |
| 2024-10-01 | vehicle | 1 |
| 2024-10-01 | debris burning | 6 |
| 2024-10-01 | arson | 2 |
| 2024-10-01 | Other | 13 |
| 2025-01-01 | lightning | 1 |
| 2025-01-01 | campfire | 1 |
| 2025-01-01 | vehicle | 0 |
| 2025-01-01 | debris burning | 1 |
| 2025-01-01 | arson | 2 |
| 2025-01-01 | Other | 2 |
| 2025-04-01 | lightning | 10 |
| 2025-04-01 | campfire | 7 |
| 2025-04-01 | vehicle | 6 |
| 2025-04-01 | debris burning | 3 |
| 2025-04-01 | arson | 3 |
| 2025-04-01 | Other | 6 |
| 2025-07-01 | lightning | 27 |
| 2025-07-01 | campfire | 10 |
| 2025-07-01 | vehicle | 7 |
| 2025-07-01 | debris burning | 5 |
| 2025-07-01 | arson | 6 |
| 2025-07-01 | Other | 6 |
| 2025-10-01 | lightning | 4 |
| 2025-10-01 | campfire | 4 |
| 2025-10-01 | vehicle | 5 |
| 2025-10-01 | debris burning | 1 |
| 2025-10-01 | arson | 2 |
| 2025-10-01 | Other | 8 |
| 2026-01-01 | lightning | 0 |
| 2026-01-01 | campfire | 0 |
| 2026-01-01 | vehicle | 2 |
| 2026-01-01 | debris burning | 0 |
| 2026-01-01 | arson | 0 |
| 2026-01-01 | Other | 0 |
| 2026-04-01 | lightning | 2 |
| 2026-04-01 | campfire | 6 |
| 2026-04-01 | vehicle | 3 |
| 2026-04-01 | debris burning | 5 |
| 2026-04-01 | arson | 0 |
| 2026-04-01 | Other | 4 |
| 2026-07-01 | lightning | 16 |
| 2026-07-01 | campfire | 11 |
| 2026-07-01 | vehicle | 11 |
| 2026-07-01 | debris burning | 6 |
| 2026-07-01 | arson | 6 |
| 2026-07-01 | Other | 7 |
Figure 38. Summarize within: Fire perimeters over time 92
| period | series | value |
|---|---|---|
| 2017-07-01 | equipment | 1 |
| 2017-07-01 | human | 0 |
| 2017-07-01 | lightning | 0 |
| 2017-10-01 | equipment | 0 |
| 2017-10-01 | human | 0 |
| 2017-10-01 | lightning | 0 |
| 2018-01-01 | equipment | 0 |
| 2018-01-01 | human | 0 |
| 2018-01-01 | lightning | 0 |
| 2018-04-01 | equipment | 0 |
| 2018-04-01 | human | 0 |
| 2018-04-01 | lightning | 0 |
| 2018-07-01 | equipment | 0 |
| 2018-07-01 | human | 1 |
| 2018-07-01 | lightning | 0 |
| 2018-10-01 | equipment | 0 |
| 2018-10-01 | human | 0 |
| 2018-10-01 | lightning | 0 |
| 2019-01-01 | equipment | 0 |
| 2019-01-01 | human | 0 |
| 2019-01-01 | lightning | 0 |
| 2019-04-01 | equipment | 0 |
| 2019-04-01 | human | 0 |
| 2019-04-01 | lightning | 0 |
| 2019-07-01 | equipment | 0 |
| 2019-07-01 | human | 0 |
| 2019-07-01 | lightning | 1 |
| 2019-10-01 | equipment | 0 |
| 2019-10-01 | human | 0 |
| 2019-10-01 | lightning | 0 |
| 2020-01-01 | equipment | 0 |
| 2020-01-01 | human | 0 |
| 2020-01-01 | lightning | 0 |
| 2020-04-01 | equipment | 0 |
| 2020-04-01 | human | 0 |
| 2020-04-01 | lightning | 0 |
| 2020-07-01 | equipment | 1 |
| 2020-07-01 | human | 0 |
| 2020-07-01 | lightning | 0 |
| 2020-10-01 | equipment | 0 |
| 2020-10-01 | human | 0 |
| 2020-10-01 | lightning | 0 |
| 2021-01-01 | equipment | 0 |
| 2021-01-01 | human | 0 |
| 2021-01-01 | lightning | 0 |
| 2021-04-01 | equipment | 0 |
| 2021-04-01 | human | 0 |
| 2021-04-01 | lightning | 0 |
| 2021-07-01 | equipment | 1 |
| 2021-07-01 | human | 0 |
| 2021-07-01 | lightning | 0 |
| 2021-10-01 | equipment | 0 |
| 2021-10-01 | human | 0 |
| 2021-10-01 | lightning | 0 |
| 2022-01-01 | equipment | 0 |
| 2022-01-01 | human | 0 |
| 2022-01-01 | lightning | 0 |
| 2022-04-01 | equipment | 0 |
| 2022-04-01 | human | 0 |
| 2022-04-01 | lightning | 0 |
| 2022-07-01 | equipment | 0 |
| 2022-07-01 | human | 1 |
| 2022-07-01 | lightning | 0 |
| 2022-10-01 | equipment | 0 |
| 2022-10-01 | human | 0 |
| 2022-10-01 | lightning | 0 |
| 2023-01-01 | equipment | 0 |
| 2023-01-01 | human | 0 |
| 2023-01-01 | lightning | 0 |
| 2023-04-01 | equipment | 0 |
| 2023-04-01 | human | 0 |
| 2023-04-01 | lightning | 0 |
| 2023-07-01 | equipment | 0 |
| 2023-07-01 | human | 1 |
| 2023-07-01 | lightning | 0 |
| 2023-10-01 | equipment | 0 |
| 2023-10-01 | human | 0 |
| 2023-10-01 | lightning | 0 |
| 2024-01-01 | equipment | 0 |
| 2024-01-01 | human | 0 |
| 2024-01-01 | lightning | 0 |
| 2024-04-01 | equipment | 0 |
| 2024-04-01 | human | 0 |
| 2024-04-01 | lightning | 0 |
| 2024-07-01 | equipment | 1 |
| 2024-07-01 | human | 0 |
| 2024-07-01 | lightning | 0 |
| 2024-10-01 | equipment | 0 |
| 2024-10-01 | human | 0 |
| 2024-10-01 | lightning | 0 |
| 2025-01-01 | equipment | 0 |
| 2025-01-01 | human | 0 |
| 2025-01-01 | lightning | 0 |
| 2025-04-01 | equipment | 0 |
| 2025-04-01 | human | 0 |
| 2025-04-01 | lightning | 0 |
| 2025-07-01 | equipment | 1 |
| 2025-07-01 | human | 0 |
| 2025-07-01 | lightning | 0 |
| 2025-10-01 | equipment | 0 |
| 2025-10-01 | human | 0 |
| 2025-10-01 | lightning | 0 |
| 2026-01-01 | equipment | 0 |
| 2026-01-01 | human | 0 |
| 2026-01-01 | lightning | 0 |
| 2026-04-01 | equipment | 0 |
| 2026-04-01 | human | 0 |
| 2026-04-01 | lightning | 0 |
| 2026-07-01 | equipment | 1 |
| 2026-07-01 | human | 0 |
| 2026-07-01 | lightning | 0 |
Figure 39. Summarize within: Fire perimeters over time 93
| period | series | value |
|---|---|---|
| 2017-07-01 | equipment | 1 |
| 2017-07-01 | human | 0 |
| 2017-07-01 | lightning | 0 |
| 2017-10-01 | equipment | 0 |
| 2017-10-01 | human | 0 |
| 2017-10-01 | lightning | 0 |
| 2018-01-01 | equipment | 0 |
| 2018-01-01 | human | 0 |
| 2018-01-01 | lightning | 0 |
| 2018-04-01 | equipment | 0 |
| 2018-04-01 | human | 0 |
| 2018-04-01 | lightning | 0 |
| 2018-07-01 | equipment | 0 |
| 2018-07-01 | human | 1 |
| 2018-07-01 | lightning | 0 |
| 2018-10-01 | equipment | 0 |
| 2018-10-01 | human | 0 |
| 2018-10-01 | lightning | 0 |
| 2019-01-01 | equipment | 0 |
| 2019-01-01 | human | 0 |
| 2019-01-01 | lightning | 0 |
| 2019-04-01 | equipment | 0 |
| 2019-04-01 | human | 0 |
| 2019-04-01 | lightning | 0 |
| 2019-07-01 | equipment | 0 |
| 2019-07-01 | human | 0 |
| 2019-07-01 | lightning | 1 |
| 2019-10-01 | equipment | 0 |
| 2019-10-01 | human | 0 |
| 2019-10-01 | lightning | 0 |
| 2020-01-01 | equipment | 0 |
| 2020-01-01 | human | 0 |
| 2020-01-01 | lightning | 0 |
| 2020-04-01 | equipment | 0 |
| 2020-04-01 | human | 0 |
| 2020-04-01 | lightning | 0 |
| 2020-07-01 | equipment | 1 |
| 2020-07-01 | human | 0 |
| 2020-07-01 | lightning | 0 |
| 2020-10-01 | equipment | 0 |
| 2020-10-01 | human | 0 |
| 2020-10-01 | lightning | 0 |
| 2021-01-01 | equipment | 0 |
| 2021-01-01 | human | 0 |
| 2021-01-01 | lightning | 0 |
| 2021-04-01 | equipment | 0 |
| 2021-04-01 | human | 0 |
| 2021-04-01 | lightning | 0 |
| 2021-07-01 | equipment | 1 |
| 2021-07-01 | human | 0 |
| 2021-07-01 | lightning | 0 |
| 2021-10-01 | equipment | 0 |
| 2021-10-01 | human | 0 |
| 2021-10-01 | lightning | 0 |
| 2022-01-01 | equipment | 0 |
| 2022-01-01 | human | 0 |
| 2022-01-01 | lightning | 0 |
| 2022-04-01 | equipment | 0 |
| 2022-04-01 | human | 0 |
| 2022-04-01 | lightning | 0 |
| 2022-07-01 | equipment | 0 |
| 2022-07-01 | human | 1 |
| 2022-07-01 | lightning | 0 |
| 2022-10-01 | equipment | 0 |
| 2022-10-01 | human | 0 |
| 2022-10-01 | lightning | 0 |
| 2023-01-01 | equipment | 0 |
| 2023-01-01 | human | 0 |
| 2023-01-01 | lightning | 0 |
| 2023-04-01 | equipment | 0 |
| 2023-04-01 | human | 0 |
| 2023-04-01 | lightning | 0 |
| 2023-07-01 | equipment | 0 |
| 2023-07-01 | human | 1 |
| 2023-07-01 | lightning | 0 |
| 2023-10-01 | equipment | 0 |
| 2023-10-01 | human | 0 |
| 2023-10-01 | lightning | 0 |
| 2024-01-01 | equipment | 0 |
| 2024-01-01 | human | 0 |
| 2024-01-01 | lightning | 0 |
| 2024-04-01 | equipment | 0 |
| 2024-04-01 | human | 0 |
| 2024-04-01 | lightning | 0 |
| 2024-07-01 | equipment | 1 |
| 2024-07-01 | human | 0 |
| 2024-07-01 | lightning | 0 |
| 2024-10-01 | equipment | 0 |
| 2024-10-01 | human | 0 |
| 2024-10-01 | lightning | 0 |
| 2025-01-01 | equipment | 0 |
| 2025-01-01 | human | 0 |
| 2025-01-01 | lightning | 0 |
| 2025-04-01 | equipment | 0 |
| 2025-04-01 | human | 0 |
| 2025-04-01 | lightning | 0 |
| 2025-07-01 | equipment | 1 |
| 2025-07-01 | human | 0 |
| 2025-07-01 | lightning | 0 |
| 2025-10-01 | equipment | 0 |
| 2025-10-01 | human | 0 |
| 2025-10-01 | lightning | 0 |
| 2026-01-01 | equipment | 0 |
| 2026-01-01 | human | 0 |
| 2026-01-01 | lightning | 0 |
| 2026-04-01 | equipment | 0 |
| 2026-04-01 | human | 0 |
| 2026-04-01 | lightning | 0 |
| 2026-07-01 | equipment | 1 |
| 2026-07-01 | human | 0 |
| 2026-07-01 | lightning | 0 |
Figure 40. Summarize within: Fire perimeters over time 94
| period | series | value |
|---|---|---|
| 2017-07-01 | equipment | 1 |
| 2017-07-01 | human | 0 |
| 2017-07-01 | lightning | 0 |
| 2017-10-01 | equipment | 0 |
| 2017-10-01 | human | 0 |
| 2017-10-01 | lightning | 0 |
| 2018-01-01 | equipment | 0 |
| 2018-01-01 | human | 0 |
| 2018-01-01 | lightning | 0 |
| 2018-04-01 | equipment | 0 |
| 2018-04-01 | human | 0 |
| 2018-04-01 | lightning | 0 |
| 2018-07-01 | equipment | 0 |
| 2018-07-01 | human | 1 |
| 2018-07-01 | lightning | 0 |
| 2018-10-01 | equipment | 0 |
| 2018-10-01 | human | 0 |
| 2018-10-01 | lightning | 0 |
| 2019-01-01 | equipment | 0 |
| 2019-01-01 | human | 0 |
| 2019-01-01 | lightning | 0 |
| 2019-04-01 | equipment | 0 |
| 2019-04-01 | human | 0 |
| 2019-04-01 | lightning | 0 |
| 2019-07-01 | equipment | 0 |
| 2019-07-01 | human | 0 |
| 2019-07-01 | lightning | 1 |
| 2019-10-01 | equipment | 0 |
| 2019-10-01 | human | 0 |
| 2019-10-01 | lightning | 0 |
| 2020-01-01 | equipment | 0 |
| 2020-01-01 | human | 0 |
| 2020-01-01 | lightning | 0 |
| 2020-04-01 | equipment | 0 |
| 2020-04-01 | human | 0 |
| 2020-04-01 | lightning | 0 |
| 2020-07-01 | equipment | 1 |
| 2020-07-01 | human | 0 |
| 2020-07-01 | lightning | 0 |
| 2020-10-01 | equipment | 0 |
| 2020-10-01 | human | 0 |
| 2020-10-01 | lightning | 0 |
| 2021-01-01 | equipment | 0 |
| 2021-01-01 | human | 0 |
| 2021-01-01 | lightning | 0 |
| 2021-04-01 | equipment | 0 |
| 2021-04-01 | human | 0 |
| 2021-04-01 | lightning | 0 |
| 2021-07-01 | equipment | 1 |
| 2021-07-01 | human | 0 |
| 2021-07-01 | lightning | 0 |
| 2021-10-01 | equipment | 0 |
| 2021-10-01 | human | 0 |
| 2021-10-01 | lightning | 0 |
| 2022-01-01 | equipment | 0 |
| 2022-01-01 | human | 0 |
| 2022-01-01 | lightning | 0 |
| 2022-04-01 | equipment | 0 |
| 2022-04-01 | human | 0 |
| 2022-04-01 | lightning | 0 |
| 2022-07-01 | equipment | 0 |
| 2022-07-01 | human | 1 |
| 2022-07-01 | lightning | 0 |
| 2022-10-01 | equipment | 0 |
| 2022-10-01 | human | 0 |
| 2022-10-01 | lightning | 0 |
| 2023-01-01 | equipment | 0 |
| 2023-01-01 | human | 0 |
| 2023-01-01 | lightning | 0 |
| 2023-04-01 | equipment | 0 |
| 2023-04-01 | human | 0 |
| 2023-04-01 | lightning | 0 |
| 2023-07-01 | equipment | 0 |
| 2023-07-01 | human | 1 |
| 2023-07-01 | lightning | 0 |
| 2023-10-01 | equipment | 0 |
| 2023-10-01 | human | 0 |
| 2023-10-01 | lightning | 0 |
| 2024-01-01 | equipment | 0 |
| 2024-01-01 | human | 0 |
| 2024-01-01 | lightning | 0 |
| 2024-04-01 | equipment | 0 |
| 2024-04-01 | human | 0 |
| 2024-04-01 | lightning | 0 |
| 2024-07-01 | equipment | 1 |
| 2024-07-01 | human | 0 |
| 2024-07-01 | lightning | 0 |
| 2024-10-01 | equipment | 0 |
| 2024-10-01 | human | 0 |
| 2024-10-01 | lightning | 0 |
| 2025-01-01 | equipment | 0 |
| 2025-01-01 | human | 0 |
| 2025-01-01 | lightning | 0 |
| 2025-04-01 | equipment | 0 |
| 2025-04-01 | human | 0 |
| 2025-04-01 | lightning | 0 |
| 2025-07-01 | equipment | 1 |
| 2025-07-01 | human | 0 |
| 2025-07-01 | lightning | 0 |
| 2025-10-01 | equipment | 0 |
| 2025-10-01 | human | 0 |
| 2025-10-01 | lightning | 0 |
| 2026-01-01 | equipment | 0 |
| 2026-01-01 | human | 0 |
| 2026-01-01 | lightning | 0 |
| 2026-04-01 | equipment | 0 |
| 2026-04-01 | human | 0 |
| 2026-04-01 | lightning | 0 |
| 2026-07-01 | equipment | 1 |
| 2026-07-01 | human | 0 |
| 2026-07-01 | lightning | 0 |
Figure 41. Repeat and near repeat classification: Ignitions over time 95
| period | series | value |
|---|---|---|
| 2018-01-01 | lightning | 0 |
| 2018-01-01 | campfire | 1 |
| 2018-01-01 | vehicle | 0 |
| 2018-01-01 | debris burning | 0 |
| 2018-01-01 | arson | 0 |
| 2018-01-01 | Other | 0 |
| 2018-04-01 | lightning | 4 |
| 2018-04-01 | campfire | 7 |
| 2018-04-01 | vehicle | 1 |
| 2018-04-01 | debris burning | 3 |
| 2018-04-01 | arson | 1 |
| 2018-04-01 | Other | 2 |
| 2018-07-01 | lightning | 8 |
| 2018-07-01 | campfire | 7 |
| 2018-07-01 | vehicle | 4 |
| 2018-07-01 | debris burning | 5 |
| 2018-07-01 | arson | 7 |
| 2018-07-01 | Other | 2 |
| 2018-10-01 | lightning | 4 |
| 2018-10-01 | campfire | 4 |
| 2018-10-01 | vehicle | 2 |
| 2018-10-01 | debris burning | 1 |
| 2018-10-01 | arson | 3 |
| 2018-10-01 | Other | 8 |
| 2019-01-01 | lightning | 0 |
| 2019-01-01 | campfire | 1 |
| 2019-01-01 | vehicle | 0 |
| 2019-01-01 | debris burning | 2 |
| 2019-01-01 | arson | 1 |
| 2019-01-01 | Other | 1 |
| 2019-04-01 | lightning | 8 |
| 2019-04-01 | campfire | 7 |
| 2019-04-01 | vehicle | 3 |
| 2019-04-01 | debris burning | 3 |
| 2019-04-01 | arson | 1 |
| 2019-04-01 | Other | 4 |
| 2019-07-01 | lightning | 15 |
| 2019-07-01 | campfire | 1 |
| 2019-07-01 | vehicle | 7 |
| 2019-07-01 | debris burning | 5 |
| 2019-07-01 | arson | 7 |
| 2019-07-01 | Other | 4 |
| 2019-10-01 | lightning | 4 |
| 2019-10-01 | campfire | 4 |
| 2019-10-01 | vehicle | 1 |
| 2019-10-01 | debris burning | 4 |
| 2019-10-01 | arson | 1 |
| 2019-10-01 | Other | 2 |
| 2020-01-01 | lightning | 0 |
| 2020-01-01 | campfire | 1 |
| 2020-01-01 | vehicle | 0 |
| 2020-01-01 | debris burning | 0 |
| 2020-01-01 | arson | 1 |
| 2020-01-01 | Other | 0 |
| 2020-04-01 | lightning | 6 |
| 2020-04-01 | campfire | 1 |
| 2020-04-01 | vehicle | 3 |
| 2020-04-01 | debris burning | 4 |
| 2020-04-01 | arson | 3 |
| 2020-04-01 | Other | 4 |
| 2020-07-01 | lightning | 13 |
| 2020-07-01 | campfire | 9 |
| 2020-07-01 | vehicle | 4 |
| 2020-07-01 | debris burning | 1 |
| 2020-07-01 | arson | 6 |
| 2020-07-01 | Other | 5 |
| 2020-10-01 | lightning | 5 |
| 2020-10-01 | campfire | 3 |
| 2020-10-01 | vehicle | 5 |
| 2020-10-01 | debris burning | 4 |
| 2020-10-01 | arson | 2 |
| 2020-10-01 | Other | 3 |
| 2021-01-01 | lightning | 1 |
| 2021-01-01 | campfire | 0 |
| 2021-01-01 | vehicle | 0 |
| 2021-01-01 | debris burning | 0 |
| 2021-01-01 | arson | 0 |
| 2021-01-01 | Other | 0 |
| 2021-04-01 | lightning | 6 |
| 2021-04-01 | campfire | 8 |
| 2021-04-01 | vehicle | 0 |
| 2021-04-01 | debris burning | 5 |
| 2021-04-01 | arson | 3 |
| 2021-04-01 | Other | 5 |
| 2021-07-01 | lightning | 21 |
| 2021-07-01 | campfire | 8 |
| 2021-07-01 | vehicle | 4 |
| 2021-07-01 | debris burning | 8 |
| 2021-07-01 | arson | 3 |
| 2021-07-01 | Other | 3 |
| 2021-10-01 | lightning | 3 |
| 2021-10-01 | campfire | 11 |
| 2021-10-01 | vehicle | 3 |
| 2021-10-01 | debris burning | 5 |
| 2021-10-01 | arson | 1 |
| 2021-10-01 | Other | 9 |
| 2022-01-01 | lightning | 0 |
| 2022-01-01 | campfire | 1 |
| 2022-01-01 | vehicle | 0 |
| 2022-01-01 | debris burning | 3 |
| 2022-01-01 | arson | 0 |
| 2022-01-01 | Other | 1 |
| 2022-04-01 | lightning | 9 |
| 2022-04-01 | campfire | 7 |
| 2022-04-01 | vehicle | 2 |
| 2022-04-01 | debris burning | 2 |
| 2022-04-01 | arson | 0 |
| 2022-04-01 | Other | 1 |
| 2022-07-01 | lightning | 23 |
| 2022-07-01 | campfire | 7 |
| 2022-07-01 | vehicle | 8 |
| 2022-07-01 | debris burning | 5 |
| 2022-07-01 | arson | 6 |
| 2022-07-01 | Other | 3 |
| 2022-10-01 | lightning | 1 |
| 2022-10-01 | campfire | 7 |
| 2022-10-01 | vehicle | 3 |
| 2022-10-01 | debris burning | 5 |
| 2022-10-01 | arson | 3 |
| 2022-10-01 | Other | 9 |
| 2023-01-01 | lightning | 0 |
| 2023-01-01 | campfire | 1 |
| 2023-01-01 | vehicle | 0 |
| 2023-01-01 | debris burning | 2 |
| 2023-01-01 | arson | 2 |
| 2023-01-01 | Other | 0 |
| 2023-04-01 | lightning | 10 |
| 2023-04-01 | campfire | 4 |
| 2023-04-01 | vehicle | 4 |
| 2023-04-01 | debris burning | 2 |
| 2023-04-01 | arson | 4 |
| 2023-04-01 | Other | 7 |
| 2023-07-01 | lightning | 16 |
| 2023-07-01 | campfire | 9 |
| 2023-07-01 | vehicle | 6 |
| 2023-07-01 | debris burning | 4 |
| 2023-07-01 | arson | 10 |
| 2023-07-01 | Other | 3 |
| 2023-10-01 | lightning | 1 |
| 2023-10-01 | campfire | 9 |
| 2023-10-01 | vehicle | 6 |
| 2023-10-01 | debris burning | 2 |
| 2023-10-01 | arson | 5 |
| 2023-10-01 | Other | 11 |
| 2024-01-01 | lightning | 1 |
| 2024-01-01 | campfire | 0 |
| 2024-01-01 | vehicle | 1 |
| 2024-01-01 | debris burning | 0 |
| 2024-01-01 | arson | 0 |
| 2024-01-01 | Other | 2 |
| 2024-04-01 | lightning | 6 |
| 2024-04-01 | campfire | 6 |
| 2024-04-01 | vehicle | 6 |
| 2024-04-01 | debris burning | 3 |
| 2024-04-01 | arson | 3 |
| 2024-04-01 | Other | 12 |
| 2024-07-01 | lightning | 14 |
| 2024-07-01 | campfire | 17 |
| 2024-07-01 | vehicle | 4 |
| 2024-07-01 | debris burning | 5 |
| 2024-07-01 | arson | 5 |
| 2024-07-01 | Other | 3 |
| 2024-10-01 | lightning | 4 |
| 2024-10-01 | campfire | 6 |
| 2024-10-01 | vehicle | 1 |
| 2024-10-01 | debris burning | 6 |
| 2024-10-01 | arson | 2 |
| 2024-10-01 | Other | 13 |
| 2025-01-01 | lightning | 1 |
| 2025-01-01 | campfire | 1 |
| 2025-01-01 | vehicle | 0 |
| 2025-01-01 | debris burning | 1 |
| 2025-01-01 | arson | 2 |
| 2025-01-01 | Other | 2 |
| 2025-04-01 | lightning | 10 |
| 2025-04-01 | campfire | 7 |
| 2025-04-01 | vehicle | 6 |
| 2025-04-01 | debris burning | 3 |
| 2025-04-01 | arson | 3 |
| 2025-04-01 | Other | 6 |
| 2025-07-01 | lightning | 27 |
| 2025-07-01 | campfire | 10 |
| 2025-07-01 | vehicle | 7 |
| 2025-07-01 | debris burning | 5 |
| 2025-07-01 | arson | 6 |
| 2025-07-01 | Other | 6 |
| 2025-10-01 | lightning | 4 |
| 2025-10-01 | campfire | 4 |
| 2025-10-01 | vehicle | 5 |
| 2025-10-01 | debris burning | 1 |
| 2025-10-01 | arson | 2 |
| 2025-10-01 | Other | 8 |
| 2026-01-01 | lightning | 0 |
| 2026-01-01 | campfire | 0 |
| 2026-01-01 | vehicle | 2 |
| 2026-01-01 | debris burning | 0 |
| 2026-01-01 | arson | 0 |
| 2026-01-01 | Other | 0 |
| 2026-04-01 | lightning | 2 |
| 2026-04-01 | campfire | 6 |
| 2026-04-01 | vehicle | 3 |
| 2026-04-01 | debris burning | 5 |
| 2026-04-01 | arson | 0 |
| 2026-04-01 | Other | 4 |
| 2026-07-01 | lightning | 16 |
| 2026-07-01 | campfire | 11 |
| 2026-07-01 | vehicle | 11 |
| 2026-07-01 | debris burning | 6 |
| 2026-07-01 | arson | 6 |
| 2026-07-01 | Other | 7 |
Figure 42. Hot spot analysis: Fuel treatments over time 96
| period | series | value |
|---|---|---|
| 2019-04-01 | not_significant | 1 |
| 2019-04-01 | cold_90 | 0 |
| 2019-07-01 | not_significant | 0 |
| 2019-07-01 | cold_90 | 0 |
| 2019-10-01 | not_significant | 0 |
| 2019-10-01 | cold_90 | 0 |
| 2020-01-01 | not_significant | 1 |
| 2020-01-01 | cold_90 | 0 |
| 2020-04-01 | not_significant | 1 |
| 2020-04-01 | cold_90 | 0 |
| 2020-07-01 | not_significant | 0 |
| 2020-07-01 | cold_90 | 0 |
| 2020-10-01 | not_significant | 0 |
| 2020-10-01 | cold_90 | 0 |
| 2021-01-01 | not_significant | 0 |
| 2021-01-01 | cold_90 | 0 |
| 2021-04-01 | not_significant | 0 |
| 2021-04-01 | cold_90 | 0 |
| 2021-07-01 | not_significant | 2 |
| 2021-07-01 | cold_90 | 0 |
| 2021-10-01 | not_significant | 0 |
| 2021-10-01 | cold_90 | 0 |
| 2022-01-01 | not_significant | 0 |
| 2022-01-01 | cold_90 | 0 |
| 2022-04-01 | not_significant | 1 |
| 2022-04-01 | cold_90 | 0 |
| 2022-07-01 | not_significant | 0 |
| 2022-07-01 | cold_90 | 0 |
| 2022-10-01 | not_significant | 1 |
| 2022-10-01 | cold_90 | 0 |
| 2023-01-01 | not_significant | 1 |
| 2023-01-01 | cold_90 | 0 |
| 2023-04-01 | not_significant | 1 |
| 2023-04-01 | cold_90 | 0 |
| 2023-07-01 | not_significant | 0 |
| 2023-07-01 | cold_90 | 0 |
| 2023-10-01 | not_significant | 0 |
| 2023-10-01 | cold_90 | 0 |
| 2024-01-01 | not_significant | 0 |
| 2024-01-01 | cold_90 | 0 |
| 2024-04-01 | not_significant | 1 |
| 2024-04-01 | cold_90 | 0 |
| 2024-07-01 | not_significant | 0 |
| 2024-07-01 | cold_90 | 0 |
| 2024-10-01 | not_significant | 1 |
| 2024-10-01 | cold_90 | 0 |
| 2025-01-01 | not_significant | 0 |
| 2025-01-01 | cold_90 | 1 |
Figure 43. Hot spot analysis: Fire perimeters over time 97
| period | series | value |
|---|---|---|
| 2017-07-01 | equipment | 1 |
| 2017-07-01 | human | 0 |
| 2017-07-01 | lightning | 0 |
| 2017-10-01 | equipment | 0 |
| 2017-10-01 | human | 0 |
| 2017-10-01 | lightning | 0 |
| 2018-01-01 | equipment | 0 |
| 2018-01-01 | human | 0 |
| 2018-01-01 | lightning | 0 |
| 2018-04-01 | equipment | 0 |
| 2018-04-01 | human | 0 |
| 2018-04-01 | lightning | 0 |
| 2018-07-01 | equipment | 0 |
| 2018-07-01 | human | 1 |
| 2018-07-01 | lightning | 0 |
| 2018-10-01 | equipment | 0 |
| 2018-10-01 | human | 0 |
| 2018-10-01 | lightning | 0 |
| 2019-01-01 | equipment | 0 |
| 2019-01-01 | human | 0 |
| 2019-01-01 | lightning | 0 |
| 2019-04-01 | equipment | 0 |
| 2019-04-01 | human | 0 |
| 2019-04-01 | lightning | 0 |
| 2019-07-01 | equipment | 0 |
| 2019-07-01 | human | 0 |
| 2019-07-01 | lightning | 1 |
| 2019-10-01 | equipment | 0 |
| 2019-10-01 | human | 0 |
| 2019-10-01 | lightning | 0 |
| 2020-01-01 | equipment | 0 |
| 2020-01-01 | human | 0 |
| 2020-01-01 | lightning | 0 |
| 2020-04-01 | equipment | 0 |
| 2020-04-01 | human | 0 |
| 2020-04-01 | lightning | 0 |
| 2020-07-01 | equipment | 1 |
| 2020-07-01 | human | 0 |
| 2020-07-01 | lightning | 0 |
| 2020-10-01 | equipment | 0 |
| 2020-10-01 | human | 0 |
| 2020-10-01 | lightning | 0 |
| 2021-01-01 | equipment | 0 |
| 2021-01-01 | human | 0 |
| 2021-01-01 | lightning | 0 |
| 2021-04-01 | equipment | 0 |
| 2021-04-01 | human | 0 |
| 2021-04-01 | lightning | 0 |
| 2021-07-01 | equipment | 1 |
| 2021-07-01 | human | 0 |
| 2021-07-01 | lightning | 0 |
| 2021-10-01 | equipment | 0 |
| 2021-10-01 | human | 0 |
| 2021-10-01 | lightning | 0 |
| 2022-01-01 | equipment | 0 |
| 2022-01-01 | human | 0 |
| 2022-01-01 | lightning | 0 |
| 2022-04-01 | equipment | 0 |
| 2022-04-01 | human | 0 |
| 2022-04-01 | lightning | 0 |
| 2022-07-01 | equipment | 0 |
| 2022-07-01 | human | 1 |
| 2022-07-01 | lightning | 0 |
| 2022-10-01 | equipment | 0 |
| 2022-10-01 | human | 0 |
| 2022-10-01 | lightning | 0 |
| 2023-01-01 | equipment | 0 |
| 2023-01-01 | human | 0 |
| 2023-01-01 | lightning | 0 |
| 2023-04-01 | equipment | 0 |
| 2023-04-01 | human | 0 |
| 2023-04-01 | lightning | 0 |
| 2023-07-01 | equipment | 0 |
| 2023-07-01 | human | 1 |
| 2023-07-01 | lightning | 0 |
| 2023-10-01 | equipment | 0 |
| 2023-10-01 | human | 0 |
| 2023-10-01 | lightning | 0 |
| 2024-01-01 | equipment | 0 |
| 2024-01-01 | human | 0 |
| 2024-01-01 | lightning | 0 |
| 2024-04-01 | equipment | 0 |
| 2024-04-01 | human | 0 |
| 2024-04-01 | lightning | 0 |
| 2024-07-01 | equipment | 1 |
| 2024-07-01 | human | 0 |
| 2024-07-01 | lightning | 0 |
| 2024-10-01 | equipment | 0 |
| 2024-10-01 | human | 0 |
| 2024-10-01 | lightning | 0 |
| 2025-01-01 | equipment | 0 |
| 2025-01-01 | human | 0 |
| 2025-01-01 | lightning | 0 |
| 2025-04-01 | equipment | 0 |
| 2025-04-01 | human | 0 |
| 2025-04-01 | lightning | 0 |
| 2025-07-01 | equipment | 1 |
| 2025-07-01 | human | 0 |
| 2025-07-01 | lightning | 0 |
| 2025-10-01 | equipment | 0 |
| 2025-10-01 | human | 0 |
| 2025-10-01 | lightning | 0 |
| 2026-01-01 | equipment | 0 |
| 2026-01-01 | human | 0 |
| 2026-01-01 | lightning | 0 |
| 2026-04-01 | equipment | 0 |
| 2026-04-01 | human | 0 |
| 2026-04-01 | lightning | 0 |
| 2026-07-01 | equipment | 1 |
| 2026-07-01 | human | 0 |
| 2026-07-01 | lightning | 0 |
GeoBit Large Spatial Model. Findings are labeled Evidenced (computed by a tool), Inferred (a reading or reasoning) or Unverified (no evidence yet).