Pour points
tr_pour_points
What it does
Snap given pour points to the strongest flow nearby, or find candidate outlets or confluences ranked by catchment.
Like Snap Pour Point (Spatial Analyst) in ArcGIS Pro and GRASS r.water.outlet in QGIS. Run by the product's terrain engine on 30 m cells from Copernicus DEM GLO-30 (full resolution): 740 x 930 = 688,200 cells; no model was called.
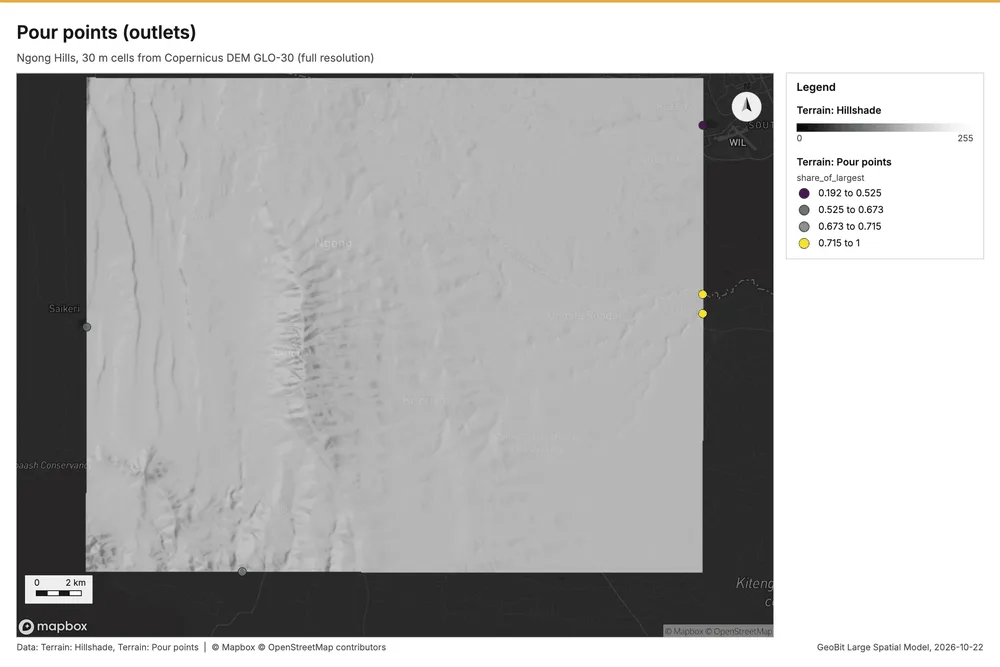
Pour points (outlets)
Pour points: found 5 candidate outlets draining at least 6.194 km2.
Parameters
| Parameter | Value |
|---|---|
| cell_size_m | 30 |
Numbers
| Measure | Value |
|---|---|
| count | 5 |
| backend | pure |
| min_catchment_m2 | 6,193,800 |
| dem.rows | 740 |
| dem.cols | 930 |
| dem.cell_m | 30 |
| dem.crs | EPSG:32737 |
| dem.missing_frac | 0 |
| dem.elev_min_m | 1,562 |
| dem.elev_max_m | 2,456 |
| dem.elev_mean_m | 1,824 |
| dem.relief_m | 894.3 |
| dem_source.kind | copernicus |
| dem_source.native_res_m | 30.91 |
| dem_source.crs | EPSG:4326 |
| dem_source.dataset | Copernicus DEM GLO-30 |
Notes
- DEM: Copernicus DEM GLO-30 (open data; cached). Copernicus DEM GLO-30: produced using Copernicus WorldDEM-30 (c) DLR e.V. 2010-2014 and (c) Airbus Defence and Space GmbH 2014-2018 provided under COPERNICUS by the European Union and ESA
- the grid (30 m) is finer than the DEM (30.9 m): values between DEM samples are interpolated
Layers
Files
| Layer | Made by | Kind | Features | File |
|---|---|---|---|---|
| Terrain: Pour points | tr_pour_points | points | 5 | GeoJSON 2 KB |