Elevation profile
tr_profile
What it does
Elevation along a line: samples, gain and loss, grades and extremes.
Like Stack Profile (3D Analyst) / Profile graph in ArcGIS Pro and Elevation Profile (QGIS 3.26+) in QGIS. Run by the product's terrain engine on 30 m cells from Copernicus DEM GLO-30 (full resolution): 740 x 930 = 688,200 cells; no model was called.
Charts
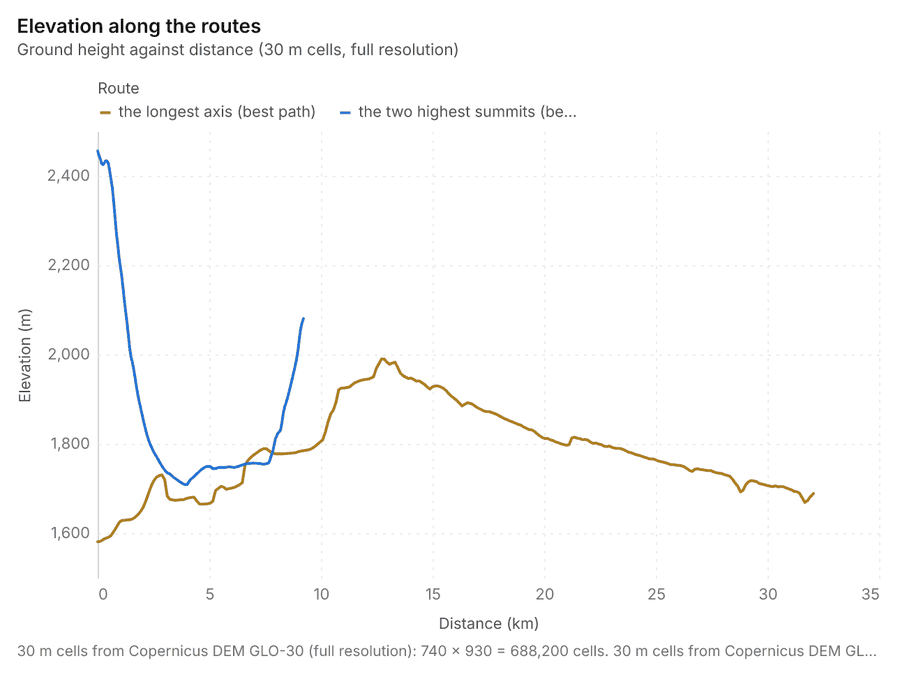
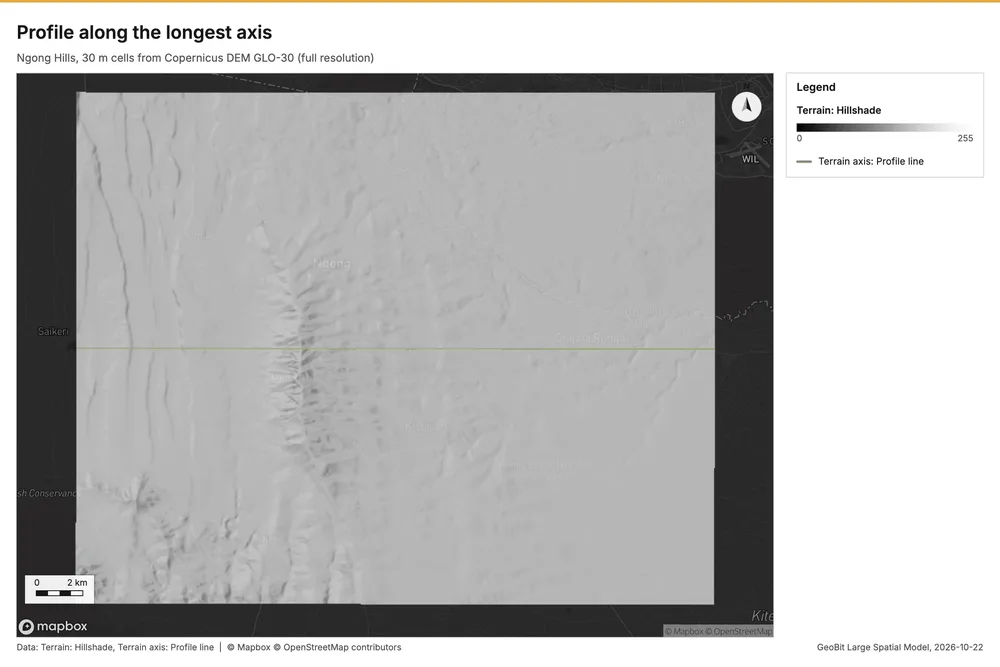
Profile along the longest axis
Profile of 27810 m: 1580.9 to 2371.5 m, gain 1107 m, loss 999 m, steepest grade 85.78%.
Parameters
| Parameter | Value |
|---|---|
| cell_size_m | 30 |
| line | auto:axis (the entry points of the area's longest axis) |
Numbers
| Measure | Value |
|---|---|
| length_m | 2.781e+04 |
| samples | 928 |
| step_m | 30 |
| gain_m | 1,107 |
| loss_m | 998.8 |
| missing_samples | 0 |
| min_m | 1,581 |
| max_m | 2,372 |
| min_at_m | 0 |
| max_at_m | 9,780 |
| max_grade_pct | 85.78 |
| mean_grade_pct | 7.57 |
| dem.rows | 740 |
| dem.cols | 930 |
| dem.cell_m | 30 |
| dem.crs | EPSG:32737 |
| dem.missing_frac | 0 |
| dem.elev_min_m | 1,562 |
| dem.elev_max_m | 2,456 |
| dem.elev_mean_m | 1,824 |
| dem.relief_m | 894.3 |
| dem_source.kind | copernicus |
| dem_source.native_res_m | 30.91 |
| dem_source.crs | EPSG:4326 |
| dem_source.dataset | Copernicus DEM GLO-30 |
Notes
- DEM: Copernicus DEM GLO-30 (open data; cached). Copernicus DEM GLO-30: produced using Copernicus WorldDEM-30 (c) DLR e.V. 2010-2014 and (c) Airbus Defence and Space GmbH 2014-2018 provided under COPERNICUS by the European Union and ESA
- line: the entry points of the area's longest axis, 36.55010, -1.40000 and 36.79989, -1.40025
- the grid (30 m) is finer than the DEM (30.9 m): values between DEM samples are interpolated
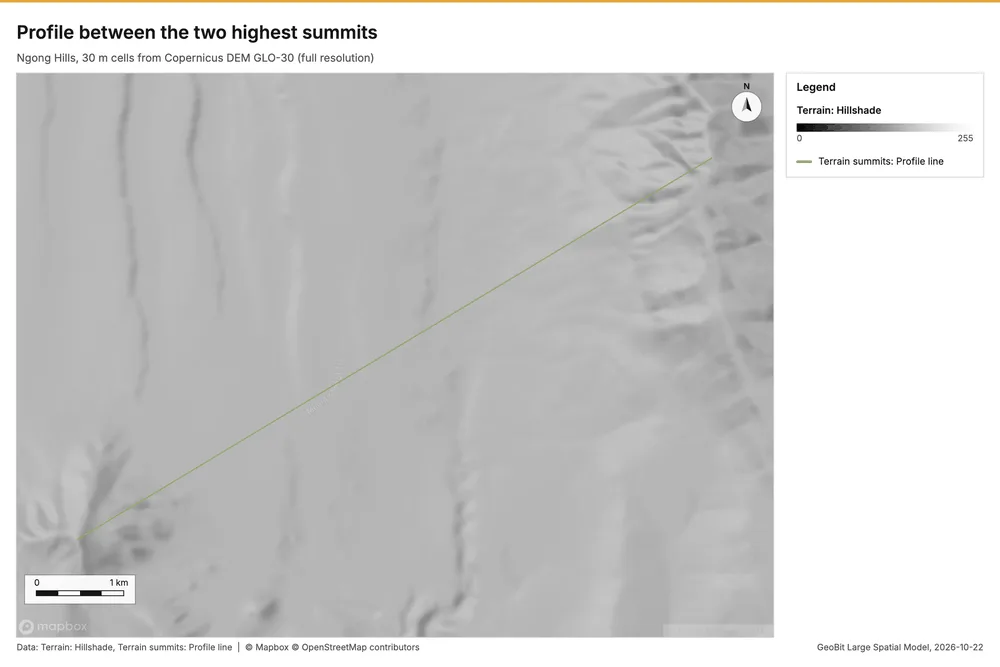
Profile between the two highest summits
Profile of 8530 m: 1711.08 to 2455.93 m, gain 408 m, loss 784 m, steepest grade 75.78%.
Parameters
| Parameter | Value |
|---|---|
| cell_size_m | 30 |
| line | auto:heights (the two highest summits) |
Numbers
| Measure | Value |
|---|---|
| length_m | 8,530 |
| samples | 286 |
| step_m | 29.93 |
| gain_m | 408.3 |
| loss_m | 783.7 |
| missing_samples | 0 |
| min_m | 1,711 |
| max_m | 2,456 |
| min_at_m | 3,682 |
| max_at_m | 0 |
| max_grade_pct | 75.78 |
| mean_grade_pct | 13.97 |
| dem.rows | 740 |
| dem.cols | 930 |
| dem.cell_m | 30 |
| dem.crs | EPSG:32737 |
| dem.missing_frac | 0 |
| dem.elev_min_m | 1,562 |
| dem.elev_max_m | 2,456 |
| dem.elev_mean_m | 1,824 |
| dem.relief_m | 894.3 |
| dem_source.kind | copernicus |
| dem_source.native_res_m | 30.91 |
| dem_source.crs | EPSG:4326 |
| dem_source.dataset | Copernicus DEM GLO-30 |
Notes
- DEM: Copernicus DEM GLO-30 (open data; cached). Copernicus DEM GLO-30: produced using Copernicus WorldDEM-30 (c) DLR e.V. 2010-2014 and (c) Airbus Defence and Space GmbH 2014-2018 provided under COPERNICUS by the European Union and ESA
- line: between DH-1 (2,456 m) and DH-2 (2,080 m)
- the grid (30 m) is finer than the DEM (30.9 m): values between DEM samples are interpolated